Applichem cost and analysis - MIT OpenCourseWare · Applichem cost and analysis. Volume DL/lb...
21
Applichem cost and analysis
Transcript of Applichem cost and analysis - MIT OpenCourseWare · Applichem cost and analysis. Volume DL/lb...
Applichem cost and analysis

Volume DL/lb Indir/lb Tot lab/lb yield A cost wo pack
Mexico 17.2 1.1 1.4 2.6 94.7 92.63
Canada 2.6 4.7 6.0 10.7 91.1 93.25
Venezuala 4.1 3.1 2.7 5.8 91.7 112.31
Frankfurt 38.0 1.2 1.1 2.3 98.9 73.34
Gary 14.0 1.7 2.5 4.2 90.4 89.15
Sunchem 4.0 3.6 4.2 7.8 98.8 149.24
Labor, yield and cost data

0.0
0.5
1.0
1.5
2.0
2.5
3.0
3.5
4.0
4.5
5.0
0.0 10.0 20.0 30.0 40.0
Dir
ec
t la
bo
r
Volume
Unit Direct labor vs volume
Series1

Unit Indir labor vs volume
0.0
1.0
2.0
3.0
4.0
5.0
6.0
7.0
0.0 10.0 20.0 30.0 40.0
volume
ind
irect
lab
or
Series1
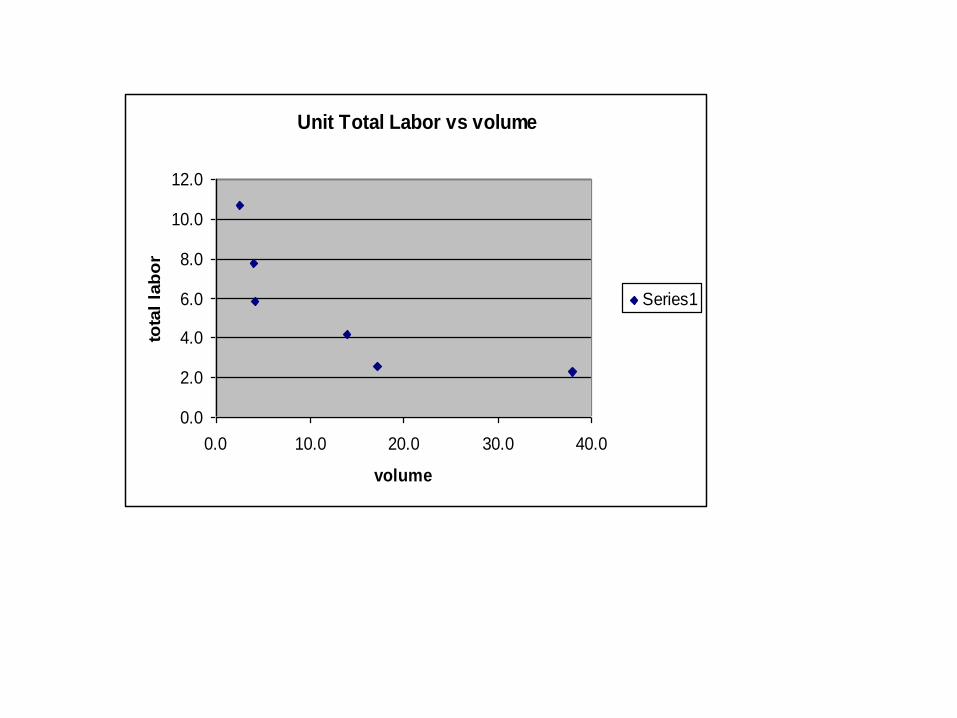
Unit Total Labor vs volume
0.0
2.0
4.0
6.0
8.0
10.0
12.0
0.0 10.0 20.0 30.0 40.0
volume
tota
l la
bo
r
Series1

Yield versus volume
89
9091
92
93
9495
96
97
9899
100
0.0 10.0 20.0 30.0 40.0
volume
yie
ld
Series1

Cumulative cost wo pack vs vol
0
500
1000
1500
2000
2500
3000
0.0 10.0 20.0 30.0 40.0
volume
cu
m c
ost
Series1

Cumulative Total labor vs vol
0
10
20
30
40
50
60
70
80
90
100
0.0 10.0 20.0 30.0 40.0
volume
To
tal
cu
mu
lati
ve l
ab
or
Series1
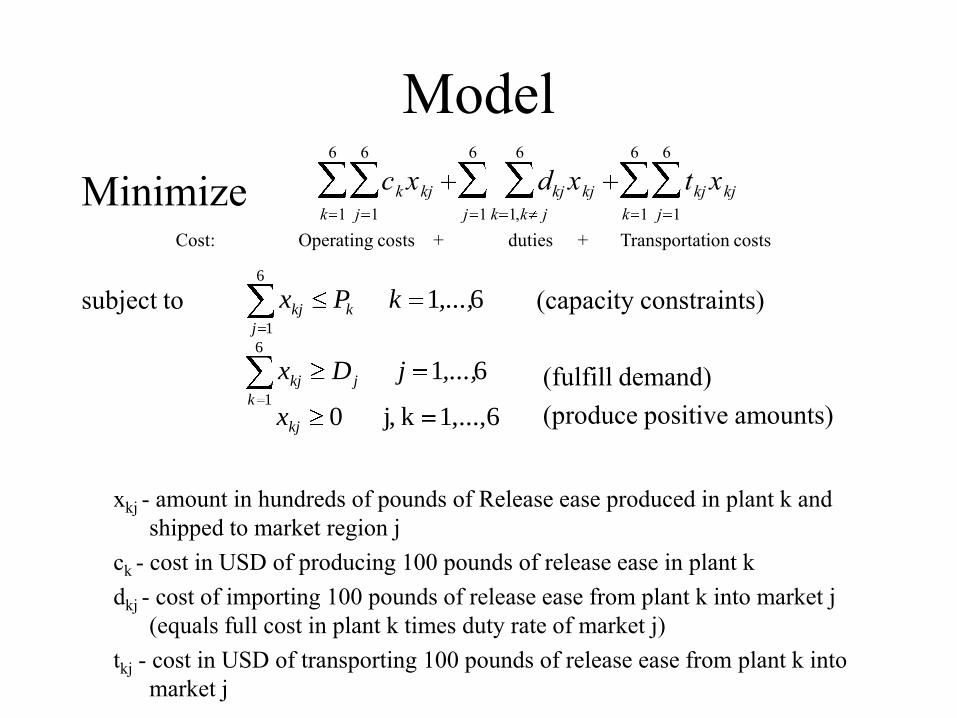
ModelMinimize
subject to (capacity constraints)
(fulfill demand)(produce positive amounts)
61 6
1
,...,kPxj
kkj
61 6
1
,...,jDxk
jkj
1,...,6kj, 0kjx
ckxkjj 1
6
k 1
6
dkjxkjk 1,k j
6
j 1
6
tkjxkjj 1
6
k 1
6
+ Transportation costsdutiesOperating costs +Cost:
xkj - amount in hundreds of pounds of Release ease produced in plant k and shipped to market region j
ck - cost in USD of producing 100 pounds of release ease in plant kdkj - cost of importing 100 pounds of release ease from plant k into market j
(equals full cost in plant k times duty rate of market j)tkj - cost in USD of transporting 100 pounds of release ease from plant k into
market j

Modeling operating costs
• Consider 3 alternatives for variable costs1. Use all the information provided as manufacturing costs 2. Use only: Raw material costs +
Direct labor, salary, and fringes +1/2 utilities cost
3. Same as two but no duties• Assume breakdown for NA market (26.4 US, 2.6 Canada, 3.0
Mexico)

Alternative 1:Consider all manufacturing costs
• Total Costs in USD per hundred pound of product
• Output from the model (hundreds of pounds)
Mexico Canada Venezuela Frankfurt Gary Sunchem
Mexico 95 106 150 115 110 115
Canada 167 97 155 118 108 116
Venezuela 193 126 116 140 132 138
Frankfurt 133 88 128 77 91 95
Gary 175 109 165 123 103 122
Sunchem 260 167 243 183 174 154
Prod
uce
Send to market
Prod
uce
Send to marketMexico Canada Venezuela Frankfurt Gary Sunchem Cap. Used
Mexico 30000 0 0 0 32000 0 28%
Canada 0 26000 0 0 11000 0 100%
Venezuela 0 0 45000 0 0 0 100%
Frankfurt 0 0 115000 200000 36000 119000 100%
Gary 0 0 0 0 185000 0 100%
Sunchem 0 0 0 0 0 0 0%

Alternative 2: Consider only Raw material, Direct labor, .5 utilities
• Total Costs in USD per hundred pound of product
• Output from the model (hundreds of pounds)
Prod
uce
Send to market
Prod
uce
Send to market
Mexico Canada Venezuela Frankfurt Gary Sunchem
Mexico 80 91 134 100 95 100
Canada 148 78 136 99 89 97
Venezuela 172 105 95 119 111 116
Frankfurt 118 73 112 62 76 79
Gary 144 78 134 92 72 91
Sunchem 216 123 199 139 130 110
Mexico Canada Venezuela Frankfurt Gary Sunchem Cap. Used
Mexico 30000 0 0 0 32000 0 28%
Canada 0 26000 0 0 11000 0 100%
Venezuela 0 0 45000 0 0 0 100%
Frankfurt 0 0 115000 200000 36000 119000 100%
Gary 0 0 0 0 185000 0 100%
Sunchem 0 0 0 0 0 0 0%
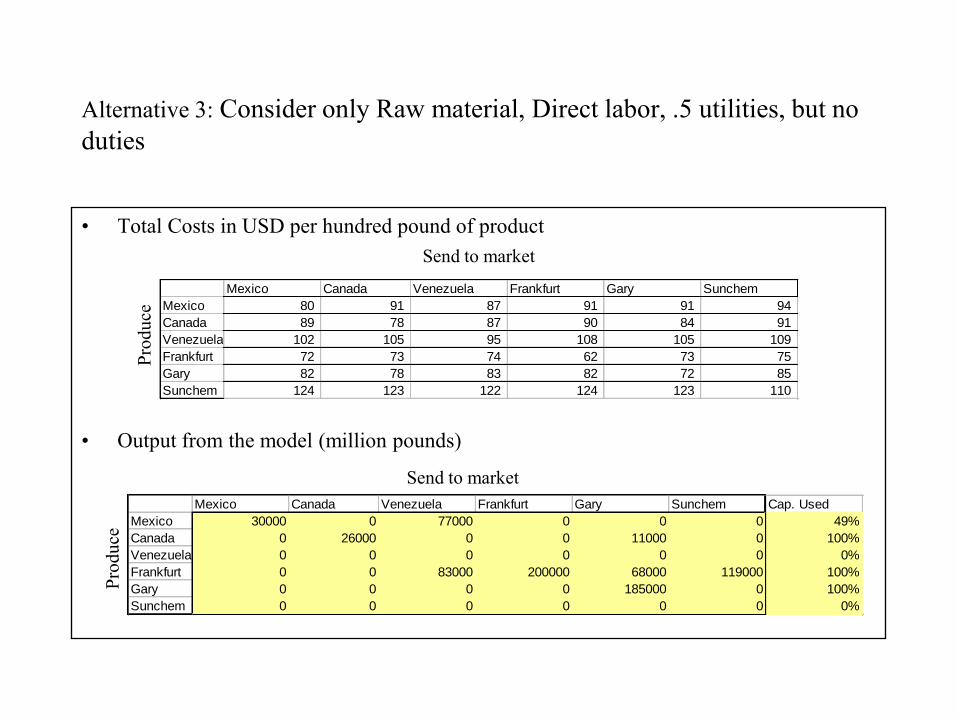
Alternative 3: Consider only Raw material, Direct labor, .5 utilities, but no duties
• Total Costs in USD per hundred pound of product
• Output from the model (million pounds)
Prod
uce
Send to market
Prod
uce
Send to market
Mexico Canada Venezuela Frankfurt Gary Sunchem
Mexico 80 91 87 91 91 94
Canada 89 78 87 90 84 91
Venezuela 102 105 95 108 105 109
Frankfurt 72 73 74 62 73 75
Gary 82 78 83 82 72 85
Sunchem 124 123 122 124 123 110
Mexico Canada Venezuela Frankfurt Gary Sunchem Cap. Used
Mexico 30000 0 77000 0 0 0 49%
Canada 0 26000 0 0 11000 0 100%
Venezuela 0 0 0 0 0 0 0%
Frankfurt 0 0 83000 200000 68000 119000 100%
Gary 0 0 0 0 185000 0 100%
Sunchem 0 0 0 0 0 0 0%

Alternative 1: All manufacturing costs
Image by MIT OpenCourseWare.

Correlation
Mexico Canada Venezuela Frankfurt Sunchem
Mexico 1
Canada 0.32 1.00
Venezuela -0.83 -0.53 1.00
Frankfurt 0.56 0.59 -0.85 1.00
Sunchem 0.59 0.18 -0.48 0.63 1
Changes withexchange ratescenarios
Real Foreign Exchange Year Variations
-28.2%
5.9%
40.0%
Year
Mexico
Canada
Venezuela
Frankfurt
Gary
Sunchem
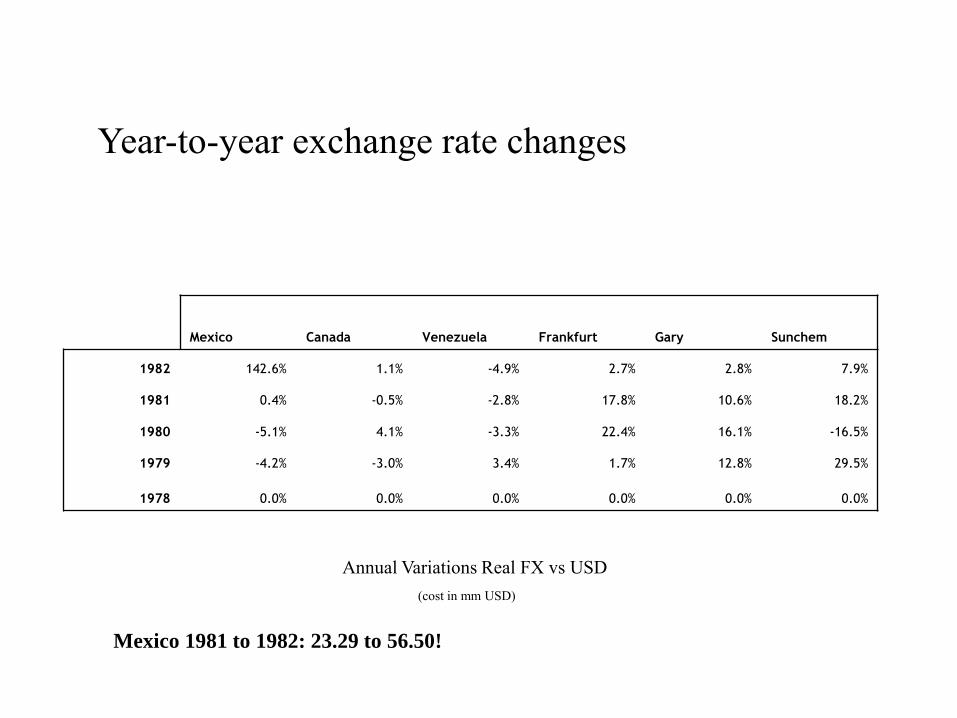
Year-to-year exchange rate changes
Annual Variations Real FX vs USD(cost in mm USD)
Mexico Canada Venezuela Frankfurt Gary Sunchem
1982 142.6% 1.1% -4.9% 2.7% 2.8% 7.9%
1981 0.4% -0.5% -2.8% 17.8% 10.6% 18.2%
1980 -5.1% 4.1% -3.3% 22.4% 16.1% -16.5%
1979 -4.2% -3.0% 3.4% 1.7% 12.8% 29.5%
1978 0.0% 0.0% 0.0% 0.0% 0.0% 0.0%
Mexico 1981 to 1982: 23.29 to 56.50!

Impact of exchange rates on allocations and costs: Assume costs changes similar to years following (eg 81 to 82)
Base case is 78.92. Assume 35% of materials and other costs vary
Base Scenario 1 Scenario 2 Scenario 3 Scenario 4 Scenario 5
Expected Costs 78.92 72.33 69.39 66.63 66.58 68.03
Utilization
Mexico 28% 100% 100% 100% 100% 100%
Canada 100% 70% 70% 70% 70% 70%
Venezuela 100% 100% 100% 100% 100% 100%
Frankfurt 100% 100% 100% 100% 100% 100%
Gary 100% 21% 21% 21% 21% 21%
Sunchem 0% 0% 0% 0% 0% 0%

Impact of exchange rates on allocations and costs: Assume costs changes similar to preceding years (eg 82 to 81)
Base Scenario 6 Scenario 7 Scenario 8 Scenario 9 Scenario 10
Expected Costs 78.92 81.13 84.38 87.71 87.96 86.79
Utilization
Mexico 28% 28% 28% 28% 28% 28%
Canada 100% 100% 100% 100% 100% 100%
Venezuela 100% 100% 100% 100% 100% 100%
Frankfurt 100% 100% 100% 100% 100% 100%
Gary 100% 100% 100% 100% 100% 100%
Sunchem 0% 0% 0% 0% 0% 0%

Courtesy of Arnd Huchzermeier. Used with permission.

Some summary points• Strategy issues
– Scale and cost issues– Local issues (production, presence)– Plant roles– Flexibility– Technology transfer
• Analysis issues– Use of measures (plant and system)– Role of fixed costs– Optimization or allocation analysis– Analyzing flexibility (e.g. scenario generation)
MIT OpenCourseWarehttp://ocw.mit.edu
15.769 Operations Strategy
Fall 2010
For information about citing these materials or our Terms of Use, visit: http://ocw.mit.edu/terms.


![Placement Test for Singapore Primary Mathematics 6A · (b) 89.5 ÷ 31 [4] 7. The total cost of 4 lb of fish and 3 lb of meat is $42.40. If 1 lb of fish co sts $3.25 more than 1 lb](https://static.fdocuments.net/doc/165x107/5ec1087285c6974fc07789c0/placement-test-for-singapore-primary-mathematics-6a-b-895-31-4-7-the-total.jpg)