APPLICATIONS OF THE RE-OS ISOTOPIC SYSTEM IN THE STUDY OF MINERAL DEPOSITS
212
APPLICATIONS OF THE RE-OS ISOTOPIC SYSTEM IN THE STUDY OF MINERAL DEPOSITS: GEOCHRONOLOGY AND SOURCE OF METALS Item Type text; Electronic Dissertation Authors Barra-Pantoja, Luis Fernando Publisher The University of Arizona. Rights Copyright © is held by the author. Digital access to this material is made possible by the University Libraries, University of Arizona. Further transmission, reproduction or presentation (such as public display or performance) of protected items is prohibited except with permission of the author. Download date 26/12/2021 01:19:08 Link to Item http://hdl.handle.net/10150/193953
Transcript of APPLICATIONS OF THE RE-OS ISOTOPIC SYSTEM IN THE STUDY OF MINERAL DEPOSITS

APPLICATIONS OF THE RE-OS ISOTOPICSYSTEM IN THE STUDY OF MINERAL DEPOSITS:
GEOCHRONOLOGY AND SOURCE OF METALS
Item Type text; Electronic Dissertation
Authors Barra-Pantoja, Luis Fernando
Publisher The University of Arizona.
Rights Copyright © is held by the author. Digital access to this materialis made possible by the University Libraries, University of Arizona.Further transmission, reproduction or presentation (such aspublic display or performance) of protected items is prohibitedexcept with permission of the author.
Download date 26/12/2021 01:19:08
Link to Item http://hdl.handle.net/10150/193953

APPLICATIONS OF THE RE-OS ISOTOPIC SYSTEM IN THE STUDY OF
MINERAL DEPOSITS: GEOCHRONOLOGY AND SOURCE OF METALS
by
Luis Fernando Barra Pantoja
_________________________ Copyright Luis Fernando Barra-Pantoja 2005
A Dissertation Submitted to the Faculty of the
Department of Geosciences
In Partial Fulfillment of the Requirements
For the Degree of
DOCTOR OF PHILOSOPHY
In the Graduate College
THE UNIVERSITY OF ARIZONA
2 0 0 5

2
THE UNIVERSITY OF ARIZONA GRADUATE COLLEGE
As members of the Dissertation Committee, we certify that we have read the dissertation prepared by Luis Fernando Barra Pantoja entitled APPLICATIONS OF THE Re-Os ISTOPIC SYSTEM IN THE STUDY OF
MINERAL DEPOSITS: GEOCHRONOLOGY AND SOURCE OF METALS
and recommend that it be accepted as fulfilling the dissertation requirement for the
Degree of Doctor of Philosophy _______________________________________________ Date:_April 12th, 2005_ Dr. Joaquin Ruiz ________________________________________________ Date:_April 12th, 2005_ Dr. Spencer R. Titley ________________________________________________ Date:_April 12th, 2005_ Dr. Jonathan Patchett ________________________________________________ Date:_April 12th, 2005_ Dr. Timothy Swindle ________________________________________________ Date:_April 12th, 2005_ Dr. Christopher Eastoe Final approval and acceptance of this dissertation is contingent upon the candidate’s submission of the final copies of the dissertation to the Graduate College. I hereby certify that I have read this dissertation prepared under my direction and recommend that it be accepted as fulfilling the dissertation requirement. _______________________________________________ Date:_April 12th, 2005_ Dissertation Director: Dr. Joaquin Ruiz

3
STATEMENT BY AUTHOR
This dissertation has been submitted in partial fulfillment of requirements for an advanced degree at The University of Arizona and is deposited in the University Library to be made available to borrowers under the rules of the Library.
Brief quotations from this dissertation are allowable without special permission, provided that accurate acknowledgment of source is made. Request for permission for extended quotation from or reproduction of this manuscript in whole or in part may be granted by the copyright holder.
SIGNED: _Luis Fernando Barra-Pantoja________________

ACKNOWLEDGMENTS
There are several people that I would like to thank and that have made this research
possible. I would first like to thank Dr.Joaquin Ruiz for his constant support and for
giving me the opportunity to come to the University of Arizona. His assistance in
reviewing the articles and most importantly financial support are greatly appreciated. I
would also like to thank the members of my committee, not only for reviewing and
making several useful comments on my dissertation, but also for expanding my
knowledge on a wide variety of geological issues. It has been a previlege to be part of
several courses dictated by Dr. Spencer Titley and Dr. Jonathan Patchett. I would like to
thank Dr. Timothy Swindle for giving the opportunity to work with lunar samples and
learn more about the 40Ar-39Ar dating method, and Dr. Christopher Eastoe for teaching
me the procedure for stable isotopes analysis. Special thanks go to the members of the
Ruiz Group: Dr. John Chesley, for his patience in teaching me the use of the mass
spectrometer and reviewing this dissertation; Dr. Mark Baker, for providing all the
necessary materials for Re-Os chemistry; former graduate students Ryan Mathur and
Jason Kirk for several insightful discussions of the Re-Os system and data interpretation;
current graduate student Rafael del Rio and my friend Dr. Victor Valencia for providing
interesting discussions on mineral deposits and the geology of Mexico.
I thank the Department of Geosciences for financial support through several Teaching
Assistantships, Dr. David Lowell for providing funds for the Lowell Fellowship for a
hispanic graduate student involved in the study of ore deposits, and the Wesley Pierce
Scholarship for finacial support during the summer of 2000.
I am deeply grateful to my wife Veronica, my two daughters Maria and Francisca, and
my mother, for their constant support, encouragement, love and care during this
important stage of my life.
4

5
DEDICATION
A mi esposa Veronica, a mis hijas Maria Jose y Francisca, y a mi madre

6
TABLE OF CONTENTS LIST OF FIGURES .........................................................................................................7 LIST OF TABLES...........................................................................................................11 ABSTRACT.....................................................................................................................12 CHAPTER 1 INTRODUCTION TO THE RHENIUM – OSMIUM ISOTOPIC SYSTEM..........................................................................................................................14 1.1 The Rhenium (Re) and Osmium (Os) elements.............................................14 1.2 Re-Os isotopic systematics ............................................................................15 1.3 Distribution and behavior of Re and Os in the mantle and crust ...................17 1.4 Analytical techniques.....................................................................................18 CHAPTER 2 INTRODUCTION TO THE PRESENT STUDY .....................................20 REFERENCES ................................................................................................................26 APPENDIX A THE APPLICATION OF THE RE-OS ISOTOPIC SYSTEM TO THE STUDY OF MINERAL DEPOSITS: PART I: IMPLICATIONS FOR THE AGE AND SOURCE OF METALS IN MINERAL DEPOSITS....................................34
APPENDIX B THE APPLICATION OF THE RE-OS ISOTOPIC SYSTEM TO THE STUDY OF MINERAL DEPOSITS: PART 2: A CRITICAL REVIEW OF THE RE-OS MOLYBDENITE GEOCHRONOMETER................................................70
APPENDIX C MULTI-STAGE AND LONG-LIVED MINERALIZATION IN THE ZAMBIAN COPPERBELT: EVIDENCE FROM RE-OS GEOCHRONOLOGY .....................................................................................................124
APPENDIX D CRUSTAL CONTAMINATION IN THE PLATREEF, BUSHVELD COMPLEX, SOUTH AFRICA: CONTRAINTS FROM RE-OS SYSTEMATICS ON PGE-BEARING SULFIDES ........................................................147
APPENDIX E LARAMIDE PORPHYRY CU-MO MINERALIZATION IN NORTHERN MEXICO: AGE CONSTRAINTS FROM RE-OS GEOCHRONOLOGY IN MOLYBDENITES ................................................................171

7
LIST OF FIGURES
Figure A1. Location of mafic-ultramafic intrusions discussed in text. Also indicated is Re-Os data available for sulfide minerals for each magmatic ore deposit or intrusion......56 Figure A2. Location of different types of ore deposits in which a Re-Os isochron has been obtained. See text for discussion ................................................................................57 Figure A3. Re-Os isochron plot for El Salvador, Chile. Bottom three points are pyrite-chalcopyrite with orthoclase-biotite alteration. Upper three points are pyrite with sericite alteration.................................................................................................................58 Figure A4. Re-Os isochron plot for Chuquicamata, Chile. All five points are pyrite with associated quart-sericite alteration..............................................................................58 Figure A5. Isochron plot for Grasberg, Irian Jaya, recalculated using data of Mathur et al. (2000b) .......................................................................................................................59 Figure A6. Eight point iscohron with pyrite samples. Lower cluster of points yeld and isochron with an age of 74 ± 16 Ma (MSWD = 1.08) and an initial of 2.30 ± 0.88...........59 Figure A7. Re-Os data for different sulfide phases for La Caridad porphyry copper deposit .................................................................................................................................60 Figure A8. Re-Os data for different sulfide phases for La Caridad porphyry copper deposit as shown above but here plotted according to associated alteration style .............60 Figure A9. Plot showing Re and Os concentrations from porphyry copper deposits from Chile and Mexico .......................................................................................................61 Figure A10. Re and Osmium concentrations for different deposits of the Zambian Copperbelt...........................................................................................................................62 Figure B1. Weighted average of Re-Os analyses of sample HPL-5. Left side data from Markey et al. (1998) using alkaline fusion, right side data from Selby and Creaser (2004) using Carius tube........................................................................................98 Figure B2. Published Re-Os analyses of sample A996B. Left side analyses by alkaline fusion (Markey et al., 1998); right side analyses by Carius tube (Selby and Creaser, 2004) using >3.2 mg of sample ............................................................................99 Figure B3. Analyses of sample A996B using Carius tube method. Note low reproducibility with small amounts of sample (<10 mg)....................................................100

8
LIST OF FIGURES-CONTINUED Figure B4. Re-Os replicate analyses of sample A996B, using single Os spike and alkaline fusion method and double spike Carius tube technique. Both techniques show relative low reproducibility for this sample, although dispersion with alkaline fusion is higher...............................................................................................................................100 Figure B5. Comparison between analyses of an Archean molybdenite (sample A34 MA, Markey et al., 1998). Fine grain analyses show low reproducibility, whereas coarse grain analyses overlap within error .........................................................................101 Figure B6. Comparison between analyses of an Archean molybdenite (sample A950, Markey et al., 1998). Coarse grain analyses show low reproducibility, whereas fine grain analyses show better reproducibility, although not all analyses overlap within error.....................................................................................................................................101 Figure B7. Comparison between coarse, medium and fine grain size from a single molybdenite sample (sample SW93-PK4, Markey et al., 1998). All three analyses overlap within error ............................................................................................................102 Figure B8. Comparison of analyses from a single coarse grain molybdenite divided in four semi equal pieces. Reproducible ages are obtained with over 20 mg of sample. No reproducible ages were obtained using fine grain homogenized fractions of this same sample. Data from Selby and Creaser (2004)............................................................102 Figure C1. Geologic map of Central Africa showing the location of the Copperbelt with major copper deposits in Zambia and the Democratic Republic of Congo (DRC) ....135 Figure C2. Lithostratigraphy of the Katanga Supergroup in the Copperbelt of Zambia and Congo. Modified from Porada and Berhorst (2000) ....................................................136 Figure C3. Simplified lithostratigraphy of the Katanga Supergroup in the Zambian Copperbelt showing relative location of deposits and samples. .........................................137 Figure C4. Simplified lithostratigraphy of the Katanga Supergroup in the Zambian Copperbelt showing relative location of deposits and samples ..........................................138 Figure C5a. Bornite (purple) intergrown with chalcopyrite (yellow).................................139 Figure C5b. Chalcopyrite (yellow), carrollite (grey) and linnaeite (white)........................139 Figure C5c. Chalcopyrite (yellow), carrollite (grey) and bornite (purple) replaced by blue chalcocite ....................................................................................................................140

9
LIST OF FIGURES-CONTINUED
Figure C5d. Chalcopyrite (yellow) and bornite (purple) replaced by blue chalcocite in fractures ..............................................................................................................................140 Figure C6a. Re-Os isochron plot for Konkola. Replicate analyses for a single chalcopyrite sample (black squares) ...................................................................................141 Figure C6b Same isochron as in (C4a) (cluster of dark squares near the origin) but with two additional analyses from a chalcopyrite sample (black diamonds) from a different stratigraphic level .................................................................................................141 Figure C6c. Seven point isochron with three analyses from a carrollite (open circles) from Nchanga, two analyses from chalcopyrite-bornite (open squares) from Chibuluma, and two points from a chalcopyrite sample Nkana. All isochrones calculated using ISOPLOT (Ludwig, 2000) .......................................................................141 Figure D1. Simplified map of the Bushveld Complex, South Africa, showing main geologic units. Modified after (Barnes et al., 2004) and (Eales and Cawthorn, 1996) ......161 Figure D2. Geologic map of the northern limb of the Bushveld Complex. The location of the Sandsloot mine and the drill core from which sulfide samples were collected for this study is also shown. Modified after (Harris and Chaumba, 2001) .........162 Figure D3. Generalized stratigraphic columns for the eastern, western and northern limbs of the Bushveld Complex. The Platreef is located at the base of the Critical Zone and in direct contact with dolomitic basement rocks. After (Barnes et al., 2004) ....163 Figure D4. Re-Os isochron plot for sulfide minerals from the Platreef. Age and regression calculated using Isoplot (Ludwig, 2001). Circle: sample Plat-3; Squares: sample Plat-5; and Diamonds: sample Plat-6 .....................................................................164 Figure E1. Location of the dated Mexican porphyry copper-molybdenum deposits with their corresponding ages in parenthesis. Also shown are North American PCDs discussed in text ..................................................................................................................198 Figure E2. Graph illustrating the distribution of Mexican PCDs versus age. The arrow shows a general trend from older deposits in the north to younger deposits in the south....................................................................................................................................199

10
LIST OF FIGURES-CONTINUED
Figure E3. Geochronological data from the Tameapa porphyry Cu-Mo prospect. Symbols represent age determination, error bars are 2σ. Filled squares are K-Ar ages from Henry (1975) and Damon et al. (1983a); filled diamonds are Re-Os molybdenite ages (this study). Bio = biotite; hbl = hornblende; px = pyroxene; gd = granodiorite; phy = porphyry....................................................................................................................200 Figure E4. Schematic generalized stratigraphic column for the Cananea district showing the available geochronological information. Modified after Wodzicki (1995) ...201 Figure E5. Geochronological data from the La Caridad porphyry Cu-Mo deposit. Symbols represent age determination, error bars are 2σ. Filled squares are U-Pb ages and filled diamonds are Re-Os molybdenite ages (Data from Valencia et al., submitted). Qtz = quartz; phy = porphyry ..........................................................................202 Figure E6. Diagram showing the inferred duration of magmatism (Ma) versus the estimated reserves and production (Mt) for six porphyry copper deposits of different size (Cu tonnage). See text for discussion ..........................................................................203

11
LIST OF TABLES TABLE B1. Compiled Re-Os molybdenite ages from peer reviewed journals...............103 TABLE B2. Published data on sample HPL-5 ................................................................115 TABLE B3. Published data on “in-house” standard A996..............................................117 TABLE C1. Re and Os concentrations and isotopic compositions for sulfides from the Zambian Copperbelt...................................................................................................143 TABLE D1. Re-Os isotopic data for sulfide minerals from the Platreef.........................165 TABLE E1. Description of selected porphyry Cu-Mo deposits of northern Mexico......204 TABLE E2. Description of molybdenite samples ...........................................................207 TABLE E3. Re-Os data for molybdenite from Mexican porphyry Cu-Mo deposits.......208 TABLE E4. Compiled K-Ar ages from Mexican porphyry Cu-Mo deposits..................209 TABLE E5. Compiled Re-Os molybdenite ages for porphyry Cu-Mo deposits of the American Southwest ........................................................................................................210 TABLE E6. Relation between number of molybdenite mineralization events, inferred duration of magmatism, and estimated reserves and production .......................211

12
ABSTRACT
In mineral deposits the application of the Re-Os system has evolved on two
fronts; as a geochronometer in molybdenite, and as a tracer of the source of metals by
direct determination of the source of Os contained in the ore minerals. Results obtained
from a wide variety and types of mineral deposits indicate that ore minerals in most
deposits contain a high initial osmium composition, compared to the mantle value at the
time of ore formation. The Re-Os data presented here for the Platreef, South Africa, adds
to the growing notion that the crust plays a fundamental role in the formation of mineral
deposits and as a source of ore minerals. Additional data from the Zambian Copperbelt
illustrate the utility of the Re-Os system as a geochronometer of sulfide mineralization.
Two isochron ages of ca. 825 Ma and 575 Ma are consistent with a long-lived period of
multistage mineralization linked to basin evolution and support a model where brines
play a fundamental role in the formation of sediment-hosted stratiform deposits.
Numerous new Re-Os molybdenite ages have recently been reported;
however, the behavior of Re and Os in molybdenites is still poorly understood and
controversy remains regarding the possible disturbance of the Re-Os isotopic system.
Previous studies indicate that the Re-Os system in molybdenites, and in other sulfides,
can experience disturbance by Re and Os loss or Re gain (both examples of open system
behavior), and that the analysis of these altered samples yields equivocal ages. Through
replicate analyses of samples and/or comparison with other robust dating techniques,
such as the U-Pb geochronometer, it is possible to differentiate between Re-Os
molybdenite ages reflecting a mineralization age or a post depositional event. Once the

13
reliability of the Re-Os molybdenite analyses is proven, it is possible to constrain the
timing of mineralization and the identification of multiple molybdenite mineralization
events, information that is relevant in assessing the longevity of porphyry systems.
The examples presented in this work support the use of the Re-Os isotopic system
as an important geochemical tool in the understanding of mineral deposits.

14
CHAPTER 1
INTRODUCTION TO THE RHENIUM – OSMIUM ISOTOPIC SYSTEM
1.1 The Rhenium (Re) and Osmium (Os) elements
The element Rhenium (Re), atomic number 75, is a transition element from Group
VIIb of the Periodic Table together with Manganese (Mn) and Technetium (Tc), and was
the last of the natural elements to be discovered. Rhenium was discovered by Ida Tacke-
Noddack, Walter Noddack, and Otto Carl Berg, in 1925. These german scientists detected
rhenium in the X-ray spectra of platinum ores and in the minerals columbite ((Fe, Mn,
Mg)(Nb, Ta)2O6), gadolinite ((Ce, La, Nd, Y)2FeBe2Si2O10) and molybdenite (MoS2).
The name Rhenium comes from Rhenus, the latin name of the river Rhine. Rhenium has
a high melting point of 3,180° C, second only to tungsten, and a very high density, 21.04
g/cc, exceeded only by platinum, iridium and osmium. Its electronic configuration ([Xe]
4f14 5d5 6s2) is similar to that of Mn ([Ar] 3d5 4s2) and Tc ([Kr] 3d5 4s2). Rhenium has
formal oxidation states from -1 to +7 (Rouschias, 1974), but the most stable valences are
+4 to +7, more similar to molybdenum than to Mn, which is most stable at valence +2
(Cotton and Wilkinson, 1988). In fact, the ionic radius of +4Re (0.63 Å) is very similar to
the ionic radius of +4Mo (0.65 Å). This association of Re to Mo makes molybdenite
(MoS2) the primary source of rhenium production in the world (Sutulov, 1970).
The element Osmium (Os), atomic number 76, is a transition element from Group
VIII and belongs to the Platinum Group Elements (PGEs) along with Ruthenium (Ru),
Rhodium (Ro), Palladium (Pd), Iridium (Ir), and Platinum (Pt). Osmium, named after the

15
greek word “osme”, meaning smell, was discovered along with iridium by Smithson
Tennant in England in 1803. Its electronic configuration ([Xe] 4f14 5d6 6s2) is similar to
that of Ru ([Ar] 3d6 4s2). Osmium has oxidation states from 0 to +8, but it is most stable
in natural geological systems at 0 or +4 valences. This is reflected in the common
occurrence of Os-bearing platinum-group minerals (PGM), i.e. Ru-Os sulfides (laurite-
erlichmanite solid solution series) and Os-Ir-Ru alloys (osmiridium, iridosmine,
rutheniridosmine).
1.2 Re-Os isotopic systematics
Rhenium has two natural occurring isotopes, 185Re (37.398 ± 0.016%) and 187Re
(62.602 ± 0.016%), which gives an atomic weight for Re of 186.20679 ± 0.00031
(Gramlich et al., 1973). Osmium has seven natural occurring isotopes, which are 184Os
(0.023%), 186Os (1.600%), 187Os (1.510%), 188Os (13.286%), 189Os (16.251%), 190Os
(26.369%), and 192Os (40.957%). All of them are stable and give Os an atomic weight of
190.2386 (Faure, 1986).
Rhenium 187 is radioactive and decays to 187Os by beta emission (Naldrett and
Libby, 1948)
187Re → 187Os + β- + ν + Q
The β decay energy is very low (2.65 keV; Dickin, 1995) making the
determination of the decay constant by direct counting very difficult. The decay constant

16
(λ) is related to the half-life through the following expression:
.
The daughter isotope 187Os produced from the decay of 187Re is currently
expressed relative to 188Os:
In order to compare previously published data normalized to 186Os to the current
normalization scheme using 188Os, the 187Os/186Os and 187Re/186Os ratios are multiplied
by the 186Os/188Os ratio of 0.12035 (Snow and Reisberg, 1995).
In the particular case of molybdenite, the equation is simplified because (1) it
contains virtually no 188Os, so normalization to this isotope is not possible, and (2) almost
all 187Os is radiogenic (i.e. produced from decay of 187Re). Therefore, in equation 2, only
one unknown remains (t = time). If the equation is solved for t, the age of the
molybdenite can be determined and the age thus obtained is known as a calculated age
(Equation 3).
The current decay constant (λ) value for 187Re is 1.666 ± 0.017 x 10⁻¹¹ a-1 (Shen et
al., 1996; Smoliar et al., 1996).
)(.ln/T 16930221 λλ
==
)(Re
Osln
T 3
1187
187
λ
+
=
)()te(OsRe
iOsOs
OsOs 21188
187188187
188187
−+=
λ

17
1.3 Distribution and behavior of Re and Os in the mantle and crust
Re and Os are chalcophile (“sulphur-loving”) and siderophile (“iron-loving”)
elements (Luck et al., 1980); this means that both Re and Os are concentrated in sulfides
rather than in associated silicate minerals, and that they must have been concentrated in
the metallic core during core segregation. Furthermore, Os is compatible to highly
compatible relative to Re during partial melting of the mantle, and hence the crust will
evolve to high Re/Os and high 187Os/188Os ratios. The geochemical behavior of Re-Os
stands in contrast with other more common isotopic systems such as the Rb-Sr and Sm-
Nd isotopic systems. These elements are lithophile in nature (“Si-loving”) and tend to
concentrate in silicate minerals, they also behave in a very similar way under partial
melting, yielding very similar parent/daughter ratios in the crust and mantle reservoirs.
The Re-Os system, then, is a unique geochemical tool to evaluate the relative
contributions of crust and mantle in petrogenesis and in the formation of ore deposits.
High 187Os/188Os ratios (≥ 0.2), compared to the chondritic ratio of the mantle (~ 0.13;
Meisel et al., 1996), may indicate a crustal source for osmium and, by inference, other
metals in the sulfide minerals that contain the osmium. The elevated 187Os/188Os ratio in
the crust (0.2-10), compared to mantle values (0.11-0.15), can readily be used to discern
the influence of different reservoirs.
The distribution of rhenium and osmium in sulfide minerals appears to be
heterogeneous (the “nugget effect”) and thus multiple analyses of a single sulfide sample
can yield an isochron (Freydier et al., 1997; Ruiz et al., 1997). Therefore, both the age

18
and initial isotopic composition (and thus the source of osmium) can be determined
directly on major ore-forming minerals.
Although the potential of the Re-Os system was recognized decades ago, only
recently has the full potential been realized. Early attempts suffered from analytical
limitations and difficulties in the separation of low to very low Re and Os concentrations
(at the ppb and ppt level) from different geological materials. These difficulties, coupled
with the uncertainties in the 187Re half-life, hindered the realization of the full potential of
the Re-Os isotopic system.
1.4 Analytical techniques
Re and Os concentrations are determined by isotope dilution techniques, using
tracer solutions of known composition (spikes). In general, these spikes are enriched in
185 for Re and 190 for Os. Typically, rock and mineral analyses require large amounts of
sample (1-50 g) due to the very low concentrations at the parts per billion (ppb) and/or
parts per trillion (ppt) range. Dissolution of samples is achieved using either (1) fusion,
(2) fire–assay, or (3) digestion methods. In acid digestions methods, the spiked sample is
dissolved in Teflon digestion vessels (Walker, 1988) or borosilicate glass tubes (Carius
tubes; Shirey and Walker, 1995) using a combination of HF, HCl and ethanol for Teflon
digestions, or a combination of nitric and hydrochloric acids (aqua regia) for the Carius
tube method.
After digestion, Os is distilled from the oxidizing acid solution (perchloric, Lichte
et al., 1986; sulfuric, Shirey and Walker, 1995; Walker et al., 1988; or aqua regia) as a

19
tetroxide (OsO4). The oxidation of Os can be achieved using different oxidants such as
ceric sulfate (Walker et al., 1988), and aqua regia (Shirey and Walker, 1995). The OsO4
is extracted into NaOH, a 1:3 mixture of ethanol:HCl or HBr (Walker, 1988) solutions.
Re is later separated by solvent extraction (Yatirajam and Kakkar, 1970) or by anion-
exchange chromatography (Morgan and Walker, 1989).
Early analytical techniques included colorimetry and neutron activation analysis
(NAA) (Hoffman et al., 1978; Morgan et al., 1981). Other techniques that have been used
are: atomic absorption spectrometry (AAS), laser microprobe mass analyzer (LAMMA)
(Lindner et al., 1986; Lindner et al., 1989), secondary mass spectrometry (SIMS) (Luck
et al., 1980; Luck and Allegre, 1983), accelerator mass spectrometry (AMS) (Fehn et al.,
1986), resonance ionization mass spectrometry (RIMS) (Walker et al., 1988; Morgan and
Walker, 1989), inductively-coupled plasma mass spectrometry (ICP-MS), negative
thermal ionization mass spectrometry (NTIMS) (Creaser et al., 1991; Völkening et al.,
1991), and more recently laser ablasion multi-collector inductively-coupled plasma mass
spectrometry (LA- MC -ICPMS) (Hirata et al., 1998; Pearson et al., 2002).
Re and Os analyses using NTIMS have provided a great improvement in
sensitivity and precision with analyses at the parts per trillion level.

20
CHAPTER 2
INTRODUCTION TO THE PRESENT STUDY
During the last 15 years the Re-Os isotopic system has reached a degree of
maturity that has resulted in an explosion of new isotopic information on a wide variety
of geological topics. These topics can be broadly categorized in three main issues, which
are: (1) early evolution of Earth, based on meteorites (Luck et al., 1980; Luck and
Allegre, 1983; Morgan and Walker, 1989; Shen et al., 1996; Smoliar et al., 1996; Chen et
al., 1998) and Archean rocks (Burton et al., 2000); (2) evolution of crust and mantle,
based on studies of komatiites (Walker et al., 1988; Foster et al., 1996; Puchtel et al.,
2001), flood basalts (Ellam et al., 1992; Chesley and Ruiz, 1998; Allegre et al., 1999),
mafic-ultramafic intrusions (Lambert et al., 1989; Hattori and Hart, 1991; Dickin et al.,
1992; Marcantonio et al., 1993; Marcantonio et al., 1994; McCandless et al., 1999;
Ripley et al., 1999; Morgan et al., 2000; Sproule et al., 2002), ophiolites (Luck and
Allegre, 1991; Snow et al., 2000; Tsuru et al., 2000; Walker et al., 2002), mid-ocean
ridge basalts (MORBs) (Martin, 1991; Schiano et al., 1997; Escrig et al., 2004; Gannoun
et al., 2004), oceanic island basalts (OIBs) (Hauri and Hart, 1993; Reisberg et al., 1993;
Roy Barman and Allegre, 1995), mantle and lower crust xenoliths (Pearson et al., 1995;
Meisel et al., 1996; Saal et al., 1998; Meisel et al., 2001), sediments (e.g. black shales)
(Ravizza and Turekian, 1989; Reisberg et al., 1997), and mineral deposits (Freydier et al.,
1997; Ruiz et al., 1997; Lambert et al., 1998; Mathur et al., 1999; Mathur et al., 2000a;
Lambert et al., 2000; Stein et al., 2001; Kirk et al., 2001; Kirk et al., 2002; Mathur et al.,
2002; Hannah and Stein, 2002; Mathur et al., 2003; Barra et al., 2003; Kirk et al., 2003);

21
and (3) evolution of the oceans (Anbar et al., 1992; Peucker-Ehrenbrick and Blum, 1998;
Burton et al., 1999; Cohen et al., 1999; Peucker-Ehrenbrick and Ravizza, 2000; Chesley
et al., 2000; Ravizza et al., 2001).
In mineral deposits the application of the Re-Os system has evolved in two fronts;
as a geochronometer in molybdenite (McCandless and Ruiz, 1993; McCandless et al.,
1993), and as a tracer of the source of metals by direct determination of the source of Os
contained in the ore minerals (; Freydier et al., 1997; Mathur et al., 2000a; Mathur et al.,
2000b; Kirk et al., 2001; Kirk et al., 2002; Barra et al., 2003).
Molybdenite constitutes a particular case among sulfide minerals because it
contains high concentrations of Re (in the ppm range) and Os (at ppb levels), and almost
no initial or common Os. Although the potential of molybdenite as a Re-Os
geochronological tool was recognized 50 years ago (Herr et al., 1954; Hirt et al., 1963;
Luck and Allegre, 1982), much has advanced since these early studies. The development
of new and more precise analytical techniques and a better determination of the 187Re
decay constant (Shen et al., 1996; Smoliar et al., 1996), has resulted in numerous studies
using molybdenite as a direct determination of the age of mineralization in ore deposits.
Regardless of the degree of maturity of this particular application of the Re-Os
system in ore systems, the behavior of Re and Os in molybdenite remains controversial.
Re-Os studies on other sulfides and oxides are more limited due to the lower Re
and Os concentration present (at ppb and ppt levels, respectively) in these other minerals.
Although such low concentrations are a disadvantage, the fact that these minerals
incorporate common osmium during their formation allows us to determine the source of

22
this Os and the relative contributions of the different reservoirs (crust and mantle). Thus,
the application of the Re-Os system on other sulfides and oxides provides not only
geochronological data by means of the isochron method, but also source information.
The advances made in the application of the Re-Os isotopic system to mineral
deposits are largely due to the work performed at the Re-Os laboratory at the Department
of Geosciences of the University of Arizona, under the guidance of Dr. Joaquin Ruiz. The
early works of McCandless et al. (1993) and MacCandless and Ruiz (1993), provide a
framework for the understanding of the Re behavior in molybdenite and its further
application to the geochronology of porphyry type deposits. The studies on porphyry
copper deposits by Freydier et al. (1997) and Mathur et al. (2000a, b) illustrate the
potential of the system in understanding the evolution of these systems and the role of
mantle and crust as source of metals, and the recent work performed by Kirk et al. (2001,
2003) in the direct determination on the age of gold and its implications at a global scale.
The present work builds on these studies and provides new insights on the Re-Os
system and its application as a molybdenite geochronometer and in determining the
source and age of ore systems and their relevance at a regional and global scale.
The specific objectives of the present study are:
(1) To evaluate and present a critical review on the current status of the Re-Os system
applied to sulfides and oxides in a variety of mineral deposits based on previous
published peer reviewed papers and new unpublished information. Some of the
relevant questions are:

23
a. What are the relative roles of crust and mantle in the formation of different
types of mineral deposits?
b. What is the role of host rocks as source of metals?
c. What are the Os and Re concentrations in different types of deposits?
(2) To evaluate and present a critical review on the current status of the Re-Os
molybdenite geochronometer based on previous published peer reviewed papers
and new unpublished information. Some of the questions that will be addressed
here include:
a. Are erroneous ages the result of molybdenite post-depositional alteration
or analytical protocol?
b. What is the relevance of sample preparation in reliable age
determinations?
c. What is, and how does, decoupling work?
d. How is the age error reported and what is its relevance?
(3) To apply the Re-Os system on a variety of well-constrained samples from several
sediment-hosted stratiform copper deposits from the Zambian Copperbelt to
determine the age of mineralization and its relation to regional and global events.
Some of the questions that will be answered here are:
a. Is the mineralization in the Copperbelt the result of a single or multiple
events?

24
b. Is there a unique source of Os and Re and by inference of metals?
c. Is there a relation between mineralization and regional and/or global
events?
d. What is the source of metals in the Zambian Copperbelt and what process
(or processes) are responsible for the deposition of this important
concentration of copper and cobalt mineralization?
(4) To determine the age and source of metals on a suite of well-constrained samples
from the Platreef deposit in South Africa, one of the most important sources of
PGEs in the world, and establish the role of the crust in the formation of this
deposit. The purpose of this topic is to determine:
a. What is the age of mineralization and its relation with the nearby
Merensky Reef?
b. What is the role of the crust in the formation of PGE deposits in the
Bushveld Complex?
c. What is the role of late magmatic and/or hydrothermal fluids in the
precipitation of PGEs?
(5) To apply the Re-Os system on a variety of well-constrained molybdenite samples
from ten porphyry copper deposits in northern Mexico to resolve the onset and
duration of porphyry mineralization at a regional, district and deposit level.
Among the aspects discussed here are:

25
a. Are there pulses of porphyry mineralization in the American Southwest
province or is there a continuum?
b. How long does a porphyry copper system remain active?
c. Is there a relation between the duration of the hydrothermal-mineralization
activity and the amount of copper contained in any particular deposit?
The first objective is addressed in Appendix A and eventually with the second
objective (Appendix B) will constitute a two-part article to be submitted to Ore Geology
Reviews. Objective three is addressed in Appendix C, a manuscript to be submitted to
Nature. Objective four is addressed in Appendix D, a manuscript to be submitted to
Geology. Finally, objective five is the topic of a manuscript currently under review by
Economic Geology (Appendix E).

26
REFERENCES
Allegre, C. J., Birck, J. L., Capmas, F., and Courtillot, V., 1999, Age of the Deccan traps using 187Re-187Os systematics: Earth and Planetary Science Letters, v. 170, p. 197-204.
Anbar, A. D., Creaser, R. A., Papanastassiou, D. A., and Wasserburg, G., 1992, Rhenium
in seawater: Confirmation of generally conservative behavior: Geochimica et Cosmochimica Acta, v. 56, p. 4099-4103.
Barra, F., Ruiz, J., Mathur, R., and Titley, S., 2003, A Re-Os study of sulfide minerals
from the Bagdad porphyry Cu-Mo deposit, northern Arizona, USA: Mineralium Deposita, v. 38, p. 585-596.
Burton, K. W., Bourdon, B., Birck, J. L., Allegre, C. J., and Hein, J. R., 1999, Osmium
isotope variations in the oceans recorded by Fe-Mn crusts: Earth and Planetary Science Letters, v. 171, p. 185-197.
Burton, K. W., Capmas, F., Birck, J. L., Allegre, C. J., and Cohen, A. S., 2000,
Resolving crystallisation ages of Archean mafic-ultramafic rocks using the Re-Os isotope system: Earth and Planetary Science Letters, v. 179, p. 453-467.
Chen, J. H., Papanastassiou, D. A., and Wasserburg, G., 1998, Re-Os systematics in
chondrites and the fractionation of the platinum group elements in the early solar system: Geochimica et Cosmochimica Acta, v. 62, p. 3379-3392.
Chesley, J. T., and Ruiz, J., 1998, Crust-mantle interaction in large igneous provinces:
Implications from the Re-Os isotope systematics of the Columbia River flood basalts: Earth and Planetary Science Letters, v. 154, p. 1-11.
Chesley, J., Quade, J., and Ruiz, J., 2000, The Os and Sr isotopic record of Himalayan
paleorivers: Himalayan tectonics and influence on ocean chemistry: Earth and Planetary Science Letters, v. 179, p. 115-124.
Cohen, A. S., Coe, A. L., Bartlett, J. M., and Hawkesworth, C. J., 1999, Precise Re-Os
ages of organic-rich mudrocks and the Os isotope composition of Jurassic seawater: Earth and Planetary Science Letters, v. 167, p. 159-173.
Cotton, F. A., and Wilkinson, G., 1988, Advance Inorganic Geochemistry, John Wiley &
Sons, 1455 p.

27
Creaser, R. A., Papanastassiow, D. A., and Wasserburg, G. J., 1991, Negative thermal ion mass spectrometry of osmium, rhenium, and iridium: Geochimica et Cosmochimica Acta, v. 55, p. 397-401.
Dickin, A. P., 1995, Radiogenic Isotope Geology, Cambridge University Press, 490 p. Dickin, A. P., Richardson, J. M., Crocket, J. H., McNutt, R. H., and Peredery, W. V.,
1992, Osmium isotope evidence for a crustal origin of platinum group elements in the Sudbury nickel ore, Ontario, Canada: Geochimica et Cosmochimica Acta, v. 56, p. 3531-3537.
Ellam, R. M., Carlson, R. W., and Shirey, S. B., 1992, Evidence from Re-Os isotopes for
plume-lithosphere mixing in Karoo flood basalt genesis: Nature, v. 359, p. 718-721.
Escrig, S., Capmas, F., Dupre, B., and Allegre, C. J., 2004, Osmium isotopic constraints
on the nature of the DUPAL anomaly from Indian mid-ocean-ridge basalts: Nature, v. 431, p. 59-63.
Faure, G., 1986, Principles of Isotope Geology: New York, John Wiley & Sons, 589 p. Fehn, U., Teng, R., Elmore, D., and Kubik, P. W., 1986, Isotopic composition of
osmium in terrestrial samples determined by accelerator mass spectrometry: Nature, v. 323, p. 707-710.
Foster, J. G., Lambert, D. D., Frick, L. R., and Maas, R., 1996, Re-Os isotopic evidence
for genesis of Archean nickel ores from uncontaminated komatiites: Nature, v. 382, p. 703-706.
Freydier, C., Ruiz, J., Chesley, J., McCandless, T., and Munizaga, F., 1997, Re-Os
isotope systematics of sulfides from felsic igneous rocks: Application to base metal porphyry mineralization in Chile: Geology, v. 25, p. 775-778.
Gannoun, A., Burton, K. W., Thomas, L. E., Parkinson, I. J., van Calsteren, P., and
Schiano, P., 2004, Osmium isotope heterogeneity in the constituent phases of Mid-Ocean Ridge Basalts: Science, v. 303, p. 70-72.
Gramlich, J. W., Murphy, T. J., Gardner, E. L., and Shields, W. R., 1973, Absolute
isotopic abundance ratio and atomic weight of a reference sample of rhenium: Journal of Research of the National Bureau of Standards. Section A, Physics and Chemistry, v. 77A, p. 691-698.

28
Hannah, J. L., and Stein, H. J., 2002, Re-Os model for the origin of sulfide deposits in anorthosite-associated intrusive complexes: Economic Geology, v. 97, p. 371-383.
Hattori, K., and Hart, S. R., 1991, Osmium-isotope ratios of platinum-group minerals
associated with ultramafic intrusions: Os-isotopic evolution of the oceanic mantle: Earth and Planetary Science Letters, v. 107, p. 499-514.
Hauri, E. H., and Hart, S. R., 1993, Re-Os isotope systematics of HIMU and EMII
oceanic island basalts from the south Pacific Ocean: Earth and Planetary Science Letters, v. 114, p. 353-371.
Herr, W., Hintenberg, H., and Voshage, H., 1954, Half-life of rhenium: Physical Review,
v. 95, p. 1691. Hirata, T., Hattori, M., and Tanaka, T., 1998, In-situ osmium isotope analyses of
iridosmines by laser albation-multiple collector-inductively coupled plasma mass spectrometry: Chemical Geology, v. 144, p. 269-280.
Hirt, B., Tilton, G. R., Herr, W., and Hoffmeister, W., 1963, The half life of 187Re, in
Geiss, J., and Goldberg, E., eds., Earth Science Meteoritics, North Holland, p. 273-280.
Hoffman, E. L., Naldrett, A. J., Van Loon, J. C., Hancock, R. G. V., and Manson, A.,
1978, The determination of all the platinum group elements and gold in rocks and ore by neutron activition analysis after preconcentration by nickel sulphide fire-assay technique on large samples: Analytica Chimica Acta, v. 102, p. 157-166.
Kirk, J., Ruiz, J., Chesley, J., Titley, S., and Walshe, J., 2001, A detrital model for the
origin of gold and sulfides in the Witwatersrand basin based on Re-Os isotopes: Geochimica et Cosmochimica Acta, v. 65, p. 2149-2159.
Kirk, J., Ruiz, J., Chesley, J., Walshe, J., and England, G., 2002, A major archean, gold-
and crust-forming event in the Kaapvaal craton, South Africa: Science, v. 297, p. 1856-1858.
Kirk, J., Ruiz, J., Chesley, J., and Titley, S., 2003, The origin of gold in South Africa:
American Scientist, v. 91, p. 534-541. Lambert, D. D., Morgan, J. W., Walker, R. J., Shirey, S. B., Carlson, R. W., Zientek, M.
L., and Koski, M. S., 1989, Rhenium-Osmium and Samarium-Neodymium isotopic systematics of the Stillwater Complex: Science, v. 244, p. 1169-1174.

29
Lambert, D. D., Foster, J. G., Frick, L. R., Hoatson, D. M., and Purvis, A. C., 1998, Application of the Re-Os isotopic system to the study of Precambrian magmatic sulfide deposits of Western Australia: Australian Journal of Earth Sciences, v. 45, p. 265-284.
Lambert, D. D., Frick, L. R., Foster, J. G., Li, C., and Naldrett, A. J., 2000, Re-Os
isotope systematics of the Voisey's Bay Ni-Cu-Co magmatic sulfide system, Labrador, Canada: II. Implications for parental magma chemistry, ore genesis, and metal redistribution: Economic Geology, v. 95, p. 867-888.
Lichte, F. E., Wilson, S. M., Brooks, R. R., Reeves, R. D., Holzbecher, J., and Ryan, D.
E., 1986, New method for the measurement of osmium isotopes applied to a New Zeland Cretaceous/Tertiary bounday shale: Nature, v. 322, p. 816-817.
Lindner, M., Leich, D. A., Borg, R. J., Russ, G. P., Bazan, J. M., Simons, D. S., and
Date, A. R., 1986, Direct laboratory determination of 187Re half-life: Nature, v. 320, p. 246-248.
Lindner, M., Leich, D. A., Russ, G. P., Bazan, J. M., and Borg, R. J., 1989, Direct
determination of the half-life of 187Re: Geochimica et Cosmochimica Acta, v. 53, p. 1597-1606.
Luck, J. M., and Allegre, C. J., 1982, The study of molybdenites through the 187Re-
187Os chronometer: Earth and Planetary Science Letters, v. 61, p. 291-296. Luck, J. M., and Allegre, C. J., 1983, 187Re-187Os systematics in meteorites and
cosmochemical consequences: Nature, v. 302, p. 130-132. Luck, J. M., and Allegre, C. J., 1991, Osmium isotopes in ophiolites: Earth and Planetary
Science Letters, v. 107, p. 406-415. Luck, J. M., Birck, J. L., and Allegre, C. J., 1980, 187Re-187Os systematics in
meteorites: early chronology of the Solar System and age of the Galaxy: Nature, v. 283, p. 256-259.
Marcantonio, F., Zindler, A., Reisberg, L., and Mathez, E. A., 1993, Re-Os isotopic
systematics in chromitites from the Stillwater Complex, Montana: Geochimica et Cosmochimica Acta, v. 57, p. 4029-4037.
Marcantonio, F., Reisberg, L., Zindler, A., Wyman, D., and Hulbert, L., 1994, An
isotopic study of the Ni-Cu-PGE-rich Wellgreen intrusion of the Wrangellia Terrane: Evidence for hydrothermal mobilization of rhenium and osmium: Geochimica et Cosmochimica Acta, v. 58, p. 1007-1017.
30
Martin, C. E., 1991, Osmium isotopic characteristics of mantle-derived rocks: Geochimica et Cosmochimica Acta, v. 55, p. 1421-1434.
Mathur, R., Ruiz, J., and Tornos, F., 1999, Age and sources of the ore at Tharsis and Rio
Tinto, Iberian Pyrite Belt, from Re-Os isotopes: Mineralium Deposita, v. 34, p. 790-793.
Mathur, R., Ruiz, J., and Munizaga, F., 2000a, Relationship between copper tonnage of
Chilean base-metal porphyry deposits and Os isotope ratios: Geology, v. 28, p. 555-558.
Mathur, R., Ruiz, J., Titley, S., Gibbins, S., and Margotomo, W., 2000b, Different crustal
sources for Au-rich and Au-poor ores of the Grasberg Cu-Au porphyry deposit: Earth and Planetary Science Letters, v. 183, p. 7-14.
Mathur, R., Marschik, R., Ruiz, J., Munizaga, F., Leveille, R. A., and Martin, W., 2002,
Age of mineralization of the Candelaria Fe oxide Cu-Au deposit and the origin of the Chilean iron belt, based on Re-Os isotopes: Economic Geology, v. 97, p. 59-71.
Mathur, R., Ruiz, J., Herb, P., Hahn, L., and Burgath, K. P., 2003, Re-Os isotopes
applied to the epithermal gold deposits near Bucaramanga, northeastern Colombia: Journal of South American Earth Sciences, v. 15, p. 815-821.
McCandless, T. E., and Ruiz, J., 1993, Rhenium-Osmium evidence for regional
mineralization in southwestern North-America: Science, v. 261, p. 1282-1286. McCandless, T. E., Ruiz, J., and Campbell, A. R., 1993, Rhenium behavior in
molybdenite in hypogene and near-surface environments: Implications for Re-Os geochronometry: Geochimica et Cosmochimica Acta, v. 57, p. 889-905.
McCandless, T. E., Ruiz, J., Adair, B. I., and Freydier, C., 1999, Re-Os isotope and
Pd/Ru variations in chromitites from the Critical Zone, Bushveld Complex, South Africa: Geochimica et Cosmochimica Acta, v. 63, p. 911-923.
Meisel, T., Walker, R. J., and Morgan, J. W., 1996, The osmium isotopic composition of
the Earth's primitive upper mantle: Nature, v. 383, p. 517-520. Meisel, T., Walker, R. J., Irving, A. J., and Lorand, J. P., 2001, Osmium isotopic
compositions of mantle xenoliths: a global perspective: Geochimica et Cosmochimica Acta, v. 65, p. 1311-1323.

31
Morgan, J. W., and Walker, R. J., 1989, Isotopic determinations of rhenium and osmium in meteorites by using fusion, distillation, and ion-exchange separations: Analytica Chimica Acta, v. 222, p. 291-300.
Morgan, J. W., Wandless, G. A., Petrie, R. K., and Irving, A. J., 1981, Composition of
the Earth Upper Mantle - I. Siderophile trace elements in ultramafic nodules: Tectonophysics, v. 75, p. 47-67.
Morgan, J. W., Stein, H. J., Hannah, J. L., Markey, R. J., and Wiszniewska, J., 2000, Re-
Os study of Fe-Ti-V oxide and Fe-Cu-Ni sulfide deposits, Suwalki Anorthosite Massif, northeast Poland: Mineralium Deposita, v. 35, p. 391-401.
Naldrett, S. N., and Libby, W. F., 1948, Natural radioactivity of rhenium: Physical
Review, v. 73, p. 487-493. Pearson, D. G., Shirey, S. B., Carlson, R. W., Boyd, F. R., Pokhilenko, N. P., and
Shimizu, N., 1995, Re-Os, Sm-Nd, and Rb-Sr isotope evidence for thick Archaean lithospheric mantle beneath the Siberian craton modified by multistage metasomatism: Geochimica et Cosmochimica Acta, v. 59, p. 959-977.
Pearson, N. J., Alard, O., Griffin, W. L., Jackson, S. E., and O'Reilly, S. Y., 2002, In situ
measurement of Re-Os isotopes in mantle sulfides by laser ablasion multicollector-inductively coupled plasma mass spectrometry: Analytical methods and preliminary results: Geochimica et Cosmochimica Acta, v. 66, p. 1037-1050.
Peucker-Ehrenbrick, B., and Blum, J. D., 1998, Re-Os isotope systematics and
weathering of Precambrian crustal rocks: Implications for the marine osmium isotope record: Geochimica et Cosmochimica Acta, v. 62, p. 3193-3203.
Peucker-Ehrenbrick, B., and Ravizza, G., 2000, The marine osmium isotope record:
Terra Nova, v. 12, p. 205-219. Puchtel, I. S., Brugmann, G. E., and Hofmann, A. W., 2001, 187Os-enriched domain in
an Archean mantle pplume: evidence from 2.8 Ga komatiites of the Kostomuksha greenstone belt, NW Baltic Shield: Earth and Planetary Science Letters, v. 186, p. 513-526.
Ravizza, G., and Turekian, K. K., 1989, Application of the 187Re-187Os system to black
shale geochronology: Geochimica et Cosmochimica Acta, v. 53, p. 3257-3262. Ravizza, G., Blusztajn, J., and Prichard, H. M., 2001, Re-Os systemaics and platinum-
group element distribution in metalliferous sediments from the Troodos ophiolite: Earth and Planetary Science Letters, v. 188, p. 369-381.

32
Reisberg, L., Zindler, A., Marcantonio, F., White, W., Wyman, D., and Weaver, B., 1993, Os isotope systematics in ocean island basalts: Earth and Planetary Science Letters, v. 120, p. 149-167.
Reisberg, L., France-Lanord, C., and Pierson-Wickman, A. C., 1997, Os isotopic
compositions of leachates and bulk sediments from the Bengal Fan: Earth and Planetary Science Letters, v. 150, p. 117-127.
Ripley, E. M., Lambert, D. D., and Frick, L. R., 1999, Re-Os, Sm-Nd, and Pb isotopic
constraints on mantle and crustal contributions to magmatic sulfide mineralization in the Duluth Complex: Geochimica et Cosmochimica Acta, v. 62, p. 3349-3365.
Rouschias, G., 1974, Recent advances in the chemistry of rhenium: Chemical Reviews, v.
74, p. 531-566. Roy Barman, M., and Allegre, C. J., 1995, 187Os/186Os in oceanic basalts: Tracing
oceanic crust recycling in the mantle: Earth and Planetary Science Letters, v. 129, p. 145-161.
Ruiz, J., Freydier, C., McCandless, T., and Chesley, J., 1997, Re-Os isotope systematics
from base metal porphyry and manto-type mineralization in Chile: International Geology Review, v. 39, p. 317-324.
Saal, A. E., Rudnick, R. L., Ravizza, G. E., and Hart, S. R., 1998, Re-Os isotope
evidence for the composition, formation and age of the lower crust: Nature, v. 393, p. 58-61.
Schiano, P., Birck, J. L., and Allegre, C. J., 1997, Osmium-strontium-neodymium-lead
isotopic covariations in mid-ocean ridge basalt glasses and heterogeneity of the upper mantle: Earth and Planetary Science Letters, v. 150, p. 363-379.
Shen, J. J., Papanastassiou, D. A., and Wasserburg, G. J., 1996, Precise Re-Os
determinations and systematics of iron meteorites: Geochimica et Cosmochimica Acta, v. 60, p. 2887-2900.
Shirey, S. B., and Walker, R. J., 1995, Carius tube digestion for low-blank rhenium-
osmium analysis: Analytical Chemistry, v. 67, p. 2136-2141. Smoliar, M. I., Walker, R. J., and Morgan, J. W., 1996, Re-Os ages of Group IIA, IIIA,
IVA, and IVB iron meteorites: Science, v. 271, p. 1099-1102. Snow, J. E., and Reisberg, L., 1995, Os isotopic systematics of the MORB
mantle:Results from altered abyssal peridotites: Earth and Planetary Science Letters, v. 133, p. 411-421.

33
Snow, J. E., Schmidt, G., and Rampone, E., 2000, Os isotopes and highly siderophile
elements (HSE) in the Ligurian ophiolites, Italy: Earth and Planetary Science Letters, v. 175, p. 119-132.
Sproule, R. A., Lambert, D. D., and Hoatson, D. M., 2002, Decoupling of the Sm-Nd
and Re-Os isotopic systems in sulphide-saturated magmas in the Halls Creek Orogen, western Australia: Journal of Petrology, v. 43, p. 375-402.
Stein, H. J., Markey, R. J., Morgan, J. W., Hannah, J. L., and Schersten, A., 2001, The
remarkable Re-Os chronometer in molybdenite: how and why it works: Terra Nova, v. 13, p. 479-486.
Sutulov, A., 1970, Molybdenum and rhenium recovery from porphyry coppers:
Concepcion, Universidad de Concepcion, 252 p. Tsuru, A., Walker, R. J., Kontinen, A., Peltonen, P., and Hanski, E., 2000, Re-Os
systematics of the 1.95 Ga Jormua Ophiolite Complex, northeastern Finland: Chemical Geology, v. 164, p. 123-141.
Völkening, J., Walczyk, T., and Heumann, K. G., 1991, Osmium isotope ratio
determinations by negative thermal ionization mass spectrometry: International Journal of Mass Spectrometry and Ion Processes, v. 105, p. 147-159.
Walker, R. J., 1988, Low-blank chemical separation of rhenium and osmium from gram
quatities of silicate rock for measurement by resonance ionization mass spectrometry: Analytical Chemistry, v. 60, p. 1231-1243.
Walker, R. J., Shirey, S. B., and Stecher, O., 1988, Comparative Re-Os, Sm-Nd and Rb-
Sr isotope and trace element systematics for Archean komatiite flows from Munro Township, Abitibi Belt, Ontario: Earth and Planetary Science Letters, v. 87, p. 1-12.
Walker, R. J., Prichard, H. M., Ishiwatari, A., and Pimentel, M., 2002, The osmium
isotopic composition of convecting upper mantle deduced from ophiolite chromites: Geochimica et Cosmochimica Acta, v. 66, p. 329-345.
Yatirajam, V., and Kakkar, L. R., 1970, Separation of rhenium from molybdenum,
vanadium, tungsten and some other elements by tribenzylamine-chloroform extraction from phosphoric acid: Analytica Chimica Acta, v. 52, p. 555-559.

34
APPENDIX A
THE APPLICATION OF THE RE-OS ISOTOPIC SYSTEM TO THE STUDY OF
MINERAL DEPOSITS: PART I: IMPLICATIONS FOR THE AGE AND SOURCE OF
METALS IN MINERAL DEPOSITS
Fernando Barra 1,2, Joaquin Ruiz 1, John T. Chesley1, Victor A.Valencia1
1 Department of Geosciences, University of Arizona, Tucson, AZ 85721, USA 2 Instituto Geología Económica Aplicada, Universidad de Concepción, Concepción, Chile
To be submitted to Ore Geology Reviews

35
Abstract
Recent advances in technology and chemical procedures in isotope geology have
resulted in a great expansion of studies in a variety of geological fields. In particular, the
use of the Re-Os isotopic system has experienced an explosion during the last decade,
and has yielded numerous advances in our understanding of the Earth system. Due to the
intrinsic chalcophile and siderophile nature of Re and Os and their behavior during partial
melting processes in the mantle, the application of this isotopic system to the study of
mineral deposits is especially relevant. Not only geochronological information can be
obtained by constructing isochrons using sulfide or oxide minerals, but also the relative
roles of crust and mantle can be assessed by determination of the initial osmium
composition. Work to date has been limited because of technical limitations and low Os
and Re concentrations, but significant contributions have been made and an increase in
the number of studies, using the isochron method, is expected in the near future.
Here, the advances and limitations of the Re-Os system in the study of mineral
deposits are discussed. We conclude, based on the results obtained from a wide variety
and types of mineral deposits, that ore minerals (sulfides and/or oxides) in most deposits
contain a high initial osmium composition compared to the mantle value at the time of
ore formation. Magmatic ore deposits show, in most cases, relatively high positive γOs
values indicating that the magmas responsible for these deposits have interacted, in
variable degrees, with the crust. In porphyry copper deposits, volcanogenic massive
sulfides, and Fe oxide-Cu-Au and magnetite deposits, Re-Os isotopes indicate that a
significant part of the osmium contained in the ore minerals has a crustal origin, and by

36
inference the minerals that contain this crustal osmium have a similar source. The Re-Os
data presented here add to the growing notion that the crust plays a fundamental role in
the formation of mineral deposits.

37
Introduction to the Re-Os Isotopic System
The element Rhenium (Re), atomic number 75, is a transition element from Group
VIIb of the Periodic Table together with Manganese (Mn) and Technetium (Tc), and was
the last of the natural elements to be discovered. Rhenium was discovered by Ida Tacke-
Noddack, Walter Noddack, and Otto Carl Berg, in 1925. These german scientists detected
rhenium in the X-ray spectra of platinum ores and in the minerals columbite ((Fe, Mn,
Mg)(Nb, Ta)2O6), gadolinite ((Ce, La, Nd, Y)2FeBe2Si2O10) and molybdenite (MoS2).
The name Rhenium comes from Rhenus, the latin name of the river Rhine. Rhenium has
a high melting point of 3,180° C, second only to tungsten, and a very high density, 21.04
g/cc, exceeded only by platinum, iridium and osmium. Its electronic configuration ([Xe]
4f14 5d5 6s2) is similar to that of Mn ([Ar] 3d5 4s2) and Tc ([Kr] 3d5 4s2). Rhenium has
formal oxidation states from -1 to +7 (Rouschias, 1974), but the most stable valences are
+4 to +7, more similar to molybdenum than to Mn, which is most stable at valence +2
(Cotton and Wilkinson, 1988). In fact, the ionic radius of +4Re (0.63 Å) is very similar to
the ionic radius of +4Mo (0.65 Å). This association of Re to Mo makes molybdenite
(MoS2) the primary source of rhenium production in the world (Sutulov, 1970).
The element Osmium (Os), atomic number 76, is a transition element from Group
VIII and belongs to the Platinum Group Elements (PGEs) along with Ruthenium (Ru),
Rhodium (Ro), Palladium (Pd), Iridium (Ir), and Platinum (Pt). Osmium, named after the
greek word “osme” meaning smell, was discovered along with iridium by Smithson
Tennant in England in 1803. Its electronic configuration ([Xe] 4f14 5d6 6s2) is similar to
that of Ru ([Ar] 3d6 4s2). Osmium has oxidation states from 0 to +8, but it is most stable

38
in natural geological systems at 0 or +4 valences. This is reflected in the common
occurrence of Os-bearing platinum-group minerals (PGM), i.e. Ru-Os sulfides (laurite-
erlichmanite solid solution series) and Os-Ir-Ru alloys (osmiridium, irdosmine,
rutheniridosmine).
Re-Os Isotopic Systematics
Rhenium has two natural occurring isotopes, 185Re (37.398 ± 0.016%) and 187Re
(62.602 ± 0.016%), which give an atomic weight for Re of 186.20679 ± 0.00031
(Gramlich et al., 1973). Osmium has seven natural occurring isotopes, which are 184Os
(0.023%), 186Os (1.600%), 187Os (1.510%), 188Os (13.286%), 189Os (16.251%), 190Os
(26.369%), and 192Os (40.957%). All of them are stable and give Os an atomic weight of
190.2386 (Faure, 1986).
Rhenium 187 is radioactive and decays to 187Os by beta emission (Naldrett and
Libby, 1948)
187Re → 187Os + β- + ν + Q
The β decay energy is very low (2.65 keV; Dickin, 1995) making the
determination of the decay constant by direct counting very difficult. The decay constant
(λ) is related to the half-life through the following expression:

39
.
The daughter isotope 187Os produced from the decay of 187Re, is expressed
following the general rule that applies to other radiogenic systems (e.g. Rb-Sr, Sm-Nd);
that is relative to a neighboring stable isotope. For the case of 187Os, in past studies the
stable isotope of osmium selected was 186Os (Hirt et al., 1963; Luck et al., 1980).
It was later discovered though, that 190Pt decays to 186Os, producing some
concerns in Re-Os determinations of Pt-bearing samples. This problem, coupled to the
fact that ICP-MS determinations of 186Os are affected by isobaric interference from 186W,
resulted in a change of the reference stable isotope from 186Os to the more abundant
188Os.
In order to compare previously published data normalized to 186Os to the current
normalization scheme using 188Os, the 187Os/186Os and 187Re/186Os ratios are multiplied
by the 186Os/188Os ratio of 0.12035 (Snow and Reisberg, 1995).
In a manner analogous to the εNd notation for Sm-Nd isotopes, the Os isotopic
)te(Os
Re
iOs
Os
Os
Os 1188
187
188
187
188
187−+
= λ
λλ69302
21.ln
/T ==
)te(Os
Re
iOs
Os
Os
Os 1186
187
186
187
186
187−+
= λ

40
composition for minerals and rocks can be expressed relative to a “chondritic uniform
reservoir” (CHUR), but in this case the relative difference is expressed in parts per 100.
This percentage difference between the Os isotopic composition of a sample and the
average chondritic composition at a particular time (t) is known as γOs.
The ratio (187Os/188Os)CHUR at an specific time (t) is calculated as follows:
Where:
(187Os/188Os)CHUR, initial = 0.09531 (Shirey and Walker, 1998)
(187Re/188Os)CHUR, = 0.40186 (Shirey and Walker, 1998)
Hence:
2101
188187
188187
×
−
= t
CHUROsOs
t
sampleOsOs
tCHUR,Osγ
)et
e()x.(
CHUROsRe
i
CHUROsOs
t
CHUROsOs λλ
−+=
9105584188
187188
187188
187
)et
e()x.(
..t
CHUROsOs λλ
−+=
9105584401860095310188
187

41
Determination of the 187Re half-life
Since the discovery of the radioactive decay of 187Re by Naldrett and Libby
(1948), several attempts have been made to determine the half-life of rhenium 187. In
general these attempts used either (1) counting techniques (Brodzinski and Conway,
1965; Payne and Drever, 1965) or (2) geological materials of known or assumed age
(Hirt et al., 1963; Luck et al., 1980; Luck and Allegre, 1983). Naldrett and Libby (1948)
estimated the half-life at 4 x 10¹² years. One of the earliest attempts to determine the
187Re half-life by Hirt et al. (1963), using molybdenite samples of known age, yielded a
value of 43 ± 5 Ga, which is similar to a value of 42.8 ± 2.4 Ga obtained by Re-Os
measurements in iron meteorites of an assumed age of 4.55 Ga (Luck et al., 1980). A few
years later, Luck and Allegre (1983) provided a revised decay constant of 1.52 ± 0.04 x
10-11 y-1 that yielded a half-life of 45.6 ± 1.2 Ga. Direct measurements of 187Os
production from an osmium-free rhenium solution provided similar values of 43.5 ± 1.3
Ga and 42.3 ± 1.3 Ga (Lindner et al., 1986; Lindner et al., 1989). The latter value for the
rhenium 187 half-life (42.3 ± 1.3 Ga) and the corresponding decay constant (1.64 x 10-
11y-1) were used in multiple Re-Os determinations until the late ‘90s. Only recently, and
after new Re-Os age determinations on iron meteorites, has a more precise value been
obtained (Smoliar et al., 1996). The current 187Re half-life is considered to be 41.5 Ga
with a decay constant of 1.666 ± 0.017 x 10⁻¹¹ y-1 (1.02% error) (Shen et al., 1996;
Smoliar et al., 1996). The error of the decay constant is 1%, although a lower uncertainty
(0.31%) was cited by Smoliar et al. (1996) using their particular spike solutions and
hence, only Re-Os ages using spikes calibrated with this group’s (University of

42
Maryland) spike solutions can be reported with a 0.31% uncertainty for the decay
constant. In other cases a 1% error should be considered.
Detailed descriptions of techniques and the historical background of the
determination of the rhenium 187 decay constant and half-life are provided by Wolf and
Johnston (1962), Lindner et al. (1989), Dickin (1995) and Begemann et al. (2001).
Distribution and behavior of Re and Os
Re and Os are chalcophile (“sulphur-loving”) and siderophile (“iron-loving”)
elements (Luck et al., 1980). This means that Re and Os are concentrated in sulfides
rather than associated silicate minerals and that they must have been concentrated in the
metallic core during core segregation. Furthermore, Os is compatible to highly
compatible relative to Re during partial melting of the mantle, and hence the crust will
evolve to high Re/Os and high 187Os/188Os ratios. The Re-Os geochemical behavior is in
contrast with the other more common isotopic systems (i.e. Rb-Sr, Sm-Nd). These
elements are lithophile in nature (“silica-loving”) and tend to concentrate in silicate
minerals, they also behave in a very similar way under partial melting yielding similar
parent/daughter ratios in the crust and mantle reservoir. The Re-Os system, then, is a
unique geochemical tool to evaluate the relative contributions of crust and mantle in
petrogenesis and in the formation of ore deposits. High 187Os/188Os ratios (≥ 0.2),
compared to the chondritic ratio of the mantle (~ 0.13; Meisel et al., 2001), may indicate
a crustal source for the osmium and, by inference, other metals in the sulfide minerals

43
that contain the osmium. The elevated 187Os/188Os ratio in the crust (0.2-10), compared to
mantle values (~0.11-0.15), can be used to readily discern between different reservoirs.
The distribution of rhenium and osmium in sulfide minerals appears to be
heterogeneous (the “nugget effect”) and thus multiple analyses of a single sulfide sample
can yield an isochron (Freydier et al., 1997; Ruiz et al., 1997). Therefore, both the age
and initial isotopic composition (and thus the source of osmium) can be determined
directly on major ore-forming minerals.
Numerous studies have shown open system behavior of the Re-Os isotopic system
(Marcantonio et al., 1993; McCandless et al., 1993; Marcantonio et al., 1994; Foster et
al., 1996; Lambert et al., 1998; Xiong and Wood, 1999, 2000) in various sulfide phases.
Limited experimental data exists on diffusion parameters and closure temperatures for Re
and Os in different mineral phases. Experimental results on pyrite (FeS2) and pyrrhotite
(FeS) show that for the latter the closure temperature is estimated between 300 to 400 ºC,
whereas for pyrite it is around 500 ºC (Brenan et al., 2000). A similar closure temperature
has been estimated for molybdenite (Suzuki et al., 1996). Although no experimental data
exist for other mineral phases, some interpretations can be made based on observations
and comparison between phases from a single deposit. In the Urad-Henderson porphyry
copper deposit, magnetite samples appear to remain closed to disturbance, whereas
associated sulfides show open system behavior (Ruiz and Mathur, 1997). In the Lince-
Estafania manto deposit in Chile, chalcocite and bornite remained closed and yielded a
Re-Os isochron, whereas hematite clearly shows disturbance (Trista et al., in
preparation).

44
These studies provide evidence for open system behavior of the Re-Os system as
a result of different processes (i.e. metamorphism, hydrothermal alteration,
recrystallization) and hence special care should be taken in the interpretation of initial
osmium ratios. The construction of isochrons from a suite of cogenetic samples is
suggested to assess closed system behavior and to permit proper determination of initial
Os isotopic composition (Lambert et al., 1998).
Analytical Techniques
Re and Os concentrations are determined by isotope dilution using tracer
solutions of known composition (spikes). In general, these spikes are enriched in 185 for
Re and 190 for Os. Typically, rock and mineral analyses require large amounts of sample
(1-50 g) due to the very low concentrations at the parts per billion (ppb) and/or parts per
trillion (ppt) range. Dissolution of samples is achieved using either (1) fusion, (2) fire–
assay, or (3) digestion methods. In the fusion technique the sample is mixed with a flux
(sodium peroxide) in a zirconium or graphite crucible. In fire-assay techniques, the
sample is fused with a mixture of sodium borate, sodium carbonate, silica, sulphur and
nickel powder. Os is then scavenged into a nickel sulfide bead, which is later dissolved
with HCl. The resulting solution is filtered, and the residue retained on the filter paper is
analyzed for PGEs (Esser and Turekian, 1988; Hoffman et al., 1978). In acid digestion
methods the spiked sample is dissolved in Teflon digestion vessels (Walker, 1988) or
borosilicate glass tubes (Carius tubes) (Shirey and Walker, 1995) using a combination of
HF, HCl and ethanol for Teflon digestions, or a combination of nitric and hydrochloric

45
acids (aqua regia) for the Carius tube method.
After digestion, Os is distilled from the acid solution (perchloric, Lichte et al.,
1986); sulfuric, Shirey and Walker, 1995; Walker et al., 1988; and aqua regia) as a
tetroxide (OsO4). The oxidation of Os can be achieved using different oxidants such as
ceric sulfate (Walker et al., 1988), or aqua regia (Shirey and Walker, 1995). The OsO4 is
trapped into NaOH, a 1:3 mixture of ethanol:HCl or HBr (Walker, 1988) solutions. Re is
later separated by solvent extraction (Yatirajam and Kakkar, 1970) or by anion-exchange
chromatography (Morgan and Walker, 1989).
Early analytical techniques included colorimetry and neutron activation analysis
(NAA) (Hoffman et al., 1978; Morgan et al., 1981). Other techniques that have been used
are: atomic absorption spectrometry (AAS), laser microprobe mass analyzer (LAMMA)
(Lindner et al., 1986; Lindner et al., 1989), secondary mass spectrometry (SIMS) (Luck
et al., 1980; Luck and Allegre, 1983), accelerator mass spectrometry (AMS) (Fehn et al.,
1986), resonance ionization mass spectrometry (RIMS) (Walker et al., 1988; Morgan and
Walker, 1989), inductively-coupled plasma mass spectrometry (ICP-MS), negative
thermal ionization mass spectrometry (NTIMS) (Creaser et al., 1991; Volkening et al.,
1991), and more recently laser ablasion multi-collector inductively-coupled plasma mass
spectrometry (LA- MC -ICPMS) (Hirata et al., 1998; Pearson et al., 2002).
Re and Os analyses using NTIMS have provided a great improvement in
sensitivity and precision with analyses at the parts per trillion level.

46
Re-Os applications in mineral deposits
Since Re and Os are chalcophile and siderophile then this system is ideal for the
study of sulfide minerals and associated mineral deposits. Early studies concentrated on
mineral deposits where Re and Os are concentrated at the ppb level, namely Cu-Ni
magmatic deposits and PGE deposits.
Magmatic sulfide ore deposits
Re-Os isotopic data from several magmatic Ni-Cu-Co deposits (Fig. A1) indicate
that in most cases the sulfide mineralization is derived from crustal contamination of
mantle melts. In the impact-generated Sudbury Igneous Complex (SIC) in Ontario,
Canada, several Re-Os studies indicate that ores formed at ca. 1850 Ma and have
radiogenic initial 187Os/188Os ratios ranging from 0.5 to 1.0 (γOs = +350 to +817) (Dickin
et al., 1992; Morgan et al., 2002; Walker et al., 1991). In the Sally Malay deposit,
Australia, a Re-Os isochron age for sulfide minerals yielded an age of 1893 ± 57 Ma, and
a very radiogenic initial osmium (γOs = +950 to +1300) (Sproule et al., 1999). A much
wider variation of γOs (+200 to +1127) values was obtained for sulfides of the Voisey’s
Bay deposit, Canada (Lambert et al., 1999; Lambert et al., 2000) and the Babbitt Cu-Ni
deposit (γOs = +500 to +1200) in the Duluth Complex, USA (Ripley et al., 1999). γOs
values ranging between +642 and +962 from oxides and sulfides were also reported for
deposits in the Suwalki Anorthosite Massif, Poland (Morgan et al., 2000).
On the other hand, komatiite-associated Ni sulfide ores from the Kambalda-
Perseverance-Mount Keith deposits, Australia, show very low γOs values (-0.1 ± 0.3)

47
indicating a derivation from a mantle source (Foster et al., 1996). Similarly, Re-Os data
for Cu-Ni sulfides from the Noril’sk-Talnakh-Kharaelakh intrusions (Siberia, Russia) are
consistent with a mantle source for the osmium (Walker et al., 1994) showing low γOs
values (<10). The Re-Os data coupled with Pb and Nd isotopic studies suggested that
these intrusions were the result of the involvement of at least three isotopically distinct
sources that resemble mantle sources for certain oceanic island basalts, such as some
Hawaiian basalts (Walker et al., 1994). Marcantonio et al. (1994) found radiogenic initial
Os ratios (γOs = +1.3 to +75) in samples from the Wellgreen Ni-Cu-PGE intrusion,
Alaska. They interpreted these radiogenic values as the product of a post-crystallization
alteration by hydrothermal fluids that remobilized Os from crustal rocks, however, the
PGE mineralization was largely derived from mantle melts (Marcantonio et al., 1994).
This work made two important contributions: (1) that caution should be used when
interpreting highly radiogenic initial ratios, which in some cases can erroneously be
attributed to crustal assimilation rather than to late post deposition hydrothermal
alteration, and (2) that there is evidence for remobilization of Re and Os by hydrothermal
fluids.
Early work on the Stillwater Complex, Montana, showed that both sulfides and
chromites have variable γOs (+1to >+20). These results were interpreted as a derivation
from two different sources: a mantle source with chondritic Os composition and a second
mantle melt that had been contaminated with older crust.
Other Cu-Ni deposits, such as the Radio Hill deposit in Western Australia are
only moderately radiogenic (γOs = 17 ± 3) (Frick et al., 2001).

48
Numerous studies have focused on the Bushveld Igneous Complex (BIC), either
by analyzing chromites or PGE mineralization. Re-Os determinations on single laurite
([Ru, Ir, Os]S2) grains from the Merensky Reef are consistently high and radiogenic
(initial osmium range between 0.17-0.18) (Hart and Kinloch, 1989). Bulk rock
(McCandless and Ruiz, 1991) and chromitite 187Os/188Os initial ratios (McCandless et al.,
1999; Schoenberg et al., 1999), as well as pyroxenite rocks (Schoenberg et al., 1999),
also show a strong radiogenic osmium component indicating that crustal contamination
played an important role in the formation of the Bushveld Complex.
Barra et al. (in preparation, Appendix D) presented a seven point isochron with
sulfides from the Platreef, in the northern limb of the BIC. The initial 187Os/188Os ratio of
0.207, determined by these authors, is clearly higher than the mantle value at the time of
emplacement (~0.11 at 2.05 Ga), and suggests that the osmium in the sulfides has a
strong crustal component. Furthermore, the value obtained is much higher than the values
obtained in laurite grains from the Merensky Reef (Hart and Kinloch, 1989), and for
chromitites of the Critical Zone (McCandless et al., 1999; Schoenberg et al., 1999). This
high initial Os ratio for sulfides of the Platreef suggests that a higher degree of
assimilation of crustal rocks, compared to what has been suggested for the Merensky
Reef (McCandless et al., 1999), was necessary to achieve this high value.
Porphyry Cu-Mo and epithermal deposits
Freydier et al. (1998) reported the first work on sulfides from porphyry Cu
systems. They analyzed different sulfide phases (pyrite, bornite, chalcopyrite, and

49
sphalerite) from El Teniente, Chile, and obtained calculated initial osmium ratios
between 0.17-0.22. Similar initial values (0.2-1.1) were also obtained from pyrites of
Andacollo, Chile (Freydier et al., 1997). This work provided evidence that low Re and
Os concentrations could effectively be determined on diverse sulfide minerals.
Following the work of Freydier et al. (1997), Mathur et al. (2000a) studied five deposits
from Chile (Chuquicamata, El Salvador, Quebrada Blanca, Collahuasi, Cerro Colorado)
and one deposit from Argentina (Agua Rica). Ages and initial osmium ratios were
obtained using the isochron method for Chuquicamata and El Salvador (Fig. A2, A3,
A4). Additionally, calculated 187Os/188Os initial ratios were presented for the other
deposits. A major conclusion of this study revealed a correspondence between the initial
ratio and copper tonnage, with large deposits having a higher proportion of mantle
osmium (Mathur et al., 2000a) than smaller deposits. Further, in both large and relatively
smaller deposits, the crust plays an active role but it is more significant in smaller
deposits. Barra et al. (2003) presented an isochron age for a porphyry Cu deposit from
the American Southwest province (Bagdad, Arizona, USA), with pyrite samples that
yielded an eight point isochron age of 77 ± 15 Ma (2σ) and an initial 187Os/188Os ratio of
2.1 ± 0.8 (MSWD = 0.90) (Fig. A6). These results indicate that a significant part of the
metals and magmas may have a crustal source as was previously suggested in other
copper deposits and districts in Arizona, using other isotopic techniques (e.g. Barra et
al., 2003). Further Re-Os evidence that supports a significant crustal component for the
source of osmium contained in ore minerals, comes from the Grasberg Cu-Au deposit,
Irian Jaya (Mathur et al., 2000b). In this case not only an isochron age (Fig. A5) with its

50
associated initial ratio was determined but also a mixing line between two sources or end
members (the porphyry style mineralization and possibly shales) was recognized. This
fact suggested that the gold in this deposit might have a sedimentary source (Mathur et
al., 2000b).
Regardless of these successful examples, there are numerous cases where the
system has been shown to be disturbed by possible remobilization of Re and/or Os (open
system behavior). In La Caridad deposit, Mexico, numerous analyses on chalcopyrite
and pyrite, from the phyllic and potassic zones, show evidence of isotopic
disequilibrium, and hence no isochron could be obtained (Fig. A7, A8). For this reason,
initials calculated using a Re-Os molybdenite age of 54 Ma are not reliable, and in some
cases yielded negative numbers, further supporting the idea that the system is in
disequilibrium.
It has been suggested that low-level, highly radiogenic (LLHR) sulfide minerals
recognized by 187Re/188Os ratios of ≥ 5000, must be plotted in 187Re-187Os space in order
to obtain meaningful precise ages (Stein et al., 2000). Such plotting is an alternative to
the use of the traditional 187Re/188Os versus 187Os/188Os isochron plots, if only age
information is required. However, if information pertaining to the source of metals is
required, then one must use the 187Re/188Os versus 187Os/188Os isochron plot. Contrary to
the assertions of Stein et al. (2000), reliable geochronological and tracer information has
been obtained using the 187Re/188Os versus 187Os/188Os isochron plot. The isochrons for
the El Salvador (Chile) (Fig. A3), Chuquicamata (Chile) (Fig. A4), Grasberg (Irian Jaya,
Indonesia) (Fig. A5) and Bagdad (Arizona, USA) (Fig. A6) deposits all show samples

51
with 187Re/188Os ratios greater than 5,000 (Mathur et al., 2000a; Mathur et al., 2000b;
Barra et al., 2003) and provide ages that are in excellent agreement with other radiogenic
techniques (U-Pb, Ar-Ar).
Concentrations of Re and Os for sulfide minerals in porphyry copper deposits
from Mexico and Chile are shown in Figure A9. In general, concentrations for porphyry
Cu-Mo deposits are less than 25 ppt Os and less than 20 ppb Re.
Regarding epithermal deposits, only a single study using Re-Os isotopes has been
published (Mathur et al., 2003). Here, Mathur et al. (2003) determined a high Os initial
ratio for gold-rich sulfides from the California deposit in the Bucaramanga district,
Colombia (Fig. A2). The Re-Os isochron age obtained (57 ± 10Ma) is in good agreement
with previous K-Ar ages and supports a genetic link between the epithermal system and a
porphyry copper system. The high associated initial ratio (1.20 ± 0.13) suggests a crustal
source for the Os.
Fe Oxide Cu-Au and Magnetite deposits
The world class Candelaria Fe-Cu-Au deposit (470 Mt at 0.95% Cu, 0.22 g/t Au)
is one of the most important copper producers in Chile. The age of this deposit has been
constrained, among other techniques, by Re-Os molybdenite ages and by a Re-Os
isochron using chalcopyrite-pyrite-magnetite (Mathur et al., 2002). The associated initial
187Os/188Os ratio of 0.36 ± 0.10 (Fig. A2) coupled with calculated 187Os/188Os initial ratios
of magmatic magnetite from neighboring granitoids (0.20-0.41) indicates a similar Os
source for the granitoids and the Candelaria mineralization. The data also suggests that

52
mineralizing fluids are most likely magmatic in origin, but that other types of fluids
cannot be rejected.
On the other hand, magnetite-apatite deposits in northern Chile, have calculated
initial osmium ratios that are much more radiogenic (1.2-8.4), and suggest that the
magnetite ore is probably derived from leaching of sedimentary rocks by basin-derived,
non-magmatic metalliferous brines (Mathur et al., 2002).
Volcanogenic Massive Sulfide (VMS) Deposits
Limited Re-Os studies have been centered on volcanogenic massive sulfide
deposits. In the Tharsis and Rio Tinto deposits of the Iberian Pyrite Belt, Re-Os data
(isochron age of 346 ± 26 Ma, initial Os ratio ~0.69) on pyrite-rich samples indicate a
crustal origin for the osmium contained in the sulfides (Mathur et al., 1999) (Fig. A2).
More recent studies on the Kuroko deposits of Japan (Terakado, 2001a, b) (Fig. A2), also
show relatively high 187Os/188Os initial ratios (~0.6-0.8), but in these cases, the high
initial ratios are attributed to interaction with contemporaneous seawater and hence a
seawater origin for the osmium contained in the sulfides is assumed.
Sediment-hosted Stratiform Deposits
In the Zambian Copperbelt, the second world’s largest sediment-hosted stratiform
copper province, different genetic models have been proposed ranging from syngenetic to
epigenetic. Determination of a proper genetic model relies on the fundamental
determination of the age of mineralization. Mineralization ages obtained using a wide

53
variety of isotopic techniques on associated silicate phases all suggested a late
metamorphic timing associated to the Lufilian orogeny. Barra et al. (in preparation,
Appendix C), using rhenium and osmium systematics applied to the ore minerals
determined two mineralization events. In the Konkola deposit, a Re-Os isochron yielded
a mineralization age of 825 ± 69 Ma with an 187Os/188Os initial ratio of 11.4 ± 1.7. A
second isochron with sulfide samples from the Nchanga, Chibuluma and Nkana deposits,
yielded an isochron age of 576 ± 41 Ma and 187Os/188Os initial of 1.37 ± 0.32, consistent
with the Lufilian Orogeny of Pan-African age (Barra et al., 2004) (Fig. A2). Both
isochrons show high osmium initial ratios, with the older event being significantly more
radiogenic that the Pan-African event. This suggests that the mineralizing fluids accessed
different sources of osmium and possibly different rock types. Regardless of the possible
source of osmium it is clear that it has a crustal origin. The results obtained by Barra et al.
(in preparation) support a long-lived period of multistage mineralization linked to the
evolution of the basin.
Concentration of Re and Os in different deposits from the Zambian Copperbelt
are highly variable and can reach as high as 1.5 ppb Os and 100 ppb Re, with average
concentrations less than 0.5 ppb Os and 40 ppb Re (Fig. A10).
In the Red Dog Zn-Pb-Ag deposit, Alaska (Fig. A2), a Re-Os isochron provided a
mineralization age of 338.3 ± 5.8 Ma, consistent with previous estimates (Morelli et al.,
2004). However, the poorly constrained 187Os/188Os initial ratio (0.20 ± 0.21) does not
allow for a proper estimation of the relative contributions of crust and mantle. Regardless
of this fact, the authors suggested that the metals are more likely derived from a mantle

54
source. Morelli et al. (2004) also concluded that sphalerite is subject to disturbance and
hence it is not a reliable mineral for Re-Os geochronology.
Gold Deposits
The Witwatersrand gold province in South Africa (Fig. A2) has the largest
concentration of gold in the world. As in the Zambian Copperbelt, the genesis of the ores
is highly controversial. Two main models have been used to explain the origin of the
gold: a placer model and a hydrothermal model. By directly dating gold and associated
rounded pyrite from the Vaal Reef deposit it was possible to discriminate between the
two models (Kirk et al., 2001; Kirk et al., 2002). A Re-Os isochron for gold samples
yielded an age of 3033 ± 21 Ma [Mean Square Weighted Deviation (MSWD = 1.06) and
an initial 187Os/188Os of 0.1079 ± 0.0001, whereas analyses of rounded pyrite samples
form an isochron with an age of 2.99 ± 0.11 Ga (MSWD = 0.77) and an initial
187Os/188Os of 0.124 ± 0.036. A combined isochron for the gold samples and rounded
pyrite samples yielded an age of 3016 ± 110 Ma (MSWD = 1.9) and an initial 187Os/188Os
of 0.109 ± 0.013. The age is clearly older than that of the host conglomerates (~2.8 Ga)
and thus it supports a placer model for the formation of the Witwatersrand gold deposits.
Further, the low initial osmium ratio suggests that the gold has a mantle source.

55
Concluding Remarks
Re and Os isotopes are chalcophile and siderophile elements and hence are
concentrated in sulfide minerals. Furthermore, Re is less compatible than Os during
partial melting processes in the mantle, and this characteristic of the Re-Os system is
particularly useful in evaluating the relative contributions of mantle and crust in the
formation of ore deposits.
The slowly increasing number of Re-Os studies on different types of mineral
deposits indicate that, in most cases, at least some of the osmium contained in ore
minerals was derived from the crust. High initial 187Os/188Os ratios of sulfides and/or
oxides of diverse ages compared to the contemporaneous osmium isotopic composition
of the mantle are a clear indication of the contribution of the crust in the formation of ore
deposits. In a few cases, such as the Witwatersrand gold province, the low 187Os/188Os
initial ratio clearly indicates a mantle origin for the gold. Similarly, in a few magmatic
ore deposits the initial osmium indicates low degrees of crustal contamination, and some
giant porphyry copper deposits (Chuquicamata, El Salvador, Chile) show little interaction
with the crust.
Since the Re-Os system can be disturbed by processes such as metamorphism and
hydrothermal alteration, special care should be taken in the interpretation of initial
osmium ratios. However, the construction of isochrons is a viable way to assess closed
system behavior in a suite of cogenetic samples. The Re-Os isotopic system has proven to
be a useful geochemical tool not only in determining the age of mineral deposits, but also
in determining the importance of the crust as a source of metals.

Figure A1. Location of mafic-ultramafic intrusions discussed in text. Also indicated are Re-Os data available for sulfide minerals for each magmatic ore deposit or intrusion.
56

Figure A2. Location of different types of ore deposits in which a Re-Os isochron has been obtained. See text for discussion.
57

58
0
4
8
12
16
20
0 10000 20000 30000187Re/188Os
187 O
s/18
8 Os
Age = 39.3 ± 4.2 MaInitial 187Os/188Os =0.75 ± 0.47
MSWD = 0.82
Figure A3. Re-Os isochron plot for El Salvador, Chile. Bottom three points are pyrite-chalcopyrite with orthoclase-biotite alteration. Upper three points are pyrite with sericite alteration. From Mathur et al. (2000a).
0
4
8
12
16
20
0 10000 20000 30000 40000187Re/188Os
187 O
s/18
8 Os
Age = 31.9 ± 3.2 MaInitial 187Os/188Os =1.006 ± 0.023
MSWD = 1.6
Figure A4. Re-Os isochron plot for Chuquicamata, Chile. All five points are pyrite with associated quartz-sericite alteration. From Mathur et al. (2000a).

59
0.4
0.6
0.8
1.0
1.2
1.4
0 4000 8000 12000 16000187Re/188Os
187 O
s/18
8 Os
Age = 2.84 ± 0.54 MaInitial 187Os/188Os =0.563 ± 0.049
MSWD = 4.5
Figure A5. Isochron plot for Grasberg, Irian Jaya, recalculated using data of Mathur et al. (2000b).
0
10
20
30
40
50
0 10000 20000 30000187Re/188Os
187 O
s/18
8 Os
Age = 77 ± 15 MaInitial 187Os/188Os =2.12 ± 0.82
MSWD = 0.90
Figure A6. Eight point isochron with pyrite samples from Bagdad, Arizona. Lower cluster of points yielded and isochron with an age of 74 ± 16 Ma (MSWD = 1.08) and an initial of 2.30 ± 0.88. From Barra et al. (2003).

60
0
10
20
30
0 4000 8000 12000 16000 20000 24000
187Re/188Os
187 O
s/18
8 Os
Pyrit e
Chalcopyr it eGalena
Figure A7. Re-Os data for different sulfide phases for La Caridad porphyry copper deposit.
0
10
20
30
0 4000 8000 12000 16000 20000 24000
187Re/188Os
187 O
s/18
8 Os
Pot assicPhyllicPegmat it e-Lat e
Figure A8. Re-Os data for different sulfide phases for La Caridad porphyry copper deposit as shown above, but here plotted according to associated alteration style.

61
0
20
40
60
80
100
120
140
160
180
0 50 100 150 200 250 300
Os (ppt)
Re
(ppb
)
Tameapa
Piedras Verdes
Cuatro Hermanos
Nacozari
Qda Blanca
Chuquicamata
El Salvador
Cerro Colorado
Escondida
Collahuasi
Figure A9. Plot showing Re and Os concentrations from porphyry copper deposits from Chile and Mexico.

62
Figure A10. Re and Os concentrations for different deposits of the Zambian Copperbelt.
0
10
20
30
40
50
60
70
80
90
100
0.0 0.5 1.0 1.5
Os (ppb)
Re
(ppb
)
SambaMufuliraKonkolaNchangaChibulumaNkana

63
REFERENCES
Barra, F., Ruiz, J., Mathur, R., and Titley, S., 2003, A Re-Os study of sulfide minerals from the Bagdad porphyry Cu-Mo deposit, northern Arizona, USA: Mineralium Deposita, v. 38, p. 585-596.
Barra, F., Broughton, D., Ruiz, J., and Hitzman, M. W., 2004, Multi-stage mineralization
in the Zambian Copperbelt based on Re-Os isotope constraints: Geological Society of America, Abstract with Programs, Denver, Colorado, USA, 2004.
Begemann, F., Ludwig, K. R., Lugmair, G. W., Min, K., Nyquist, L. E., Patchett, P. J.,
Renne, P. R., Shih, C.-Y., Villa, I. M., and Walker, R. J., 2001, Call for an improved set of decay constants for geochronological use: Geochimica et Cosmochimica Acta, v. 65, p. 111-121.
Brenan, J. M., Cherniak, D. J., and Rose, L. A., 2000, Diffusion of osmium in pyrrhotite
and pyrite: implications for closure of the Re-Os isotopic system: Earth and Planetary Science Letters, v. 180, p. 399-413.
Brodzinski, R. L., and Conway, D. C., 1965, Decay of rhenium 187: Physical Review, v.
138. Cotton, F. A., and Wilkinson, G., 1988, Advance Inorganic Geochemistry, John Wiley &
Sons, 1455 p. Creaser, R. A., Papanastassiow, D. A., and Wasserburg, G. J., 1991, Negative thermal
ion mass spectrometry of osmium, rhenium, and iridium: Geochimica et Cosmochimica Acta, v. 55, p. 397-401.
Dickin, A. P., 1995, Radiogenic Isotope Geology, Cambridge University Press, 490 p. Dickin, A. P., Richardson, J. M., Crocket, J. H., McNutt, R. H., and Peredery, W. V.,
1992, Osmium isotope evidence for a crustal origin of platinum group elements in the Sudbury nickel ore, Ontario, Canada: Geochimica et Cosmochimica Acta, v. 56, p. 3531-3537.
Esser, B. K., and Turekian, K. K., 1988, Accretion rate of extraterrestrial paricles
determined from osmium isotope systematics of Pacific pelagic clay and manganese nodules: Geochimica et Cosmochimica Acta, v. 52, p. 1383-1388.
Faure, G., 1986, Principles of Isotope Geology: New York, John Wiley & Sons, 589 p.

64
Fehn, U., Teng, R., Elmore, D., and Kubik, P. W., 1986, Isotopic composition of osmium in terrestrial samples determined by accelerator mass spectrometry: Nature, v. 323, p. 707-710.
Foster, J. G., Lambert, D. D., Frick, L. R., and Maas, R., 1996, Re-Os isotopic evidence
for genesis of Archean nickel ores from uncontaminated komatiites: Nature, v. 382, p. 703-706.
Freydier, C., Ruiz, J., Chesley, J., McCandless, T., and Munizaga, F., 1997, Re-Os
isotope systematics of sulfides from felsic igneous rocks: Application to base metal porphyry mineralization in Chile: Geology, v. 25, p. 775-778.
Frick, L. R., Lambert, D. D., and Hoatson, D. M., 2001, Re-Os dating of the Radio Hill
Ni-Cu deposit, west Pilbara Craton, Western Australia: Australian Journal of Earth Scineces, v. 48, p. 43-47.
Gramlich, J. W., Murphy, T. J., Gardner, E. L., and Shields, W. R., 1973, Absolute
isotopic abundance ratio and atomic weight of a reference sample of rhenium: Journal of Research of the National Bureau of Standards. Section A, Physics and Chemistry, v. 77A, p. 691-698.
Hart, S. R., and Kinloch, E. D., 1989, Osmium isotope systematics in Witwatersrand and
Bushveld ore deposits: Economic Geology, v. 84, p. 1651-1655. Hirata, T., Hattori, M., and Tanaka, T., 1998, In-situ osmium isotope analyses of
iridosmines by laser albation-multiple collector-inductively coupled plasma mass spectrometry: Chemical Geology, v. 144, p. 269-280.
Hirt, B., Tilton, G. R., Herr, W., and Hoffmeister, W., 1963, The half life of 187Re, in
Geiss, J., and Goldberg, E., eds., Earth Science Meteoritics, North Holland, p. 273-280.
Hoffman, E. L., Naldrett, A. J., Van Loon, J. C., Hancock, R. G. V., and Manson, A.,
1978, The determination of all the platinum group elements and gold in rocks and ore by neutron activition analysis after preconcentration by nickel sulphide fire-assay technique on large samples: Analytica Chimica Acta, v. 102, p. 157-166.
Kirk, J., Ruiz, J., Chesley, J., Titley, S., and Walshe, J., 2001, A detrital model for the
origin of gold and sulfides in the Witwatersrand basin based on Re-Os isotopes: Geochimica et Cosmochimica Acta, v. 65, p. 2149-2159.
Kirk, J., Ruiz, J., Chesley, J., Walshe, J., and England, G., 2002, A major archean, gold-
and crust-forming event in the Kaapvaal craton, South Africa: Science, v. 297, p. 1856-1858.

65
Lambert, D. D., Foster, J. G., Frick, L. R., Hoatson, D. M., and Purvis, A. C., 1998,
Application of the Re-Os isotopic system to the study of Precambrian magmatic sulfide deposits of Western Australia: Australian Journal of Earth Sciences, v. 45, p. 265-284.
Lambert, D. D., Foster, J. G., Frick, L. R., Li, C., and Naldrett, A. J., 1999, Re-Os
isotopic systematics of the Voisey's Bay Ni-Cu-Co magmatic ore system, Labrador, Canada: Lithos, v. 47, p. 69-88.
Lambert, D. D., Frick, L. R., Foster, J. G., Li, C., and Naldrett, A. J., 2000, Re-Os
isotope systematics of the Voisey's Bay Ni-Cu-Co magmatic sulfide system, Labrador, Canada: II. Implications for parental magma chemistry, ore genesis, and metal redistribution: Economic Geology, v. 95, p. 867-888.
Lichte, F. E., Wilson, S. M., Brooks, R. R., Reeves, R. D., Holzbecher, J., and Ryan, D.
E., 1986, New method for the measurement of osmium isotopes applied to a New Zeland Cretaceous/Tertiary bounday shale: Nature, v. 322, p. 816-817.
Lindner, M., Leich, D. A., Borg, R. J., Russ, G. P., Bazan, J. M., Simons, D. S., and
Date, A. R., 1986, Direct laboratory determination of 187Re half-life: Nature, v. 320, p. 246-248.
Lindner, M., Leich, D. A., Russ, G. P., Bazan, J. M., and Borg, R. J., 1989, Direct
determination of the half-life of 187Re: Geochimica et Cosmochimica Acta, v. 53, p. 1597-1606.
Luck, J. M., and Allegre, C. J., 1983, 187Re-187Os systematics in meteorites and
cosmochemical consequences: Nature, v. 302, p. 130-132. Luck, J. M., Birck, J. L., and Allegre, C. J., 1980, 187Re-187Os systematics in
meteorites: early chronology of the Solar System and age of the Galaxy: Nature, v. 283, p. 256-259.
Marcantonio, F., Zindler, A., Reisberg, L., and Mathez, E. A., 1993, Re-Os isotopic
systematics in chromitites from the Stillwater Complex, Montana: Geochimica et Cosmochimica Acta, v. 57, p. 4029-4037.
Marcantonio, F., Reisberg, L., Zindler, A., Wyman, D., and Hulbert, L., 1994, An
isotopic study of the Ni-Cu-PGE-rich Wellgreen intrusion of the Wrangellia Terrane: Evidence for hydrothermal mobilization of rhenium and osmium: Geochimica et Cosmochimica Acta, v. 58, p. 1007-1017.

66
Mathur, R., Ruiz, J., and Tornos, F., 1999, Age and sources of the ore at Tharsis and Rio Tinto, Iberian Pyrite Belt, from Re-Os isotopes: Mineralium Deposita, v. 34, p. 790-793.
Mathur, R., Ruiz, J., and Munizaga, F., 2000a, Relationship between copper tonnage of
Chilean base-metal porphyry deposits and Os isotope ratios: Geology, v. 28, p. 555-558.
Mathur, R., Ruiz, J., Titley, S., Gibbins, S., and Margotomo, W., 2000b, Different crustal
sources for Au-rich and Au-poor ores of the Grasberg Cu-Au porphyry deposit: Earth and Planetary Science Letters, v. 183, p. 7-14.
Mathur, R., Marschik, R., Ruiz, J., Munizaga, F., Leveille, R. A., and Martin, W., 2002,
Age of mineralization of the Candelaria Fe oxide Cu-Au deposit and the origin of the Chilean iron belt, based on Re-Os isotopes: Economic Geology, v. 97, p. 59-71.
Mathur, R., Ruiz, J., Herb, P., Hahn, L., and Burgath, K. P., 2003, Re-Os isotopes
applied to the epithermal gold deposits near Bucaramanga, northeastern Colombia: Journal of South American Earth Sciences, v. 15, p. 815-821.
McCandless, T. E., and Ruiz, J., 1991, Osmium isotopes and crustal sources for
platinum-group mineralization in the Bushveld Complex, South Africa: Geology, v. 19, p. 1225-1228.
McCandless, T. E., Ruiz, J., and Campbell, A. R., 1993, Rhenium behavior in
molybdenite in hypogene and near-surface environments: Implications for Re-Os geochronometry: Geochimica et Cosmochimica Acta, v. 57, p. 889-905.
McCandless, T. E., Ruiz, J., Adair, B. I., and Freydier, C., 1999, Re-Os isotope and
Pd/Ru variations in chromitites from the Critical Zone, Bushveld Complex, South Africa: Geochimica et Cosmochimica Acta, v. 63, p. 911-923.
Meisel, T., Walker, R. J., Irving, A. J., and Lorand, J. P., 2001, Osmium isotopic
compositions of mantle xenoliths: a global perspective: Geochimica et Cosmochimica Acta, v. 65, p. 1311-1323.
Morelli, R. M., Creaser, R. A., Selby, D., Kelley, K. D., Leach, D. L., and King, A. R.,
2004, Re-Os sulfide geochronology of the Red Dog sediment-hosted Zn-Pb-Ag deposit, Brooks Range, Alaska: Economic Geology, v. 99, p. 1569-1576.
Morgan, J. W., and Walker, R. J., 1989, Isotopic determinations of rhenium and osmium
in meteorites by using fusion, distillation, and ion-exchange separations: Analytica Chimica Acta, v. 222, p. 291-300.

67
Morgan, J. W., Wandless, G. A., Petrie, R. K., and Irving, A. J., 1981, Composition of
the Earth Upper Mantle - I. Siderophile trace elements in ultramafic nodules: Tectonophysics, v. 75, p. 47-67.
Morgan, J. W., Stein, H. J., Hannah, J. L., Markey, R. J., and Wiszniewska, J., 2000, Re-
Os study of Fe-Ti-V oxide and Fe-Cu-Ni sulfide deposits, Suwalki Anorthosite Massif, northeast Poland: Mineralium Deposita, v. 35, p. 391-401.
Morgan, J. W., Walker, R. J., Horan, M. F., Beary, E. S., and Naldrett, A. J., 2002,
190Pt-186Os and 187Re-188Os systematics of the Sudbury Igneous Complex, Ontario: Geochimica et Cosmochimica Acta, v. 66, p. 273-290.
Naldrett, S. N., and Libby, W. F., 1948, Natural radioactivity of rhenium: Physical
Review, v. 73, p. 487-493. Payne, J. A., and Drever, R., 1965, An investigation of the beta decay of rhenium to
osmium with high temperature proportional counters: Unpub. Ph.D. disssertation thesis, University of Glasgow.
Pearson, N. J., Alard, O., Griffin, W. L., Jackson, S. E., and O'Reilly, S. Y., 2002, In situ
measurement of Re-Os isotopes in mantle sulfides by laser ablasion multicollector-inductively coupled plasma mass spectrometry: Analytical methods and preliminary results: Geochimica et Cosmochimica Acta, v. 66, p. 1037-1050.
Ripley, E. M., Lambert, D. D., and Frick, L. R., 1999, Re-Os, Sm-Nd, and Pb isotopic
constraints on mantle and crustal contributions to magmatic sulfide mineralization in the Duluth Complex: Geochimica et Cosmochimica Acta, v. 62, p. 3349-3365.
Rouschias, G., 1974, Recent advances in the chemistry of rhenium: Chemical Reviews, v.
74, p. 531-566. Ruiz, J., Freydier, C., McCandless, T., and Chesley, J., 1997, Re-Os isotope systematics
from base metal porphyry and manto-type mineralization in Chile: International Geology Review, v. 39, p. 317-324.
Schoenberg, R., Kruger, F. J., Nagler, T. F., Meisel, T., and Kramers, J. D., 1999, PGE
enrichment in chromitite layers and the Merensky Reef of the western Bushveld Complex; a Re-Os and Rb-Sr isotope study: Earth and Planetary Science Letters, v. 172, p. 49-64.
Shen, J. J., Papanastassiou, D. A., and Wasserburg, G. J., 1996, Precise Re-Os
determinations and systematics of iron meteorites: Geochimica et Cosmochimica Acta, v. 60, p. 2887-2900.

68
Shirey, S. B., and Walker, R. J., 1995, Carius tube digestion for low-blank rhenium-
osmium analysis: Analytical Chemistry, v. 67, p. 2136-2141. Shirey, S. B., and Walker, R. J., 1998, The Re-Os isotope system in cosmochemistry and
high-temperature geochemistry: Annual Review of Earth and Planetary Sciences, v. 26, p. 423-500.
Smoliar, M. I., Walker, R. J., and Morgan, J. W., 1996, Re-Os ages of Group IIA, IIIA,
IVA, and IVB iron meteorites: Science, v. 271, p. 1099-1102. Snow, J. E., and Reisberg, L., 1995, Os isotopic systematics of the MORB
mantle:Results from altered abyssal peridotites: Earth and Planetary Science Letters, v. 133, p. 411-421.
Sproule, R. A., Lambert, D. D., and Hoatson, D. M., 1999, Re-Os isotopic constraints on
the genesis of the Sally Malay Ni-Cu-Co deposit, East Kimberley, Western Australia: Lithos, v. 47, p. 89-106.
Stein, H. J., Morgan, J. W., and Schersten, A., 2000, Re-Os dating of low-level highly
radiogenic (LLHR) sulfides: the Harnas gold deposit, Southwest Sweden, records continental-scale tectonic events: Economic Geology, v. 95, p. 1657-1671.
Sutulov, A., 1970, Molybdenum and rhenium recovery from porphyry coppers:
Concepcion, Universidad de Concepcion, 252 p. Suzuki, K., Shimizu, H., and Masuda, A., 1996, Re-Os dating of molybdenites from ore
deposits in Japan: Implications for the closure temperature of the Re-Os system for molybdenite and the cooling history of molybdenum ore deposits: Geochimica et Cosmochimica Acta, v. 60, p. 3151-3159.
Terakado, Y., 2001a, Re-Os dating of the Kuroko ore deposits from the Hokuroku
district, Akita Prfecture, northeast Japan: Journal of the Geological Society of Japan, v. 107, p. 354-357.
Terakado, Y., 2001b, Re-Os dating of the Kuroko ores from the Wanibuchi Mine,
Shimane Prefecture, southwestern Japan: Geochemical Journal, v. 35, p. 169-174. Völkening, J., Walczyk, T., and Heumann, K. G., 1991, Osmium isotope ratio
determinations by negative thermal ionization mass spectrometry: International Journal of Mass Spectrometry and Ion Processes, v. 105, p. 147-159.

69
Walker, R. J., 1988, Low-blank chemical separation of rhenium and osmium from gram quatities of silicate rock for measurement by resonance ionization mass spectrometry: Analytical Chemistry, v. 60, p. 1231-1243.
Walker, R. J., Shirey, S. B., and Stecher, O., 1988, Comparative Re-Os, Sm-Nd and Rb-
Sr isotope and trace element systematics for Archean komatiite flows from Munro Township, Abitibi Belt, Ontario: Earth and Planetary Science Letters, v. 87, p. 1-12.
Walker, R. J., Morgan, J. W., Naldrett, A. J., Li, C., and Fassett, J. D., 1991, Re-Os
systematics of Ni-Cu sulfide ores, Sudbury Igneous Complex, Ontario: evidence for a major crustal component: Earth and Planetary Science Letters, v. 105, p. 416-429.
Walker, R. J., Morgan, J. W., Horan, M. F., Czamanske, G. K., Krogstad, E. J.,
Fedorenko, V. A., and Kunilov, V. E., 1994, Re-Os isotopic evidence for an enriched-mantle source for the Noril'sk-type, ore-bearing intrusions, Siberia: Geochimica et Cosmochimica Acta, v. 58, p. 4179-4197.
Wolf, C. J., and Johnston, W. H., 1962, Natural radioactivity of rhenium: Physical
Review, v. 125, p. 307-310. Xiong, Y., and Wood, S. A., 1999, Experimental determination of the solubility of ReO2
and the dominant oxidation state of rhenium in hydrothermal solutions: Chemical Geology, v. 158, p. 245-256.
Xiong, Y., and Wood, S. A., 2000, Experimental quatification of hydrothermal solubility
of platinum-group elements with special reference to porphyry copper environments: Mineralogy and Petrology, v. 68, p. 1-28.
Yatirajam, V., and Kakkar, L. R., 1970, Separation of rhenium from molybdenum,
vanadium, tungsten and some other elements by tribenzylamine-chloroform extraction from phosphoric acid: Analytica Chimica Acta, v. 52, p. 555-559.

70
APPENDIX B
THE APPLICATION OF THE RE-OS ISOTOPIC SYSTEM TO THE STUDY OF
MINERAL DEPOSITS: PART 2: A CRITICAL REVIEW OF THE RE-OS
MOLYBDENITE GEOCHRONOMETER
Fernando Barra 1,2, Joaquin Ruiz 1, John T. Chesley1, Victor A.Valencia1
1 Department of Geosciences, University of Arizona, Tucson, AZ 85721, USA 2 Instituto Geología Económica Aplicada, Universidad de Concepción, Concepción, Chile
To be submitted to Ore Geology Reviews

71
Abstract
The rhenium-osmium (Re-Os) geochronometer in molybdenite has evolved
significantly during the last decade and has become a reliable dating tool in mineral
deposits. The recent explosion in Re-Os age determinations requires an update of the
current status of this important isotopic system. Highly precise ages have been obtained
using isotope dilution and the Carius tube method coupled with N-TIMS instrumentation.
Regardless of numerous new Re-Os molybdenite ages reported in the literature, the
behavior of Re and Os in molybdenite is still poorly understood and controversy remains
regarding the possible disturbance of the Re-Os isotopic system.
Previous empirical and experimental studies indicate that the Re-Os system in
molybdenites can experience disturbance by Re loss or Re gain (open system behavior),
and that the analysis of such altered samples would yield equivocal ages. On the other
hand, erroneous age determinations have recently been suggested to result from
inadequate sample preparation, which is in turn linked to the physical decoupling of Re
and 187Os observed at the micron scale within molybdenite grains. Heterogeneous
distribution of Re within molybdenite crystals has been known for years. The decoupling
effect is attributed to 187Os migration, which is redistributed within the crystal (closed
system behavior) and at the most can migrate to neighboring sulfides (open system
behavior) but not to silicates. However, the proposed analytical protocol to overcome
decoupling (homogenization of a molybdenite powder) should always yield replicable
analyses, but not necessary reliable ages, since altered portions of the molybdenite
grain(s) are well mixed with unaltered areas.

72
Clearly, post-crystallization alteration can affect molybdenite, and only through
replicate analyses of samples and/or comparison with other dating techniques, such as the
U-Pb geochronometer, is possible to determine whether the Re-Os molybdenite age
reflects a mineralization age or a post depositional event.

73
Introduction
During the last 15 years the Re-Os isotopic system has reached a degree of
maturity that has resulted in significant new isotopic information on a wide variety of
geological topics. In mineral deposits the application of the Re-Os system has evolved in
two fronts; as a geochronometer in molybdenite, and as a tracer of the source of metals
by direct determination of the source of Os contained in the ore minerals.
Molybdenite constitutes a particular case among sulfide minerals because it
contains high concentrations of Re (in the ppm to weight percent range) (Fleischer, 1959;
Sutulov, 1970) and essentially no initial or common osmium (Hirt et al., 1963; Luck and
Allegre, 1982). Hence, the Os present in molybdenite is almost entirely the product of the
decay of 187Re. As such it can be used as a single mineral geochronometer
Although the potential of molybdenite as a Re-Os geochronological tool was
recognized decades ago (Herr and Merz, 1955, 1958; Hirt et al., 1963; Luck and Allegre,
1982), numerous analytical difficulties, a lack of sensitive instrumentation and
uncertainties in the determination of the 187Re decay constant, hampered the potential use
of the Re-Os geochronometer. Since the early 1990s, the development of new and more
precise analytical techniques (Creaser et al., 1991; Völkening et al., 1991) and a better
determination of the 187Re decay constant (Shen et al., 1996; Smoliar et al., 1996), has
resulted in numerous studies using molybdenite in the direct determination of the age of
mineralization in a wide variety of ore deposits (Table B1). Notwithstanding the number
of published studies, the behavior of Re and Os in molybdenite remains poorly
understood and the possibility of post-depositional alteration remains controversial.

74
Here we present a critical review of the current status of the Re-Os molybdenite
geochronometer based on previous published peer-reviewed papers and new unpublished
information.
Re-Os isotopic systematics
Rhenium has two naturally occurring isotopes, 185Re (37.398 ± 0.016%) and 187Re
(62.602 ± 0.016%), which give and atomic weight for Re of 186.20679 ± 0.00031
(Gramlich et al., 1973). Osmium has seven natural occurring isotopes, which are 184Os
(0.023%), 186Os (1.600%), 187Os (1.510%), 188Os (13.286%), 189Os (16.251%), 190Os
(26.369%), and 192Os (40.957%). All of them are stable, and they give Os an atomic
weight of 190.2386 (Faure, 1986).
Rhenium 187 is radioactive and decays to 187Os by beta emission (Naldrett and
Libby, 1948).
187Re → 187Os + β- + ν + Q
The daughter isotope 187Os, produced from the decay of 187Re, is normally
reported relative to 188Os.

75
In the case of molybdenite the equation is simplified because (1) it contains
virtually no 188Os so normalization to this isotope is not possible, and (2) virtually all
187Os is radiogenic (i.e. the decay product of 187Re). Therefore, in equation 1, only one
unknown remains (t = time). If the equation is solved for t, the age of the molybdenite
can be determined and the age thus determined is known as a calculated age (Equation 2).
Here we avoid the term “model age”, used by some authors because it causes confusion
with model ages determined relative to a chondritic uniform reservoir “CHUR” in a
manner analogous to the Sm-Nd system.
The current value for the decay constant (λ) was determined independently by
Smoliar et al. (1996) and Shen et al. (1996). The University of Maryland (UMD) group
determined a value of 1.666 x 10⁻¹¹ a-1 corresponding to a 187Re half-life of 4.6 x 10⁻¹⁰ a
(Smoliar et al., 1996). The associated uncertainty of their determination is ± 0.31%, and it
is valid only for their particular spike solutions. This λ value is in good agreement with
the 1.66 x 10⁻¹¹ a-1 decay constant obtained by the California Institute of Technology
(Caltech) group (Shen et al., 1996), although the associated uncertainty is much higher (±
)()te(Os
Re
iOs
Os
Os
Os 11188
187
188
187
188
187−+
= λ
)(Re
Osln
T 2
1187
187
λ
+
=

76
1.02%) because of the non-stoichiometry of the ammonium hexachloro-osmate used as a
standard. Consequently, the recommended decay constant value for 187Re is 1.666 ±
0.017 x 10⁻¹¹ a-1 (Shen et al., 1996; Smoliar et al., 1996).
Analytical techniques
Re and Os concentrations are normally determined by isotope dilution using
solutions of known composition (“spikes” or “tracer solutions”). In general, the Re spike
is enriched in mass 185, whereas for Os the spike is usually enriched in mass 190. Other
alternatives have been used instead of the 190Os spike, such as an isotopically normal Os
(McCandless and Ruiz, 1993; Selby and Creaser, 2001a, b; Suzuki et al., 1993) and more
recently a double Os (188Os-190Os) spike (Markey et al., 2003).
Typically for molybdenite analysis, small amounts of sample (10-100 mg) are
required because of the very high Re and Os concentrations, but even amounts less than
one mg have been used successfully (Selby and Creaser, 2001a). The amount of sample
to be used is eventually dependant on the Re and especially the Os concentration.
Comparatively low Os molybdenite require larger amounts of sample in order to reduce
the analytical and weighing uncertainties.
Although diverse techniques have been used for sample dissolution and
subsequent isotope determinations, only the most common and currently used dissolution
techniques and analytical methods will be mentioned here.
Dissolution of samples is usually achieved using either (1) microwave digestion
(Suzuki and Masuda, 1990; Suzuki et al., 1992, 1993; Suzuki et al., 2000), (2) alkaline

77
fusion (Stein et al., 1997; Markey et al., 1998; Stein et al., 1998b) or (3) Carius tube
method (Shirey and Walker, 1995; Chesley and Ruiz, 1997; Barra et al., 2003; Selby and
Creaser, 2004). In microwave digestion, the spiked sample is dissolved in a mixture of
concentrated nitric and sulfuric acid within a Teflon (polytetrafluoroethylene-PTFE)
vessel and a microwave system. After sample decomposition, potassium dichromate
(K2Cr2O7) is added as an oxidant and the solution is then heated in the microwave system
to achieve Os oxidation. The solution is later distilled and Os is trapped in 0.1% thiourea
(Suzuki et al., 1993). Re is separated by anion-exchange chromatography (Morgan and
Walker, 1989). In alkaline fusion, the spikes and sample are mixed with a flux (sodium
hydroxide and sodium peroxide) in a zirconium or graphite crucible and fused
(McCandless et al., 1993; Stein et al., 1997; Markey et al., 1998). The fusion cake is later
dissolved and the alkaline solution is distilled to separate Os. The Carius tube method
(Shirey and Walker, 1995) is the current preferred method to achieve sample dissolution
and spike homogenization. The first recorded work that used this method for molybdenite
is by Chesley and Ruiz (1997). In this method, the molybdenite sample is introduced into
an ampoule of borosilicate glass (the Carius tube). Pre-determined amounts of 185Re and
Os spikes are added into the tube, which is partially submerged in ethanol slush so that
spikes and reagents are chilled upon introduction into the tube. The reagent is a 3:1
mixture of HNO3 (16 N) and HCl (10 N) (inverse aqua regia). Additionally, 2 to 3 mL of
hydrogen peroxide (30%) are added to ensure complete oxidation of the sample. While
the reagents, sample and spikes are still frozen, the Carius tube is sealed and then warmed
to room temperature. The tube is later heated in an oven at 240 °C for ca. 12 hrs, after

78
which complete dissolution is achieved. Os is later separated through distillation (Nägler
and Frei, 1997) or solvent extraction (Cohen and Waters, 1996). Osmium is further
purified using a microdistillation technique (Birck et al., 1997). After osmium separation,
the remaining acid solution is dried and later dissolved in 0.1 N HNO3. Re is extracted
and purified through a two-stage column using AG1-X8 (100-200 mesh) resin.
Current analytical techniques include inductively-coupled plasma mass
spectrometry (ICP-MS) (Suzuki et al., 2001; Suzuki et al., 2000; Suzuki et al., 1996), and
negative thermal ionization mass spectrometry (N-TIMS) (Creaser et al., 1991;
Völkening et al., 1991); the latter provides better precision for measuring Re and Os
isotope ratios. In this technique the Os is loaded on platinum filaments with a Ba(OH)2
(Völkening et al., 1991) or Ba(NO3)2 (Creaser et al., 1991) salt to enhance ionization,
whereas the Re can be loaded on platinum filaments (Creaser et al., 1991) or a less
expensive Ni filament (Selby and Creaser, 2001a) or Ta filament (Völkening et al., 1991;
Frei et al., 1996), with BaSO4 or Ba(NO3)2 salts.
Other analytical techniques that have been recently used on molybdenite samples
are laser ablasion inductively coupled plasma mass spectrometry (LA-ICP-MS) (Kosler
et al., 2003; Stein et al., 2003), multicollector inductively couple plasma mass
spectrometry (MC-ICP-MS) (Schoenberg et al., 2000), and the laser ablasion
multicollector inductively couple plasma mass spectrometry (LA-MC-ICP-MS) (Selby
and Creaser, 2004). Laser ablasion techniques have been used to analyze single
molybdenite grains. The results indicate that Re and Os are not homogeneously
distributed in the molybdenite grain resulting in erroneous ages (Kosler et al., 2003;

79
Selby and Creaser, 2004; Stein et al., 2003). These studies concluded that Re and Os are
physically “decoupled”, and that 187Os,but not Re, is preferentially remobilized within the
crystal.
On the other hand, the use of MC-ICP-MS on whole samples, not on individual
grains using the laser ablasion technique, shows interesting applications although the
precision is lower than with the more precise N-TIMS.
Age determinations
There are two methods to determine Re-Os molybdenite ages. The first method is
by a calculated age, whereby the age is obtained by simple substitution in equation 2. The
second method is by constructing a plot of 187Os concentration in ppb versus 187Re in ppb
(Bingen and Stein, 2003; Stein et al., 1998a). In this case more than two analyses (points)
are required to construct an isochron. The age of the molybdenite is derived from the
slope of this isochron and the y-intercept should be zero, since no initial Os is present in
molybdenite. Either method (calculated age and 187Re-187Os plot) is valid to obtain
molybdenite Re-Os ages, but the disadvantage of the 187Re-187Os plot is that it requires at
least three co-genetic samples with different concentrations of Re and Os to obtain the
necessary spread of points to define the isochron. In this process it is also possible that
different, but temporally close events, are used and plotted in the same graph and hence
an average age of the deposit could possibly be obtained and different events would not
be recognized. This problem highlights the necessity of a very good understanding of the
geologic context, provenance and paragenesis of the molybdenite samples in order to

80
obtain geologically meaningful ages.
Error reporting
Sources of error in Re-Os molybdenite ages include uncertainties in the Re and
Os spikes and standard calibrations, the error in the decay constant (1%, or if spikes
calibrated with University of Maryland then a lower 0.31% error can be considered) error
magnification from spiking (optimally spiked samples have little error magnification),
weighing error of spikes and sample (not considered in age calculations if a mixed 185Re-
Os spike is used) and mass spectrometry analytical uncertainties (185Re/187Re ratio and
187Os/190Os ratio). Corrections for common osmium, mass fractionation and blanks are
insignificant (Stein et al., 1998a,b; Stein et al., 2001; Barra et al., 2003). However may be
relevant for low Os concentration molybdenite.
In a recent work (Markey et al., 2003), it was suggested that mass fractionation
corrections are essential in Os measurements made by ion counting. Os measurements by
ion counting are extremely rare for molybdenites, since they contain high concentrations
of 187Os. On the rare occasions where Os concentrations are very low (less than a few
ppb) the problem can be overcome by increasing the amount of sample to be analyzed.
Mass fractionation corrections can only be performed in molybdenites, if a normal Os or
a double Os spike is used, since essentially no other osmium isotope is present in
molybdenites.
Blank corrections are rarely made, because molybdenite contains high
concentrations of Re and Os. Very few authors have performed blank corrections on

81
molybdenite analysis (Selby et al., 2003; Doebrich et al., 2004; Selby and Creaser, 2004).
In these cases, correction was performed because the concentrations of Re and/or Os
were very low and the amount of sample analyzed was <20 mg. Reported blank levels in
these studies are <1pg Os, and consequently the amount of 187Os blank is even smaller,
and hence the correction is almost insignificant compared to the other sources of error,
even for very low Os samples.
Markey et al. (2003) also indicated that determination of common osmium, using
a double osmium spike, may be significant in young samples or low Re samples
(implying low 187Os concentration), and reported a total common Os concentration of 0.4
± 0.1 ppb for an 11 Ma molybdenite. The concentration of common 187Os in the
molybdenite is then in the order of 6 to 8 ppt. The 11 Ma molybdenite sample has a 187Os
concentration of ~36 ppb (Table B1-reference 27). Subtraction of the common 187Os from
the 187Os radiogenic has an insignificant effect. Normally, the presence (if any) of
common osmium in molybdenites is determined by monitoring 192Os (Luck and Allegre,
1982; Stein et al., 2001).
Spike calibration errors are usually less than 0.2% for 190Os and less than 0.1% for
185Re (e.g. Stein et al., 1998a; Barra et al., 2003).
From the above, it is clear that the major source of uncertainty in a Re-Os
molybdenite determination is the error in the decay constant (±1% or ±0.31% if spikes
calibrated with solutions of UMD), followed by the uncertainties in the spike calibrations.
The rest of the possible sources of error (weighing error of spikes and sample, analytical
errors, blanks, common osmium, mass fractionation) are relatively insignificant and in

82
some cases can be diminished by increasing the amount of sample.
Although there is no “written rule” about how to calculate and what should be
considered in reporting the uncertainty associated with an age determination, it is
recommended that all major sources of error should be considered, particularly the
uncertainty of the decay constant and spike calibration errors (Stein et al., 2001; Barra et
al., 2003). The uncertainty in the 187Re decay constant should be included in the
calculation of the total uncertainty of the Re-Os age. This is especially important when
comparing with ages obtained using other isotopic systems (Stein et al., 2001; Barra et
al., 2003). On the other hand, when comparing multiple Re-Os ages the uncertainty of the
decay constant should not be considered because it behaves as an error magnification
factor, and hence its removal allows for a better evaluation of data reproducibility (Stein
et al., 2001).
Again, since there is no specific rule for the reporting of uncertainty, each lab or
researcher should clearly state what was considered in and how the error was calculated.
Some researchers choose not to include the decay constant uncertainty (Selby et al.,
2002; Selby et al., 2003; Selby and Creaser, 2001a,b, 2004), whereas others prefer a more
conservative approach and use a specific percentage of the age as the associated age error
(0.5%, Mathur et al., 2002; Maksaev et al., 2004). The current tendency to force the age
uncertainty to an extreme minimum could yield unrealistic ages that do not have a clear
geological meaning and do not fit within geological models. This is extremely relevant in
determining the number and duration of molybdenite mineralization events, specifically
in young deposits (< 10 Ma), where the associated error is a few tens of thousand years,

83
near the lower limit of what numerical models have predicted as the duration of a single
hydrothermal event.
From the discussion above it is also clear that Re-Os ages should not have an
associated error equal to or lower than a minimum of ±0.31% of the age determination
(unless the decay constant error is not considered). Although a few works report age
uncertainties equal (Bingen and Stein, 2003; Requia et al., 2003) or lower than this value
(Brooks et al., 2004), this is most likely due to an involuntary miscalculation or typing
error, but the reader should be alert in identifying possible uncertainty
misrepresentations.
Standards and reproducibility
There is currently no certified standard for Re-Os analysis of molybdenite. A
molybdenite standard could be used to establish reproducibility of data (although this can
be also tested by replicate analyses of a single sample), and to establish inter-laboratory
comparisons. To overcome this limitation some labs have created their own “in-house”
standards. Although these in-house standards are not proper standards recognized by the
international community, we discuss them here because of the comparative higher
number of replicate analyses published on them, and we can use this fact as a framework
to better understand reproducibility of analyses and the factors (if any) that control it.
An example of an in-house standard is HPL-5 (Stein et al., 1997; Markey et al.,
1998; Selby and Creaser, 2001a, b, 2004), which has been suggested as a possible
international standard. The initial published data by Markey et al. (1998) shows a certain

84
degree of variability (Fig. B1; Table B2), with ages ranging from 218.0 ± 1.07 and 222.2
± 1.09 Ma, that clearly do not overlap within error. Variability is also observed in Re and
Os concentrations. Although this is not critical for age determinations it presents some
concerns regarding the homogeneity of the standard. It is not clear if this variability is
due to sample protocol, or the analytical method (alkaline fusion) employed. Selby and
Creaser (2001a) presented additional analyses of the HPL-5 standard using the Carius
tube method and recognized a degree of variation from the data of Markey et al. (1998).
According to these authors this variability was caused by a lower amount of sample used,
1-2 mg versus the average 25 mg used by Markey et al. (1998), and that the aliquot used
came from a different bottle (Selby and Creaser, 2001b). Selby and Creaser (2001a)
reported three more analyses of this standard, which were slightly older than previously
published due to a recalibration of their 185Re spike. Finally, Selby and Creaser (2004)
summarized and recalculated concentrations and ages of their previous data and
presented new analyses of this standard. This new data show much better reproducibility
and these authors concluded that there is no variability in the Re-Os ages with sample
sizes ranging from ~1 to 25 mg, although concentration variability is greater with sample
sizes <10 mg, but this does not affect the determined age. The strong variability observed
in the Markey et al. (1998) data is then probably related to the technique employed
(alkaline fusion), since the sample prepation protocol used by both groups is the same
(Fig. B1). Stein et al. (2003) recently confirmed that the alkaline fusion technique has a
lower reproducibility than the Carius tube method. This conclusion suggests that analyses
with the alkaline fusion technique should be considered carefully.

85
We can further explore the issue of reproducibility with a second in-house
standard (A996B) employed by the Applied Isotope Research for Industry and the
Environment (AIRIE) group at Colorado State University. Markey et al. (1998) provided
three replicate analyses of this sample (Table B3, Fig. B2), which overlap within error.
Selby and Creaser (2004) reported additional data, which is in good agreement with the
data of Markey et al. (1998) (Fig. B2, B3). Markey et al. (2004) used this sample as a
basis of comparison between a single Os spike and the double Os spike method.
Unfortunately, the data is only presented graphically and no statistical analyses can be
reproduced or done without the actual values, but the graph illustrates the high variability
in the age of this sample, especially within the single spike data (Fig. B4). Furthermore,
the single-spike data of Markey et al. (2003) barely overlaps with the previous Re-Os
ages for this sample (Markey et al., 1998; Selby and Creaser, 2004). Analyses using the
double-spike have better reproducibility, but still some analyses do not overlap within
error. No reason is given for the high variability observed in the single spike analyses, but
it is again probably related to the analytical method used (alkaline fusion) and/or the
amount of sample used. Markey et al. (2003) attributed the variability between both the
single Os spike and the double spike due to spike calibrations. On the other hand, Selby
and Creaser (2004) concluded in their study that a minimum of 40 mg is necessary to
overcome decoupling in this particular sample.
Another important consideration when preparing a standard is the possibility of
multiple mineralization events. Data reported by Stein et al. (2001) for an in-house
standard from the same deposit (Aittojarvi, Finland) as sample A996B, control sample

86
A996D, shows ages (2760 ± 10 Ma, 2761 ± 9 Ma) that are significantly younger than the
weighted average age reported for A996B (2799.4 ± 2.6 Ma, Markey et al., 2003). The
difference of almost 40 myr between two samples from the same deposit not only have
important connotations for the origin and duration of this specific ore system, but have
significant implications if the molybdenite ore from this deposit were eventually used as
an international recognized standard. This fact highlights that any future molybdenite
standard should become from a well-studied deposit with extensive dating work using all
available geochronological tools.
Current controversies regarding the Re-Os molybdenite geochronometer
Almost all researchers working with the Re-Os molybdenite geochronometer have
recognized that the system is in some way disturbed. The main controversy though, is
centered on the possible open system behavior of the Re-Os pair. Since the early
development of the Re-Os isotopic system, molybdenite has played a very important role
because it contains very high Re concentrations. During the mid-1950s to the early
1960s, molybdenite was used to determine the half life of 187Re (Herr et al., 1954; Herr
and Merz, 1955, 1958; Hirt et al., 1963). These early Re-Os analyses of molybdenite and
other later attempts (Ishihara et al., 1989; Luck and Allegre, 1982) yielded mixed results,
with some ages in good agreement with other dating techniques and other results
equivocal to impossible (older than the age of the Earth). Erroneous ages were initially
attributed to Re leaching by metamorphic and/or hydrothermal fluids (Luck and Allegre,
1982). Later interpretations and a few new analyses from some of the same sample

87
localities used by Luck and Allegre (1982), suggested that the anomalous ages obtained
by these authors were probably caused by Os loss during digestion (Suzuki and Masuda,
1990; Suzuki et al., 1992).
McCandless et al. (1993) performed a series of analytical tests in order to evaluate
the behavior of Re in molybdenite and determine which molybdenites are suitable for
dating. These authors concluded that some molybdenites, under certain conditions, can
experience Re loss either during hydrothermal alteration in the hypogene environment or
by interaction with supergene fluids. They also found that Re was enriched in K-Al
silicate intergrowths (illite?) and powellite, a weathering product of molybdenite
(McCandless et al., 1993). The analytical screening proposed by McCandless et al.
(1993) in order to detect alteration in molybdenite prior to conducting Re-Os
geochronology included infrared microscopy, X-ray diffraction, back-scattered electron
imaging, and microprobe analysis. Suzuki et al. (2000), and later Selby and Creaser
(2001a), concluded that there is no relationship between infrared transparency and Re-Os
ages, and that this technique does not assess sample suitability for Re-Os dating. Suzuki
et al. (2000) devised a series of experiments to evaluate the possible alteration of
molybdenite. Molybdenite samples from Brejui, Brazil, with an average grain size of ~5
mm, were placed into quartz tubes with different aqueous solutions (pure H2O, NaCl,
NaHCO3, CaCl2, AlCl3). The tubes were sealed and heated to 180 °C for 20 days. After
the experiment, the outer rim of the molybdenite grain was separated and analyzed
independently from the inner area. Some of the samples were also pulverized to evaluate
the effect of grain size in age reproducibility. Samples were analyzed by microwave

88
digestion and ICP-MS. Suzuki et al. (2000) concluded that molybdenite can be altered by
low salinity (<1%) and low temperature (180 °C) hydrothermal fluids containing NaCl
and/or CO2. They also concluded that to properly assess whether the obtained Re-Os age
reflects the mineralization age or a post-depositional alteration event, replicate analyses
are indispensable (Suzuki et al., 2000; Suzuki et al., 1996). Furthermore, pulverizing and
homogenizing all the molybdenite present in a sample (‘whole molybdenite’ sampling
and analytical protocol) might yield erroneous ages, even if replicate analyses are
performed. This is because of the possible mixing of undisturbed portions with altered
molybdenite grains. Further evidence for disturbance in the Re-Os system in molybdenite
by late hydrothermal fluids is recorded in samples from the Galway Granite, Ireland
(Suzuki et al., 2001) and Bingham Canyon porphyry copper deposit in Utah, USA
(Chesley and Ruiz, 1997). Contrary to the results of the alteration experiments of Suzuki
et al. (2000), regarding the effect of low salinity-low temperature fluids, Selby and
Creaser (2001) used fluid inclusion data from the Endako deposit, Canada, to show that
hydrothermal fluids with salinities of 1-5% wt. NaCl and temperatures ranging from
190°C to 300°C, did not disturbed the Re-Os system in the associated molybdenite.
Another method to assess the reliability of the Re-Os age, other than through
replicate analyses, is by the analysis of other co-genetic molybdenite samples (e.g.
Chesley and Ruiz, 1997; Stein et al., 1998a; Barra et al., 2004), or by comparison with
other robust geochronologic techniques, such as U-Pb applied to zircon or titanite
(Maksaev et al., 2004). In the former several different molybdenite samples yield the
same age and then the age of mineralization can be established with a certain degree of

89
confiability. The latter approach though, also has its limitations, since even U-Pb dating,
the most reliable geochronometer, can be subject to disturbance by Pb loss, inheritance
and common Pb. Even the most robust of isotopic systems are subject to disturbance.
Disparate replicate analyses that do not overlap within error, spurious ages that do
not agree with other dating techniques ages or with other Re-Os ages of co-genetic
samples are a clear indication of disturbance of the Re-Os system in molybdenite (Suzuki
et al., 1996; Chesley and Ruiz, 1997; Raith and Stein, 2000; Suzuki et al., 2000;
Zacharias et al., 2001).
In Zacharias et al. (2001), for example, replicate analyses of a single sample range
over a few million years, not overlapping within error. In this case, the variation is
probably related to the alkaline fusion technique. Raith and Stein (2000) presented
analyses of molybdenites from the Namaqualand region, South Africa, treated by alkaline
fusion. The ages obtained around 1010 Ma, but two replicate analyses (954 ± 4 Ma and
1026 ± 5 Ma) differ by more than 70 million years (Table B1-reference 13). The authors
dismissed the 954 Ma age as a statistical outlier in the population of seven analyses. It is
unlikely that the high difference between the two replicate analyses is caused by the
dissolution technique used, it is more likely that this particular molybdenite sample is
altered.
Selby et al. (2002) presented some cases where the system has not been disturbed
as an argument that the system is impevious to open system disturbance, and concluded
that erroneous ages are due to questionable analytical protocols. In the case of the Lobash
deposit, Suzuki et al. (2000) obtained ages ranging between 2.2 to 3.3 Ga in contrast to

90
Stein et al. (2001) who, within the same deposit, obtained consistent ages (~2.7 Ga).
Clearly, Stein et al. (2001) did not analyze the same samples that Suzuki et al. (2000).
Also, the sample homogenization procedure employed by Stein et al. (2001) should
always yield reproducible ages. Suzuki et al. (2000), on the other hand, used coarse grain
samples with the purpose to study the behavior of Re and Os, so their sample preparation
was different but appropriate for their purpose (Suzuki, 2004). The alteration or
disturbance of molybdenite can be very local within a deposit, even within a single
sample and not necessarily affect the whole deposit. For example, McCandless et al.
(1993) described a disturbed molybdenite from the Bagdad deposit in northern Arizona
that yielded a disturbed age of ~67 Ma, whereas Barra et al. (2003) reported robust ages
of ~72 Ma for the same deposit. This supports the notion of local disturbance of
molybdenite samples and that the disturbance of a single sample cannot be extrapolated
to the whole deposit.
A similar approach to that of Stein et al. (2001) was made by Selby et al. (2004)
to prove that irreproducible ages are caused by inadequate analytical protocols. Here,
these authors performed a new Re-Os determination on the same sample in which
previously Suzuki et al. (2001) obtained an age (Table B1-reference 16 and 40). Suzuki
(2004) argued that ages measured on homogenized samples should be reproducible, but
that this protocol (homogenization of sample) would not necessarily yield reliable or
accurate ages. The molybdenite ages obtained by Suzuki et al. (2001) and Selby et al.
(2004) overlap a poorly constrained U-Pb age within error, but do not overlap with each
other.

91
Decoupling
A different type of molybdenite alteration is what has been described as
“decoupling”. In this case, Re and 187Os are not spatially linked on a micron scale within
the molybdenite grain. This decoupling precludes the use of laser ablasion techniques for
Re-Os dating in a form analogous to the SHRIMP or LA-MC-ICP-MS techniques used to
date zircons by the U-Pb isotopic system.
The heterogeneous distribution of Re within single molybdenite crystals has been
reported by several authors (Kovalenker et al., 1974; McCandless et al., 1993; Terada et
al., 1971). It is not absolutely clear whether heterogeneous distribution is caused by
changes in the concentration of Re in the mineralizing fluid during crystal formation
(Terada et al., 1971), or caused by post-crystallization processes. Decoupling may be
caused by remobilization of 187Os under conditions in which Re is immobile (Stein et al.,
2003). According to these authors the mobility of 187Os is mostly within the molybdenite
crystal (closed system behavior) and hence if the whole molybdenite crystal is used for
the analyses then a reliable age can be still obtained. Stein et al. (2003) also recognized
that a few ppb 187Os could be incorporated into neighboring sulfides affecting the Re-Os
in the sulfide but not the Re-Os systematics in the molybdenite. This indicates a certain
degree of open system behavior contrary to what has been stated for the decoupling
process. Furthermore, considering that some molybdenite samples have low ppb levels of
Os (Table B1-reference 25, 35 and 36) it is possible that such molybdenite could be
disturbed by migration of 187Os into adjacent sulfides. According to Stein et al. (2003),

92
187Os would not be incorporated into quartz or feldspars. This is probably true, but the
possibility that Os (and/or Re) might be incorporated into adjacent clay minerals (illite
and/or kaolinite), formed by hydrothermal alteration of feldspars, has not been ruled out.
Illite intergrowths in molybdenite have been shown to be enriched in Re (McCandless et
al., 1993). In the Endako deposit, Canada, replicate analyses of seven different fine-
grained homogenized molybdenite samples using the Carius tube method, provided two
populations of reproducible ages that overlap within error (Selby and Creaser, 2001b).
The results identified two periods of mineralization at ~148 Ma and at 145 Ma, although
one single sample (RB862.C) has an age of 142.7 ± 0.55 Ma, which does not overlap the
other determinations (Table B1-reference 19). The sample was in direct contact with
kaolinite and was taken from a fault-striated surface. Considering that the suggested
sample protocol to overcome decoupling was followed, it is possible that the system was
partially disturbed. Re loss or Os gain would yield older ages, whereas Os loss or Re gain
will result in younger ages. The latter seems to be the case for this particular sample,
unless the amount of sample was not enough to overcome the proposed decoupling effect.
The decoupling effect, as envisioned by Stein et al. (2003) and Selby and Creaser
(2004), presents a very complex problem, since numerous factors (i.e. grain size, Re and
Os concentrations, age) have to be considered to possible overcome decoupling. A strict
sample preparation protocol (described below) should be followed to overcome the
problem.

93
Analytical protocol
Selby et al. (2002), Selby and Creaser (2004) and Stein et al. (2003) have
suggested that erroneous ages obtained by some researchers are not caused by open
system behavior of the Re-Os system, but rather by equivocal analytical protocols. They
also stated that to obtain reproducible and accurate molybdenite ages a specific sample
preparation procedure should be followed in order to overcome this problem.
This protocol consists in separating all fine-grained molybdenite from the rock
sample by crushing and separation using heavy liquid (methylene iodide) and magnetic
separation techniques. This method produces a fine-grained homogenized sample (‘whole
molybdenite” sample; Selby and Creaser, 2001b; Stein et al., 2001; Stein et al., 2003).
According to these authors, direct use of naturally occurring coarse-grained samples or
hand-picking of coarse-grained molybdenite should be completely avoided. In these
cases, samples should be crushed to a fine grain size and homogenized prior to analysis.
A second alternative is the use a microdrill to obtain a fine powder from different portion
of the molybdenite vein (Requia et al., 2003).
The first study that addressed the effect of grain-size in age reproducibility was
performed by Markey et al. (1998). These authors analyzed different size fractions from
three different Archean molybdenites of unknown provenance (samples A34, A950 and
A996B) and one Proterozoic molybdenite (sample SW93-PK4). The results were, in
general, erratic, with poor reproducibility in some cases for coarse-grained and in others
for fine-grained molybdenites (Fig. B5, B6, B7; Table B1-reference 9). The poor
reproducibility is, as explained before, probably tied to the method used, i.e. alkaline

94
fusion. Regardless of this, these authors concluded that analytical results are not
dependent on the grain size of the sample (Markey et al., 1998). Later, this same group of
researchers restated that grain size is indeed an important factor (Stein et al., 2001),
although no experimental data or comparison between coarse and fine-grained samples
were given to support this assertion. This task was partially undertaken by Selby and
Creaser (2004). They analyzed several molybdenites from four deposits with different
natural grain size and different age (i.e. coarse-grained Archean deposit; two fine-grained
Mesozoic deposits, and a coarse-grained Paleozoic deposit) They concluded that
naturally coarse grained (~1 cm) old samples (Archean age) that have been ground to a
fine powder and later homogenized, require at least 40 mg to overcome decoupling, in
agreement to Stein et al. (2001). Further, younger (~220-146 Ma) naturally fine-grained
(<2 mm) molybdenites yielded reproducible ages with as little as 1 mg of sample (Selby
and Creaser, 2004). The third case, with naturally coarse-grained (1-1.5 cm) young (~370
Ma) molybdenites, was analyzed following the sample procedure (grounding and
homoginization) and by separating three coarse-grained crystals from the rock sample
(Sc20W-A,B and C; Table B1-reference 35). A single large grain (Sc20W-B) was further
subdivided in four pieces and subsequently analyzed. Decoupling could not be overcome
in the fine-grained samples, even using ~50 mg of sample. Similarly, the coarse grained
crystals (Sc20W-A and C) also produce spurious ages, but the analyses of the four pieces
of sample Sc20W-B produced reproducible ages in those fragments that were over 20 mg
in weight (Fig. B8; Table B1-reference 35). The reason why decoupling could not be
overcome in this particular case is uncertain, but it is probably related to the very low Os

95
concentrations (< 3 ppb). Interestingly though, the reproducibility with fractions of a
single coarse grain (Sc20W-B) is unexpected. Further experiments using this type of
approach, i.e. naturally coarse grain young deposits (particularly using molybdenites
from porphyry Cu-Mo deposits of Tertiary age or porphyry Mo deposits) are needed to
properly assess the role of grain size in reproducibility of ages.
The argument over the importance of grain size is based on the claim that Re and
187Os are physically “decoupled” in molybdenite and that this decoupling is enhanced in
coarse grains (Creaser and Selby, 2001). Intuitively, one might expect the decoupling
phenomenon to be enhanced in fine-grained molybdenite since it is an effect that occurs
at micron scale. The idea that decoupling occurs only within the crystal is used as an
argument for the ‘whole molybdenite’ sampling approach. In the resulting fine powder,
after sample treatment of coarse grain molybdenites, every single grain is actually
enriched or depleted in Re and/or Os. The subsequent homogenization process has the
same effect as on disturbed samples as described by Suzuki et al. (2000); it will produce a
reproducible age, as expected with homogenized samples, but not necessary a reliable age
(Suzuki, 2004). Finally, since the amount of sample required to overcome decoupling in
coarse-grained samples is not known a priori, replicate analyses are essential if one is to
be certain that decoupling has been overcome.

96
Concluding Remarks
From Re-Os molybdenite ages obtained by different research groups, in a variety
of ore deposits in different locations, it is possible to conclude that the Re-Os system
applied to molybdenite is robust and accurate ages can be obtained. The system though,
can be subject to disturbance at the micron scale with physical decoupling of Re and
187Os within the crystal and possible migration of 187Os to adjacent sulfides or silicates
(open system behavior). Remobilization of Re has previously been extensively
documented in natural samples and experimentally. In these cases, Re could be
incorporated in other sulfides or phyllosilicates (clays) or possibly into post-depositional
hydrothermal or supergene fluids and deposited elsewhere.
It is shown here that reproducibility of Re-Os data is linked to the analytical
method used for decomposition and homogenization of sample and spikes. Alkaline
fusion appears to yield results that have poor reproducibility, whereas the Carius tube
technique produces better results. If effectively alkaline fusion technique has low
reproducibility, then single non-reproduced determinations should be considered
carefully and may not be very reliable.
Replicate analyses of a homogenized sample should yield reproducible ages, but
the homogenization of the molybdenite sample carries other associated problems. In this
case altered portions could be mixed with unaltered sample and will result in
reproducible ages, but not necessary reliable ages.
The amount of sample seems to be critical in order to overcome decoupling,
especially for very old samples as stated by Selby and Creaser (2004). Since the amount

97
of sample necessary to overcome decoupling is not known for any specific sample a
series of multiple analyses are required.
The reliability of Re-Os ages can be determined by replication of coarse- (or
naturally occurring fine) grained samples, or the analysis of other co-genetic samples
and/or by comparison with other geochronological tools, such as the U-Pb system or
40Ar/39Ar method.
In evaluating Re-Os molybdenite ages it is important to consider the techniques
employed (Carius tube, alkaline fusion, microwave digestion), the instrumentation
employed (ICP-MS, TIMS, MC-ICP-MS, laser ablasion), age uncertainty (sources of
error, what is considered and how it is calculated) and age reporting (replicate analyses,
reliability).

98
216
218
220
222
224
Age
, Ma
Figure B1. Weighted average age of Re-Os analyses of sample HPL-5 (220.71 ± 0.25 Ma, MSWD = 2.9). Left side data from Markey et al. (1998) using alkaline fusion, right side data from Selby and Creaser (2004) using Carius tubes. See text for discussion.

99
2772
2776
2780
2784
2788
2792
2796
2800
2804
2808
2812
2816
2820
Age
, Ma
Figure B2. Published Re-Os analyses of sample A996B (weighted average age = 2794 ± 4 Ma, MSWD = 1.3). Left of vertical divider: analyses by alkaline fusion (Markey et al., 1998); right of divider: analyses by Carius tube (Selby and Creaser, 2004) using >3.2 mg of sample.

100
2770
2780
2790
2800
2810
2820
2830A
ge, M
a
1.5 mg
40.5 mg
39.8 mg
40.2 mg
10.6 mg
9.9 mg3.2 mg
2.0 mg
50.4 mg
Figure B3. Analyses of sample A996B using Carius tube method (weighted average age = 2794.1 ± 6.4 Ma, MSWD = 3.2). Note low reproducibility with small amounts of sample (<10 mg). From Selby and Creaser (2004).
Figure B4. Re-Os replicate analyses of sample A996B, using single Os spike and alkaline fusion method and double spike Carius tube technique. Both techniques show low reproducibility for this sample, although variance with alkaline fusion is higher. From Markey et al. (2003).

101
2480
2520
2560
2600
2640
2680A
ge, M
a
FINE GRAIN
COARSE GRAIN
Figure B5. Comparison between analyses of an Archean molybdenite (sample A34 MA, Markey et al., 1998). Fine grain analyses show low reproducibility, whereas coarse grain analyses overlap within error.
2570
2590
2610
2630
2650
2670
2690
2710
2730
2750
Age
, Ma
COARSE GRAIN
FINE GRAIN
Figure B6. Comparison between analyses of an Archean molybdenite (sample A950, Markey et al., 1998). Coarse grain analyses show low reproducibility, whereas fine grain analyses show better reproducibility, although not all analyses overlap within error.

102
1776
1780
1784
1788
1792
1796
1800
1804
Age
, Ma
COARSE FINEMEDIUM
Figure B7. Comparison between coarse, medium and fine grain size from a single molybdenite sample (sample SW93-PK4, Markey et al., 1998). All three analyses overlap within error.
370
380
390
400
410
Age,
Ma
Sc20W-B1 Sc20W-B4Sc20W-B3Sc20W-B2
24.1 mg17.8 mg20.9 mg29.2 mg
Figure B8. Comparison of analyses from a single coarse-grained molybdenite divided in four semi equal pieces. Reproducible ages are obtained with over 20 mg of sample. No reproducible ages were obtained using fine-grained homogenized fractions of this same sample. Data from Selby and Creaser (2004).

Table B1. Compiled Re-Os molybdenite ages from peer reviewed journals Year Country Deposit/Locality Sample Method Re Error 187Re Error 187Os Error Age Error (2s)Error (%)Reference.1982 Finland Ylitornio a-h.d-SIMS 61.7 n.r. n.r. n.r. 1060 1770 60 3.39 (1)1982 Finland Tepasto 1a-h.d-SIMS 11.1 n.r. n.r. n.r. 170 1590 110 6.92 2a-h.d-SIMS 7.55 n.r. n.r. n.r. 330 4490 100 2.231982 Finland Lahnanen a-h.d-SIMS 5.1 n.r. n.r. n.r. 930 1880 90 4.791982 Finland Matasvaara a-h.d-SIMS 29.6 n.r. n.r. n.r. 530 1840 60 3.261982 Australia Biggenden a-h.d-SIMS 630 n.r. n.r. n.r. 1970 330 100 30.301982 Australia Everton a-h.d-SIMS 265 n.r. n.r. n.r. 5110 376 30 7.981982 Australia Mt. Moliagul a-h.d-SIMS 6.87 n.r. n.r. n.r. 61 920 60 6.521982 USA Climax a-h.d-SIMS 74 n.r. n.r. n.r. 76 96 20 20.831982 Greenland a-h.d-SIMS 55.2 n.r. n.r. n.r. 980 1840 90 4.891982 Canada Lacorne Preissac a-h.d-SIMS 22.2 n.r. n.r. n.r. 1420 6370 250 3.92 a-h.d-SIMS 21.3 n.r. n.r. n.r. 1460 6800 200 2.941993 Australia m.d.-ICPMS 14.1 0.1 n.r. n.r. 412 4 2760 90 3.26 (2) m.d.-ICPMS 11.9 0.5 n.r. n.r. 355 2 2820 90 3.191993 Finland m.d.-ICPMS 26.6 0.1 n.r. n.r. 728 6 2590 80 3.09 m.d.-ICPMS 25.1 0.2 n.r. n.r. 701 5 2650 90 3.40 m.d.-ICPMS 27 0.2 n.r. n.r. 728 10 2550 90 3.53 m.d.-ICPMS 24 0.2 n.r. n.r. 654 4 2590 80 3.091993 Canada Lacorne Preissac m.d.-ICPMS 30.2 0.2 n.r. n.r. 852 7 2670 90 3.37 m.d.-ICPMS 29.7 0.1 n.r. n.r. 851 8 2710 90 3.32 m.d.-ICPMS 30.2 0.3 n.r. n.r. 845 5 2650 90 3.401993 USA Climax m.d.-ICPMS 6.97 0.03 n.r. n.r. 1.92 0.11 26.6 1.8 6.771993 USA Bagdad 34BAGI a.f.-ICPMS 618.6 n.r. n.r. n.r. 452 n.r. 70.8 0.4 0.56 (3) 34BAGE a.f.-ICPMS 465.8 n.r. n.r. n.r. 322 n.r. 67 n.r.1993 USA Copper Creek 1CACC a.f.-ICPMS 856.3 n.r. n.r. n.r. 503 n.r. 56.9 0.9 1.58 Gold Acres 35GAIP a.f.-ICPMS 61 n.r. n.r. n.r. 106 n.r. 168.3 n.r.1993South Africa Lorelei 98LL a.f.-ICPMS 349.5 n.r. n.r. n.r. 5733 n.r. 1570.9 n.r.1993 Mexico Maria 48MARFa.f.-ICPMS 413.8 n.r. n.r. n.r. 245 n.r. 57.4 1.6 2.791993 USA Mission 97MIS a.f.-ICPMS 427.1 n.r. n.r. n.r. 265 n.r. 60.2 n.r.1993 USA Morenci 94MOR a.f.-ICPMS 2041.9 n.r. n.r. n.r. 1175 n.r. 55.8 0.9 1.61
103

Table B1. Compiled Re-Os molybdenite ages from peer reviewed journals-continued Year Country Deposit/Locality Sample Method Re Error 187Re Error 187Os Error Age Error (2s) Error (%) Reference1993 USA Bingham 56B54 a.f.-ICPMS 379.6 n.r. n.r. n.r. 151 n.r. 38.6 0.6 1.55(4) 1993 USA Copper Creek 60CCAEBa.f.-ICPMS 2107 n.r. n.r. n.r. 1280 n.r. 58.9 1.5 2.55 1993 USA Sierrita 130SIE a.f.-ICPMS 238.2 n.r. n.r. n.r. 1175 n.r. 55.8 0.9 1.61 1994 India Ambalavayal m.d.-ICPMS 0.383 0.009 n.r. n.r. 2.25 0.07 567 28 4.94(5)
m.d.-ICPMS 0.131 0.011 n.r. n.r. 0.771 0.082 566 77 13.60 1996 Japan Hokuto m.d.-ICPMS 13.5 0.14 n.r. n.r. 17.33 0.67 124 6.2 5.00(6)
m.d.-ICPMS 12.96 0.09 n.r. n.r. 16.65 0.35 124.2 4.7 3.78 1996 Japan Hata m.d.-ICPMS 34.08 0.32 n.r. n.r. 49.3 1.2 139.9 5.4 3.86
m.d.-ICPMS 10.05 0.073 n.r. n.r. 16.9 1.7 163 17 10.43 m.d.-ICPMS 12.904 0.074 n.r. n.r. 20.96 0.59 157.5 6.6 4.19
1996 Japan Takatori m.d.-ICPMS 69.01 0.45 n.r. n.r. 7.29 0.15 10.2 0.4 3.92 m.d.-ICPMS 57.9 1.8 n.r. n.r. 6.9 0.2 11.6 0.6 5.17
1996 Japan Owashi m.d.-ICPMS 2.273 0.043 n.r. n.r. 0.65 0.12 27.5 5.2 18.91 m.d.-ICPMS 2.68 0.017 n.r. n.r. 1.63 0.12 58.9 4.6 7.81
1996 Japan Otome m.d.-ICPMS 92.95 0.33 n.r. n.r. 11.13 0.16 11.7 0.4 3.42 m.d.-ICPMS 50.83 0.13 n.r. n.r. 5.95 0.41 11.36 0.86 7.57
1996 Japan Hirase m.d.-ICPMS 9.406 0.048 n.r. n.r. 6.138 0.093 63.1 2.2 3.49 m.d.-ICPMS 11.24 0.024 n.r. n.r. 7.85 0.11 67.6 2.3 3.40
1996 Japan Daito m.d.-ICPMS 110.39 0.83 n.r. n.r. 63.89 0.62 56 1.9 3.39 m.d.-ICPMS 110.88 0.93 n.r. n.r. 65.58 0.84 57.2 2 3.50
1996 Japan Higashiyama m.d.-ICPMS 39.65 0.28 n.r. n.r. 25.04 0.37 61.1 2.1 3.44 m.d.-ICPMS 38.52 0.1 n.r. n.r. 25.17 0.28 63.2 2.1 3.32
1996 Japan Seikyu m.d.-ICPMS 169.5 2.1 n.r. n.r. 100.1 7.3 57.1 4.6 8.06 m.d.-ICPMS 165.7 1.4 n.r. n.r. 99.8 1.3 58.2 2 3.44
1996 Japan Kamitani m.d.-ICPMS 58.82 0.37 n.r. n.r. 36.3 1.2 59.6 2.7 4.53 m.d.-ICPMS 56.98 0.35 n.r. n.r. 36.51 0.9 61.7 2.5 4.05
1996 Japan Seikyu-minami m.d.-ICPMS 137.1 1.1 n.r. n.r. 69.8 3.2 49.2 2.7 5.49 m.d.-ICPMS 138.2 0.66 n.r. n.r. 73.1 1.1 51.1 1.8 3.52
1996 Japan Takagigawa m.d.-ICPMS 37.376 0.087 n.r. n.r. 25.45 0.46 65.9 2.4 3.64 m.d.-ICPMS 43.77 0.1 n.r. n.r. 30.35 0.73 67.1 2.6 3.87
104

Table B1. Compiled Re-Os molybdenite ages from peer reviewed journals-continued Year Country Deposit/Locality Sample Method Re Error 187Re Error 187Os Error Age Error (2s) Error (%) Reference1996 Japan Yamasa m.d.-ICPMS 163.9 1.2 n.r. n.r. 101.6 1.6 60 2.1 3.50 (6)
m.d.-ICPMS 162.4 1.4 n.r. n.r. 99.9 1.4 59.5 2.1 3.53 m.d.-ICPMS 167.5 1.8 n.r. n.r. 106.6 1.4 61.6 2.2 3.57
1996 Japan Komaki m.d.-ICPMS 6.525 0.049 n.r. n.r. 5.043 0.093 74.7 2.7 3.61 m.d.-ICPMS 6.213 0.015 n.r. n.r. 4.75 0.2 73.9 3.7 5.01
1996 Japan Fukuoka m.d.-ICPMS 100.56 0.48 n.r. n.r. 93 0.76 89.4 2.9 3.241996 Japan Okawame m.d.-ICPMS 287.1 1.7 n.r. n.r. 344.5 4.6 115.9 3.9 3.36
m.d.-ICPMS 302.4 1.6 n.r. n.r. 391 12 128 5.6 4.381996 Japan Fusamata m.d.-ICPMS 0.703 0.012 n.r. n.r. 0.77 0.16 106 22 20.75
m.d.-ICPMS 0.3813 0.0074 n.r. n.r. 0.58 0.2 109 38 34.861996 Japan Sekigane m.d.-ICPMS 4.979 0.02 n.r. n.r. 3.436 0.046 66.7 2.3 3.45
m.d.-ICPMS 5.108 0.022 n.r. n.r. 3.491 0.038 66.1 2.1 3.181997 China Jinduicheng JDC-5 a.f.-NTIMS 17.33 0.05 n.r. n.r. 25.13 0.09 138.3 0.8 0.58 (7)
JDC-5 a.f.-NTIMS 17.4 0.05 n.r. n.r. 25.26 0.09 138.4 0.8 0.581997 USA Bingham CanyonBC-1-96 c.t.-NTIMS n.r. n.r. n.r. n.r. n.r. n.r. 37.18 0.27 0.73 (8)
BC-2-96 c.t.-NTIMS n.r. n.r. n.r. n.r. n.r. n.r. 36.96 0.23 0.62 BC-4-96-1c.t.-NTIMS n.r. n.r. n.r. n.r. n.r. n.r. 36.77 0.26 0.71 BC-4-96-2c.t.-NTIMS n.r. n.r. n.r. n.r. n.r. n.r. 36.83 0.19 0.52 BC-7-96 c.t.-NTIMS n.r. n.r. n.r. n.r. n.r. n.r. 34.41 0.24 0.70 BC-8-96 c.t.-NTIMS n.r. n.r. n.r. n.r. n.r. n.r. 37.27 0.26 0.70
1998 ? ? A34 MA a.f.-NTIMS 10.887 0.026 n.r. n.r. 294.9 0.9 2533 11 0.43 (9) A34 MA a.f.-NTIMS 11.297 0.026 n.r. n.r. 303.8 0.9 2515 10 0.40 A34 MA a.f.-NTIMS 11.14 0.027 n.r. n.r. 299 0.9 2510 10 0.40 A34 MA a.f.-NTIMS 20.954 0.045 n.r. n.r. 595.8 1.8 2656 11 0.41 A34 MA a.f.-NTIMS 18.915 0.069 n.r. n.r. 534.4 2.2 2639 11 0.42
1998 ? ? A950 a.f.-NTIMS 95.79 0.22 n.r. n.r. 2790 8.5 2719 11 0.40 A950 a.f.-NTIMS 97 0.21 n.r. n.r. 2771 8.1 2668 11 0.41 A950 a.f.-NTIMS 98.97 0.85 n.r. n.r. 2863 25.3 2701 11 0.41 A950 a.f.-NTIMS 57.826 0.133 n.r. n.r. 1608 5 2599 11 0.42 A950 a.f.-NTIMS 52.256 0.214 n.r. n.r. 1470 6.6 2627 11 0.42
105

Table B1. Compiled Re-Os molybdenite ages from peer reviewed journals-continued
Year Country Deposit/Locality Sample Method Re Error 187Re Error 187Os Error Age Error (2s)Error (%)
Reference
1998 ? ? A950 a.f.-NTIMS 60.5030.248 n.r. n.r. 1699 7.8 2624 11 0.42 (9) SW93-PK4 a.f.-NTIMS 170 0.3 n.r. n.r. 3240 9 1793 8 0.45 SW93-PK4 a.f.-NTIMS 176.2 1.6 n.r. n.r. 3348 32 1787 7 0.39 SW93-PK4 a.f.-NTIMS 183.5 1.5 n.r. n.r. 3489 30 1789 7 0.39
1998 Finland Kuittila FN93-KU1 a.f.-NTIMS 85 0.4 n.r. n.r. 2526 12 2773 11 0.40 (10) FN95-KU1 a.f.-NTIMS 72.5 0.3 n.r. n.r. 2162 10 2783 11 0.40
1998 Finland Kivisuo FN95-KV1 a.f.-NTIMS 119.1 0.4 n.r. n.r. 3536 14 2771 11 0.40 FN95-KV1 a.f.-NTIMS 114.4 0.4 n.r. n.r. 3422 15 2792 11 0.39
1998 Lithuania Kabeliai SW93-KA1 a.f.-NTIMS 2.3930.014 n.r. n.r. 37.52 0.18 1479 8 0.54 SW93-KA1 a.f.-NTIMS 2.9920.003 n.r. n.r. 47.28 0.12 1490 6 0.40
1998 RAN RAN-61a c.t.-NTIMS 2.83 n.r. n.r. n.r. 86.8 0.12 2590 n.r. (11) RAN-61a c.t.-NTIMS 2.83 n.r. n.r. n.r. 85.4 0.12 2590 n.r. RAN-61b c.t.-NTIMS 2.84 n.r. n.r. n.r. 78.8 0.12 2600 n.r. RAN-61b c.t.-NTIMS 2.85 n.r. n.r. n.r. 79.2 0.12 2600 n.r.
2000 Brazil Brejui no alteration m.d.-ICPMS 105 0.52 n.r. n.r. 592 35 536 32 5.97 (12) Brejui no alteration m.d.-ICPMS 98.61 0.28 n.r. n.r. 558 29 538 28 5.20 Brejui no alteration m.d.-ICPMS 45.65 0.98 n.r. n.r. 264 12 549 27 4.92 Brejui no alteration m.d.-ICPMS 80.46 0.78 n.r. n.r. 443 41 524 49 9.35
2000 Brazil Brejui NaCl inner m.d.-ICPMS 110.74 0.19 n.r. n.r. 587 7 504 6 1.19 Brejui NaCl outer m.d.-ICPMS 75.08 0.48 n.r. n.r. 283 54 359 68 18.94 Brejui NaHCO3-in m.d.-ICPMS 106.09 0.24 n.r. n.r. 614 16 551 14 2.54 Brejui NaHCO3-out m.d.-ICPMS 117.26 0.41 n.r. n.r. 581 45 471 36 7.64 Brejui AlCl3 inner m.d.-ICPMS 89.17 0.48 n.r. n.r. 504 12 537 13 2.42 Brejui AlCl3 outer m.d.-ICPMS 128.17 0.8 n.r. n.r. 698 34 518 26 5.02 Brejui CaCl2 inner m.d.-ICPMS 81.31 0.48 n.r. n.r. 454 22 531 26 4.90 Brejui CaCl2 outer m.d.-ICPMS 90.98 0.59 n.r. n.r. 508 27 530 29 5.47 Brejui H2O inner m.d.-ICPMS 52.02 0.38 n.r. n.r. 290 12 530 21 3.96 Brejui H2O outer m.d.-ICPMS 75.01 0.48 n.r. n.r. 424 9 537 11 2.05
106

Table B1. Compiled Re-Os molybdenite ages from peer reviewed journals-continued
Year Country Deposit/Locality Sample Method Re Error 187Re Error 187Os Error Age Error (2s)
Error (%) Reference
2000 Australia m.d.-ICPMS 1.52 0.03 n.r. n.r. 15 0.6 935 41 4.39 (12) m.d.-ICPMS 0.88 0.03 n.r. n.r. 13.1 0.3 1411 63 4.46
2000 Russia m.d.-ICPMS 7.13 0.05 n.r. n.r. 197 4 2582 54 2.09 m.d.-ICPMS 4.51 0.09 n.r. n.r. 107 2 2224 60 2.70 m.d.-ICPMS 8.35 0.09 n.r. n.r. 300 7 3337 83 2.49
2000 Finland m.d.-ICPMS 25.1 0.2 n.r. n.r. 701 5 2610 27 1.03 m.d.-ICPMS 26.6 0.1 n.r. n.r. 728 6 2558 23 0.90 m.d.-ICPMS 27 0.2 n.r. n.r. 728 10 2521 39 1.55 m.d.-ICPMS 24 0.2 n.r. n.r. 654 4 2547 26 1.02 m.d.-ICPMS 24.8 0.2 n.r. n.r. 824 4 3092 28 0.91 m.d.-ICPMS 24.5 0.1 n.r. n.r. 850 6 3225 26 0.81 m.d.-ICPMS 23.6 0.1 n.r. n.r. 814 10 3207 41 1.28
2000 South Africa Kliphoog NA44 a.f.-NTIMS 11.46 0.1 n.r. n.r. 122.8 0.3 1015 4 0.39 (13) Kliphoog NA335-3 a.f.-NTIMS 51.94 0.4 n.r. n.r. 558 1 1018 4 0.39
2000 South Africa Nababeep Far West NA51 a.f.-NTIMS 1.698 0.001 n.r. n.r. 18.13 0.05 1011 4 0.402000 South Africa Narrap NA167-1 a.f.-NTIMS 2.318 0.003 n.r. n.r. 23.33 0.06 954 4 0.42
Narrap NA167-1 a.f.-NTIMS 2.17 0.004 n.r. n.r. 23.51 0.06 1026 5 0.492000 South Africa Tweedam NA336-5 a.f.-NTIMS 7.26 0.01 n.r. n.r. 77.1 0.2 1006 4 0.40
Tweedam NA336-5 a.f.-NTIMS 7.22 0.01 n.r. n.r. 76.3 0.2 1000 4 0.402000 Mongolia Erdenet ER c.t.-NTIMS 538.6 0.5 338.5 0.3 1360 2 240.7 0.8 0.33 (14)
ER c.t.-NTIMS 530.6 0.5 333.5 0.5 1338 2 240.4 0.8 0.332000 Mongolia Tsagaan Suvarga TS c.t.-NTIMS 80.03 0.06 50.3 0.03 311.1 0.3 370.1 1.2 0.32
TS c.t.-NTIMS 155.5 0.1 97.76 0.09 605.5 0.6 370.6 1.2 0.322000 Zambia Kanshanshi HT-K285-1 c.t.-NTIMS 226.7 0.2 n.r. n.r. 1220 1 511.8 1.7 0.33 (15)
HT-K285-2 c.t.-NTIMS 370.2 0.9 n.r. n.r. 1997 1 512.9 1.7 0.33 HT-K237 c.t.-NTIMS 89.31 0.5 n.r. n.r. 472.4 0.5 503 1.7 0.34 HT-K237 c.t.-NTIMS 97.25 0.4 n.r. n.r. 513.1 0.7 501.8 1.7 0.34
107

Table B1. Compiled Re-Os molybdenite ages from peer reviewed journals-continued Year Country Deposit/Locality Sample Method Re Error 187Re Error 187Os Error Age Error (2s)Error (%)Reference2001 Ireland Galway Mace m.d.-ICPMS 76.14 0.36 n.r. n.r. 340.2 1.9 425.2 3.1 0.73 (16)2001 Ireland Galway Murvey m.d.-ICPMS 9.492 0.042 n.r. n.r. 38.21 0.79 383.2 8.1 2.11
m.d.-ICPMS 10.954 0.084 n.r. n.r. 49.05 0.51 426.1 5.5 1.292001 Ireland Galway Travore m.d.-ICPMS 0.4088 0.0051 n.r. n.r. 1.455 0.016 338.9 5.6 1.65
m.d.-ICPMS 0.467 0.026 n.r. n.r. 2.281 0.061 464 28 6.032001Czech Republic Ptrackova hora CZ-95-PH1 a.f.-NTIMS 43 0.08 n.r. n.r. 154.5 0.4 342.1 1.5 0.44 (17)
CZ-95-PH2 a.f.-NTIMS 19.33 0.06 n.r. n.r. 70 0.2 344.7 1.7 0.49 CZ-95-PH2 a.f.-NTIMS 19.81 0.04 n.r. n.r. 72.5 0.2 348.5 1.6 0.46 CZ-95-PH2 a.f.-NTIMS 19.51 0.04 n.r. n.r. 70.1 0.2 342.4 1.5 0.44
2001 Australia Maldon M-1 c.t. -NTIMS 84.3 0.09 52.98 0.05 332.6 0.6 376 2 0.53 (18)2001 Canada Endako stockwork vein3058.W2 c.t. -NTIMS 20 n.r. 12.6 n.r. 30.7 n.r. 146.5 0.6 0.41 (19)2001 Canada Endako ribbon vein S822.692 c.t. -NTIMS 38.4 n.r. 24.2 n.r. 59.8 n.r. 148.5 0.73 0.49
S822.692 c.t. -NTIMS 37.5 n.r. 23.6 n.r. 58.4 n.r. 148.5 0.7 0.472001 Canada Endako ribbon vein 2706.SWB-1c.t. -NTIMS 27.2 n.r. 17.1 n.r. 41.4 n.r. 145.3 0.58 0.40
2706.SWB-2c.t. -NTIMS 30.6 n.r. 19.2 n.r. 46.6 n.r. 145.5 0.61 0.42 2706.SWB-3c.t. -NTIMS 30.6 n.r. 19.3 n.r. 46.7 n.r. 145.5 0.7 0.48 2706.SWB-4c.t. -NTIMS 30.4 n.r. 19.1 n.r. 46.7 n.r. 144.3 0.64 0.44 2706.SWB-5c.t. -NTIMS 31.1 n.r. 19.5 n.r. 47.5 n.r. 146 0.74 0.51
2001 Canada Endako ribbon vein 3058 c.t. -NTIMS 11.2 n.r. 7 n.r. 17 n.r. 145.1 0.55 0.38 3102.2 c.t. -NTIMS 9.8 n.r. 6.2 n.r. 15.2 n.r. 145.7 0.69 0.47 WD1 c.t. -NTIMS 37.5 n.r. 23.6 n.r. 57 n.r. 145 0.65 0.45 RB862C c.t. -NTIMS 6.5 n.r. 5.2 n.r. 12 n.r. 142.7 0.55 0.39
2001 Canada Nithi Mountain Nithi 2 c.t. -NTIMS 76.9 n.r. 48.3 n.r. 124.5 n.r. 154.4 0.61 0.402001 Canada Casino DS32 c.t.-NTIMS 289.2 2.2 181.8 1.4 225.4 1.6 74.38 0.28 0.38 (20)
DS102 c.t.-NTIMS 185.5 1.7 116.6 1.1 144.5 1.3 74.36 0.28 0.38 DS122 c.t.-NTIMS 65.49 1.06 41.17 0.67 51.26 0.83 74.69 0.28 0.37 DS162 c.t.-NTIMS 246.3 3.2 154.8 1.9 193.7 2.4 75.05 0.28 0.37 Cash DS97-12 c.t.-NTIMS 128.6 2.7 80.82 1.67 103 2.1 76.45 0.31 0.41 DS97-35 c.t.-NTIMS 53.56 0.43 33.66 0.27 42.87 0.33 76.39 0.29 0.38
108

Table B1. Compiled Re-Os molybdenite ages from peer reviewed journals-continued Year Country Deposit/Locality Sample Method Re Error 187Re Error 187Os Error Age Error (2s)Error (%)Reference2001 Canada Mt.Nansen DS97-97 c.t.-NTIMS 36.91 0.83 23.19 0.52 27.47 0.62 71.05 0.26 0.37 (20)
Zappa DS202 c.t.-NTIMS 765.2 35.3 480.9 22.2 596.9 27.4 74.46 0.28 0.38 Koffee DS00-57 c.t.-NTIMS 287.8 2.8 180.9 1.7 224.7 2.1 74.49 0.28 0.38 Idaho Creek DS221 c.t.-NTIMS 43.22 0.25 27.17 0.15 47.19 0.18 104.19 0.55 0.53 Pattison DS226 c.t.-NTIMS 4.83 0.031 3.036 0.019 5.284 0.032 102.41 0.39 0.38 DS227 c.t.-NTIMS 23.18 0.01 14.57 0.07 25.03 0.1 103.06 0.38 0.37
2001 Russia Lobash c.t.-NTIMS 23.47 0.008 677 1 2694 9 0.33 (21) a.f.-NTIMS 39.967 0.025 1152 3 2692 11 0.41 a.f.-NTIMS 22.147 0.016 638 2 2691 11 0.41
2002Australia Cleo-Sunrise CD370, 508.6 m c.t. 35.56 0.02 1014 3 2663 11 0.41 (22)2002 Japan Busetsu Nakano (RY83C) a.f. 2.906 0.001 2.326 0.001 76.4 0.3 0.39 (23)2002Romania Dognecea c.t. 1524 1 957.9 0.9 1224 2 76.6 0.3 0.39 (24)2002 USA Fort Knox FK-1-1 c.t.-NTIMS 15.29 0.01 9.61 0.07 14.91 0.11 93 0.4 0.43 (25)
FK-1-2 c.t.-NTIMS 12.35 0.02 7.76 0.09 11.94 0.15 92.2 0.5 0.54 FK-2-1 c.t.-NTIMS 36.94 0.09 23.22 0.26 35.97 0.4 92.9 0.4 0.43 FK-2-2 c.t.-NTIMS 35.89 0.07 22.55 0.2 34.82 0.3 92.6 0.4 0.43 FK-2-3 c.t.-NTIMS 41.34 0.06 25.98 0.14 39.78 0.19 91.8 0.3 0.33 FK-3 c.t.-NTIMS 13.59 0.04 8.54 0.03 13.23 0.02 92.9 0.4 0.43
2002 USA Pogo-Liese Zone L100U096-101.2 c.t.-NTIMS 4.209 0.005 2.645 0.012 4.598 0.019 104.2 0.5 0.48 L100U078-1-202 c.t.-NTIMS 1.753 0.014 1.102 0.008 1.915 0.014 104.2 1 0.96
2002 USA Pogo-Liese Zone L100U078-2-202 c.t.-NTIMS 0.197 0.002 0.124 0.001 0.124 n.r. 104.5 1.5 1.442002 Chile Candelaria c.t.-NTIMS 73.11 n.r. n.r. n.r. 85.31 n.r. 115.2 0.6 0.52 (26)
c.t.-NTIMS 77.21 n.r. n.r. n.r. 93.47 n.r. 114.2 0.6 0.532003 ? ? B-25-1 c.t.-NTIMS 38 0.4 n.r. n.r. 744 10 1842 5 0.27 (27)2003 ? ? B-25-2 c.t.-NTIMS 37.88 0.03 n.r. n.r. 739.8 0.4 1837 2 0.11
B-25-3 c.t.-NTIMS 38.69 0.03 n.r. n.r. 756.5 0.4 1839 2 0.11 B-25-4 c.t.-NTIMS 37.35 0.02 n.r. n.r. 729.6 0.2 1837 2 0.11
2003 Chile Los Pelambres CH02-LP13-1 c.t.-NTIMS 303.4 0.2 n.r. n.r. 36.59 0.07 11.516 0.025 0.22 CH02-LP13-2 c.t.-NTIMS 312.7 0.2 n.r. n.r. 37.71 0.06 11.519 0.021 0.18 CH02-LP13-3 c.t.-NTIMS 396 0.2 n.r. n.r. 35.68 0.06 11.513 0.022 0.19
109

Table B1. Compiled Re-Os molybdenite ages from peer reviewed journals-continued Year Country Deposit/Locality Sample Method Re Error 187Re Error 187Os Error Age Error (2s) Error (%) Reference2003 Brazil Solobo KR-21-A c.t.-NTIMS 199.3 0.1 n.r. n.r. 5493 2 2576 8 0.31 (28)
KR-21-A c.t.-NTIMS 198.4 0.1 n.r. n.r. 5468 5 2576 8 0.31 KR-21-B c.t.-NTIMS 83.17 0.06 n.r. n.r. 2278 2 2561 8 0.31 KR-21-B c.t.-NTIMS 81.92 0.06 n.r. n.r. 2245 1 2562 8 0.31 KR-21-B c.t.-NTIMS 80.31 0.04 n.r. n.r. 2202 1 2563 8 0.31
2003 Canada Clear Creek-Pukelman CC-1-1 c.t.-NTIMS 211.7 3 133.1 1.4 217.8 2.3 98.2 0.4 0.41 (29) CC-1-2 c.t.-NTIMS 192.6 2.9 121 1.5 199.9 2.5 99 0.4 0.40 CC-1-3 c.t.-NTIMS 184.9 2.6 116.2 1.4 188.2 2.2 97.1 0.4 0.41 CC-1-4 c.t.-NTIMS 180.5 0.9 113.5 0.6 183 0.8 96.7 0.4 0.41 DS7-01-1 c.t.-NTIMS 149 0.5 93.67 0.3 146.2 0.4 93.6 0.3 0.32 DS7-01-2 c.t.-NTIMS 142.2 0.4 89.35 0.28 139.6 0.3 93.6 0.3 0.32 DS7-01-3 c.t.-NTIMS 142 0.5 89.27 0.28 139.5 0.3 93.7 0.3 0.32 CC-3-1 c.t.-NTIMS 177.8 0.6 11.7 0.4 172.6 0.4 92.6 0.3 0.32 CC-3-2 c.t.-NTIMS 176.3 0.6 110.8 0.4 170.8 0.4 92.4 0.4 0.43
2003 Canada Clear Creek-Saddle CC-2-1 c.t.-NTIMS 419.8 4.4 263.9 2.7 411.1 4.2 93.4 0.4 0.43 CC-2-2 c.t.-NTIMS 434.5 2.7 273.1 1.7 426.2 2.5 93.5 0.3 0.32
2003 Canada Dublin Gulch-Olive DG-1-1 c.t.-NTIMS 514.3 22.1 323.3 4.3 508.3 6.7 94.3 0.3 0.32 DG-1-2 c.t.-NTIMS 695.8 72.2 437.3 10.4 693.8 16.4 95.2 0.4 0.42 DS2-01-1 c.t.-NTIMS 282.5 0.8 177.6 0.6 275.8 0.7 93.1 0.3 0.32 DS2-01-2 c.t.-NTIMS 284.7 0.9 178.9 0.6 278.1 0.7 93.2 0.3 0.32
2003 Canada Mactung MT-02-1 c.t.-NTIMS 19.2 0.3 12.06 0.18 19.56 0.3 97.2 0.5 0.51 MT-02-2 c.t.-NTIMS 16.51 0.16 10.38 0.1 16.76 0.16 96.9 0.5 0.52 DS8-01-1 c.t.-NTIMS 4.678 0.015 2.94 0.01 4.76 0.011 97.1 0.4 0.41 DS8-01-2 c.t.-NTIMS 4.61 0.013 2.897 0.008 4.694 0.009 97.1 0.4 0.41 DS9-01 c.t.-NTIMS 12.48 0.04 7.843 0.023 12.72 0.02 97.2 0.4 0.41 DS12-01 c.t.-NTIMS 11.64 0.05 7.316 0.029 11.91 0.04 97.6 0.4 0.41
2003Norway Mjavaasknuten NWOO-MJ1 c.t.-NTIMS 9.846 0.006 6.188 0.004 100.9 0.2 970 3 0.31 (30) NWOO-MJ2 c.t.-NTIMS 12.834 0.009 8.066 0.006131.96 0.07 974 3 0.31 NWOO-MJ2 c.t.-NTIMS 12.242 0.008 7.694 0.005125.63 0.07 972 3 0.31 NWOO-ST1 c.t.-NTIMS 1.1131 0.0008 0.6996 0.000511.385 0.006 969 3 0.31
110

Table B1. Compiled Re-Os molybdenite ages from peer reviewed journals-continued Year Country Deposit/Locality Sample Method Re Error 187Re Error 187Os Error Age Error (2s)Error (%)Reference2003 USA BGD-1-1 c.t.-NTIMS 359.1 0.4 225.8 0.2 269.4 0.3 71.7 0.3 0.42 (31)
BGD-1-2 c.t.-NTIMS 329.7 0.3 207.3 0.2 247.8 0.2 71.8 0.3 0.42 BGD-1-3 c.t.-NTIMS 642.3 0.6 403.8 0.4 484.5 0.5 72.1 0.3 0.42 BGD-19 c.t.-NTIMS 372 0.4 233.9 0.2 279.2 0.3 71.7 0.3 0.42 BGD-10-1 c.t.-NTIMS 506.5 0.5 318.4 0.3 402 0.4 75.8 0.3 0.40 BGD-10-2 c.t.-NTIMS 551.1 0.6 346.4 0.3 437.2 0.4 75.8 0.3 0.40 BGD-10-3 c.t.-NTIMS 466.9 0.5 293.5 0.3 371.9 0.4 76.1 0.3 0.39
2003 USA c.t.-NTIMS 234 n.r. n.r. n.r. 125.75 n.r. 60.2 0.3 0.50 (32)2003 Longhushan c.t.-NTIMS 12.68 0.03 n.r. n.r. 18.48 0.01 139.02 0.34 0.24 (33)
Xianlinbu c.t.-NTIMS 20.3 0.07 n.r. n.r. 28.1 0.02 132.05 0.47 0.36 c.t.-NTIMS ? 27.86 0.01 130.92 0.45 0.34
2004 India Malanjkhand A-6 granite (clot) c.t.-NTIMS 477.1 0.4 n.r. n.r. 12700 8 2490 8 0.32 (34) A-7 granite (clot) c.t.-NTIMS 458.1 0.4 n.r. n.r. 12195 8 2490 8 0.32 A-2b quartz reef c.t.-NTIMS 432.2 0.4 n.r. n.r. 11509 12 2491 8 0.32 A-8 granite (vein)c.t.-NTIMS 623.3 0.6 n.r. n.r. 16575 17 2488 8 0.32 A-1 quartz reef c.t.-NTIMS 490 0.3 n.r. n.r. 12964 8 2475 8 0.32 A-1 quartz reef c.t.-NTIMS 481.5 0.4 n.r. n.r. 12718 29 2471 9 0.36 A-2 quartz reef c.t.-NTIMS 512.5 0.3 n.r. n.r. 13428 8 2451 8 0.33 A-2 quartz reef c.t.-NTIMS 546 0.5 n.r. n.r. 14270 16 2446 8 0.33
2004 Canada Endako ribbon vein 2706.SWB-1 c.t.-NTIMS n.r. n.r. 17.05 0.15 41.39 0.34 145.5 0.6 0.41 (35) 2706.SWB-2 c.t.-NTIMS n.r. n.r. 19.17 0.18 46.62 0.42 145.8 0.6 0.41 2706.SWB-3 c.t.-NTIMS n.r. n.r. 19.23 0.19 46.7 0.47 145.6 0.7 0.48 2706.SWB-4 c.t.-NTIMS n.r. n.r. 19.07 0.18 45.97 0.43 144.5 0.7 0.48 2706.SWB-5 c.t.-NTIMS n.r. n.r. 19.51 0.19 47.53 0.35 146 0.8 0.55 2706.SWB-6 c.t.-NTIMS n.r. n.r. 19.14 0.17 46.57 0.41 145.9 0.5 0.34 2706.SWB-7 c.t.-NTIMS n.r. n.r. 18.91 0.09 46.21 0.19 146.5 0.5 0.34 2706.SWB-8 c.t.-NTIMS n.r. n.r. 19.21 0.16 46.77 0.37 145.9 0.6 0.41 2706.SWB-9 c.t.-NTIMS n.r. n.r. 19.55 0.09 47.46 0.21 145.5 0.5 0.34 2706.SWB-10 c.t.-NTIMS n.r. n.r. 18.6 0.26 45.3 0.62 146 0.7 0.48
111

Table B1. Compiled Re-Os molybdenite ages from peer reviewed journals-continued Year Country Deposit/Locality Sample Method Re Error 187Re Error 187Os Error Age Error (2s)Error (%) Reference2004 Canada Long Lake Sc-13L-1 c.t.-NTIMS n.r. n.r. 4.213 0.021 26.41 0.12 375 1.5 0.40 (35)
Sc-13L-2 c.t.-NTIMS n.r. n.r. 4.233 0.021 26.03 0.12 367.9 1.5 0.41 Sc-13L-3 c.t.-NTIMS n.r. n.r. 4.209 0.015 26.06 0.07 370.5 1.4 0.38 Sc-13L-4 c.t.-NTIMS n.r. n.r. 4.14 0.015 25.65 0.07 370.8 1.4 0.38 Sc-13L-5 c.t.-NTIMS n.r. n.r. 4.248 0.015 26.34 0.07 371.1 1.4 0.38 Sc-13L-6 c.t.-NTIMS n.r. n.r. 4.272 0.014 26.45 0.06 370.5 1.4 0.38 Sc-13L-7 c.t.-NTIMS n.r. n.r. 4.227 0.014 26.29 0.06 372.1 1.4 0.38
2004 Canada Walker Sc15W-1 c.t.-NTIMS n.r. n.r. 1.496 0.006 9.297 0.02 371.9 1.6 0.43 Sc15W-2 c.t.-NTIMS n.r. n.r. 1.496 0.006 9.284 0.03 371.4 1.9 0.51 Sc15W-3 c.t.-NTIMS n.r. n.r. 1.479 0.003 9.144 0.032 369.9 1.8 0.49
2004 Canada Walker Sc20W-1 c.t.-NTIMS n.r. n.r. 0.447 0.003 2.799 0.016 374.6 2.4 0.64 Sc20W-2 c.t.-NTIMS n.r. n.r. 0.494 0.004 2.95 0.023 357.6 3.5 0.98 Sc20W-3 c.t.-NTIMS n.r. n.r. 0.466 0.003 3.466 0.023 444.4 4.2 0.95 Sc20W-4 c.t.-NTIMS n.r. n.r. 0.465 0.003 2.961 0.02 381.3 3.6 0.94 Sc20W-5 c.t.-NTIMS n.r. n.r. 0.497 0.002 3.187 0.015 383.8 2.6 0.68 Sc20W-6 c.t.-NTIMS n.r. n.r. 0.521 0.003 3.167 0.016 363.5 2.5 0.69 Sc20W-7 c.t.-NTIMS n.r. n.r. 0.336 0.002 1.859 0.008 330.9 2.1 0.63 Sc20W-8 c.t.-NTIMS n.r. n.r. 0.438 0.002 1.931 0.008 263.6 1.7 0.64 Sc20W-A c.t.-NTIMS n.r. n.r. 0.381 0.006 2.789 0.047 437.9 9.2 2.10 Sc20W-B1 c.t.-NTIMS n.r. n.r. 0.365 0.002 2.338 0.011 383.5 2.6 0.68 Sc20W-B2 c.t.-NTIMS n.r. n.r. 0.348 0.003 2.219 0.019 381.2 4.5 1.18 Sc20W-B3 c.t.-NTIMS n.r. n.r. 0.26 0.003 1.745 0.017 401.7 5.4 1.34 Sc20W-B4 c.t.-NTIMS n.r. n.r. 0.393 0.003 2.506 0.017 381.4 3.9 1.02 Sc20W-C c.t.-NTIMS n.r. n.r. 0.413 0.003 3.372 0.023 488.5 4.7 0.96
2004 Canada Clark Lake KQ78-84A-1 c.t.-NTIMS n.r. n.r. 121.9 0.412 5594.5 14.5 2694.3 9.5 0.35 KQ78-84A-2 c.t.-NTIMS n.r. n.r. 122.3 0.364 5617.8 11.1 2695.2 9.6 0.36 KQ78-84A-3 c.t.-NTIMS n.r. n.r. 119.6 0.569 5484.1 23 2690.8 9.6 0.36 KQ78-84A-4 c.t.-NTIMS n.r. n.r. 116.1 0.901 5312.8 39.5 2685.1 9.6 0.36 KQ78-84A-5 c.t.-NTIMS n.r. n.r. 121.8 0.464 5597.1 17.2 2697.5 9.6 0.36
112

Table B1. Compiled Re-Os molybdenite ages from peer reviewed journals-continued
Year Country Deposit/Locality Sample Method Re Error 187Re Error 187Os Error Age Error (2s)
Error (%) Reference
2004 Canada Setting Net Lake 76FR-77-3 c.t.-NTIMS n.r. n.r. 9.878 0.029 454.1 0.913 2698 9.5 0.35 (35) 76FR-77-4 c.t.-NTIMS n.r. n.r. 9.87 0.034 454.2 1.223 2700.5 9.7 0.36 76FR-77-5 c.t.-NTIMS n.r. n.r. 9.921 0.049 456.1 2.059 2700.1 10 0.37
2004 Austria Alpeiner Scharte AS00-AS4 c.t.-NTIMS 35.6ppb 0.1 n.r. n.r. 0.1145 3E-04 306.8 3.1 1.01 (36) AS00-AS2 c.t.-NTIMS 5.46ppb 0.03 n.r. n.r. 0.0172 4E-04 300 8 2.67
2004Saudi Arabia Ad Duwayhi ADC6-162 c.t.-NTIMS 5.049 0.004 n.r. n.r. 34.85 0.09 655.6 2.7 0.41 (37) AD24-81.6 c.t.-NTIMS 1.356 0.002 n.r. n.r. 9.279 0.009 649.9 2.3 0.35
2004 Greenland Malmbjerg Malm-1 a.f.-NTIMS 6.086 0.003 n.r. n.r. 1.645 0.005 25.8 0.1 0.39 (38) Flammefjeld 8215128 c.t.-NTIMS 192.9 0.1 n.r. n.r. 80.04 0.06 39.6 0.1 0.25
2004 Australia Chalice CUD001510 c.t.-NTIMS 74.73 0.03 46.97 0.02 2097 4 2621 10 0.38 (39)2004 Ireland Galway Mace MH-19-1-1 c.t.-NTIMS 75.74 0.36 47.6 0.23 324.1 1.4 407.3 1.5 0.37 (40)
MH-19-2 c.t.-NTIMS 75.92 0.27 47.72 0.17 325 0.9 407.3 1.5 0.372004 Ireland Galway Murvey MH-1-1 c.t.-NTIMS 5.14 0.01 3.23 0.01 22.16 0.04 410.5 1.5 0.37
MH-1-2 c.t.-NTIMS 5.09 0.01 3.2 0.01 21.97 0.04 410.8 1.4 0.342004 Chile El Teniente DDH-2176 c.t.-NTIMS 73 n.r. 45.698 n.r. 7.58 n.r. 6.31 0.03 0.48 (41)
tt-Mo-1 c.t.-NTIMS 182.26 n.r. 114.59 n.r. 10.75 n.r. 5.6 0.02 0.36 tt-Mo-1 c.t.-NTIMS 184.19 n.r. 115.8 n.r. 10.95 n.r. 5.6 0.02 0.36 TT-179 c.t.-NTIMS 168.7 n.r. 104.59 n.r. 8.8 n.r. 4.89 0.08 1.64 tt-Mo-6 c.t.-NTIMS 1153.7 n.r. 725.26 n.r. 59.09 n.r. 4.87 0.03 0.62 TT-174 c.t.-NTIMS 72.54 n.r. 45.6 n.r. 3.66 n.r. 4.83 0.03 0.62 TT-164 c.t.-NTIMS 220.06 n.r. 138.35 n.r. 10.79 n.r. 4.78 0.03 0.63 tt-Mo-5 c.t.-NTIMS 249.52 n.r. 156.87 n.r. 11.57 n.r. 4.42 0.02 0.45 tt-Mo-7 c.t.-NTIMS 319.93 n.r. 201.14 n.r. 14.68 n.r. 4.42 0.02 0.45 tt-Mo-8 c.t.-NTIMS 254.81 n.r. 160.2 n.r. 11.81 n.r. 4.42 0.02 0.45
Note: a.h.d.: acid-heated dissolution; a.f.: alkaline fusion; m.d.: microwave digestion; c.t.: Carius tube; n.r.: not reported. Total Re and 187Re in ppm, 187Os in ppb; age in Ma; 2s = 2 sigma. 113

References: (1) Luck and Allegre (1982); (2) Suzuki et al. (1993); (3) McCandless et al. (1993); (4) McCandless and Ruiz (1993); (5) Santosh et al. (1994); (6) Suzuki et al. (1996); (7) Stein et al. (1997); (8) Chesley and Ruiz (1997); (9) Markey et al. (1998); (10) Stein et al. (1998); (11) Frei et al. (1998); (12) Suzuki et al. (2000); (13) Raith and Stein (2000); (14) Watanabe and Stein (2000); (15) Torrealday et al. (2000); (16) Suzuki et al. (2001); (17) Zacharias et al. (2001); (18) Arne et al. (2001); (19) Selby and Creaser (2001a); (20) Selby and Creaser (2001b); (21) Stein et al. (2001); (22) Brown et al. (2002); (23) Ishihara et al. (2002); (24) Ciobanu et al. (2002); (25) Selby et al. (2002); (26) Mathur et al. (2002); (27) Markey et al. (2003); (28) Requia et al. (2003); (29) Selby et al. (2003); (30) Bingen and Stein (2003); (31) Barra et al. (2003); (32) Gilmer et al. (2003); (33) Sun et al. (2003); (34) Stein et al. (2004); (35) Selby and Creaser (2004); (36) Langthaler et l. (2004); (37) Doebrich et al. (2004); (38) Brooks et al. (2004); (39) Bucci et al. (2004); (40) Selby et al. (2004); (41) Maksaev et al. (2004).
114

Table B2. Published data on sample HPL-5.
Amount (mg) Method Re
(ppm) Error 187Re (ppm) Error 187 Os (ppb) Error Age (Ma) Error (2s) Error (%) Reference Lab
~25 a.f. 278.1 0.5 n.r. n.r. 645 2 221.1 0.90 0.41 Stein et al (1997) AIRIE ~25 a.f. 285.3 0.5 n.r. n.r. 662 2 221.1 0.90 0.41 ~25 a.f. 289.1 0.6 n.r. n.r. 672 2 221.6 0.90 0.41 ~25 a.f. 281.8 0.5 n.r. n.r. 656 2 221.9 0.90 0.41 ~25 a.f. 284.4 0.5 n.r. n.r. 662 2 222 0.90 0.41 ~25 a.f. 282.7 0.5 n.r. n.r. 657 2 221.5 0.90 0.41 ~25 a.f. 284.5 0.5 n.r. n.r. 661 2 221.5 0.90 0.41 ~25 a.f. 278.1 1.22 n.r. n.r. 645 3.2 221.1 0.90 0.41 Markey et al. (1998) AIRIE ~25 a.f. 285.3 1.09 n.r. n.r. 662 2.9 221.1 0.90 0.41 ~25 a.f. 289.1 1.19 n.r. n.r. 672 3 221.6 0.93 0.42 ~25 a.f. 281.8 1.16 n.r. n.r. 656 3 221.1 0.91 0.41 ~25 a.f. 284.4 1.14 n.r. n.r. 662 3 222 0.92 0.41 ~25 a.f. 282.7 1.17 n.r. n.r. 657 3.1 221.5 0.90 0.41 ~25 a.f. 284.5 1.17 n.r. n.r. 661 3.1 221.5 0.91 0.41 ~25 a.f. 282 1.17 n.r. n.r. 654 3.1 221 0.89 0.40 ~25 a.f. 286.4 0.93 n.r. n.r. 660 2.6 219.7 0.88 0.40 ~25 a.f. 283.9 1.2 n.r. n.r. 662 3.2 221 0.88 0.40 ~25 a.f. 284.5 1.67 n.r. n.r. 661 3.7 222.2 1.09 0.49 ~25 a.f. 283.7 1.56 n.r. n.r. 657 3.4 220.8 1.08 0.49 ~25 a.f. 287 1.4 n.r. n.r. 657 3 218 1.07 0.49 ~25 a.f. 285.3 2.05 n.r. n.r. 661 4.6 220.7 1.09 0.49 ~25 a.f. 286.4 1.48 n.r. n.r. 658 3.2 219.1 1.07 0.49 ~25 a.f. 285.7 1.41 n.r. n.r. 660 3.1 220.4 1.08 0.49 ~25 a.f. 283.7 1.24 n.r. n.r. 659 3.1 221.3 0.96 0.43 ~25 a.f. 282.8 1.23 n.r. n.r. 657 3 221.5 0.97 0.44 ~25 a.f. 286.9 1.22 n.r. n.r. 667 3 221.5 0.96 0.43
115

Table B2. Published data on sample HPL-5-continued.
Amount (mg) Method Re
(ppm) Error 187Re (ppm) Error 187 Os (ppb) Error Age (Ma) Error (2s) Error (%) Reference Lab
1-2 c.t. 240.4 n.r. 151.1 n.r. 555.6 n.r. 220.3 0.71 0.32 Selby and Creaser (2001a) U.Alberta 1-2 c.t. 260.7 n.r. 163.9 n.r. 598.3 n.r. 218.8 0.69 0.32 1-2 c.t. 265.7 n.r. 167 n.r. 611.6 n.r. 219.4 0.70 0.32 1-2 c.t. 268 n.r. 168.5 n.r. 619.6 n.r. 220.4 0.72 0.33 1-2 c.t. 256.4 n.r. 161.2 n.r. 593.5 n.r. 220.5 0.70 0.32 n.r. c.t. 274.6 10.4 172.6 3.8 638.4 13.8 220.71 0.80 0.36 Selby and Creaser (2001b) U.Alberta n.r. c.t. 270.2 12.4 169.9 4.6 627.9 16.7 220.6 0.80 0.36 n.r. c.t. 264.3 7.9 166.1 3 612.8 10.9 220.89 0.79 0.36 n.r. m.d. 283.9 5 n.r. n.r. 661 12 221.8 5.50 2.48 Suzuki et al. (2001) U. Tokio n.r. m.d. 282.5 3.1 n.r. n.r. 663 3.3 223.7 2.70 1.21 n.r. m.d. 281.3 2.6 n.r. n.r. 652 13 220.8 4.80 2.17 n.r. m.d. 290.1 6.9 n.r. n.r. 673.9 4.7 221.5 5.50 2.48 1.5 c.t. n.r. n.r. 166.4 4.5 611.6 16.4 220.2 0.80 0.36 Selby and Creaser (2004) U. Alberta 2.1 c.t. n.r. n.r. 167.8 2 619.6 12 221.2 0.80 0.36 1 c.t. n.r. n.r. 160.6 6.4 593.5 23.7 221.3 0.80 0.36
0.9 c.t. n.r. n.r. 150.6 6.9 555.6 25.3 221.1 0.80 0.36 1.7 c.t. n.r. n.r. 163.3 3.9 598.3 14.2 219.6 0.80 0.36 1.9 c.t. n.r. n.r. 173.1 3.8 637.3 13.8 220.6 0.80 0.36 1.5 c.t. n.r. n.r. 170.4 4.6 626.7 16.7 220.4 0.80 0.36 2.3 c.t. n.r. n.r. 166.6 3 611.6 10.9 219.9 0.80 0.36 2 c.t. n.r. n.r. 161.2 3.2 593.2 11.8 220.5 0.80 0.36
5.3 c.t. n.r. n.r. 164.5 1.3 603.4 4.7 219.8 0.80 0.36 2.2 c.t. n.r. n.r. 162.5 3 598.2 10.9 220.5 0.80 0.36 5.2 c.t. n.r. n.r. 169.4 1.4 623.4 4.9 220.5 0.80 0.36
10.4 c.t. n.r. n.r. 174 0.8 640.8 2.7 220.7 0.80 0.36 15.5 c.t. n.r. n.r. 172.4 0.7 635 2 220.6 0.80 0.36 20.4 c.t. n.r. n.r. 174.5 0.6 643 1.7 220.7 0.80 0.36 24.8 c.t. n.r. n.r. 175.1 0.6 645.1 1.5 220.7 0.80 0.36 10.6 c.t. n.r. n.r. 174 0.8 640.7 2.7 220.6 0.80 0.36
116

Table B3. Published data on “in-house” standard A996
Amount (mg) Method Re (ppm) Error 187Re (ppm) Error187Os (ppb) Error Age (Ma) Error (2s)
Error (%) Reference
Sample A996B n.r. a.f. 23.73 0.09 n.r. n.r. 710 3 2790 11 0.39 Markey et al. (1998) n.r. a.f. 23.21 0.05 n.r. n.r. 695 2 2792 11 0.39 n.r. a.f. 23.01 0.05 n.r. n.r. 692 2 2806 11 0.39
1.5 c.t. n.r. n.r. 13.5 0.37 641.3 17.5 2785.3 9.1 0.33 Creaser and Selby (2004) 2 c.t. n.r. n.r. 16.79 0.33 805 15.9 2811.8 9.1 0.32
3.2 c.t. n.r. n.r. 14.00 0.18 667.2 8.5 2796.2 8.9 0.32 9.9 c.t. n.r. n.r. 13.77 0.06 656.3 2.8 2795.4 8.8 0.31
10.6 c.t. n.r. n.r. 14.04 0.06 666.6 2.8 2784.2 8.7 0.31 40.2 c.t. n.r. n.r. 13.77 0.04 655.4 1.3 2791.1 9.7 0.35 39.8 c.t. n.r. n.r. 14.19 0.04 677.4 1.4 2793.9 9.8 0.35 40.5 c.t. n.r. n.r. 13.68 0.04 651.6 1.3 2791.9 9.8 0.35 50.4 c.t. n.r. n.r. 14.32 0.04 683.6 1.3 2797.5 9.9 0.35
Sample A996D 56.13 c.t. 17.369 0.009 n.r. n.r. 513.7 0.7 2760 10.00 0.36 Stein et al. (2001) 59.03 c.t. 17.269 0.009 n.r. n.r. 510.9 0.3 2761 9.00 0.33
5.24 c.t. 16.624 0.034 n.r. n.r. 535.5 0.8 3000 11.00 0.37 3.92 c.t. 17.515 0.034 n.r. n.r. 520.4 0.9 2773 10.00 0.36
Note: a.f.: alkaline fusion; c.t.: Carius tube
117

118 REFERENCES
Barra, F., Ruiz, J., Mathur, R., and Titley, S., 2003, A Re-Os study of sulfide minerals from the Bagdad porphyry Cu-Mo deposit, northern Arizona, USA: Mineralium Deposita, v. 38, p. 585-596.
Barra, F., Broughton, D., Ruiz, J., and Hitzman, M. W., 2004, Multi-stage mineralization in the Zambian Copperbelt based on Re-Os isotope constraints: Geological Society of America, Abstract with Programs, Denver, Colorado, USA, 2004.
Bingen, B., and Stein, H. J., 2003, Molybdenite Re-Os dating of biotite dehydration melting in the Rogaland high-temperature granulites, S Norway: Earth and Planetary Science Letters, v. 208, p. 181-195.
Birck, J. L., Roy Barman, M., and Capmas, F., 1997, Re-Os isotopic measurements at the Femtomole level in natural samples: Geostandards Newsletter, v. 20, p. 19-27.
Brooks, C. K., Tegner, C., Stein, H. J., and Thomassen, B., 2004, Re-Os and 40Ar/39Ar ages of porphyry molybdenum deposits in the east Greenland volcanic-rifted margin: Economic Geology, v. 99, p. 1215-1222.
Chesley, J., and Ruiz, J., 1997, Preliminary Re-Os dating on molybdenite mineralization from the Bingham Canyon porphyry copper deposit, Utah, in Thompson, T. B., ed., Geology and Ore Deposits of the Oquirrh and Wasatch Mountains, Utah, SEG Guidebook Series 29, p. 165-169.
Cohen, A. S., and Waters, F. G., 1996, Separation of osmium from geological materials by solvent extraction for analysis by thermal ionisation mass spectrometry: Analytica Chimica Acta, v. 332, p. 269-275.
Creaser, R. A., Papanastassiow, D. A., and Wasserburg, G. J., 1991, Negative thermal ion mass spectrometry of osmium, rhenium, and iridium: Geochimica et Cosmochimica Acta, v. 55, p. 397-401.
Doebrich, J. L., Zahony, S. G., Leavitt, J. D., Portacio Jr, J. S., Siddiqui, A. A., Wooden, J. L., Fleck, R. J., and Stein, H. J., 2004, Ad Duwayhi, Saudi Arabia: Geology and geochronology of a Nepproterozoic intrusion-related gold system in the Arabian Shield: Economic Geology, v. 99, p. 713-741.
Faure, G., 1986, Principles of Isotope Geology: New York, John Wiley & Sons, 589 p.
Fleischer, M., 1959, The geochemistry of rhenium, with special reference to its occurrence in molybdenite: Economic Geology, v. 54, p. 1406-1413.

119 Frei, R., Nagler, T. F., and Meisel, T., 1996, Efficient N-TIMS rhenium isotope
measurements on outgassed tantalum filaments: very low filament blanks determined by a "standard addition" approach: International Journal of Mass Spectrometry and Ion Processes, v. 153, p. L7-L10.
Gramlich, J. W., Murphy, T. J., Gardner, E. L., and Shields, W. R., 1973, Absolute isotopic abundance ratio and atomic weight of a reference sample of rhenium: Journal of Research of the National Bureau of Standards. Section A, Physics and Chemistry, v. 77A, p. 691-698.
Herr, W., Hintenberg, H., and Voshage, H., 1954, Half-life of rhenium: Physical Review, v. 95, p. 1691.
Herr, W., and Merz, E., 1955, Eine neue methode zur altersbestimmung von rhenium-haltigen mineralien mittels neutronenaktivierung: Zeitschrift fur Naturforschung, v. 10a, p. 613-615.
Herr, W., and Merz, E., 1958, Zur bestimmung der halbwertszeit des 187Re: Zeitschrift fur Naturforschung, v. 13a, p. 231-233.
Hirt, B., Tilton, G. R., Herr, W., and Hoffmeister, W., 1963, The half life of 187Re, in Goldberg, E., ed., Earth Science Meteoritics, North Holland, p. 273-280.
Ishihara, S., Shibata, K., and Uchiumi, S., 1989, K-Ar ages of molybdenum mineralization in the east-central Kitami Mountains, northern Honshu, Japan: Comparison with Re-Os age: Geochemical Journal, v. 23, p. 85-89.
Kosler, J., Simonetti, A., Sylvester, P. J., Cox, R. A., Tubrett, M. N., and Wilton, D. H. C., 2003, Laser-ablasion ICP-MS measurements of Re/Os in molybdneite and implications for Re-Os geochronology: The Canadian Mineralogist, v. 41, p. 307-320.
Kovalenker, V. A., Laputina, I. P., and Vyal'sov, L. N., 1974, Rhenium-rich molybdenite from the Talnakh copper-niquel deposit (Noril'sk region): Doklady Akademii nauk SSSR, v. 217, p. 104-106.
Luck, J. M., and Allegre, C. J., 1982, The study of molybdenites through the 187Re-187Os chronometer: Earth and Planetary Science Letters, v. 61, p. 291-296.
Maksaev, V., Munizaga, F., McWilliams, M., Fanning, M., Mathur, R., Ruiz, J., and Zentilli, M., 2004, New geochronology for El Teniente, Chilean Andes, from U-Pb, 40Ar/39Ar, Re-Os and fission-track dating: Implications for the evolution of a supergiant porphyry Cu-Mo deposit, in Vidal, C. E., ed., Andean Metallogeny:

120 New Discoveries, Concepts, and Updates, Special Publication Number 11, Society of Economic Geologists, p. 15-54.
Markey, R. J., Stein, H. J., and Morgan, J. W., 1998, Highly precise Re-Os dating for molybdenite using alkaline fusion and NTIMS: Talanta, v. 45, p. 935-946.
Markey, R. J., Hannah, J. L., Morgan, J. W., and Stein, H. J., 2003, A double spike for osmium analysis of highly radiogenic samples: Chemical Geology, v. 200, p. 395-406.
Mathur, R., Marschik, R., Ruiz, J., Munizaga, F., Leveille, R. A., and Martin, W., 2002, Age of mineralization of the Candelaria Fe oxide Cu-Au deposit and the origin of the Chilean iron belt, based on Re-Os isotopes: Economic Geology, v. 97, p. 59-71.
McCandless, T. E., Ruiz, J., and Campbell, A. R., 1993, Rhenium behavior in molybdenite in hypogene and near-surface environments: Implications for Re-Os geochronometry: Geochimica et Cosmochimica Acta, v. 57, p. 889-905.
Morgan, J. W., and Walker, R. J., 1989, Isotopic determinations of rhenium and osmium in meteorites by using fusion, distillation, and ion-exchange separations: Analytica Chimica Acta, v. 222, p. 291-300.
Nagler, T. F., and Frei, R., 1997, 'Plug in' Os distillation: Schweizerische mineralogische und petrographische Mitteilungen, v. 77, p. 123-127.
Naldrett, S. N., and Libby, W. F., 1948, Natural radioactivity of rhenium: Physical Review, v. 73, p. 487-493.
Raith, J. G., and Stein, H. J., 2000, Re-Os dating and sulfur isotope composition of molybdenite from tungsten deposits in western Namaqualand, South Africa: implications for ore genesis and the timing of metammorphism: Mineralium Deposita, v. 35, p. 741-753.
Requia, K., Stein, H. J., Fontbote, L., and Chiaradia, M., 2003, Re-Os and Pb-Pb geochronology of the Archean Salobo iron oxide copper-gold deposit, Carajas mineral province, northern Brazil: Mineralium Deposita, v. 38, p. 727-738.
Schoenberg, R., Nagler, T. F., and Kramers, J. D., 2000, Precise Os isotope ratio and Re-Os isotope dilution measurements down to the picogram level using multicollector inductively couple plasma mass spectrometry: International Journal of Mass Spectrometry, v. 197, p. 85-94.

121 Selby, D., and Creaser, R. A., 2001a, Late and mid-Cretaceous mineralization in the
northern Canadian Cordillera: Constraints from Re-Os molybdenite dates: Economic Geology, v. 96, p. 1461-1467.
Selby, D., and Creaser, R. A., 2001b, Re-Os geochronology and systematics in molybdenite from the Endako porphyry molybdenum deposit, British Columbia, Canada: Economic Geology, v. 96, p. 197-204.
Selby, D., and Creaser, R. A., 2004, Macroscale NTIMS and microscale LA-MC-ICP-MS Re-Os isotopic analysis of molybdenite: Testing spatial restrictions for reliable Re-Os age determinations, and imlications for the decoupling of Re and Os within molybdenite: Geochimica et Cosmochimica Acta, v. 68, p. 3897-3908.
Selby, D., Creaser, R. A., Hart, C. J. R., Rombach, C. S., Thompson, J. F. H., Smith, M. T., Bakke, A. A., and Goldfarb, R. J., 2002, Absolute timing of sulfide and gold mineralization: A comparison of Re-Os molybdenite and Ar-AR mica methods from Tintina Gold Belt, Alaska: Geology, v. 30, p. 791-794.
Selby, D., Creaser, R. A., Heaman, L. M., and Hart, C. J. R., 2003, Re-Os and U-Pb geochronology of the Clear Creek, Dublin Gulch, and Mactung deposits, Tombstone Gold Belt, Yukon, Canada: absolute timing repaltionships between plutonism and mineralization: Canadian Journal of Earth Sciences, v. 40, p. 1839-1852.
Shen, J. J., Papanastassiou, D. A., and Wasserburg, G. J., 1996, Precise Re-Os determinations and systematics of iron meteorites: Geochimica et Cosmochimica Acta, v. 60, p. 2887-2900.
Shirey, S. B., and Walker, R. J., 1995, Carius tube digestion for low-blank rhenium-osmium analysis: Analytical Chemistry, v. 67, p. 2136-2141.
Smoliar, M. I., Walker, R. J., and Morgan, J. W., 1996, Re-Os ages of Group IIA, IIIA, IVA, and IVB iron meteorites: Science, v. 271, p. 1099-1102.
Stein, H. J., Markey, R. J., Morgan, J. W., Du, A., and Sun, Y., 1997, Highly precise and accurate Re-Os ages for molybdenite from East Qinling molybdenum belt, Shaanxi province, China: Economic Geology, v. 92, p. 827-835.
Stein, H. J., Morgan, J. W., Markey, R. J., and Hannah, J. L., 1998a, An introduction to Re-Os: What's in it for the mineral industry?, SEG Newsletter, January 1998, issue no. 32.
Stein, H. J., Sundblad, K., Markey, R. J., Morgan, J. W., and Motuza, G., 1998b, Re-Os ages for Archean molybdenite and pyrite, Kuittila-Kivisuo, Finland and

122 Proterozoic molybdenite, Kabeliai, Lithuania: testing the chronometer in a metamorphic and metasomatic setting: Mineralium Deposita, v. 33, p. 329-345.
Stein, H. J., Markey, R. J., Morgan, J. W., Hannah, J. L., and Schersten, A., 2001, The remarkable Re-Os chronometer in molybdenite: how and why it works: Terra Nova, v. 13, p. 479-486.
Stein, H. J., Schersten, A., Hannah, J. L., and Markey, R. J., 2003, Subgrain-scale decoupling of Re and 187Os and assessment of laser ablasion ICP-MS spot dating in molybdenite: Geochimica et Cosmochimica Acta, v. 67, p. 3673-3686.
Sutulov, A., 1970, Molybdenum and rhenium recovery from porphyry coppers: Concepcion, Universidad de Concepcion, 252 p.
Suzuki, K., 2004, Reply to "Accurate and precise Re-Os moolybdenite dates from the Galway Granite, Ireland" by D. Selby et al.: Critical comment on "Disturbance of the Re-Os chronometer of molybdneites from the late-Caledonian Galway Granite, Ireland, by hydrothermal fluid circulation": Geochemical Journal, v. 38, p. 295-298.
Suzuki, K., and Masuda, A., 1990, The way to overcome the difficulty in Re-Os dating of molybdenite: Proceedings of the Japan Academy, 1990, p. 173-176.
Suzuki, K., Qi-Lu, Shimizu, H., and Masuda, A., 1992, Determination of osmium abundance in molybdenite mineral by isotope dilution mass spectrometry with microwave digestion using potassium dichromate as oxidizing agent: Analyst, v. 117, p. 1151-1156.
Suzuki, K., Qi-Lu, Shimizu, H., and Masuda, A., 1993, Reliable Re-Os age for molybdenite: Geochimica et Cosmochimica Acta, v. 57, p. 1625-1628.
Suzuki, K., Shimizu, H., and Masuda, A., 1996, Re-Os dating of molybdenites from ore deposits in Japan: Implications for the closure temperature of the Re-Os system for molybdenite and the cooling history of molybdenum ore deposits: Geochimica et Cosmochimica Acta, v. 60, p. 3151-3159.
Suzuki, K., Kagi, H., Nara, M., Takano, B., and Nozaki, Y., 2000, Experimental alteration of molybdenite: Evaluation of the Re-Os system, infrared spectroscopic profile and polytype: Geochimica et Cosmochimica Acta, v. 64, p. 223-232.
Suzuki, K., Feely, M., and O'Reilly, C., 2001, Disturbance of the Re-Os chronometer of molybdenites from the late-Caledonian Galway Granite, Ireland, by hydrothermal fluids: Geochemical Journal, v. 35, p. 29-35.

123 Terada, K., Osaki, S., Ishihara, S., and Kiba, T., 1971, Distribution of rhenium in
molybdenites from Japan: Geochemical Journal, v. 4, p. 123-141.
Volkening, J., Walczyk, T., and Heumann, K. G., 1991, Osmium isotope ratio determinations by negative thermal ionization mass spectrometry: International Journal of Mass Spectrometry and Ion Processes, v. 105, p. 147-159.
Zacharias, J., Pertold, Z., Pudilova, M., Zak, K., Pertoldova, J., Stein, H. J., and Markey, R. J., 2001, Geology and genesis of Variscan porphyry-style gold mineralization, Petrackova hora deposit, Bohemian Massif, Czech Republic: Mineralium Deposita, v. 36, p. 517-541.

124
APPENDIX C
MULTI-STAGE AND LONG-LIVED MINERALIZATION IN THE ZAMBIAN
COPPERBELT: EVIDENCE FROM RE-OS GEOCHRONOLOGY
Fernando Barra 1,2, David Broughton3, Joaquin Ruiz 1, Murray Hitzman3, David Selley4
1 Department of Geosciences, University of Arizona, Tucson, AZ 85721, USA 2 Instituto Geología Económica Aplicada, Universidad de Concepción, Concepción, Chile 3 Department of Geology and Geological Engineering, Colorado School of Mines, Golden, CO 80401 4Centre for Ore Deposit Research, University of Tasmania, Tasmania 7001,Australia
To be submitted to Nature

125 Abstract
The Central African Copperbelt forms the second world’s largest sediment-hosted
stratiform copper province and it is the world’s largest source of cobalt. The age of
mineralization in this district has been one of the most contentious debates in economic
geology. Resolution of this debate has important implications not only for the genesis of
these deposits, but also for the long-term behavior of brines in sedimentary basins and the
tectonics of central Africa. Here we use Re-Os systematics to directly determine the age
and source of osmium in the Zambian sulfide mineralization. Chalcopyrite from the
Konkola deposit and hangingwall yields a Re-Os isochron age of 816 ± 62 Ma, consistent
with the initial stages of the Rodinia break-up and broadly overlaps with the onset of a
Snowball Earth event at ~750 Ma. A second isochron with samples from the Nchanga,
Chibuluma and Nkana deposits, yields an isochron age of 576 ± 41 Ma, contemporaneous
with the Lufilian Orogeny. Both ages support a geologically constrained model for an
exceptionally long-lived (~300 myr) period of multi-stage mineralization, linked to the
basin evolution.

126 Introduction
The Central African Copperbelt (Fig. C1) is one of the world’s largest copper
districts and is the world’s largest source of cobalt (Cox et al., 2003; Hitzman, 2000;
Kirkham, 1989). The age of mineralization in this sediment-hosted stratiform copper
district has been one of the most contentious debates in economic geology over the past
70 years (Jowett, 1991). Resolution of this debate has important implications not only for
the genesis of these deposits, but also for the long-term behaviour of brines in
sedimentary basins and the tectonics of central Africa. Here, we use Re-Os
geochronometry to directly date the Zambian sulfide mineralization and support a
geologically constrained model for an exceptionally long-lived (~300 myr) period of
multistage mineralization linked to the basin evolution.
Geological Setting
The Copperbelt is hosted in metasedimentary rocks of the Neoproterozoic
Katangan Supergroup (Fig. C2), which underwent greenschist to amphibolite facies
metamorphism during the Pan-African Lufilian orogeny (Hanson, 2003; Kampunzu et al.,
1998). The Katangan Supergroup records the development of a major Neoproterozoic
intracontinental to passive margin basin, associated with break-up of the Rodinian
supercontinent (Hanson, 2003; Kampunzu et al., 1998). Continental clastic
metasediments (“redbeds”) of the Lower Roan Subgroup record basal rift-phase
sedimentation, and were deposited uncomformably on a Paleoproterozoic to
Neoproterozoic (~880 Ma, maximum age of Roan sedimentation) metamorphic and

127 granitic basement (Armstrong et al., 1999). Subsequent transgression and development of
a shallow marine mixed carbonate-clastic-evaporite platform is recorded by the Upper
Roan Subgroup (Binda, 1994; Porada and Berhorst, 2000).
The overlying Mwashia, Lower Kundelungu, and Upper Kundelungu Groups
comprise mixed carbonate and generally fine-grained clastic metasediments (Fig. C3,
C4), but include two diamictite horizons at the base of each Kundelungu group,
correlated globally with Sturtian (~730-750 Ma, minimum age of Roan sedimentation)
and Marinoan (~600 Ma) Snowball earth glacial events (Eyles and Januszczak, 2004;
Key et al., 2001). Mafic intrusive and extrusive rocks dated at ~735 to 760 Ma suggest
renewed tectonism during Mwashia and Lower Kundelungu time, and bracket the age of
the lower, Sturtian age diamictite, the Grand Conglomerate (Key et al., 2001).
The Katangan basin was metamorphosed and deformed during the Lufilian
Orogeny from ~590 to 500 Ma, constrained by early biotite and monazite at 580-592 Ma
(Rainaud et al., 2002), syn-orogenic granitic intrusions at ~560 Ma (Hanson et al., 1993),
peak metamorphism at ~530 Ma (John et al., 2004), and post-metamorphic veins at ~500-
512 Ma (Richards et al., 1988; Torrealday et al., 2000).
The Zambian sediment-hosted stratiform Cu-(Co) deposits occur within the
Lower Roan Subgroup at several stratigraphic levels, with 60 to 70 percent of the ore
derived from a regionally correlated fine-grained and commonly carbonaceous
metasiltstone-mudstone, know as the “Ore Shale” (e.g. Konkola, Nkana deposits; Fig.
C4). The remaining ore occurs in meta-sandstones in the ore shale footwall (e.g.
Chibuluma) and hangingwall (e.g. Nchanga upper orebody). Mineralization is locally

128 present in the Upper Roan, but does not form orebodies. Carbonaceous metasiltstones of
the Mwashia and Lower Kundelungu host ore both within (Lufua and Lonshi deposits)
and outboard of (Kansanshi deposit) the Zambian Copperbelt.
Mineralization
Copper sulfides occur as disseminated, commonly bedding-parallel grains, pre-
and post-folding bedding-parallel bands and veinlets, and bedding-discordant veinlets. In
many deposits, pre-folding veinlets and spatially associated disseminated sulfides form
the dominant mineralization style; in others, most of the mineralization occurs in post-
folding and post-metamorphic (with biotite-destructive alteration) veins (Torrealday et
al., 2000). Chalcopyrite and bornite are the most widespread hypogene species (Fig. C5).
The post-metamorphic vein mineralization is characterized regionally by a distinctive
metal association, which includes U, Th, Mo, and Au.
Previous geochronological work has focused on vein mineralization, and
particularly on molybdenite, uraninite, brannerite, monazite, and rutile, which were dated
by U-Pb (Richards et al., 1988; Torrealday et al., 2000) and Re-Os (molybdenite;
(Torrealday et al., 2000) methods. The later work established a late Lufilian age of ~500
to ~512 Ma for post-folding mineralization, but was unable to constrain the more
important pre-folding stages.

129 Methodology
The Re-Os geochronometer has proven effective in dating molybdenite, gold,
pyrite and copper sulfides in a variety of geological environments (e.g. Mathur et al.,
2000b; Kirk et al., 2002; Barra et al., 2003). Because of the chalcophile and siderophile
nature of Re and Os, these elements are concentrated in sulfides rather than silicates.
Thus, the use of this isotopic system allows us not only to directly date sulfide minerals,
but also to determine and use the Os initial isotopic composition as a tracer for the source
of osmium and by proxy the metals that contain this osmium (Shirey and Walker, 1998;
Mathur et al., 2000a; Kirk et al., 2002). Since the crust has evolved elevated Re/Os ratios
relative to the mantle, high 187Os/188Os ratios (>0.2) compared to the chondritic ratio of
the mantle (~0.13) may indicate a crustal source for the Os (Shirey and Walker, 1998;
Meisel et al., 2001).
Samples of chalcopyrite, bornite and carrolite-linnaeite mineralization (Fig. C5)
were selected from four Zambian Copperbelt deposits: Konkola, Nchanga, Nkana and
Chibuluma. Chalcopyrite and bornite commonly are intergrown, and hence both phases
cannot be separated and are assumed to form at the same time. Cobalt-bearing sulfides
are also in close textural relation with chalcopyrite-bornite. All the samples used for the
isochrons were mixtures of the sulfides and not pure separates of any phase. Molybdenite
mineralization also was collected from the Nkana deposit. Sample preparation and
analyses were performed following procedure discussed in (Barra et al., 2003).

130 Results
Cu-Fe (chalcopyrite, bornite) and Cu-Co sulfides (carrolite) have Os
concentrations ranging between 17 and 790 ppt and Re concentrations from 0.3 to 49
ppb. The highest concentrations are found in the Konkola samples (Table C1). Re and Os
concentrations for one molybdenite sample from Nkana are 1789 ppb and 325 ppm,
respectively.
Four replicate analyses from a single sample of disseminated and pre-folding
veinlet chalcopyrite within Upper Roan dolomite at Konkola yielded an isochron age of
825 ± 69 Ma and an 187Os/188Os initial value of 11.4 ± 1.7 [mean square weighted
deviation (MSWD) =1.8] (Fig. C6a). Two additional analyses from a sample of bedding-
parallel disseminated and veinlet bornite-chalcopyrite within the Lower Roan Ore Shale,
also at Konkola, fit in the same isochron yielding an age of 815 ± 62 Ma. These analyses
showed a 187Os/188Os initial value of 11.7 ± 1.5 (MSWD =1.4) (Fig. C6b).
Seven analyses from three samples of the Nkana (n=2), Chibuluma (n=2), and
Nchanga (n=3) deposits yielded an age of 576 ± 41 Ma and an 187Os/188Os initial value of
1.37 ± 0.32 (MSWD = 4.0) (Fig. C6c). These samples are from Ore Shale (Nkana,
dolomitic metasiltstone), footwall (Chibuluma, metasandstone) and hangingwall
(Nchanga, sandstone) orebodies, and comprised disseminated carrollite (Nchanga), and
disseminated and bedding-parallel veinlet chalcopyrite-bornite (Chibuluma, Nkana).
The Nkana molybdenite yielded a Re-Os age of 525 ± 3.4 Ma, in broad agreement
with post-metamorphic (~503-513 Ma) Re-Os molybdenite ages obtained previously at
Kansanshi (Torrealday et al., 2000).

131
Discussion
The results demonstrate the presence of three temporally distinct stages of
mineralization in the Zambian Copperbelt. The oldest (825 ± 69 Ma) mineralization stage
is attributed to movement of diagenetic metalliferous brines that produced widespread
pre- and syn-ore potassium-feldspar alteration in the Lower Roan. This event was
complete by the end of Mwashia-Lower Kundelungu extension, its associated mafic
igneous activity (initial stages of the Rodinia break-up) and deposition of the Grand
Conglomerate diamictite (Sturtian-Rapirian glaciation, Snowball earth event). The
maximum thickness of the sub-Grand Conglomerate stratigraphic section above the main
Zambian ore host, the Ore Shale, is only 500 to 1000 meters, thus it is unlikely that
organic matter present in the ore shale would have reached the hydrocarbon window: in
situ organic matter and diagenetic pyrite provided the necessary reductants for oxidized
metalliferous brines generated in the footwall, syn-rift continental redbeds. Mafic sills
present in the Upper Roan and Lower Mwashia may have provided a thermal impetus for
brine circulation. Basin extension and associated thermal anomalies have been linked to
disseminated and veinlet mineralization in the world’s largest sediment-hosted stratiform
copper district, the Polish Kupferschiefer. Hydrological changes associated with major
sea level fluctuations during deposition of the Grand Conglomerate diamictite may also
have enhanced brine circulation.
The second stage of mineralization (576 ± 41 Ma) is coincident with the onset of
Lufilian orogenesis and basin inversion (McGowan et al., 2003), constrained

132 independently by U-Pb dates of monazite and biotite (Armstrong et al., 1999) and zircon
(Hanson et al., 1993). By this time some 1.5 to 6.9 km of Upper Roan to Upper
Kundelungu sediments had been deposited over the Lower Roan host rocks, which would
therefore have reached hydrocarbon maturity. The Nchanga upper orebody and
Chibuluma deposits are hosted within clean arenaceous sandstones that lack an obvious
source of in situ reductant, but which have three-dimensional geometries consistent with
hydrocarbon reservoirs (McGowan et al., 2003). Carbon and oxygen isotopic values of
ore-stage carbonates at several arenite-hosted Zambian orebodies are also consistent with
oxidation of hydrocarbons by metalliferous brines. Albite alteration associated with the
Nchanga and Chibuluma mineralization is consistent with a higher temperature regime.
Early Lufilian mineralization was focused by syn-rift extensional faults reactivated
during basin inversion (McGowan et al., 2003).
The third, ~500 to 525 Ma, stage of mineralization post-dates Lufilian peak
metamorphism (~530 Ma; (John et al., 2004)) and is dominated by undeformed
extensional veins, commonly with biotite-destructive, albitic alteration halos (Richards et
al., 1988; Torrealday et al., 2000). In some cases these veins have clear copper sulfide
depletion halos (“lateral secretion” veins), but the veins are also characterized by a
geochemically distinct suite of U, Th, Mo and local Au mineralization, unique to this late
Lufilian stage (Unrug, 1988), and suggesting renewed input of metalliferous brine, rather
than simple remobilization of older mineralization.
The interpretation that metalliferous brines were introduced at several stages in
the basin history is supported by the initial 187Os/188Os ratios of sulfides. The diagenetic

133 (~825 Ma) sulfides at Konkola have an initial 187Os/188Os ratio of 11.4 ± 1.7, distinct
from the comparatively less radiogenic ratio of 1.37 ±0.32 for the early orogenic (~576
Ma) Nchanga-Chibuluma-Nkana sulfides. The early orogenic mineralization clearly
incorporated Os of a source different from that which was available for the older,
diagenetic mineralization. The highly radiogenic osmium contained in the Konkola
sulfides could have originated from the surrounding shales. Shales have reported Re
concentrations ranging from a few tens to hundreds of ppb Re (Horan et al., 1994;
Kendall et al., 2004; Ravizza and Turekian, 1989). On the other hand, the arenacerous
host rocks of the Nchanga and Chibuluma deposits have, most likely, lower Re
concentrations and hence the metalliferous brines would have extracted less Re (and Os)
from these host rocks. This is also reflected in the lower concentrations observed in
Nchanga and Chibuluma compared to Konkola. In both cases though the Os has a strong
crustal component.
These results indicate that the Katangan basin hosting the African Copperbelt
underwent prolonged brine movement. Early mineralization appears to have been related
to brine migration through the lower portion of the section, which may have been
influenced by tectonic extension, thermal input, and global sea level fluctuations, all
broadly concurrent with the major Sturtian glacial event (“Snowball Earth”; Hoffman et
al., 1998; Hoffman and Schrag, 2002). The brine associated with this style of
mineralization would pond in the lower portions of the sedimentary sequence forming the
observed widespread alteration. The second period of mineralization is spatially
associated with apparent hydrocarbon reservoirs, indicating that the basin underwent a

134 normal diagenetic progression prior to the secondary brine movement associated with the
onset of orogenic collapse. The last period of mineralization is associated with structural
focusing of metamorphically heated brines in brittle deformation sites during the waning
stages of orogeny, and has a distinct trace element signature that suggests deeper crustal
involvement.
The Re-Os chronology of the Zambian Copperbelt demonstrates the extremely
long-lived nature of the hydrothermal system. Formation of world-class sediment-hosted
copper deposits such as those in the Central African Copperbelt and the Kupferschiefer
may require lengthy periods of enhanced thermal gradient to ensure that sufficient metals
are leached from low-grade source rocks and circulated multiple times through basin fill.
Not surprisingly, attempts to model fluid flow and metal deposition in such basins based
on single-stage genetic models have foundered. The dates for the Zambian Copperbelt
indicate early stage mineralization was broadly concurrent with widespread glaciation. A
similar temporal overlap with extensive glaciation is recognized from the Permian
Kupferschiefer suggesting that glacially-controlled eustatic events and ground water
charging may also be important to generate world-class deposits.

135
Figure C1. Sketch geologic map of Lufilian Arc showing the location of the Zambian Copperbelt with copper deposits sampled for this study. Ka: Kansanshi, K: Konkola, Nc: Nchanga, C: Chibuluma, Nk: Nkana.

136
Figure C2. Detailed geologic map of Central Africa showing the location of the Copperbelt with major copper deposits in Zambia and the Democratic Republic of Congo (DRC).
ZAMBIA/CONGOCOPPER BELT
C O N G O
Z A M B I A
A N
G O
L A
K A B O M P O
D O M
E
M W O M B E Z H ID O M E
L U S W I S H I D O M E
K A F U E A N T I C L I N E
SOLWEZ I D O M E
Luanshya
MufuliraMusoshi
Nkana
NchangaKonkola
Kipushi
FungurumeKolweziGP
Lumwana
Kalengwa
BwanaMkubwa

137 Zambia Congo
Group Subgroup Formation Group Subgroup Formation Plateaux Upper Kundulungu
Kundulungu Kiubo
Kalule Petit Conglomerat
Kundulungu Shale
Monwezi
Lower Kundulungu
Kakontwe Limestone
Nguba Likasi Grand Conglomerat
Tilllite Formation
Mwashia Mwashia U. Mwashya L. Mwashya Bancroft RU 1 R 3.4 RU 2 Dipeta R 3.3 RL 3 R 3.2 Roan Kitwe RL 4 Roan R 3.1 RL 5 Kambove
Dolomite RL 6 Mines Dolomite shale Kamoto
Dolomite Midola RL 7 R 1.3 R.A.T. R 1.2 R 1.1 Figure C3. Lithostratigraphy of the Katanga Supergroup in the Copperbelt of Zambia and Congo. Modified from Porada and Berhorst (2000).

138
Figure C4. Simplified lithostratigraphy of the Katanga Supergroup in the Zambian Copperbelt showing relative location of deposits and samples.

139 Figure C5a. Reflected light photomicrograph of bornite (purple) intergrown with chalcopyrite (yellow). Figure C5b. Reflected light photomicrograph of chalcopyrite (yellow), carrollite (grey) and linnaeite (white).
0.1 mm
0.5 mm

140 Figure C5c. Reflected light photomicrograph of chalcopyrite (yellow), carrollite (grey) and bornite (purple) replaced by blue chalcocite. Figure C5d. Reflected light photomicrograph of chalcopyrite (yellow) and bornite (purple) replaced by blue chalcocite in fractures. Scale bar represents 0.2 mm.
0.2 mm
0.2 mm

141
22
26
30
34
38
42
800 1000 1200 1400 1600 1800 2000 2200187Re/188Os
187 O
s/18
8 Os
Age = 825 ± 69 MaInitial 187Os/188Os =11.4 ± 1.7
MSWD = 1.8
Figure C6a. Re-Os isochron plot for Konkola. Replicate analyses for a single chalcopyrite sample (black squares).
0
40
80
120
160
200
240
280
0 4000 8000 12000 16000 20000 24000
187Re/188Os
187 O
s/18
8 Os
Age = 815 ± 62 MaInitial 187Os/188Os =11.7 ± 1.5
MSWD = 1.4
Figure C6b Same isochron as in (C4a) (cluster of dark squares near the origin), but with two additional analyses from a bornite-chalcopyrite sample (black diamonds) from a different stratigraphic level.

142
0
4
8
12
16
20
0 400 800 1200 1600 2000
187Re/188Os
187 O
s/18
8 Os
Age = 576 ± 41 MaInitial 187Os/188Os =1.37 ± 0.32
MSWD = 4.0
Figure C6c. Seven point isochron with three analyses from a carrollite (open circles) from Nchanga, two analyses from chalcopyrite-bornite (open squares) from Chibuluma, and two points from a chalcopyrite sample Nkana. All isochrons were calculated using ISOPLOT (Ludwig, 2000).

143 Table C1. Re and Os concentrations and isotopic compositions for sulfides from the Zambian Copperbelt.
Sample Name Re (ppb) Os (ppb) 187Re/188Os 187Os/188Os Konkola KON1-1
21.81 0.425 1103.47 ± 11.55 26.38 ± 0.28
KON1-2
24.10 0.432 1361.10 ± 15.56 30.67 ± 0.36
KON1-3
49.32 0.791 1660.25 ± 19.10 34.56 ± 0.40
KON1-4
29.04 0.450 1983.97 ± 26.10 38.39 ± 0.53
KON2-1
9.42 0.105 8000.59 ± 1347.73 129.91 ± 22.38
KON2-2
24.26 0.210 16479.52 ± 2268.74 209.80 ± 30.01
Nchanga
NCH1-1
3.07 0.043 737.80 ± 34.08 8.64 ± 0.39
NCH1-2
5.80 0.075 822.69 ± 23.66 9.08 ± 0.26
NCH1-3
5.60 0.066 1466.18 ± 78.47 15.89 ± 1.03
Nkana
NK1-1
1.37 0.024 515.56 ± 37.99 6.29 ± 0.45
NK1-2
0.34 0.017 311.84 ± 51.30 3.10 ± 2.38
Chibuluma
CH1-1
0.92 0.036 178.28 ± 5.07 3.25 ± 0.09
CH1-2 0.56 0.032 113.40 ± 4.69 2.33 ± 0.10 Errors in the isotopic compositions are calculated following (Barra et al., 2003; Kirk et al., 2002), varying the Os blank between measured values of 1 to 2 pg.

144 REFERENCES Armstrong, R., Robb, L. J., Master, S., Kruger, F. J., and Mumba, P. A. C. C., 1999,
New U-Pb age constraints on the Katangan Sequence, Central African Copperbelt: Journal of African Earth Sciences, v. 28, p. 6-7.
Barra, F., Ruiz, J., Mathur, R., and Titley, S., 2003, A Re-Os study of sulfide minerals
from the Bagdad porphyry Cu-Mo deposit, northern Arizona, USA: Mineralium Deposita, v. 38, p. 585-596.
Binda, P. L., 1994, Stratigraphy of Zambian Copperbelt Orebodies: Journal of African
Earth Sciences, v. 19, p. 251-264. Cox, D. P., Lindsey, D. A., Singer, D. A., and Diggles, M. F., 2003, Sediment-Hosted
Copper Deposits of the World: Deposit Models and Database, U.S. Geological Survey, p. 50 p.
Eyles, N., and Januszczak, N., 2004, 'Zipper-rift': a tectonic model for Neoproterozoic
glaciations during the breakup of Rodinia after 750 Ma: Earth-Science Reviews, v. 65, p. 1-73.
Hanson, R. E., 2003, Proterozoic geochronology and tectonic evolution of southern
Africa, in Yoshida, M., Windley, B. F., and Dasgupta, S., eds., Proterozoic East Gondwana: Supercontinent Assembly and Breakup, Special Publication 206, Geological Society of London, p. 427-463.
Hanson, R. E., Wardlaw, M. S., Wilson, T. J., and Mwale, G., 1993, U-Pb zircon ages
from the Hook granite massif and Mwembeshi dislocation: Constraints on Pan-African deformation, plutonism, and transcurrent shearing in Central Zambia: Precambrian Research, v. 63, p. 189-203.
Hitzman, M. W., 2000, Source basins for sediment-hosted stratiform Cu deposits:
implications for the structure of the Zambian Copperbelt: Journal of African Earth Sciences, v. 30, p. 855-863.
Hoffman, P. F., Kaufman, A. J., Halverson, G. P., and Schrag, D. P., 1998, A
Neoproterozoic Snowball Earth: Science, v. 281, p. 1342-1346. Hoffman, P. F., and Schrag, D. P., 2002, The snowball Earth hypothesis: testing the
limits of global change: Terra Nova, v. 14, p. 129-155. Horan, M. F., Morgan, J. W., Grauch, R. I., Coveney Jr., R. M., Murowchick, J. B., and
Hulbert, L., 1994, Rhenium and osmium isotopes in black shales and Ni-Mo-

145 PGE-rich sulfide layers Yukon Territory, Canada, and Hunan and Guizhou provinces, China: Geochimica et Cosmochimica Acta, v. 58, p. 257-265.
John, T., Schenk, V., Mezger, K., and Tembo, F., 2004, Timing and PT evolution of
whiteschist metamorphism in the Lufilian Arc-Zambezi Belt Orogen (Zambia): Implications for the assembly of Gondwana: Journal of Geology, v. 112, p. 71-90.
Jowett, E. C., 1991, The evolution of ideas about genesis of Stratiform Copper-Silver
deposits, in Hutchinson, R. W., and Grauch, R. I., eds., Historical Perspectives of Genetic Concepts and Case Histories of Famous Discoveries, Economic Geology Monograph 8, Society of Economic Geologists, p. 117-132.
Kampunzu, A. B., Kramers, J. D., and Makutu, M. N., 1998, Rb-Sr rock ages of the
Lueshe, Kirumba and Numbi igneous complexes (Kivu, Democratic Republic of Congo) and the break-up of the Rodinia supercontinent: Journal of African Earth Sciences, v. 26, p. 29-36.
Kendall, B. S., Creaser, R. A., Ross, G. M., and Selby, D., 2004, Constraints on the
timing of Morinoan "Snowball" glaciation by 187Re-187Os dating of a Neoproterozoic, post-glacial black shale in Western Canada: Earth and Planetary Science Letters, v. 222, p. 729-740.
Key, R. M., Liyungu, A. K., Njamu, F. M., Somwe, V., Banda, J., Mosley, P. N., and
Armstrong, R., 2001, The western arm of the Lufilian Arc in NW Zambia and its potential for copper mineralization: Journal of African Earth Sciences, v. 33, p. 503-528.
Kirk, J., Ruiz, J., Chesley, J., Walshe, J., and England, G., 2002, A major archean, gold-
and crust-forming event in the Kaapvaal craton, South Africa: Science, v. 297, p. 1856-1858.
Kirkham, R. V., 1989, Distribution, settings, and genesis of sediment-hosted stratiform
copper deposits, in Boyle, R. W., Brown, A. C., Jefferson, C. W., Jowett, E. C., and Kirkham, R. V., eds., Sediment-hosted Stratiform Copper Deposits, Special Paper 36, Geological Association of Canada, p. 3-38.
Mathur, R., Ruiz, J., and Munizaga, F., 2000a, Relationship between copper tonnage of
Chilean base-metal porphyry deposits and Os isotope ratios: Geology, v. 28, p. 555-558.
Mathur, R., Ruiz, J., Titley, S., Gibbins, S., and Margotomo, W., 2000b, Different crustal
sources for Au-rich and Au-poor ores of the Grasberg Cu-Au porphyry deposit: Earth and Planetary Science Letters, v. 183, p. 7-14.

146 McGowan, R. R., Roberts, S., Foster, R. P., Boyce, A. J., and Coller, D., 2003, Origin of
the copper-cobalt deposits of the Zambian Copperbelt: An epigenetic view from Nchanga: Geology, v. 31, p. 497-500.
Meisel, T., Walker, R. J., Irving, A. J., and Lorand, J. P., 2001, Osmium isotopic
compositions of mantle xenoliths: a global perspective: Geochimica et Cosmochimica Acta, v. 65, p. 1311-1323.
Porada, H., and Berhorst, V., 2000, Towards a new understanding of the Neoproterozoic-
Early Paleozoic Lufilian and northern Zambezi Belts in Zambia and the Democratic Republic of Congo: Journal of African Earth Sciences, v. 30, p. 727-771.
Rainaud, C., Master, S., Armstrong, R., Phillips, D., and Robb, L. J., 2002, Contributions
to the geology and mineralization of the central African Copperbelt: IV. Monazite U-Pb dating and 40Ar-39Ar thermochronology of metamorphic events during the Lufilian Orogeny: 11th Quadrennial IAGOD Symposium and Geocongress 2002, 2002.
Ravizza, G., and Turekian, K. K., 1989, Application of the 187Re-187Os system to black
shale geochronology: Geochimica et Cosmochimica Acta, v. 53, p. 3257-3262. Richards, J. P., Krogh, T. E., and Spooner, E. T. C., 1988, Fluid inclusion characteristics
and U-Pb rutile age of late hydrothermal alteration and veining at the Mushoshi stratiform copper deposit, Central African Copperbelt, Zaire: Economic Geology, v. 83, p. 118-139.
Shirey, S. B., and Walker, R. J., 1998, The Re-Os isotope system in cosmochemistry and
high-temperature geochemistry: Annual Review of Earth and Planetary Sciences, v. 26, p. 423-500.
Torrealday, H. I., Hitzman, M. W., Stein, H. J., Markey, R. J., Armstrong, R., and
Broughton, D., 2000, Re-Os and U-Pb dating of the vein-hosted mineralization at the Kansanshi copper deposit, northernZambia: Economic Geology, v. 95, p. 1165-1170.
Unrug, R., 1988, Mineralization controls and source of metals in the Lufilian Fold Belt,
Shaba (Zaire), Zambia, and Angola: Economic Geology, v. 83, p. 1247-1258.

147
APPENDIX D
CRUSTAL CONTAMINATION IN THE PLATREEF, BUSHVELD COMPLEX,
SOUTH AFRICA: CONTRAINTS FROM RE-OS SYSTEMATICS ON PGE-
BEARING SULFIDES
Fernando Barra 1,2, Joaquin Ruiz 1, Lewis D. Ashwal3, Mark La Grange4, Victor
Valencia1
1 Department of Geosciences, University of Arizona, Tucson, AZ 85721, USA 2 Instituto Geología Económica Aplicada, Universidad de Concepción, Concepción, Chile 3 School of Geosciences, University of Witwatersrand, Private Bag 3 WITS 2050, South Africa 4
To be submitted to Geology

148 Abstract
The Bushveld Igneous Complex (BIC) in South Africa contains the highest
concentration of platinum group elements (PGEs) in the world, with PGE mineralization
being found mainly in the Merensky Reef and UG-2 chromitite horizon in the eastern and
western limbs, and in sulfides from the Platreef in the northern limb. Seven analyses
from three sulfide samples from the Platreef define a Re-Os isochron age of 2031 ± 88
Ma, which is in good agreement with the previously reported 2.05 Ga age for the
emplacement of the BIC. The initial 187Os/188Os ratio of 0.207 from the isochron is much
more radiogenic than the predicted value for chondritic mantle at the time of
emplacement (~0.11), and more radiogenic than the osmium initial ratio for chromitites
from the UG-1, UG-2 and Merensky Reef (0.12-0.15), and laurite ([Ru,Ir,Os]S2) grains in
the Merensky Reef (0.17-0.18). This high initial Os isotopic composition of the Platreef
isochron (γOs = 83 ± 16) not only indicates a strong crustal component for the source of
the PGE mineralization, but also suggests that higher degrees of crustal assimilation took
place at the northern limb (Platreef) in comparison to the eastern and western limbs
(Merensky Reef).
These new Re-Os data, combined with previous isotopic information for the
Merensky Reef, indicate that a major part of the PGE mineralization in the Bushveld
Complex is the result of crustal assimilation processes with late magmatic or
hydrothermal fluids playing only a minor role.

149 Introduction
The Bushveld Igneous Complex (BIC) of South Africa (Fig. D1) is the largest
mafic-ultramafic intrusion in the world (Eales and Cawthorn, 1996), and it contains the
world’s largest resources of platinum group elements (PGE) and chromium, as well as
significant resources of vanadium and titanium (Lee, 1996). The PGEs are generally
concentrated in horizons or layers (Merensky Reef (MR), Upper Group 2 (UG-2)
chromitite layer and Platreef, which are confined to the Critical Zone (or its possible
equivalents for the Platreef) of the Rustenberg Layered Suite (RLS).
Magmatic ore deposits and associated PGE enrichment have been the subject of
numerous studies (e.g. McCandless and Ruiz, 1991; Lee, 1996; Lambert et al., 1998 and
references therein). In the Bushveld Complex, most of these investigations have been
centered on the Merensky Reef and UG-2 chromitite layers, but less information exists on
the Platreef PGE mineralization in the northern limb (Fig. D2). Despite these studies, the
mechanisms or processes involved in the formation of sulfide-PGE mineralization are not
completely understood. Although it has not been dated directly, the age of mineralization
is fairly well constrained by indirect dating of the associated silicate mineralogy or by
constraining the age of felsic units that predate the emplacement of the RLS (2060 ± 2
Ma; Walraven, 1997) and late crosscutting granitoids of the Lebowa Suite (2054 ± 2 Ma;
Walraven and Hattingh, 1993). On the other hand, the source(s) of metals are largely
unconstrained and the processes responsible for mineral deposition are poorly
understood.

150 The Re-Os isotopic system is particularly useful in studying PGE mineralization
and presents certain advantages over other traditional isotopic pairs because Os is one of
the platinum group elements, and both Re and Os are chalcophile and siderophile
elements hence; they are concentrated into sulfide phases. Also, Re is slightly
incompatible during mantle melting, whereas Os behaves as a compatible element
(Shirey and Walker, 1998). These characteristics of the Re-Os system makes it an ideal
geochemical tool in evaluating crust-mantle interactions and assessing the role of the
crust in the formation of magmatic sulfide ore deposits.
Here we report the first direct isochron age determination for sulfide-PGE
mineralization in the BIC using the Re-Os system and we constrain the source of osmium
contained in the sulfides, and by inference, the origin of the PGE mineralization.
Geological Setting
The BIC consists of four main ‘limbs’ or ‘lobes’, the western and eastern limbs,
the northern (Potgietersrus or Mokopane) limb, and the southern or Bethal limb; the latter
is covered by Mesozoic rocks of the Karoo Supergroup (Fig. D1). The igneous
component of the BIC was intruded into Paleoproterozoic supracrustal rocks of the
Transvaal Supergroup, with ages ranging from ~2550 to ~2050 Ma (Walraven et al.,
1990; Barton et al., 1994). The most precise age of crystallization of the mafic-
ultramafic sequence, known as the Rustenburg Layered Suite (RLS), comes from U-Pb
geochronology in titanite from the contact metamorphic aureole (2058.9 ± 0.8 Ma; Buick
et al., 2001). The RLS is subdivided in a norite Marginal Zone (MZ), an ultramafic

151 Lower Zone (LZ), an ultramafic-mafic Critical Zone (CZ), a gabbronoritic Main Zone
(MZ), and a ferrogabbroic Upper Zone (UZ). Overlying the RLS are granitic and
granophyric rocks (Lebowa and Rashoop Suites). The highest grades of PGE
mineralization are found in the Merensky Reef and UG-2 chromitite layer located near
the top of the Critical Zone of the eastern and western limbs (Fig. D3).
The Platreef (PR), on the other hand, is located at the base of the Potgietersrus or
northern limb (Fig. D2). Although petrographically similar to the Merensky Reef (MR),
it differs from the typical MR of the eastern and western limbs (Cawthorn et al., 1985).
The main differences, summarized by Cawthorn et al. (1985), are: (1) mineralization in
the PR is irregularly distributed in a ~200 m thick rock sequence; the MR mineralization
is confined to a <8 m thick layer; (2) The MR is a concordant layer in the middle of the
layered suite, whereas the PR appears discordant and as a marginal facies; (3) The PR
sequence shows a transgressive nature over Archean granites in the northern part of the
limb and over metamorphosed sedimentary rocks (dolomites, banded iron formations and
shales) in the southern area.
The geology of the Platreef has been extensively discussed in Buchanan et al.
(1981), Gain and Mostert (1982), Cawthorn et al., (1985), Barton et al. (1986), and Lee
(1996). The PR comprises a complex sequence of coarse-grained pyroxenites,
melanorites, norites, serpentinized peridotites, and dolomite xenoliths, with sulfides and
PGEs. The Platreef is overlain by the Main Zone, which is composed of gabbros, norites,
troctolites, anorthosites, and pyroxenite layers (Gain and Mostert, 1982).

152 The fact that the Platreef is directly in contact with the basement rocks (granites
and sedimentary rocks) is particularly useful in evaluating the role of crustal
contamination and assimilation in the origin of the mineralization (Buchanan et al., 1981;
Cawthorn et al., 1985; Barton et al., 1986).
Analytical Methods
Sulfide samples were collected from a single drill core in the farm Turspruit 241
KR. The hole intersected the Platreef at 41 m and cuts basement rocks (dolomites and
hornfels) at around 325 m depth. The sulfide mineralization is contained within
pyroxenites. Sample Plat-3 is from a depth of 230.97 m, Plat-5 from 296.20 m, and Plat-
6 from 306.7 m.
The sulfides were separated using the technique described in Mathur et al. (2000).
Briefly, drill core samples are wrapped in paper and crushed with a hammer in order to
avoid contamination. Samples are then sieved and pure sulfide grains are hand picked
from the coarse-grained fraction. By selecting the coarse-grained fraction we make use
of the “nugget effect”, which refers to the heterogeneous distribution of Re and Os within
minerals. Hence, dispersion in the measured 187Os/188Os and 187Re/188Os ratios can be
obtained from replicate analyses of single samples, and eventually an isochron can be
constructed with a limited number of samples. Around 50-110 mg of sulfide sample was
used for Re-Os analyses in this study. The sample is introduced in a Carius tube, with
185Re and 190Os spikes, a mixture of concentrated nitric and hydrochloric acids in a 3:1
ratio, and approximately 2-3 ml of hydrogen peroxide. This mixture of acids and

153 peroxide has proven to be an efficient combination to achieve proper dissolution,
oxidation and homogenization of samples and spikes. The Carius tube is heated in an
oven at 240 ºC for ca. 12 hrs. Os is later separated from the acid solution by distillation
and trapped as OsO4 in HBr (Nagler and Frei, 1997). After this distillation stage, Os is
further purified using a microdistillation technique (Birck et al., 1997). Re is extracted
and purified through anion-exchange column chemistry. Isotope ratios are measured
using NTIMS (Creaser et al., 1991; Völkening et al., 1991). Blanks during the time of
analyses were less than 1.5 pg for Os and 10 pg of Re. Age and initial osmium
composition are calculated using ISOPLOT (Ludwig, 2001).
Results
Os concentration in the Platreef samples ranges between 4 to 37 ppb and Re
concentrations between 35 to 130 ppb. The lowest Re and Os concentrations were found
in sample Plat-3 (Table D1), which is closest to the top of the sequence. Our group
previously reported a four point Re-Os isochron age of 2011 ± 50 Ma [Mean Square
Weighted Deviation (MSWD = 0.50)] and an initial 187Os/188Os value of 0.226 ± 0.021
(Ruiz et al., 2004). Additional replicate analyses on the same samples, provide a slightly
less precise Model 3 isochron age of 2031 ± 88 Ma (MSWD = 13), with an initial
187Os/188Os isotopic ratio of 0.207 ± 0.041 (γOs = 83 ± 16) (Fig. D4). Although the
dispersion of points in this seven point isochron is reflected in a higher MSWD, the initial
Os ratio and age are the same within the error of our previous estimate. The age also
154 overlaps with the accepted intrusion age of the Bushveld Complex of ~2050 Ma (e.g.
Buick et al., 2001; Schoenberg et al., 1999).
Discussion
Previous Re-Os studies on several magmatic Ni-Cu-PGE deposits show that in
most cases, the osmium has an important crustal component and that contamination of
mantle melts by older crust appears to be an important process in the formation of such
magmatic deposits. In the impact-generated Sudbury Igneous Complex (SIC) of Ontario,
Canada, several Re-Os studies indicate that ores formed at ca. 1850 Ma and have
radiogenic initial 187Os/188Os ratios ranging from 0.5 to 1.0 (γOs = +350 to +817) (Walker
et al., 1991; Dickin et al., 1992; Morgan et al., 2002). The Voisey’s Bay deposit, Canada
(Lambert et al., 1999; Lambert et al., 2000) shows γOs values ranging from +200 to
+1127, indicating a crustal source for the osmium. Similar high γOs values have been
determined for the Babbitt Cu-Ni deposit (γOs = +500 to +1200) in the Duluth Complex,
USA (Ripley et al., 1999), and the Sally Malay deposit, Australia, (γOs = +950 to +1300)
(Sproule et al., 1999). In all these cases the high initial osmium indicates that crustal

155 contamination of the magmas responsible for the mineralization is a critical process in the
formation of these ore deposits.
The BIC contains the largest resources of PGEs in the world, and consequently,
numerous studies have addressed the processes responsible for the high concentration of
PGEs. Most of these models are concerned with two main propositions: (a) metals are
derived from the melt column and PGEs are concentrated in immiscible sulfide droplets
that accumulated by gravitational settling (Campbell et al., 1983; Barnes and Naldrett,
1985; Naldrett et al., 1987), and (b) PGEs are carried upward from the base of cumulate-
magma pile by late to post-magmatic or hydrothermal fluids (Ballhaus and Stumpfl,
1986; Barnes and Campbell, 1988; Boudreau and McCallum, 1992; Kruger, 1994). To
properly evaluate these models it is necessary to determine the source of the PGEs (i.e.
mantle versus crust). This can be accomplished by measuring possible variations in the
osmium isotopic ratio within the stratigraphy and/or within different co-existing mineral
phases (e.g. silicates, oxides, sulfides).
Previous isotopic studies indicate that crustal contamination played an important
role in the formation of the RLS and associated mineralized horizons. Most of these
studies have been centered in the eastern and western limbs, with only a handful on the
northern limb. These include isotopes of Sr (Kruger and Marsh, 1982; Cawthorn et al.,
1985; Harmer and Sharpe, 1985; Barton et al., 1986; Kruger, 1994; Schoenberg et al.,
1999), Pb-Pb (Harmer et al., 1995), Sm-Nd (Maier et al., 2000), Re-Os (Hart and
Kinloch, 1989; McCandless and Ruiz, 1991; McCandless et al., 1999; Schoenberg et al.,

156 1999), and stable isotopes including oxygen and hydrogen (Buchanan et al., 1981;
Schiffries and Rye, 1989; Harris and Chaumba, 2001; Harris et al., 2005).
Re-Os determinations on single laurite ([Ru, Ir, Os]S2) grains from the Merensky
Reef were consistently radiogenic (initial 187Os/188Os ratio ranges between 0.17-0.18 and
with an average γOs of +52; Hart and Kinloch, 1989). Initial 187Os/188Os ratios for bulk
rock (0.15-0.19, γOs = +35 to +68, McCandless and Ruiz, 1991) and chromite separates
(0.12-0.15, γOs = +6 to +35, McCandless et al., 1999; Schoenberg et al., 1999), as well as
measurements on pyroxenite rocks (0.15, γOs = +35, Schoenberg et al., 1999), also show a
moderate to strong radiogenic osmium component indicating that crustal contamination
played an important role in the formation of the Bushveld Complex.
In comparison, limited isotopic work has been performed in the Platreef. Based
on strontium isotopes, Cawthorn et al. (1985) and Barton et al. (1986) suggested that
crustal contamination in the PR was brought about by hydrothermal fluids, after
emplacement of the layered suite. Recently, oxygen isotopes have shown that the Upper
and Main Zones of the northern limb crystallized from a well-mixed contaminated
magma (Harris and Chaumba, 2001; Harris et al., 2005). Higher δ18O values found at the
Sandsloot mine (Fig. D2) suggest additional assimilation (up to 18%) of dolomitic
country rocks (Harris and Chaumba, 2001). These authors also found evidence for
interaction with late magmatic fluids.
The initial 187Os/188Os ratio of 0.207, determined from our seven point isochron
(Fig. 4), is clearly higher than the mantle value at the time of emplacement (~0.11 at 2.05
Ga; McCandless et al., 1999; Schoenberg et al., 1999), and hence we conclude that the

157 osmium in the sulfides has a strong crustal component. Furthermore, the value obtained
is much higher than the values obtained in laurite grains from the Merensky Reef (Hart
and Kinloch, 1989), and for chromitites of the Critical Zone (McCandless et al., 1999;
Schoenberg et al., 1999).
McCandless et al. (1999) evaluated crustal assimilation models for the MR
considering three possible contaminants: black shales, mafic granulite and felsic
granulite. They estimated that about 5% of a mafic granulite contaminant could account
for the observed initial 187Os/188Os ratio of ~0.15, whereas less than 1% of shale or up to
25% of felsic granulite are required to produce this same initial 187Os/188Os ratio. These
authors also concluded that assimilation occurred at lower crust levels and that mafic
granulites are the most probable contaminant. Assuming similar contaminants, the
elevated initial Os ratio for sulfides of the Platreef, is then the result of a higher degree of
assimilation, compared to the Merensky Reef. If contamination occurred at lower crust
levels and mafic granulites are considered the most likely contaminant, then an estimated
10-12% assimilation could yield the observed ~0.2 initial 187Os/188Os ratio. These
amounts are significantly lower than the estimated 30-40% contamination needed to
explain the high δ18O values (~7‰) obtained from silicates of the RLS (Harris and
Chaumba, 2001; Harris et al., 2005). More realistic values (~20%) are estimated by these
authors if the contaminant is Transvaal Supergroup sedimentary rocks, but it is generally
agreed that contamination of the Bushveld magmas occurred at lower to middle crustal
levels and not in the upper crust (McCandless et al., 1999; Harris et al., 2005). The high
δ18O values are clearly attributed to crustal contamination; this fact, coupled with

158 previous and the new Re-Os data presented here, suggests a complex crustal assimilation
process with multiple contamination sites and different possible contaminants.
The fact that the Re-Os isochron (Fig. D4) was obtained by the combined and
replicate analyses of three samples from different stratigraphic levels (Plat-3: 231 m;
Plat-5: 296 m; and Plat-6: 307 m) also indicates that: (1) the system remained closed after
PGE-sulfide deposition; and (2) there is little variation in the Os isotopic ratio with
stratigraphy.
In a late magmatic or hydrothermal fluid model, fluids migrating upward through
the magmatic pile interact with minerals (e.g. sulfides, chromite) and remobilize PGEs
and Re (open system behavior). These elements are precipitated in other pre-existing
sulfides located at a higher level in the stratigraphic column. Under this model, sulfides
will have elevated, but variable initial Os ratios and thus no reliable isochron can be
obtained. In other words, the system would have remained open and subject to
disturbance or overprinting by post-deposition remobilization of Re and Os. In this
study, the closed system behavior of the Platreef sulfides is indicated by the isochronous
nature of the Re-Os data, but the slight dispersion of the data, reflected in the MSWD
(Fig. D4), could be the result of limited interaction with fluids and hence, the effect of
late hydrothermal or magmatic fluids is minimal.
The results presented support a model whereby PGEs are mostly crustal in origin
and are concentrated in immiscible sulfides that later are deposited in layers by
gravitational settling. If the Platreef rocks were affected by late magmatic or
hydrothermal fluids, as suggested by strontium isotopes (Barton et al., 1986; Cawthorn et

159 al., 1985) and stable isotopes (Harris and Chaumba, 2001), then the effect on the PGE
mineralization is limited or minimal.

160 Summary
Re-Os measurements of sulfide samples from the Platreef in the northern limb of
the Bushveld Igneous Complex yielded a seven point isochron with an age of 2031 ± 88
Ma. This age is in good agreement with the accepted 2.05 Ga for the emplacement of the
BIC. The initial 187Os/188Os ratio of 0.207, is much more radiogenic than previously
determined ratios for bulk rock in the Merensky Reef, UG2, and UG1 (McCandless and
Ruiz, 1991), laurite grains from the Meresky Reef (Hart and Kinloch, 1989), and
chromitites from the Critical Zone (McCandless et al., 1999; Schoenberg et al., 1999).
The osmium initial composition is significantly more radiogenic than the mantle value at
the time of emplacement of the Bushveld Complex (~0.11 at 2.05 Ga).
This new Re-Os information support the notion that the contamination of the
magma chamber responsible of the Platreef occurred within the crust as previously
suggested by stable isotopes (Harris and Chaumba, 2001), and that crustal assimilation
played a fundamental role in the formation of PGE mineralization. Although previous
isotopic evidence suggested that the silicate minerals have been affected by late
magmatic or hydrothermal fluids, these had only a minor or insignificant role in the
concentration of platinum-group elements in the Bushveld Complex.

161
Figure D1. Simplified map of the Bushveld Complex, South Africa, showing main geologic units. Modified after Barnes et al. (2004) and Eales and Cawthorn (1996).

162
Figure D2. Geologic map of the northern limb of the Bushveld Complex. The location of the Sandsloot mine and the drill core from which sulfide samples were collected for this study is also shown. Modified after Harris and Chaumba (2001).

163
Figure D3. Generalized stratigraphic columns for the eastern, western and northern limbs of the Bushveld Complex. The Platreef is located at the base of the Critical Zone and in direct contact with dolomitic basement rocks. After Barnes et al. (2004).
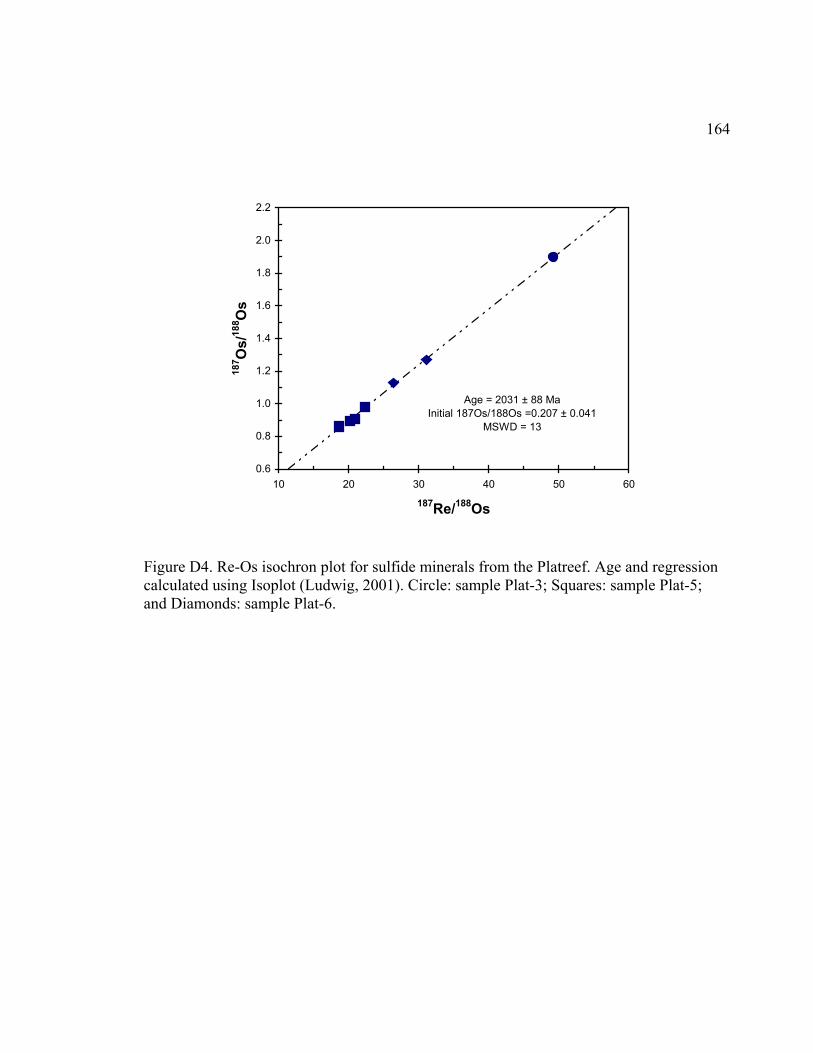
164
0.6
0.8
1.0
1.2
1.4
1.6
1.8
2.0
2.2
10 20 30 40 50 60
187Re/188Os
187 O
s/18
8 Os
Age = 2031 ± 88 MaInitial 187Os/188Os =0.207 ± 0.041
MSWD = 13
Figure D4. Re-Os isochron plot for sulfide minerals from the Platreef. Age and regression calculated using Isoplot (Ludwig, 2001). Circle: sample Plat-3; Squares: sample Plat-5; and Diamonds: sample Plat-6.

165 Table D1. Re-Os isotopic data for sulfide minerals from the Platreef
Uncertainties are at 2-sigma level *.Errors in the 187Re/188Os ratio are at ~1%, includes analytical errors in the measurement of Re and Os, weighing errors and spike calibrations ** 187Os/188Os uncertainties include analytical error only.
Sample Os (ppb) Re (ppb) 187Re/188Os (a) 187Os/188Os (b) γOs (c) Plat-3 4.21 34.54 49.214 ± 0.492 1.898 ± 0.010 82 Plat-5-1 30.43 126.67 22.289 ± 0.223 0.980 ± 0.001 88 Plat-5-2 36.75 129.40 18.633 ± 0.186 0.860 ± 0.001 60 Plat-5-3 31.08 121.88 20.881 ± 0.209 0.906 ± 0.001 69 Plat-5-4 30.55 116.10 20.188 ± 0.202 0.892 ± 0.002 88 Plat-6-1 25.56 123.38 26.372 ± 0.264 1.128 ± 0.003 67 Plat-6-2 14.38 80.61 31.119 ± 0.311 1.270 ± 0.001 66

166 REFERENCES
Ballhaus, C., and Stumpfl, E. F., 1986, Sulphide and platinum mineralization in the
Meresky Reef: evidence from hydrous silicates and fluid inclusions: Contributions to Mineralogy and Petrology, v. 94, p. 193-204.
Barnes, S. J., and Naldrett, A. J., 1985, Geochemistry of the J-M (Howland) Reef of the
Stillwater Complex, Minneapolis adit area. I. Sulfide chemistry and sulfide-olivine equilibrium: Economic Geology, v. 80, p. 709-729.
Barnes, S. J., and Campbell, I. H., 1988, Role of late magmatic fluids in Merenski-type
platinum deposits: a discussion: Geology, v. 16, p. 488-491. Barnes, S. J., Maier, W. D., and Ashwal, L. D., 2004, Platinum-group element
distribution in the Main Zone and Upper Zone of the Bushveld Complex, South Africa: Chemical Geology, v. 208, p. 293-317.
Barra, F., Ruiz, J., Mathur, R., and Titley, S., 2003, A Re-Os study of sulfide minerals
from the Bagdad porphyry Cu-Mo deposit, northern Arizona, USA: Mineralium Deposita, v. 38, p. 585-596.
Barton, J. M., Jr., Cawthorn, R. G., and White, J. A., 1986, The role of contamination in
the evolution of the Plat Reef of the Bushveld Complex: Economic Geology, v. 81, p. 1096-1104.
Barton, E. S., Alterman, W., Williams, I. S., and Smith, C. B., 1994, U-Pb zircon age
from a tuff in the Campbell Group, Griqualand West Sequence, South Africa: implications for early Proterozoic rock accumulation rates: Geology, v. 22, p. 343-346.
Birck, J. L., Roy Barman, M., and Capmas, F., 1997, Re-Os isotopic measurements at
the Femtomole level in natural samples: Geostandards Newsletter, v. 20, p. 19-27. Boudreau, A. E., and McCallum, I. S., 1992, Concentration of platinum-group elements
by magmatic fluids in layered intrusions: Economic Geology, v. 87, p. 1830-1848. Buchanan, D. L., Nolan, J., Suddaby, P., Rouse, J. E., Viljoen, M. J., and Davenport, J.
W. J., 1981, The genesis of sulphide mineralisation in a portion of the Potgietersrus limb of the Bushveld Complex: Economic Geology, v. 76, p. 568-579.
Buick, I. S., Maas, R., and Gibson, R. L., 2001, Precise U-Pb titanite age constraints on
the emplacement of the Bushveld Complex, South Africa: Journal of the Geological Society of London, v. 158, p. 3-6.

167 Campbell, I. H., Naldrett, A. J., and Barnes, S. J., 1983, A model for the origin of the
platinum-rich sulphide horizons in the Bushveld and Stillwater Complexes: Journal of Petrology, v. 24, p. 133-165.
Cawthorn, R. G., Barton, J. M., Jr., and Viljoen, M. J., 1985, Interaction of floor rocks
with the Platreef on Overysel, Potgietersrus, northern Transvaal: Economic Geology, v. 80, p. 988-1006.
Creaser, R. A., Papanastassiow, D. A., and Wasserburg, G. J., 1991, Negative thermal
ion mass spectrometry of osmium, rhenium, and iridium: Geochimica et Cosmochimica Acta, v. 55, p. 397-401.
Dickin, A. P., Richardson, J. M., Crocket, J. H., McNutt, R. H., and Peredery, W. V.,
1992, Osmium isotope evidence for a crustal origin of platinum group elements in the Sudbury nickel ore, Ontario, Canada: Geochimica et Cosmochimica Acta, v. 56, p. 3531-3537.
Eales, H. V., and Cawthorn, R. G., 1996, The Bushveld Complex, in Cawthorn, R. G.,
ed., Layered Intrusions: Amsterdam, Elsevier, p. 181-229. Gain, S. B., and Mostert, A. B., 1982, The geological setting of the platinoid and base
metal sulfide mineralisation in the Platreef of the Bushveld Complex in Drenthe, north of Potgietersrus: Economic Geology, v. 77, p. 1395-1404.
Harmer, R. E., and Sharpe, M. R., 1985, Field relations and stronium isotope systematics
of the marginal rocks of the Eastern Bushveld Complex: Economic Geology, v. 80, p. 813-837.
Harmer, R. E., Auret, J. M., and Eglington, B. M., 1995, Lead isotope variations within
the Bushveld complex, Southern Africa: a reconnaissance study: Journal of African Earth Sciences, v. 21, p. 595-606.
Harris, C., and Chaumba, J. B., 2001, Crustal contamination and fluid-rock interaction
during formation of the Platreef, northern limb of the Bushveld Complex, South Africa: Journal of Petrology, v. 42, p. 1321-1347.
Hart, S. R., and Kinloch, E. D., 1989, Osmium isotope systematics in Witwatersrand and
Bushveld ore deposits: Economic Geology, v. 84, p. 1651-1655. Kirk, J., Ruiz, J., Chesley, J., Walshe, J., and England, G., 2002, A major archean, gold-
and crust-forming event in the Kaapvaal craton, South Africa: Science, v. 297, p. 1856-1858.

168 Kruger, F. J., 1994, The Sr-isotope stratigraphy of the Western Bushveld Complex: South
African Journal of Geology, v. 97, p. 393-398. Kruger, F. J., and Marsh, J. S., 1982, The significance of 87Sr/86Sr ratios in the
Merenski cycle of the Bushveld Complex: Nature, v. 298, p. 53-55. Lambert, D. D., Foster, J. G., Frick, L. R., Ripley, E. M., and Zientek, M. L., 1998,
Geodynamics of magmatic Cu-Ni-PGE sulfide deposits: New insights from the Re-Os isotope system: Economic Geology, v. 93, p. 121-136.
Lambert, D. D., Foster, J. G., Frick, L. R., Li, C., and Naldrett, A. J., 1999, Re-Os
isotopic systematics of the Voisey's Bay Ni-Cu-Co magmatic ore system, Labrador, Canada: Lithos, v. 47, p. 69-88.
Lambert, D. D., Frick, L. R., Foster, J. G., Li, C., and Naldrett, A. J., 2000, Re-Os
isotope systematics of the Voisey's Bay Ni-Cu-Co magmatic sulfide system, Labrador, Canada: II. Implications for parental magma chemistry, ore genesis, and metal redistribution: Economic Geology, v. 95, p. 867-888.
Lee, C. A., 1996, A review of mineralization in the Bushveld Complex and some other
layered intrusions, in Cawthorn, R. G., ed., Layered Intrusions: Amsterdam, Elsevier, p. 103-145.
Luck, J. M., Birck, J. L., and Allegre, C. J., 1980, 187Re-187Os systematics in
meteorites: early chronology of the Solar System and age of the Galaxy: Nature, v. 283, p. 256-259.
Ludwig, K. R., 2001, Isoplot/Excel version 2.49. A geochronological toolkit for
Microsoft Excel: Berkeley Geochronological Center, v. Special Publication 1a. Maier, W. D., Arndt, N. T., and Curl, E. A., 2000, Progressive crustal contamination of
the Bushveld Complex: evidence from Nd isotopic analyses of the cumulate rocks: Contributions to Mineralogy and Petrology, v. 140, p. 316-327.
Mathur, R., Ruiz, J., and Munizaga, F., 2000, Relationship between copper tonnage of
Chilean base-metal porphyry deposits and Os isotope ratios: Geology, v. 28, p. 555-558.
Mathur, R., Marschik, R., Ruiz, J., Munizaga, F., Leveille, R. A., and Martin, W., 2002,
Age of mineralization of the Candelaria Fe oxide Cu-Au deposit and the origin of the Chilean iron belt, based on Re-Os isotopes: Economic Geology, v. 97, p. 59-71.

169 McCandless, T. E., and Ruiz, J., 1991, Osmium isotopes and crustal sources for
platinum-group mineralization in the Bushveld Complex, South Africa: Geology, v. 19, p. 1225-1228.
McCandless, T. E., Ruiz, J., Adair, B. I., and Freydier, C., 1999, Re-Os isotope and
Pd/Ru variations in chromitites from the Critical Zone, Bushveld Complex, South Africa: Geochimica et Cosmochimica Acta, v. 63, p. 911-923.
Morgan, J. W., Stein, H. J., Hannah, J. L., Markey, R. J., and Wiszniewska, J., 2000, Re-
Os study of Fe-Ti-V oxide and Fe-Cu-Ni sulfide deposits, Suwalki Anorthosite Massif, northeast Poland: Mineralium Deposita, v. 35, p. 391-401.
Morgan, J. W., Walker, R. J., Horan, M. F., Beary, E. S., and Naldrett, A. J., 2002,
190Pt-186Os and 187Re-188Os systematics of the Sudbury Igneous Complex, Ontario: Geochimica et Cosmochimica Acta, v. 66, p. 273-290.
Nagler, T. F., and Frei, R., 1997, 'Plug in' Os distillation: Schweizerische mineralogische
und petrographische Mitteilungen, v. 77, p. 123-127. Naldrett, A. J., Cameron, G., Von Gruenewaldt, G., and Sharpe, M. R., 1987, The
formation of stratiform PGE deposits in layered intrusions, in Parsons, I., ed., Origin of Igneous Layering: Dordrecht, D. Reidel, p. 313-397.
Ripley, E. M., Lambert, D. D., and Frick, L. R., 1999, Re-Os, Sm-Nd, and Pb isotopic
constraints on mantle and crustal contributions to magmatic sulfide mineralization in the Duluth Complex: Geochimica et Cosmochimica Acta, v. 62, p. 3349-3365.
Ruiz, J., Barra, F., Ashwal, L. D., and LeGrange, M., 2004, Re-Os systematics on
sulfides from the Platreef, Bushveld Complex, South Africa: Geoscience Africa 2004, Johannesburg, South Africa, 2004.
Schiffries, C. M., and Rye, D. M., 1989, Stable isotopic systematics of the Bushveld
Complex: I. constraints of magmatic processes in layered intrusions: American Journal of Science, v. 289, p. 841-873.
Schoenberg, R., Kruger, F. J., Nagler, T. F., Meisel, T., and Kramers, J. D., 1999, PGE
enrichment in chromitite layers and the Merensky Reef of the western Bushveld Complex; a Re-Os and Rb-Sr isotope study: Earth and Planetary Science Letters, v. 172, p. 49-64.
Shirey, S. B., and Walker, R. J., 1998, The Re-Os isotope system in cosmochemistry and
high-temperature geochemistry: Annual Review of Earth and Planetary Sciences, v. 26, p. 423-500.

170 Sproule, R. A., Lambert, D. D., and Hoatson, D. M., 1999, Re-Os isotopic constraints on
the genesis of the Sally Malay Ni-Cu-Co deposit, East Kimberley, Western Australia: Lithos, v. 47, p. 89-106.
Völkening, J., Walczyk, T., and Heumann, K. G., 1991, Osmium isotope ratio
determinations by negative thermal ionization mass spectrometry: International Journal of Mass Spectrometry and Ion Processes, v. 105, p. 147-159.
Walker, R. J., Morgan, J. W., Naldrett, A. J., Li, C., and Fassett, J. D., 1991, Re-Os
systematics of Ni-Cu sulfide ores, Sudbury Igneous Complex, Ontario: evidence for a major crustal component: Earth and Planetary Science Letters, v. 105, p. 416-429.
Walraven, F., 1997, Geochronology of the Rooiberg Group, Transvaal Supergroup, South
Africa, Economic Geology Research Unit Information Circular 316: Johannesburg, University of the Witwatersrand.
Walraven, F., and Hattingh, E., 1993, Geochronology of the Nebo Granite, Bushveld
Complex, South Africa: South African Journal of Geology, v. 96, p. 31-41. Walraven, J. R., Armstrong, R. A., and Kruger, F. J., 1990, A chronostratigraphic
frmawork for the the north-central Kaapvaal Craton, the Bushveld Complex and Vredefort structure: Tectonophysics, v. 171, p. 23-48.

171
APPENDIX E
LARAMIDE PORPHYRY CU-MO MINERALIZATION IN NORTHERN MEXICO:
AGE CONSTRAINTS FROM RE-OS GEOCHRONOLOGY IN MOLYBDENITES
Fernando Barra 1,2, Joaquin Ruiz 1, Victor A.Valencia1, Lucas Ochoa-Landín 3, John T.
Chesley 1, Lukas Zurcher1
1 Department of Geosciences, University of Arizona, Tucson, AZ 85721, USA 2 Instituto Geología Económica Aplicada, Universidad de Concepción, Concepción, Chile 3 Departmento de Geología, Universidad de Sonora, Hermosillo, Mexico
Submitted to Economic Geology

172 Abstract
Twenty-six new Re-Os molybdenite ages for ten porphyry copper-molybdenum
deposits from northern Mexico constrain the timing of mineralization and the longevity
of porphyry systems in this region. The ages of all the deposits are between 50 and 61
million years old (i.e., Paleocene to Eocene) and are associated with the Laramide
orogeny. The oldest deposits are those from the Cananea district and include El Alacrán
prospect (~61 Ma), the Maria deposit (60 Ma), the current Cananea mine and former La
Colorada breccia (~59 Ma). Cumobabi also is 59 Ma, and it is followed by the
emplacement of deposits at Suaqui Verde and Cuatro Hermanos about 57-56 my ago. The
Malpica prospect, the southernmost porphyry copper prospect in western Mexico, was
emplaced 54 my ago. The La Caridad deposit in Nacozari and the El Crestón prospect
both have Re-Os molybdenite ages of 54 Ma. The Tameapa prospect has a protracted
hydrothermal-mineralization history with multiple molybdenite mineralization events at
~57, 52-53 and at 50 Ma.
Total rhenium and 187Os concentrations for molybdenites range from 10424 to 26
ppm and from 6551 to 14 ppb, respectively. The deposit with the highest Re and Os
concentrations is El Alacrán and the lowest concentrations are found in El Crestón. The
ages determined support the recognition of Laramide porphyry copper formation in
northern Mexico. In general, the ages of porphyry copper deposits in the North American
province range from ~76 Ma in Bagdad, Arizona, to ~50 Ma in Tameapa, Sinaloa. The
ages show a general trend from older deposits in the north to younger deposits in the
south.

173 Introduction
The southwestern North American province (Arizona, New Mexico and northern
Mexico) has one of the highest concentrations of porphyry copper deposits (PCD) in the
world. The area has been the subject of extensive geological and geochemical studies, but
most of these have focused on PCD in Arizona and New Mexico (e.g., Titley, 1982,
2001). In contrast, geological information on the Mexican PCD is sparse, available in a
few Masters and PhD theses and unpublished exploration reports. Sillitoe (1976)
presented a reconnaissance analysis of twenty-nine Mexican porphyry Cu-Mo deposits,
providing the first general overview of these deposits. One limitation of that work was
the scarce geochronology available at the time. Damon et al. (1983a) published a series of
K-Ar dates, and interpreted the data in relation to regional tectonics. Barton et al. (1995)
provided a comprehensive tabulation and synthesis of porphyry copper deposits (PCDs)
in Mexico. Increasing exploration interest in the area requires a better understanding of
the metallogenesis of this province, as well as of the geology and evolution of these
mineral deposits. Within this context, two important questions that will be addressed here
are the age and duration of hydrothermal systems and associated mineralization.
The Re-Os system applied to molybdenite has proven to be a reliable
geochronological tool, once the suitability of the samples has been evaluated (i.e., Luck
and Allegre, 1980; McCandless et al., 1993; Stein et al., 1998). Re-Os molybdenite data
have been extensively used to determine the age of single deposits (e.g., Chesley and
Ruiz, 1997; Stein et al., 1998), but only recently this isotopic system has been used to

174 assess the duration of hydrothermal systems by dating different molybdenite events in
single deposits (e.g., Selby and Creaser, 2001; Barra et al., 2003a; Maksaev et al., 2004).
Studies at a regional scale to better understand and constrain mineralization episodes in
metallogenic provinces are scarce (McCandless and Ruiz, 1993).
Although the Laramide plutonic rocks of Mexico and associated ore deposits have
been the subject of regional studies (e.g., Barton et al., 1995; Staude and Barton, 2001)
little new geochronological information has been published. Here we present new Re-Os
geochronological data to constrain the age of mineralization in six prospects (El Alacrán,
Suaqui Verde, El Crestón, Cuatro Hermanos, Malpica and Tameapa), two active mines
(Cananea, La Caridad) and two previously exploited deposits (Cumobabi, Maria)
(Fig.E1). We also provide precise Re-Os ages for different molybdenite events in a single
deposit (Tameapa prospect) in order to estimate the duration of the hydrothermal system
or the multiple events responsible for the generation of this mineral deposit.

175 Regional Geology
Mexico consists of several accreted terranes that have experienced repeated
magmatic activity since at least the mid-Proterozoic (Campa and Coney, 1983; Sedlock et
al., 1993). In northern and eastern Sonora, the Precambrian basement consists of
metamorphosed volcanic and sedimentary rocks. The meta-volcanic and sedimentary
rocks are correlated with the Mazatzal province (1.62-1.72 Ga) of southern Arizona and
New Mexico (Valencia-Moreno, 2001). Precambrian gneisses and plutonic rocks with
ages of 1.7 to 1.8 Ga (Anderson et al., 1980) exposed near the town of Caborca represent
a fragment of North America, possibly from the Mojave province, displaced southward
by about 800 km (Anderson and Silver, 1979). The autochtonous Precambrian North
American terrane (Mazatzal province) is separated from the Caborca basement area by a
Jurassic left-lateral fault called the Mojave-Sonora Megashear (MSM) (Anderson and
Silver, 1979). Both Precambrian terranes were intruded by granites dated at 1.4 and 1.1
Ga (Anderson et al., 1980). Late Proterozoic and Paleozoic miogeoclinal sequences are
exposed in Sonora north of latitude 29° N (Stewart et al., 1990). To the south, eugeoclinal
deformed sedimentary successions of Ordovician to Permian age (Sedlock et al., 1993)
have been thrust over the miogeoclinal rocks during Permian to Late Triassic times.
Paleozoic igneous activity is scarce, with only a few manifestations in the
Permian (Torres-Vargas et al., 1994) and Triassic (Gastil et al., 1975). During the Early
Jurassic, a change in the plate boundary regime from transform to subduction style was
responsible for the development of a continental arc in southern Arizona and northern
Sonora (Tosdal et al., 1989). The arc was affected by the Mojave-Sonora Megashear

176 during the Late Jurassic. Displacement was roughly parallel to the arc so little transverse
offset may have occurred (Sedlock et al., 1993). East of the continental arc, the Bisbee
Group (Bilodeau, 1982) of Early to Late Cretaceous age, a sequence of clastic
sedimentary rocks, was deposited in a back-arc basin. During the Late Cretaceous the
Guerrero terrane, of Cretaceous age, was accreted to the North America craton (Coney,
1989). This terrane is composed of oceanic arc-related volcanic and sedimentary rocks
(Campa and Coney, 1983), and it is exposed in the western coast of northern Baja
California (Centeno-Garcia et al., 2003). In the Cretaceous, magmatic arc activity
migrated westward (Damon et al., 1983a), where it remained stationary for ~35 Ma
(between 140 and 105 my, Silver and Chappell, 1988). Later, during the Laramide
orogeny (80 – 40 Ma) and as a consequence of the flattening of the subduction angle, the
magmatic activity shifted eastward (Gastil, 1983; Dickinson, 1989). The intense
magmatism that characterizes the Laramide orogeny generated large batholithic masses
and associated volcanic rocks. This magmatism was most intense throughout Sonora and
Sinaloa between 65 and 55 Ma (Zurcher, 2002) and is responsible for most part of the
intrusion-related mineral deposits in Mexico (Barton et al., 1995; Staude and Barton,
2001). The composition of the intrusions is mostly intermediate to felsic, dominated by
hornblende-(pyroxene- and biotite-) bearing quartz diorites and granodiorites. Coeval
volcanic rocks are mainly andesites and dacites, with rhyolites and quartz-feldspar
porphyries common in some areas, such as in the Cananea District (Barton et al., 1995).
The end of the Laramide magmatic activity was marked by a decrease in the plate
convergence rate and a migration of the volcanic arc to the west (Coney and Reynolds,

177 1977; Damon et al., 1981). A 6 m.y. period of magmatic quiescence followed the
Laramide orogeny. Magmatism resumed during the Oligocene - Miocene and is
represented by the voluminous ignimbrite province of the Sierra Madre Occidental
(McDowell and Clabaugh, 1979).
The geology, mineralization-alteration and general characteristics for each deposit
discussed here are summarized in Table E1.
Analytical Procedure
Molybdenite samples were obtained from El Alacrán, Suaqui Verde, El Crestón,
Cumobabi, La Caridad, Cuatro Hermanos, Malpica, Tameapa, Cananea, and Maria.
Sample location, paragenesis and associated alteration of the samples analyzed are shown
in Table E2.
The Re-Os analytical procedure is the same as described in Barra et al. (2003a).
Briefly, approximately 0.05-0.1 g of molybdenite was handpicked and loaded in a Carius
tube. Spikes of 185Re and 190Os were added, along with 8 mL of reverse aqua regia (three
parts of HNO3, 16 N, and one part of HCl, 10 N), to the Carius tube following the
procedure described by Shirey and Walker (1995). About 2 to 3 mL of hydrogen
peroxide (30%) were added to ensure complete oxidation of the sample and spike
equilibration. The tube was heated to 240 °C for approximately eight hours, and the
solution was later subjected to a two-stage distillation process for osmium separation
(Nagler and Frei, 1997). Osmium was later purified using a microdistillation technique
described by Birck et al. (1997) and loaded on platinum filaments with Ba(OH)2 to

178 enhance ionization. After osmium separation, the remaining acid solution was dried, and
the residue was dissolved in 0.1 N HNO3. Rhenium was extracted and purified through a
two-stage column using AG1-X8 (100-200 mesh) resin and loaded on platinum filaments
with BaSO4.
Samples were analyzed by negative thermal ion mass spectrometry (NTIMS)
(Creaser et al., 1991) on a VG 54 mass spectrometer. Molybdenite Re-Os ages were
calculated considering a 187Re decay constant of 1.666x10⁻¹¹ a-1 (Smoliar et al., 1996).
Uncertainties were calculated using error propagation, taking into consideration errors
from spike calibration, the uncertainty in the rhenium decay constant (0.31%), and
analytical errors. All rhenium and osmium in molybdenite samples were measured with
Faraday collectors. Blank corrections are insignificant for molybdenite. In some cases,
replicate analyses of single molybdenite samples were performed; in other cases, samples
were analyzed only once because the age obtained was identical to other samples of the
same deposit or the amount of sample was limited.
Results
Twenty-six new Re-Os analyses of nineteen molybdenite samples from ten
porphyry deposits are reported in Table E3. Total rhenium and 187Os concentrations range
between 10,424 – 26 ppm and 6,551 – 14 ppb, respectively. The deposit with the highest
Re concentration is El Alacrán and the lowest Re concentrations are found in El Crestón
(Table E3).
The ages of the deposits studied here range from ~50 to 61 Ma. There is a general

179 trend from older deposits located to the north and younger deposits to the south (Fig. E2).
The oldest deposits are those of the Cananea district (59-61 Ma), with El Alacrán (61 Ma)
slightly older than Maria (60 Ma) and La Colorada (59 Ma). A similar age is observed for
Cumobabi with a Re-Os age of 59 Ma, which was followed by the emplacement of
Suaqui Verde and Cuatro Hermanos around 57-56 my ago. The Malpica prospect, the
southernmost porphyry copper prospect in western Mexico, was emplaced about 54 my
ago. The La Caridad deposit in the Nacozari district, and El Crestón prospect also have
Re-Os molybdenite ages of 54 Ma. The youngest deposit is Tameapa (~50 Ma), although
this deposit shows multiple molybdenite mineralization events that range from 50 to 57
Ma (Fig. E3).
In general, the new Re-Os ages of molybdenites are consistent with previous K-
Ar ages on igneous rocks (Table E4), with El Alacrán having a younger K-Ar age of 56.7
± 1.2 Ma (Damon et al., 1983a). Damon et al. (1983a) also obtained a younger K-Ar age
for Cumobabi (40.0 ± 0.9 Ma) compared to the ~59 Ma Re-Os molybdenite age reported
here. On the other hand, Scherkenbach et al. (1985) obtained K-Ar ages that range from
55.6 and 63 Ma for the different intrusive units of the Cumobabi deposit.
The Re-Os molybdenite age of 56.5 ± 3.2 Ma reported for Maria by McCandless
and Ruiz (1993) (recalculated using the new decay constant and 2 sigma error) is within
error of a K-Ar age of 58.2 ± 2 Ma (Wodzicki, 2001) and overlaps with the new age
reported here. The Re-Os molybdenite age of McCandless and Ruiz (1993) was
determined using the ICP-MS technique and a natural osmium spike, which is less
precise than the NTIMS technique.

180 Discussion
The Re-Os isotopic system has proven to be a reliable tool for the determination
of the age of molybdenite mineralization in different types of deposits. However,
controversy still remains regarding the possible disturbance of the system under different
conditions (see Barra et al., 2003a for discussion). Here, we have taken the necessary
precautions to assess that the results obtained are not disturbed ages. We have performed
repeated analyses when possible. In some cases, we performed microprobe screening if
the amount of sample was too small for replicate analysis (e.g., Cuatro Hermanos). In
other cases, when we had more than one molybdenite sample for a single deposit, and if
the analyses of both samples were consistent (i.e., same age within error), then we
assumed that the ages obtained reflected the mineralization age.
Spatial and temporal distribution of Mexican PCDs
The locations of the deposits studied here are shown in Figure 1. In a plot of
location (latitude) versus age, a general trend from older deposits located to the north and
younger to the south can be inferred (Fig. E2). It also shows that two main mineralization
events can be recognized in northern Mexico; the first event, represented by the Cananea
district, occurred at ~60 Ma and the second episode represented by La Caridad, at ~54
Ma. Both episodes have also been identified in Arizona with deposits such as Sierrita and
Copper Creek at ~60 Ma and Morenci at ~55 Ma (McCandless and Ruiz, 1993;
McCandless et al., 1993; Herrmann, 2001).
Within a regional context, some porphyry copper provinces around the world

181 have been relatively well constrained within spatial-temporal frames. The Andean
porphyry copper deposits, for example, have been grouped in three main belts of
Paleocene – early Eocene (66-52 Ma), late Eocene - Oligocene (42-31 Ma) and middle
Miocene – early Pliocene (16-5 Ma) age (Sillitoe, 1988). These belts are parallel to the
coast and are the result of the westward migration of the magmatic arc during the
Tertiary. On the other hand, two main episodes, at 74-70 and 60-55 Ma, have been
determined for the North American province of the southwestern US and northern
Mexico (Livingston et al., 1968; McCandless and Ruiz, 1993). The present study expands
the lower limit of the younger episode to 50 Ma, based mainly on the Re-Os ages for
Tameapa and supports the notion that the Mexican PCDs are, in general, younger than the
Arizonan PCDs.
Regarding the distribution of these deposits, Damon et al. (1983a) noted that most
of the Mexican PCDs lie in a narrow belt, approximately 100 km wide, that widens to the
north to include numerous deposits in Arizona and a few deposits in New Mexico. Recent
studies show that the Laramide magmatism extended to the Trans-Pecos region in west
Texas. Here, the Red Hills porphyry Cu-Mo deposit (Fig. E1) was dated at 60.2 ± 0.3 Ma
by Re-Os geochronology, and U-Pb zircon analyses yielded an age of 64.2 ± 0.2 Ma
(Gilmer et al., 2003). The spatial gap between Red Hills and the Sonoran deposits
suggests an interesting and open area for exploration of Laramide porphyry copper
deposits in northern Chihuahua (Gilmer et al., 2003). Although most of this area is
covered with volcanic rocks from the Sierra Madre Occidental, a few porphyry copper
prospects have been identified (e.g., the Tahonas prospect in the Batopilas district and the

182 Satevo prospect) (Wilkerson et al., 1988).
In a north-south direction, the Mexican PCDs show a general trend of older
deposits located in the north to younger deposits to the south (Fig. E2), but it is also clear
that deposits of different age can be found in close proximity (Damon et al., 1983a; this
study). This overlap in space of deposits of different age was the result of the migration
(through time) of the magmatic arc (Damon et al., 1983a).
Regarding the extension of this porphyry copper belt into Arizona, only a few
deposits have been dated with more precise techniques (i.e., Re-Os on molybdenite or U-
Pb on zircons). In Sierrita, two molybdenite mineralization events were identified at ~63
and ~61 Ma (Jensen, 1998, Table E5) in good agreement with U-Pb ages from zircons of
the intrusive units (Herrmann, 2001); at Copper Creek a molybdenite episode occurred at
~60 Ma (McCandless and Ruiz, 1993, this study); in Silver Bell at ~63 Ma (this study); in
Morenci at 55 Ma (McCandless and Ruiz, 1993) and in Bagdad two mineralization events
were identified at ~76 and ~72 Ma (Barra et al., 2003a; Table E5). The youngest PCD
identified in Arizona is Morenci and the oldest is Bagdad. All these dates fall within the
general timeframes of 74-70 and 60-55 Ma, with the exception of Silver Bell. The
recognition of a possible regional mineralization episode at ~64 Ma (Silver Bell and Red
Hills in Texas) was originally suggested by McCandless and Ruiz (1993). At that time
the available K-Ar data did not allow for a proper resolution of this episode because of
the high error associated with K-Ar determinations. It is possible that PCDs located in the
Milpillas district, north of the Cananea district, were emplaced at ~64-63 Ma. Further
geochronological studies are required, within single deposits and other prospects, to

183 properly determine if there is a ~64 Ma episode or if there is actually a continuum from
50 to 75 Ma within the North American porphyry province.
Mexican PCD Clusters
The concept of porphyry clusters has long been recognized and used in
exploration programs, but the genetic and timing relations between the deposits that form
the cluster are poorly understood or unknown. The deposits in the recently discovered
Toki cluster in the Chuquicamata district, northern Chile appear to have formed at the
same time at ~38 my ago (Camus, 2003; F. Barra, unpublished data, 2004). In northern
Mexico, clusters of deposits have also been identified at La Caridad, Cananea, and
Suaqui Verde (Damon et al., 1983a), although some of these clusters may actually be a
single deposit that has been dismembered by structural events that may have affected the
PCDs in the North American province, such as by Neogene Basin and Range
deformation, Laramide thrust faulting or mid-Tertiary detachment (e.g., Wilkins and
Heidrick, 1995; Maher et al., 2002). Examples of this situation are observed at El
Crestón, where the current deposit represents the upper portion of a larger system that
was segmented by the El Crestón low-angle fault (Leon and Miller, 1981) and the
Tameapa prospect where the Venado block lies in the footwall of the Barranca Colorada
fault and the Pico Prieto in the hanging wall. Hence, the Pico Prieto mineralized zone is
considered the upper portion of the system, whereas the Venado zone is interpreted as the
lower section of the Tameapa porphyry copper deposit (Zurcher, 2002). In the case of the
Cananea cluster (with Cananea, La Colorada, El Alacrán and Maria deposits) the new Re-
Os ages suggest that the intrusions responsible of the mineralization were emplaced

184 within a couple of million years. This suggests that the deposits that form a cluster are
emplaced within a very restricted or short period of time (i.e., 2-3 my).
Duration of hydrothermal systems
The duration of hydrothermal systems capable of producing an ore deposit is
among the many controversial problems in economic geology. Numerical models
(Norton, 1982; Cathles et al., 1997) suggest that single intrusions have a short (<<1 my)
life span. This conclusion has been supported by 40Ar/39Ar geochronology in some
districts (e.g., Potrerillos, Chile; Marsh et al., 1997). However, recent studies in other
deposits (Chuquicamata, Chile, Reynolds et al., 1998; Ossandon et al., 2001; Escondida,
Chile, Padilla et al., 2001) show that these deposits are the result of multiple intrusions
and possibly multiple hydrothermal-mineralization events.
The determination of the number and timing of mineralization events is not only
fundamental towards understanding the evolution of a porphyry copper system, but it is
also potentially crucial in evaluating the possible size of a deposit. Although some limited
studies have been done in this respect, specially in large porphyry copper deposits around
the world (El Teniente, Chile; Maksaev et al., 2004; Los Pelambres, Chile; Bertens et al.,
2003; Butte, Montana, USA; Dilles et al., 2004a,b) there is much work needed on
medium and small size PCDs in order to properly assess the relation between duration of
magmatism or number of mineralization events and the size of the deposit. It is also clear
that the use of a single geochronological tool, such as the Re-Os system used to date
molybdenite mineralization, may provide partial or limited information on the evolution

185 of a porphyry copper system and does not provide, for example, information regarding
magmatism or barren hydrothermal episodes. Furthermore, the use of Re-Os dating only
provides age information on molybdenite formation and although molybdenite
mineralization may be associated with copper, copper and molybdenite can be introduced
in the system in different hydrothermal episodes. Ideally, further studies will use a
combination of multiple dating techniques including 40Ar/39Ar, U-Pb, and Re-Os, in order
to achieve a complete understanding of the evolution of a particular deposit.
The limited amount of geochronological information for the Mexican PCDs does
not allow for a proper assessment of the duration of magmatism and mineralization.
Regardless of this limitation, here we attempt to provide some insight on the longevity of
porphyry Cu-Mo systems, based on recent studies on the La Caridad deposit (Valencia et
al., in review) and the new Re-Os ages for the Cananea district (i.e., Cananea mine, La
Colorada breccia, El Alacrán, and Maria deposits) and the Tameapa prospect. In
Cananea, the largest PCD in Mexico, the available geochronological information (Fig.
E4), suggests that magmatism in the district spanned about 10 m.y. but molybdenite
mineralization was introduced in a short interval of time (~59 – 61 Ma). On the other
hand, at La Caridad deposit in the Nacozari district, the second largest deposit in Mexico,
the duration of magmatism has been estimated to be ~5 my, but molybdenite
mineralization was introduced in a single pulse at ~54 Ma (Fig. E5, Valencia et al., in
review). At the Tameapa prospect, the magmatic activity also has an approximate
duration of 5 my based on the available K-Ar ages, but Re-Os molybdenite ages suggest
three mineralization episodes at ∼57, ∼52-53 and 50 Ma.

186 A preliminary comparison between these deposits with larger and smaller PCDs
in Chile (El Teniente, Chile; Maksaev et al., 2004; Los Pelambres, Chile; Bertens et al.,
2003) and the US (Sierrita, Arizona, USA; Jensen, 1998; Herrmann, 2001; Bagdad,
Arizona, USA; Barra et al., 2003a; Butte, Montana, USA; Dilles et al., 2004a,b) is shown
in Table E6. Large deposits like El Teniente and Los Pelambres are characterized by
multiple magmatic and mineralization events in a very restricted period of time (~2 Ma).
At Sierrita three discrete magmatic episodes have been identified (at 68-67, 64-63 and 60
Ma; Herrmann, 2001), spanning 8 my, with molybdenite mineralization associated with
the two younger events (at 64 and 60 Ma, Jensen, 1998). Poorly constrained magmatic
activity at Bagdad suggests episodic intrusion activity spanning from 4 to possibly 6 my,
but the bulk of mineralization seems to be introduced mainly in a single pulse at ~72 Ma
in Bagdad.
Based on the limited data available, there appears to be no direct relation between
the duration of magmatism or number of mineralization events and the size of the
deposit, as seen, for example, when comparing Bagdad, Sierrita, La Caridad, or Tameapa
(Barra et al., 2003b) (Table E6, Fig. E6). On the other hand, El Teniente and Los
Pelambres show similar characteristics, with numerous molybdenite events associated
with multiple magmatic episodes that occurred during a very short period of time. At
Butte, the Early Pre-Main stage has an estimated duration of 1.5 my, with at least three
molybdenite mineralization events, whereas the Main Stage has an estimated duration of
2.5 m.y. with no associated molybdenite (Dilles et al., 2004a,b). This example clearly
illustrates the limitation of only using the Re-Os system on molybdenites to estimate the

187 longetivity of porphyry copper systems. Further geochronological work is indispensable
in order to properly assess the relation between the duration of magmatism, number of
molybdenite mineralization events and the size (i.e., amount of contained copper) of a
specific deposit.

188 Conclusions
The new Re-Os molybdenite ages presented here for ten porphyry Cu-Mo
deposits from northern Mexico, show that this type of mineralization occurred
continuously during the time interval from 60 to 50 Ma. Although mineralization started
at 60 Ma, the main mineralization episodes are at ~60 Ma (Cananea district) and at ~54
Ma (La Caridad, El Crestón, Malpica). In the northern part of Sonora, the porphyry belt
expands considerably to the east to include the Red Hills deposit in southern Texas,
providing an open area in the northern part of Chihuhua for exploration of this kind of
deposits with probable ages of 60 to 64 Ma.
The low error associated with Re-Os age determinations on molybdenite allows
us to constrain different molybdenite mineralization events within a single deposit. For
the Tameapa prospect multiple molybdenite mineralization events were identified (at
~57, 52-53 and at 50 Ma), whereas for the Cananea district and La Caridad a short period
of molybdenite mineralization is inferred (at ~59-61 Ma and ~54 Ma, respectively).
These data support the notion that porphyry Cu-Mo deposits are the result of multiple
intrusions, but molybdenite mineralization can be introduced in various discrete episodes,
during a protracted period of magmatism (e.g., Tameapa, Mexico; Sierrita, USA) or
during a restricted period of magmatism (e.g., El Teniente and Los Pelambres, Chile). In
other cases, molybdenite is introduced in a single event associated to a single magmatic
pulse (i.e., La Caridad, Mexico).

189 Finally, further geochronological work is requiered to properly assess the possible
relation between the duration of magmatism, the number of molybdenite mineralization
events and the size (i.e., amount of contained copper) of a specific deposit.

190 ACKNOWLEDGEMENTS
We thank Mark Baker for his help in the laboratory. Special thanks to Ramon Ayala who
provided samples from La Colorada and Cananea mine. We thank Remigio Martinez
from Grupo Mexico for allowing access to the mines and Jose Contla and Enrique
Espinoza for assistance in sample collecting and discussions of La Caridad deposit. The
Departamento de Geologia of the Universidad de Sonora provided logistics for the field
campaign. Constanza Jara and Aldo Isaguirre Pompa assisted during sample collecting.
Analytical work was funded by the National Science Foundation Grants EAR 9708361,
and EAR 9628150 and instrumentation grant from the W.M. Keck Foundation.
This manuscript has also benefited from constructive reviews by Chris Eastoe, Spencer
Titley, Larry Meinert and Eric Seedorff.

191 REFERENCES
Anderson, T.H., and Silver, L.T., 1979, The role of the Mojave-Sonora megashear in the tectonic evolution of northern Sonora, in Anderson, T.H., and Roldan-Quintana, J., eds., Geology of northern Sonora, Geological Society of America Annual Meeting Guidebook, Field Trip 2, p. 59-68. Anderson, T.H., Silver, L.T., and Salas, G.A., 1980, Distribution and U-Pb isotope ages of some lineated plutons, northwestern Mexico, Geological Society America Memoir 153, p. 269-283. Barra, F., Ruiz, J., Mathur, R., and Titley, S., 2003a, A Re-Os study on sulfide minerals from the Bagdad porphyry Cu-Mo deposit, northern Arizona, USA: Mineralium Deposita, v. 38, p. 585-596. Barra, F., Ruiz, J., and Chesley, J., 2003b, The longevity of porphyry copper systems: a Re-Os approach, [abs]: Geological Society of America Abstract with Programs. Barton, M.D., Staude, J.M.G., Zurcher, L., and Megaw, P.K.M., 1995, Porphyry copper and other intrusion-related mineralization in Mexico, in Pierce, F.W., and Bolm, J.G. eds., Porphyry copper deposits of the American Cordillera: Tucson, Arizona Geological Society Digest, v. 20, p. 487-519. Bertens, A., Deckart, K., and Gonzalez, A., 2003, Geocronologia U-Pb, Re-Os y Ar-Ar del porfido Cu-Mo Los Pelambres, Chile Central, [ext. abs.]: X Congreso Geologico Chileno, Concepcion, Chile. Bilodeau, W.L., 1982, Tectonic models for Early Cretaceous rifting in southeastern Arizona: Geology v. 10, p. 466-470. Birck, J.L., RoyBarman, M., and Capmas, F., 1997, Re-Os measurements at the femtomole level in natural samples: Geostandard Newsletter, v. 20, p. 19-27. Campa, M.F., and Coney, P.J., 1983, Tectono-stratigraphic terranes and mineral resource distribution in Mexico: Canadian Journal of Earth Sciences, v. 20, p. 1040-1051. Camus, F., 2003, Geologia de los sistemas porfiricos en los Andes de Chile: SERNAGEOMIN 267 p. Cathles, L.M., Erendi, A.H.J., and Barrie, T., 1997, How long can a hydrothermal system be sustained by a single intrusive event? : ECONOMIC GEOLOGY, v. 92, p. 766-771. Centeno-Gracia, E., Corona-Chavez, P., Talavera-Mendoza, O., and Iriondo, I., 2003, Geology and tectonic evolution of the western Guerrero terrane – a transect from Puerto

192 Vallarta to Zihuatanejo, Mexico, in Geologic transects across Cordilleran Mexico, Guidebook for field trips of the 99th Annual Meeting of the Cordilleran Section of the Geological Society of America, Mexico: Universidad Nacional Autonoma de Mexico, Special Publication, v. 1, p. 201-228. Chesley, J., and Ruiz, J., 1997, Preliminary Re-Os dating on molybdenite mineralization from the Bingham Canyon porphyry copper deposit, Utah, in Thompson, T.B., ed., Geology and ore deposits of the Oquirrh and Wasatch Mountains, Utah: Society of Economic Geologist Guidebook Series, v. 29, p. 165-169. Coney, P.J., 1989, Structural aspects of suspected terranes and accretionary tectonics in western North America: Journal of Structural Geology, v. 11, p. 107-125. Coney, P.J., and Reynolds, S.J., 1977, Cordilleran Benioff zones: Nature v. 270, p. 403-406. Creaser, R.A., Papanastassiou, D.A., and Wasserburg, G.J., 1991, Negative thermal ion mass spectrometer of Os, Re and Ir: Geochimica et Cosmochimica Acta, v. 55, p. 397-401. Damon, P.E., and Mauger, R.L., 1966, Epeirogeny – orogeny viewed from the Basin and Range Province: Transactions AIME, v. 235, p. 99-112. Damon, P.E., Shafiqullah, M., and Clark, K.F., 1981, Evolucion de los arcos magmaticos en Mexico y su relacion con la metalogenesis. Revista Universidad Nacional Autonoma de Mexico, v. 5, p. 223-238. Damon, P.E., Shafiqullah, M., and Clark, K.F., 1983a, Geochronology of the porphyry copper deposits and related mineralization of Mexico: Canadian Journal of Earth Science, v. 20, p. 1052-1071. Damon, P.E., Shafiqullah, M., Roldan-Quintana, J., and Cocheme, J.J., 1983b, El batolito Laramide (90-40 Ma) de Sonora: [ext. abs.] Convencion Nacional de la Asociacion de Ingenieros de Minas, Metalurgicos y Geologos de Mexico, v. 15, p. 63-95. Dean, D.A., 1975, Geology, alteration and mineralization of the El Alacran area, northern Sonora, Mexico: Unpublished M.S. thesis, Tucson, University of Arizona, 222 p. Dickinson, W.R., 1989, Tectonic setting of Arizona through geologic time, in Jenny, J.P., and Reynolds, S.J., eds., Geological Evolution of Arizona: Tucson, Arizona Geological Society Digest, v. 17, p. 1-16.

193 Dilles, J.A., Martin, M.W., Stein, H., and Rusk, B., 2003, Re-Os and U-Pb ages for the Butte copper district, Montana: a short- or long-lived hydrothermal system? [abs] Geological Society of America Abstract with Programs. Dilles, J.A., Kent, A.J., and Rusk, B.G., 2004a, Magmatic sources of metals in the Butte, Montana, porphyry Cu-Mo and Cordilleran base metal lode deposit, [abs.]: International Association of Volcanology and Chemistry of the Earth’s Interior 2004 General Assembly, Volcanism and its Impact on Society. Dilles, J.A., Kent, A.J., and Rusk, B.G., 2004b, Re-Os and U-Pb ages for duration of the giant Butte, Montana, porphyry Cu-Mo and Cordilleran base metal lode deposit, [abs.]: International Association of Volcanology and Chemistry of the Earth’s Interior 2004 General Assembly, Volcanism and its Impact on Society. Gastil, R.G., 1983, Mesozoic and Cenozoic granitic rocks of southern California and western Mexico, in Roddick, J.A., ed., Circum-Pacific plutonic terranes: Geological Society of America Memoir, v. 150, p. 265-291. Gastil, R.G., Phillips, R.P., and Allison, E.C., 1975, Reconnaissance geology of the state of Baja California: Geological Society of America Memoir, v. 140, 170 p. Gilmer, A.K., Kyle, J.R., Connelly, J.N., Mathur, R.D., and Henry, C.D., 2003, Extension of Laramide magmatism in southwestern North America into Trans-Pecos Texas: Geology, v. 31, p. 447-450. Henry, C.D., 1975, Geology and geochronology of the granitic batholithic complex, Sinaloa, Mexico: Unpublished Ph.D. dissertation, El Paso, University of Texas, 159 p. Herrmann, M., 2001, Episodic magmatism and hydrothermal activity, Pima mining district, Arizona: Unpublished M.S. thesis, Tucson, University of Arizona, 44 p. Jensen, P.W., 1998, A structural and geochemical study of the Sierrita porphyry copper system, Pima County, Arizona: Unpublished M.S. thesis, Tucson, University of Arizona, 136 p. Leon, F.L., and Miller, C.P., 1981, Geology of the Creston molybdenum-copper deposit, in: Ortlieb, L., and Roldan, J., eds., Geology of the northwestern Mexico and southern Arizona: Geological Society of America Meeting Field Trips, p. 223-238. Livingston, D.E., 1973, A plate tectonic hypothesis for the genesis of porphyry copper deposits of the southern Basin and Range Province: Earth and Planetary Science Letters, v. 20, p. 171-179.

194 Livingston, D.E., Mauger, R.L., and Damon, P.E., 1968, Geochronology of the emplacement, enrichment, and preservation of Arizona porphyry copper deposits: ECONOMIC GEOLOGY, v. 63, p. 30-36. Long, K.R., 1995, Production and reserves of Cordilleran (Alaska to Chile) porphyry copper deposits, in Pierce, F.W., and Bolm, J.G., eds., Porphyry Copper Deposits of the American Cordillera: Tucson, Arizona Geological Society Digest, v. 20, p. 35-69. Luck, J., and Allegre, C., 1980, Osmium isotopes as petrogenetic tracers: Earth and Planetary Science Letters, v. 48, p. 148-154. Maher, D., Seedorff, E., and Barton, M., 2002, A new look at middle Tertiary dismemberment and rotation of Laramide porphyry systems in southern Arizona [abs.], in Marsh, E.E., Goldfarb, R. J., and Day, W. C., eds., Global Exploration 2002: Integrated Methods for Discovery: Society of Economic Geologists, Symposium, April 2002, Abstracts of Oral and Poster Presentations, p. 121-122. Maksaev, V., Munizaga, F., McWilliams, M., Fanning, M., Mathur, R., Ruiz, J., and Zentilli, M., 2004, New Chronology for El Teniente, Chilean Andes, from U-Pb, 40Ar/39Ar, Re-Os, and Fission-Track Dating: Implications for the Evolution of a Supergiant Porphyry Cu-Mo Deposit, in Sillitoe, R.H., Perello, J., and Vidal, C.E., eds., Andean Metallogeny: New Discoveries, Concepts, and Updates: Society of Economic Geologists, Special Publication, v. 11, p. 15-54. Marsh, T.M., Einaudi, M.T., and McWilliams, M., 1997, 40Ar/39Ar geochronology of Cu-Au and Au-Ag mineralization in the Potrerillos district, Chile: ECONOMIC GEOLOGY, v. 92, p.784-806. Martinez-Muller, R., 1973, Economic geology of the Malpica prospect, Sinaloa, Mexico: Unpublished M.S. thesis, Golden, Colorado School of Mines, 115 p. McCandless, T.E., and Ruiz, J., 1993, Rhenium-osmium evidence for regional mineralization in southwestern North America: Science, v. 261, p. 1282-1286. McCandless, T.E., Ruiz, J., and Campbell, A.R., 1993, Rhenium behavior in molybdenite in hypogene and near-surface environments: implications for Re-Os geochronology: Geochimica et Cosmochimica Acta, v. 57, p. 889-905. McDowell, F.W., and Clabaugh, S.E., 1979, Ignimbrites of the Sierra Madre Occidental and their relation to the tectonic history of western Mexico, in Chapin, C.E., and Elston, W.E., eds., Ash-flow tuffs: Geological Society of America Special Paper, v. 180, p. 113-124.

195 Nägler, T.F., and Frei, R., 1997, Plug in plug osmium distillation: Schweizerische Mineralogische Petrographische Mitteilungen, v. 77, p. 123-127. Norton, D.L., 1982, Fluid and heat transport phenomena typical of copper-bearing pluton environments, in Titley, S.R., ed., Advances in the geology of the porphyry copper deposits in the southwestern North America: Tucson, University of Arizona Press, p. 59-72. Ossandon, G., Freraut, R., Gustafson, L.B., Lindsay, D.D., and Zentilli, M., 2001, Geology of the Chuquicamata mine: A progress report: ECONOMIC GEOLOGY, v. 96, p. 249-270. Padilla-Garza, R.A., Titley, S.R., and Pimentel, F., 2001, Geology of the Escondida porphyry copper deposit, Antofagasta Region, Chile: ECONOMIC GEOLOGY, v. 96, p. 307-324. Reynolds, P., Ravenhurst, C., Zentilli, M., and Lindsay, D., 1998, High-precision 40Ar/39Ar dating of two consecutive hydrothermal events in the Chuquicamata porphyry copper system, Chile: Chemical Geology, v. 148, p. 45-60. Scherkenbach, D.A., Sawkins, F.J., and Seyfried, W.E., 1985, Geologic, fluid inclusion, and geochemical studies of the mineralized breccias at Cumobabi, Sonora, Mexico: ECONOMIC GEOLOGY v. 80, p.1566-1592. Sedlock, R.L., Ortega-Gutierrez, K., and Speed, R.C., 1993, Tectonostratigraphic terranes and tectonic evolution of Mexico: Geological Society of America Special Paper, v. 278, 153 p. Selby, D., and Creaser, R.A., 2001, Re-Os Geochronology and Systematics in Molybdenite from the Endako Porphyry Molybdenum Deposit, British Columbia, Canada: ECONOMIC GEOLOGY v. 96, p. 197-204. Shirey, S., and Walker, R., 1995, Carius tube digestion for low-blank rhenium-osmium analysis: Analytical Chemistry, v. 67, p. 2136-2141. Sillitoe, R.H., 1976, A reconnaissance of the Mexican porphyry copper belt: Transactions Institution of Mining and Metallurgy, Section B, v. 85, p. 170-189. Sillitoe, R.H., 1988, Epochs of intrusion-related copper mineralization in the Andes: Journal of South American Earth Science, v. 1, p. 89-108. Silver, L.T., and Chappell, B.W., 1988, The Peninsular Ranges batholith: an insight into the evolution of the Cordilleran batholiths of southwestern North America: Transactions of the Royal Society of Edinburgh, Earth Science, v. 79, p. 105-121.

196 Smoliar, M.I., Walker, R.J., and Morgan, J.W., 1996, Re-Os ages of group IIA, IIIA, IVA and IVB iron meteorites: Science, v. 271, p. 1099-1102. Staude, J.-M. G., and Barton, M. D., 2001, Jurassic to Holocene tectonics, magmatism, and metallogeny of northwestern Mexico: Geological Society of America Bulletin, v. 113, p. 1357-1374. Stein, H.J., Sundblad, K., Markey, R., Morgan, J.W., and Motuza, G., 1998, Re-Os ages for Archean molybdenite and pyrite, Kuittila-Kiviso, Finland and Proterozoic molybdenite, Kabeliai, Lithuania: testing the chronometer in a metamorphic and metasomatic setting: Mineralium Deposita, v. 33, p. 329-345. Stewart, J.H., Poole, F.G., Ketner, K.B., Madrid, R.J., Roldan-Quintana, J., and Amaya-Martinez, R., 1990, Tectonics and stratigraphy of the Paleozoic and Triassic southern margin of North America, Sonora, Mexico, in Gehrels, G.E., and Spencer, J.E., eds., Geological excursions through the Sonoran desert region, Arizona and Sonora: Field-Trip Guidebook for the 86th Annual Meeting of the Cordilleran Section, Geological Society of America, Tucson, Arizona Geological Survey Special Paper, v. 7, p. 183-202. Titley, S.R., 1982, Geologic setting of porphyry copper deposits, southeastern Arizona, in Titley, S.R., ed., Advances in the geology of the porphyry copper deposits in the southwestern North America: Tucson, University of Arizona Press, p. 37-58. Titley, S.R., 2001, Crustal affinities of metallogenesis in the American Southwest: ECONOMIC GEOLOGY, v. 96, p.1323-1342. Torres-Vargas, R., Ruiz, J., Grajales, M., and Murillo, G., 1994, Permian magmatism in eastern and southern Mexico and its tectonic implications, [abs.]: Geological Society of America Abstracts with Programs, v. 24, p. 64. Tosdal, R.M., Haxel, G.B., and Wright, J.E., 1989, Jurassic geology of the Sonoran Desert region, southern Arizona, southeastern California, and northernmost Sonora; construction of a continental-margin magmatic arc, in Jenny, J.P., and Reynolds, S.J., eds., Geological Evolution of Arizona: Tucson, Arizona Geological Society Digest, v. 17, p. 397-434. Valencia, V.A., Ruiz, J., Barra, F., Geherls, G., Ducea, M., Titley, S., and Ochoa-Landin, L., in review, U-Pb single zircon and Re-Os geochronology from La Caridad porphyry copper deposit: insights for the duration of magmatism and mineralization in the Nacozari district, Sonora, Mexico. Valencia-Moreno, M., Ruiz, J., Barton, M.D., Patchett, P.J., Zurcher, L., Hodkinson, D.G., and Roldan-Quintana, J., 2001, A chemical and isotopic study of the Laramide

197 granitic belt of northwestern Mexico: identification of the southern edge of the North American Precambrian basement: Geological Society of American Bulletin, v. 113, p. 1409-1422. Wilkerson, G., Deng, Q.P., Llavona, R., and Goodell, P., 1988, Batopilas mining district, Chihuahua, Mexico: ECONOMIC GEOLOGY, v. 83, p. 1721-1736. Wilkins, J., Jr., and Heidrick, T. L., 1995, Post-Laramide extension and rotation of porphyry copper deposits, southwestern United States, in Pierce, F. W., and Bolm, J. G., eds., Porphyry copper deposits of the American Cordillera, Arizona Geological Society Digest 20, p. 109-127. Wodzicki, W.A., 1995, The evolution of Laramide igneous rocks and porphyry copper mineralization in the Cananea district, Sonora, Mexico: Unpublished Ph.D. dissertation, Tucson, University of Arizona, 181 p Wodzicki, W.A., 2001, The evolution of magmatism and mineralization in the Cananea district, Sonora, Mexico, in Albinson, T., and Nelson, C.E., eds., New Mines and Discoveries in Mexico and Central America: Society of Economic Geologist Special Publication, v. 8, p. 243-263. Zurcher, L., 2002, Regional setting and magmatic evolution of Laramide porphyry copper systems in western Mexico: Unpublished Ph.D. dissertation, Tucson, University of Arizona, 285 p.

198
Figure E1. Location of the dated Mexican porphyry copper-molybdenum deposits with their corresponding ages in parentheses. Also shown are North American PCDs discussed in text.

199
4950515253545556575859606162Age (Ma)
Latit
itude
(Deg
rees
)
23
24
25
26
27
28
29
30
31
32
El Alacran
Maria Cananea
Cumobabi
Suaqui Verde
Cuatro Hermanos
La Caridad
El Creston
Tameapa
Malpica
Figure E2. Graph illustrating the distribution of Mexican PCDs versus age. The arrow shows a general trend from older deposits in the north to younger deposits in the south.

200
495051525354555657585960
Ma
Moly vein in bio gd wallrock
Shallow moly vein in tonalite phy
Moly vein in porphyritic bio-hbl gd Deep moly vein in tonalite porphyry
Moly vein in tonalite-dacite porphyry
Moly vein in porphyritic gd
Bio-hbl-px granodiorite (UAKA 73-88)
Biotite granodiorite (UAKA 73-87)Biotite granodiorite (KC-3)
K-Ar
Re-Os
Hbl
BioBio
Bio
C-1-1
C-1-2G-15
V-12-1V-12-2
G-14V-20-1
V-20-2V-1E-1
V-1E-2
Figure E3. Geochronological data from the Tameapa porphyry Cu-Mo prospect. Symbols represent age determinations; error bars are 2σ. Filled squares are K-Ar ages from Henry (1975) and Damon et al. (1983a); filled diamonds are Re-Os molybdenite ages (this study). Bio = biotite; hbl = hornblende; px = pyroxene; gd = granodiorite; phy = porphyry.

201
Figure E4. Schematic generalized stratigraphic column for the Cananea district showing the available geochronological information. Modified after Wodzicki (1995).
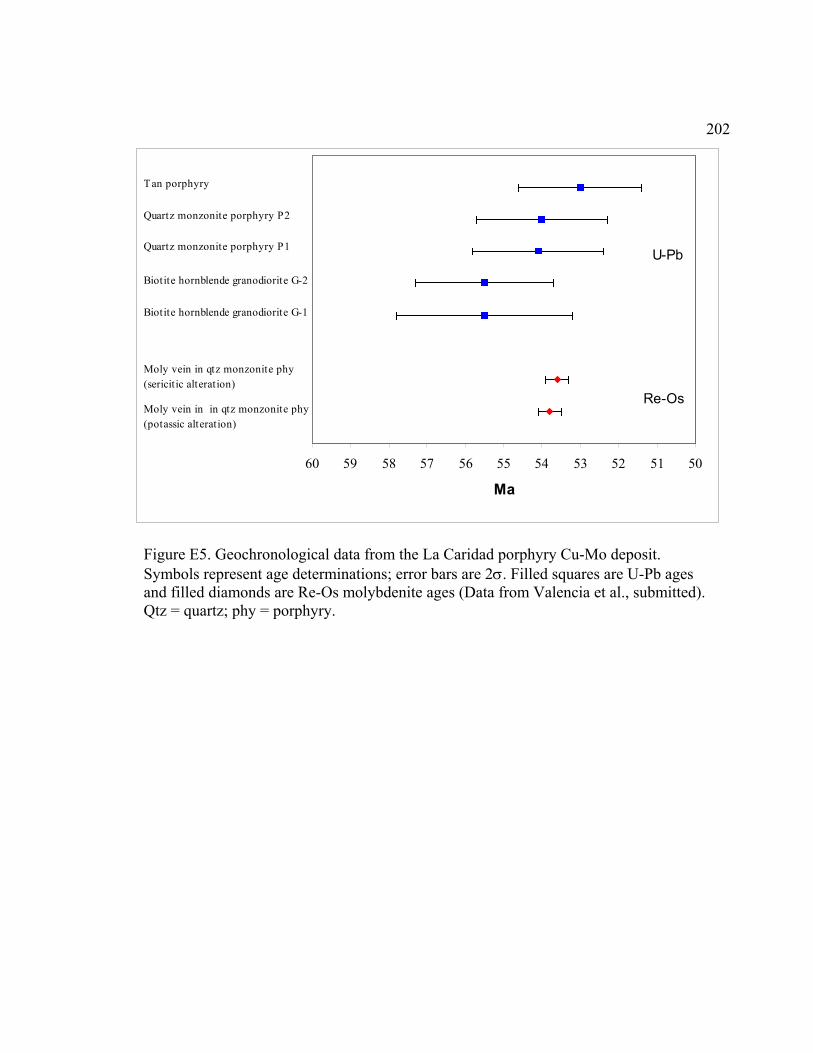
202
5051525354555657585960
Ma
Moly vein in in qtz monzonite phy(potassic alteration)
Moly vein in qtz monzonite phy(sericitic alteration)
Tan porphyry
Quartz monzonite porphyry P2
Biotite hornblende granodiorite G-2
U-Pb
Re-Os
Quartz monzonite porphyry P1
Biotite hornblende granodiorite G-1
Figure E5. Geochronological data from the La Caridad porphyry Cu-Mo deposit. Symbols represent age determinations; error bars are 2σ. Filled squares are U-Pb ages and filled diamonds are Re-Os molybdenite ages (Data from Valencia et al., submitted). Qtz = quartz; phy = porphyry.

203
0.01
0.1
1
10
100
1000
0 1 2 3 4 5 6 7 8 9 10Duration of magmatism (Ma)
Estim
ated
Res
erve
s +
Prod
uctio
n (M
t) El Teniente
Los PelambresButte
Sierrita
La CaridadBagdad
Tameapa
Figure E6. Diagram showing the inferred duration of magmatism (Ma) versus the estimated reserves and production (Mt) for six porphyry copper deposits of different size (Cu tonnage). See text for discussion.

Table E1. Description of selected porphyry Cu-Mo deposits of northern Mexico
Deposit - State
Location Stock type or breccias
Host rocks Style of Mineralization
Alteration/ Mineralization
Tonnage and grades
Reference
El Alacrán, Sonora
30°51’N 110°11’W
qz-latite phy; intrusive breccia
Laramide andesites and rhyolites
stockwork, disseminated, breccia pipe
K: qz-bio-ch ± kfd/mg-py-cpy-mo ± tt S: qz-s-tour ± ka-ch/py ± cpy, mo Pr: ch-ep-cc
2.4 Mt 0.35%Cu 1,2,3,4
Maria, Sonora
30°58’N 110°17’W
qz-feldspar phy Cuitaca granodiorite
stockwork, brecciated massive silicate-sulfide pegmatite (MSSP)
K: qz-tour-kfd ± bio/ py-cpy-mo S: qz-s/ py ± cpy-mo Pr: ka-ch-ep-s MSSP mineralization: a) Early cpy-qz-bio b) Late py-qz-tour
1.6 Mt 6%Cu; 0.36% Mo, 31 g/t Ag
5
Cananea, Sonora
30°58’N 110°17’W
qz-monzonite phy; La Colorada breccia
Cananea granite, Paleozoic quartzite and limestones, Laramide volcanics
stockwork, disseminated, breccia pipe (pegmatitic), skarn
K: kfd-bio-qz/ cpy-py-mo S: qz-s-tour/ py ± cpy-mo Pr: ch-ep/ py Pegmatitic mineralization: qz-phl/ cpy-bn-mo
La Colorada: 6 Mt 7%Cu; 0.8% Mo Cananea reserves: 1604.5 Mt 0.61%Cu
1,2,4,5,6
Cumobabi, Sonora
29°48’N 109°49’W
qz-monzonite phy rhyolite qz phy diorite phy microgranite qz breccia
Tertiary (?) andesites, dacites and rhyolites
stockwork, disseminated brecciated massive silicate-sulfide pegmatite
K: kfd-bio-qz ± anh/ mo-py ± cpy S: s-qz-cc ± tour ± anh/ py-cpy-tt
Production: 1.5 Mt 0.5%Mo; 0.1%Cu Reserves: 10 Mt 0.22%Mo; 0.25%Cu Resources: 20 Mt 0.1%Mo
2,6,7
Suaqui Verde, Sonora
28°24’N 109°48’W
qz diorite Laramide Sonora batholith; Late Cretaceous-Early Tertiary andesites
stockwork, disseminated, breccia pipe
K: kfd-bio/ py ± cpy S: s-qz/ py-cpy-mo
Hypogene ore: 0.1-0.15% Cu. Supergene ore: 0.3-0.5% Cu
1,2
204
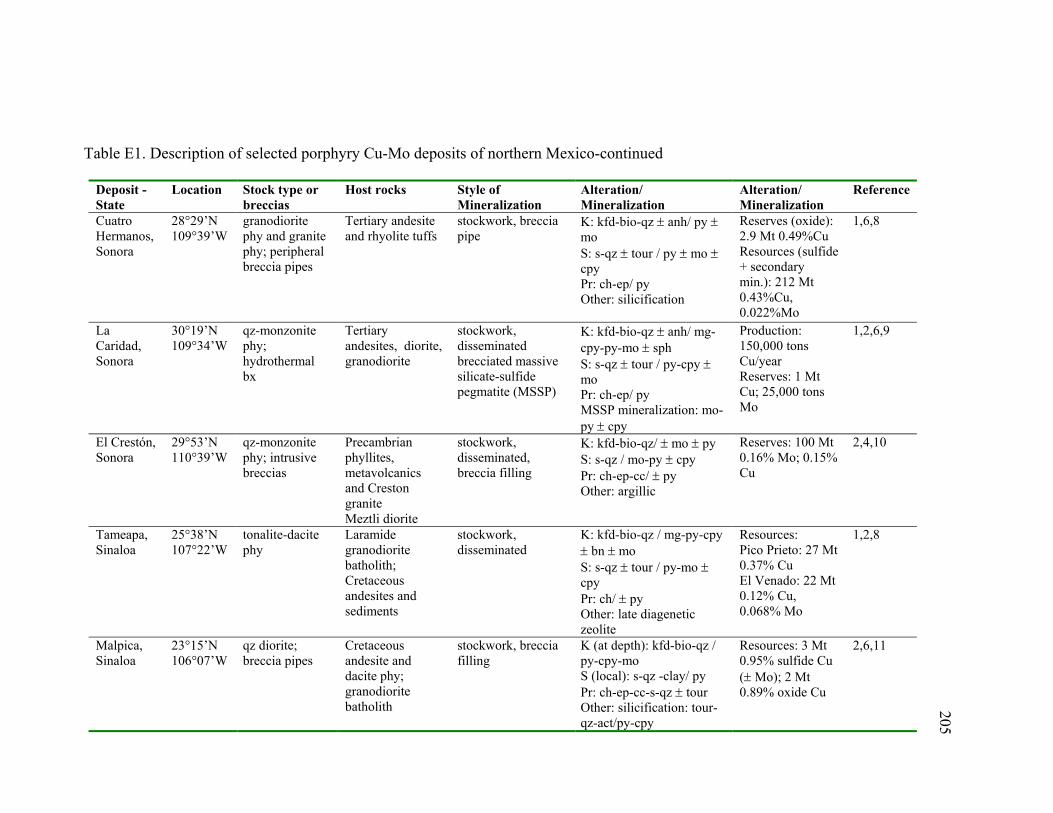
Table E1. Description of selected porphyry Cu-Mo deposits of northern Mexico-continued
Deposit - State
Location Stock type or breccias
Host rocks Style of Mineralization
Alteration/ Mineralization
Alteration/ Mineralization
Reference
Cuatro Hermanos, Sonora
28°29’N 109°39’W
granodiorite phy and granite phy; peripheral breccia pipes
Tertiary andesite and rhyolite tuffs
stockwork, breccia pipe
K: kfd-bio-qz ± anh/ py ± mo S: s-qz ± tour / py ± mo ± cpy Pr: ch-ep/ py Other: silicification
Reserves (oxide): 2.9 Mt 0.49%Cu Resources (sulfide + secondary min.): 212 Mt 0.43%Cu, 0.022%Mo
1,6,8
La Caridad, Sonora
30°19’N 109°34’W
qz-monzonite phy; hydrothermal bx
Tertiary andesites, diorite, granodiorite
stockwork, disseminated brecciated massive silicate-sulfide pegmatite (MSSP)
K: kfd-bio-qz ± anh/ mg-cpy-py-mo ± sph S: s-qz ± tour / py-cpy ± mo Pr: ch-ep/ py MSSP mineralization: mo-py ± cpy
Production: 150,000 tons Cu/year Reserves: 1 Mt Cu; 25,000 tons Mo
1,2,6,9
El Crestón, Sonora
29°53’N 110°39’W
qz-monzonite phy; intrusive breccias
Precambrian phyllites, metavolcanics and Creston granite Meztli diorite
stockwork, disseminated, breccia filling
K: kfd-bio-qz/ ± mo ± py S: s-qz / mo-py ± cpy Pr: ch-ep-cc/ ± py Other: argillic
Reserves: 100 Mt 0.16% Mo; 0.15% Cu
2,4,10
Tameapa, Sinaloa
25°38’N 107°22’W
tonalite-dacite phy
Laramide granodiorite batholith; Cretaceous andesites and sediments
stockwork, disseminated
K: kfd-bio-qz / mg-py-cpy ± bn ± mo S: s-qz ± tour / py-mo ± cpy Pr: ch/ ± py Other: late diagenetic zeolite
Resources: Pico Prieto: 27 Mt 0.37% Cu El Venado: 22 Mt 0.12% Cu, 0.068% Mo
1,2,8
Malpica, Sinaloa
23°15’N 106°07’W
qz diorite; breccia pipes
Cretaceous andesite and dacite phy; granodiorite batholith
stockwork, breccia filling
K (at depth): kfd-bio-qz / py-cpy-mo S (local): s-qz -clay/ py Pr: ch-ep-cc-s-qz ± tour Other: silicification: tour-qz-act/py-cpy
Resources: 3 Mt 0.95% sulfide Cu (± Mo); 2 Mt 0.89% oxide Cu
2,6,11
205

Abbreviations: qz: quartz; phy: porphyry; K: potassic; S: sericitic; Pr: propilitic; bio: biotite; ch: chlorite; kfd: K-feldspar; anh: anhidrite; s: sericite; tour: tourmaline; ka: kaolinite; ep: epidote; phl: phlogopite; cc: calcite; act: actinolite; mg: magnetite; py: pyrite; cpy: chalcopyrite; mo: molybdenite; tt: tetrahedrite; sph: sphalerite; bn: bornite References: 1: Sillitoe (1976); 2: Damon et al. (1983a); 3: Dean (1975); 4: Perez-Segura (written communication); 5: Wodzicki (1995, 2001); 6: Barton et al. (1995); 7: Scherkenbach et al. (1985); 8: Zurcher (2002); 9: Valencia et al. (in review); 10: Leon and Miller (1981); 11: Martinez-Muller (1973).
206

207 Table E2. Description of molybdenite samples
Deposit/Sample Description El Alacrán B9 B6
Phyllic alteration, qtz-py-cpy-moly vein in qtz-feld porphyry Phyllic alteration, qtz-py-cpy-moly vein in qtz-feld porphyry
Maria MR1 Potassic alteration, qtz-cpy-moly (pegmatitic) in qtz-feld porphyry Cananea Incremento 3 Phyllic alteration, cpy + moly disseminated in qtz-feld porphyry La Colorada Cpy + py + moly (massive) at top of La Colorada breccia Cumobabi Cumo123
Potassic alteration, qtz + biotite + K feld + moly (pegmatite)
Cumo124 Phyllic alteration, qtz-moly vein in qtz monzonite porphyry Suaqui Verde SQ-1 Phyllic alteration, qtz-moly vein in qtz porphyry Cuatro Hermanos CH-26 Potassic alteration, qtz-py-moly vein in andesite Malpica Mal-79 Potassic alteration, qtz-cpy-moly vein in granodiorite Nacozari 608 Potassic alteration, qtz-anh-py-moly vein in qtz monzonite porphyry M-1 Phyllic alteration, qtz-cpy-py-moly vein in qtz monzonite porphyry El Crestón EC-1 Phyllic alteration, qtz-moly vein in Creston granite Tameapa C-1 G-15 V-12 G-14 V-20 V1E
Potassic alteration, qtz-py-cpy-moly vein in porphyritic granodiorite Potassic alteration, qtz-py-bn-moly vein in tonalite-dacite porphyry Potassic alteration, qtz-moly vein in tonalite porphyry Silicification, qtz-py-moly vein in aplite Phyllic alteration, qtz-py-moly vein in tonalite porphyry Potassic alteration, qtz-moly vein in biotite granodiorite
Abbreviations: qz: quartz; py: pyrite; cpy: chalcopyrite; moly: molybdenite; feld: feldspar; anh: anhidrite; bn: bornite.

208 Table E3. Re-Os data for molybdenite from Mexican porphyry Cu-Mo deposits
Deposit/Location Sample Total Re
(ppm) 187 Re (ppm) 187 Os (ppb) Age (Ma) El Alacrán, Sonora B9 7352(6) 4622(4) 4690(7) 60.9 ± 0.2 B6 10424(10) 6553(6) 6551(10) 60.8 ± 0.2Maria, Sonora MR1 316.9(4) 199.2(3) 200.4 (3) 60.4 ± 0.3Cananea, Sonora Incremento 3 95.7(1) 60.2(1) 59.2(1) 59.3 ± 0.3 La Colorada 90.7(1) 57.0(1) 55.7(1) 59.2 ± 0.3Cumobabi, Sonora 123 189.0(2) 118.8(1) 116.0(2) 58.7 ± 0.2 124 368.2(3) 231.5(2) 225.9(3) 58.7 ± 0.2Suaqui Verde, Sonora 1-1 164.8(1) 103.6(1) 98.3(2) 57.0 ± 0.3 1-2 189.9(2) 119.4(1) 114.8(2) 56.8 ± 0.2Cuatro Hermanos, Sonora CH-26 468.7(4) 294.6(2) 271.8(4) 55.7 ± 0.3Malpica, Sinaloa 79 98.0(1) 61.6(1) 55.1(1) 54.1 ± 0.3Nacozari, Sonora 608-1 73.6(1) 46.3(1) 41.4(1) 54.0 ± 0.3 608-2 71.3(1) 44.8(1) 40.1(1) 53.8 ± 0.2 M-1 195.2(2) 122.7(1) 109.4(2) 53.6 ± 0.2El Crestón, Sonora EC-1 25.6 (1) 16.1(1) 14.3(1) 53.6 ± 0.2Tameapa, Sinaloa C-1-1 740.7(6) 465.7(4) 445.7(7) 57.4 ± 0.2 C-1-2 618.8(5) 389.1(3) 370.3(6) 57.2 ± 0.2 C-1-3 610.4(5) 383.7(3) 364.2(5) 57.0 ± 0.2 G-15 173.1(2) 108.8(1) 100.6(2) 55.8 ± 0.3 V-12-1 198.8(2) 125.0(1) 110.0(2) 52.9 ± 0.3 V-12-2 199.0(2) 125.1(1) 109.5(2) 52.6 ± 0.3 G-14 181.8(1) 114.3(1) 97.9(1) 52.0 ± 0.3 V-20-1 85.5(1) 53.8(1) 46.4(1) 52.0 ± 0.3 V-20-2 93.2(1) 58.6(1) 50.1(1) 51.6 ± 0.3 V1E-1 76.1(1) 47.9(1) 40.0(1) 50.5 ± 0.3 V1E-2 71.0(1) 44.6(1) 36.8(1) 50.0 ± 0.3
Values in parenthesis are absolute uncertainties (2σ). Uncertainties in ages are calculated using error propagation and include error in the decay constant (0.31%), 185Re and 190Os spike calibration (0.08% and 0.15%, respectively) and analytical errors. Uncertainties for ages are absolute (2σ).
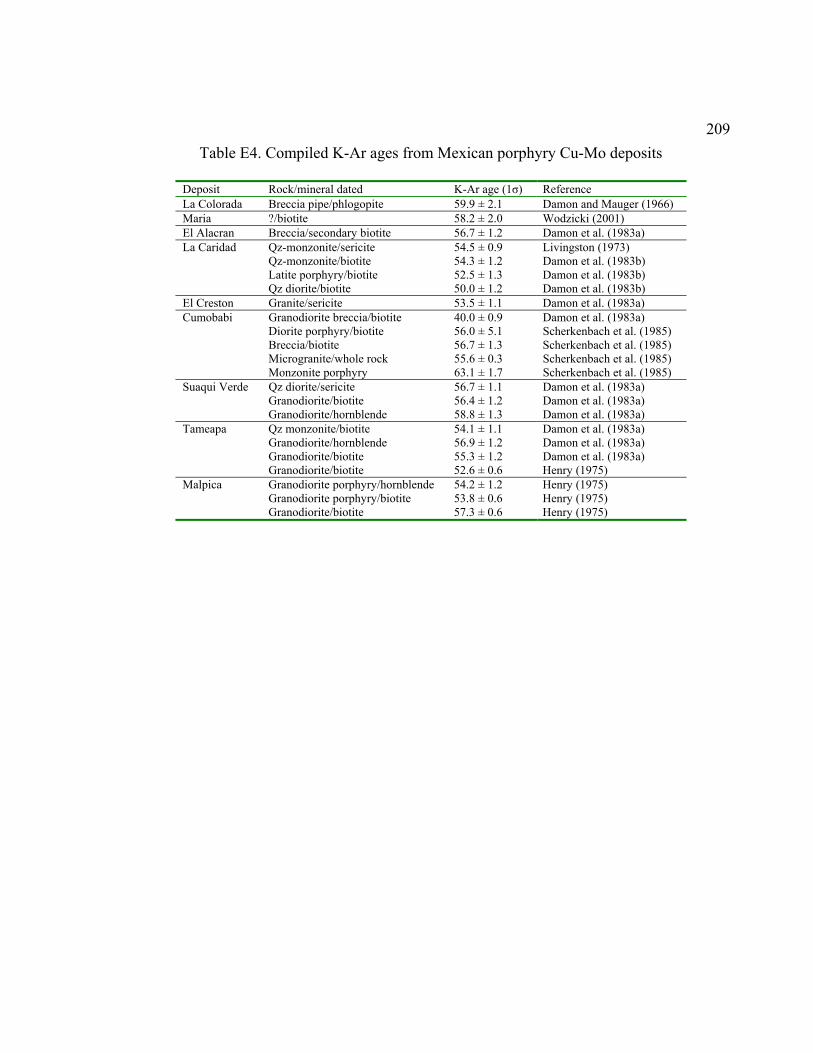
209 Table E4. Compiled K-Ar ages from Mexican porphyry Cu-Mo deposits
Deposit Rock/mineral dated K-Ar age (1σ) Reference La Colorada Breccia pipe/phlogopite 59.9 ± 2.1 Damon and Mauger (1966) Maria ?/biotite 58.2 ± 2.0 Wodzicki (2001) El Alacran Breccia/secondary biotite 56.7 ± 1.2 Damon et al. (1983a) La Caridad Qz-monzonite/sericite 54.5 ± 0.9 Livingston (1973) Qz-monzonite/biotite 54.3 ± 1.2 Damon et al. (1983b) Latite porphyry/biotite 52.5 ± 1.3 Damon et al. (1983b) Qz diorite/biotite 50.0 ± 1.2 Damon et al. (1983b) El Creston Granite/sericite 53.5 ± 1.1 Damon et al. (1983a) Cumobabi Granodiorite breccia/biotite 40.0 ± 0.9 Damon et al. (1983a) Diorite porphyry/biotite 56.0 ± 5.1 Scherkenbach et al. (1985) Breccia/biotite 56.7 ± 1.3 Scherkenbach et al. (1985) Microgranite/whole rock 55.6 ± 0.3 Scherkenbach et al. (1985) Monzonite porphyry 63.1 ± 1.7 Scherkenbach et al. (1985) Suaqui Verde Qz diorite/sericite 56.7 ± 1.1 Damon et al. (1983a) Granodiorite/biotite 56.4 ± 1.2 Damon et al. (1983a) Granodiorite/hornblende 58.8 ± 1.3 Damon et al. (1983a) Tameapa Qz monzonite/biotite 54.1 ± 1.1 Damon et al. (1983a) Granodiorite/hornblende 56.9 ± 1.2 Damon et al. (1983a) Granodiorite/biotite 55.3 ± 1.2 Damon et al. (1983a) Granodiorite/biotite 52.6 ± 0.6 Henry (1975) Malpica Granodiorite porphyry/hornblende 54.2 ± 1.2 Henry (1975) Granodiorite porphyry/biotite 53.8 ± 0.6 Henry (1975) Granodiorite/biotite 57.3 ± 0.6 Henry (1975)

210 Table E5. Compiled Re-Os molybdenite ages for porphyry Cu-Mo deposits of the American Southwest Deposit State Sample name Re-Os age (2σ) Reference Maria Sonora, Mexico 48MARF 56.5 ± 3.2 McCandless and Ruiz (1993) Morenci Arizona, USA 94MOR 54.9 ± 1.8 McCandless and Ruiz (1993) Pima-Mission Arizona, USA 97MIS 57.0 ± 2.8 McCandless and Ruiz (1993) Copper Creek Arizona, USA 60CCAEB 58.0 ± 3.0 McCandless and Ruiz (1993) 1CACC 56.1 ± 1.8 McCandless and Ruiz (1993) CC-1 60.7 ± 0.3 This study Sierrita Arizona, USA 130SIE 55.3 ± 3.6 McCandless and Ruiz (1993) OCO 63.5 ± 0.3 Jensen (1998) 3bb 60.8 ± 0.3 Jensen (1998) 3a 60.7 ± 0.3 Jensen (1998) 3b 60.0 ± 0.3 Jensen (1998) Silverbell Arizona, USA SB-1 63.2 ± 0.3 This study Bagdad Arizona, USA 34BAGI 69.7 ± 0.8 McCandless and Ruiz (1993) BGD-1-1 71.7 ± 0.3 Barra et al. (2003a) BGD-1-2 71.8 ± 0.3 Barra et al. (2003a) BGD-1-3 72.1 ± 0.3 Barra et al. (2003a) BGD-19 71.7 ± 0.3 Barra et al. (2003a) BGD-10-1 75.8 ± 0.3 Barra et al. (2003a) BGD-10-2 75.8 ± 0.3 Barra et al. (2003a) BGD-10-3 76.1 ± 0.3 Barra et al. (2003a) Red Hills Texas, USA 60.2 ± 0.3 Gilmer et al. (2003)

211 Table E6. Relation between number of molybdenite mineralization events, inferred duration of magmatism, and estimated reserves and production Deposit Mineralization Magmatism Reserves +
Production References
Bagdad, Arizona 76 – 72 Ma (2 events)
78 – 76 – 72 Ma ~6 Ma?
~6.2 Mt
Long (1995); Barra et al. (2003)
Sierrita, Arizona 64 – 60 Ma (2 events)
68 – 64 – 60 Ma ~7 – 8 Ma
~6 Mt
Long (1995); Jensen (1998); Herrmann (2001)
Butte, Montana 66.0 – 65.3 – 64.8 Ma (3 events)
66→62 Ma ~3-4 Ma
~35 Mt Dilles et al. (2003, 2004a,b)
Tameapa, Sinaloa 57 – 53 – 50 Ma (3 events)
57 – 53 – 50? Ma ~4 –7 Ma
~0.12 Mt This study; Zurcher, (2002)
La Caridad, Sonora
53.8 Ma (1 event)
57 – 52 Ma ~5 Ma
~8.3 Mt Long (1995); Valencia et al. (in review); E. Espinoza (written comm., 2004).
Los Pelambres, Chile
11.56→10.08 Ma (5 events)
21 – 13.8 – 12.5 – 11.2 Ma ~2 Ma
26.88 Mt *
Bertens et al. (2003); Camus (2003)
El Teniente, Chile 6.3 – 5.6 – 4.8 – 4.4 Ma (4 events)
6.46→5.48, 5.3 – 4.82 Ma ~2 Ma
94.35 Mt
Camus (2003); Maksaev et al. (2004)
* : Includes data from Pachón