Applications of polymer optical fibre grating sensors to
6
Journal of Physics: Conference Series OPEN ACCESS Applications of polymer optical fibre grating sensors to condition monitoring of textiles To cite this article: C C Ye et al 2009 J. Phys.: Conf. Ser. 178 012020 View the article online for updates and enhancements. You may also like Inline selection of transmission or reflection spectra of different fiber Bragg gratings using polarization-diversity loop Jihoon Kim, Hyun Wook Kang, Seung Yun Nam et al. - Fiber Bragg gratings in heterogeneous multicore fiber for directional bending sensing Hailiang Zhang, Zhifang Wu, Perry Ping Shum et al. - Inscription of narrow bandwidth Bragg gratings in polymer optical fibers Carlos A F Marques, Lúcia B Bilro, Nélia J Alberto et al. - This content was downloaded from IP address 219.78.195.169 on 03/02/2022 at 01:15
Transcript of Applications of polymer optical fibre grating sensors to

Journal of Physics Conference Series
OPEN ACCESS
Applications of polymer optical fibre gratingsensors to condition monitoring of textilesTo cite this article C C Ye et al 2009 J Phys Conf Ser 178 012020
View the article online for updates and enhancements
You may also likeInline selection of transmission orreflection spectra of different fiber Bragggratings using polarization-diversity loopJihoon Kim Hyun Wook Kang Seung YunNam et al
-
Fiber Bragg gratings in heterogeneousmulticore fiber for directional bendingsensingHailiang Zhang Zhifang Wu Perry PingShum et al
-
Inscription of narrow bandwidth Bragggratings in polymer optical fibersCarlos A F Marques Luacutecia B Bilro Neacutelia JAlberto et al
-
This content was downloaded from IP address 21978195169 on 03022022 at 0115
Applications of polymer optical fibre grating sensors to condition monitoring of textiles
CCYe1 JMDulieu-Barton2 DJWebb3 CZhang3 G-D Peng4 ARChambers2 FJLennard1 DDEastop1
1 Textile Conservation Centre University of Southampton SO23 8DL UK 2 School of Engineering Sciences University of Southampton SO17 1BJ UK 3 Photonics Research Group Aston University Birmingham B4 7ET UK 4 University of New South Wales Sydney Australia ABSTRACT Fibre Bragg gratings (FBGs) in polymer optical fibres (POFs) have been used to measure the strain in a woven textile FBGs in both POFs and silica optical fibres were attached to a woven textile specimen and their performance characterised It was demonstrated that the POF FBGs provide improved strain transfer coefficients and reduce local structural reinforcement compared to silica FBGs and therefore make a more suitable proposition for textile monitoring Keywords polymer optical fibre fibre Bragg grating strain sensor textile tapestry
1 INTRODUCTION Tapestries are hand-woven textiles that are often large and heavy so that the strain imposed by their own weight may be the key factor in their deterioration[1 2] Previous experimental investigations using standard silica FBGs have shown that they were an attractive prospect for monitoring the deformations that occur in tapestries[2] However it has been shown[3] that silica optical fibres did not produce an effective strain transfer and that the reinforcement introduced by the sensor attachment was significant[3] The purpose of this paper is to demonstrate that POFs provide an improved performance over silica fibres in applications to textiles This work also represents what is to the authorsrsquo knowledge the first application of POF FBG technology away from the optical bench The implementation of FBGs in single mode POFs has advanced dramatically[4] The majority of POFs are based on polymethylmethacrylate (PMMA) which has been shown to be photosensitive Such POF-based FBGs offer significant advantages over silica-based devices for application to tapestries and textiles as POFs can withstand and measure much higher strains than those possible with a silica fibre In particular the Youngrsquos modulus of PMMA POF is approximately 25 times smaller than that of a silica fibre[5] which is more compatible with the modulus of the textile In this paper studies on single mode POF-based FBGs attached to a woven wool textile specimen are described The step-index single-mode POF FBGs were photoinscribed using a 325nm HeCd laser at Aston University in fibre fabricated at UNSW Sydney POF and silica-based FBGs were attached to a woven textile specimen with different adhesives and their performance characteristics determined under quasi-static loading The performance of the FBGadhesive installations are characterised in terms of strain transfer and reinforcement To provide an independent measure of strain in a non-contact fashion a digital image correlation (DIC) system[6] was used to obtain full-field data 2 TEXTILE SPECIMEN AND EXPERIMENTAL DETAILS The textile specimen was 49 mm wide 057 mm thick and 340 mm long Both the warp and weft yarns on the textile are wool with a spacing of 08 mm in the warp direction and 17 mm in the weft direction Four FBGs
Sensors amp their Applications XV IOP PublishingJournal of Physics Conference Series 178 (2009) 012020 doi1010881742-65961781012020
ccopy 2009 IOP Publishing Ltd 1
were bonded to the central part of the specimen with the axis of each FBG parallel to the weft yarns The centres of the four FBGs are respectively on the corners of a rectangle which is 16x50 mm The specimen is loaded in the weft direction as this is how tapestries are hung The Bragg wavelengths of the two POF-based FBGs POF-FBG-1 and POF-FBG-2 were 1562 and 1565 nm respectively For the silica FBGs Si-FBG-3 and Si-FBG-4 the Bragg wavelengths were 1542 and 1547 nm respectively POF-FBG-1 and Si-FBG-3 were bonded to the textile surface with two part epoxy Araldite 2015 whilst POF-FBG-2 and Si-FBG-4 were with the PVA based conservation adhesives Mowilith DMC2 For each FBG the area covered with adhesive was 3 mm wide and up to 50 mm long The thickness of adhesive was up to 04 mm Since the attenuation in the POF at a wavelength of 1560 nm is high each POF FBG was written in a short length of POF(~5 cm) with a single mode silica fibre connected to one end using an optical adhesive This arrangement allowed sufficient definition for the measurement The mechanical strength of the connection between the POF and the silica fibre is low as the section of silica fibre near the connection has the coating stripped and is brittle To accommodate a stable mounting of the sensor to the textile the fibre connection and the section of silica fibre with coating stripped as well as a short length of silica fibre with coating was bonded to the textile The penalty for doing this is that the area with adhesive is comparatively long (~50 mm) Furthermore the maximum strain applied to the specimen is limited by the weak fibre connection These problems would not exist if the Bragg wavelengths of the POF FBGs were shorter for example the attenuation at 800nm is approximately 100 times less than at 1550nm[7] The specimen was mounted in an Instron 5569 test machine in wedge grips the distance between the grips was 240 mm For quasi static tests a constant displacement of 10 mmminute was applied to the specimen The deviation of the load was typically plusmn07 N The Bragg wavelengths of the FBGs were recorded using a Swept Laser Interrogator (FBG-SLI) by Micron Optics The resolution of measured wavelength is 1 pm corresponding approximately to 1 microε The wavelength range of FBG-SLI is from 1520 to 1570 nm During the tests a LaVision DIC system[8] with a single camera was used to monitor the strain over the entire specimen Data were collected from the side of the specimen without adhesives to maximise the strain accuracy of DIC by eliminating any possible effects of adhesives on the image correlation processing Tthe size of the interrogation window was chosen to be 32 x 32 pixels corresponding to 3 x 3 mm in the specimen For the area away from the FBGs and adhesive the uncertainty of the measured strain from DIC is reduced by averaging over a number of interogation windows and is estimated to be 006 For the area with a FBG bonded the strain from DIC is a lsquovirtual extensometerrsquo measurement[8] taken by correlating the interrogation cells at either end of the 20 mm line overlapped the FBG The uncertainty for the measured strain is estimated to be 02 x 2214 = 019 3 QUASI STATIC TESTS In the first test a maximum load of 22 N was applied to the specimen to provide the strain map shown in Figure 3 The strain values in the two areas covered by Araldite (POF-FBG-1 and Si-FBG-3) are significantly lower than the rest of the sample The strain in the area where a silica fibre Si-FBG-3 was bonded with DMC2 is also lower than the surrounding areas while the strain in the area of the POF-FBG-2 bonded with DMC2 is closer to that of the background material
Sensors amp their Applications XV IOP PublishingJournal of Physics Conference Series 178 (2009) 012020 doi1010881742-65961781012020
2
In Figure 4 the recorded stress is plotted against the strains from the different FBGs and from DIC for different locations The stress is the total load divided by the area of cross section of the textile specimen The strains from FBGs were obtained using the measured strain sensitivity of 133 pmmicroε for POF FBGs and 120 pmmicroε for silica fibre FBGs For POF-FBG-2 it was not possible to record strain data when the stress was greater than 04 MPa since the maximum wavelength of the interrogation system was exceeded The strain from the POF FBG is greater than that from the silica FBG with the same adhesive The recorded strain from each type of FBGs with DMC2 is greater than that with Araldite 2015 The strains from the two POF FBGs match the corresponding strains from DIC although the one bonded using the epoxy adhesive shows much more scatter The strains from DIC for the areas where the two silica FBGs were bonded are noisy and even became negative when the load was small indicating the unreliability of the DIC data in this area This shows that the strain resolution of the DIC system is not enough to measure accurately strains smaller than 02 [3] The second quasi-static test was done with a maximum load of 11 N The stress-strain curves for the four
Figure 5 Stress plotted against strains from FBGs for 11 N quasi-static test (solid blue markers and lines) and 22 N quasi-static test (open red markers and lines)
0
02
04
06
08
0 01 02 03
Stre
ss (M
Pa)
Strain ()
11N POF-FBG-111N POF-FBG-211N si-FBG-311N si-FBG-422N POF-FBG-122N POF-FBG-222N si-FBG-322N si-FBG-4
Figure 3 The strain map obtained from DIC Load applied to the specimen 20 N
Figure 4 Stress plotted against strains from FBGs and from DIC for different locations
POF-FBG-2 C2
Si-FBG-3Araldite
Si-FBG-4DMC2
POF-FBG-1 Araldite
DMPOF-FBG-2
C2
Si-FBG-3Araldite
Si-FBG-4DMC2
POF-FBG-1 Araldite
0
02
04
06
08
0 04 08 12
Stre
ss (M
Pa)
Strain ()
POF FBG-1POF-FBG2Si-FBG-3Si-FBG-4DIC textileDIC POF-FBG-1DIC POF-FBG-2DIC si-FBG-3DIC si-FBG-4
DM
Sensors amp their Applications XV IOP PublishingJournal of Physics Conference Series 178 (2009) 012020 doi1010881742-65961781012020
3
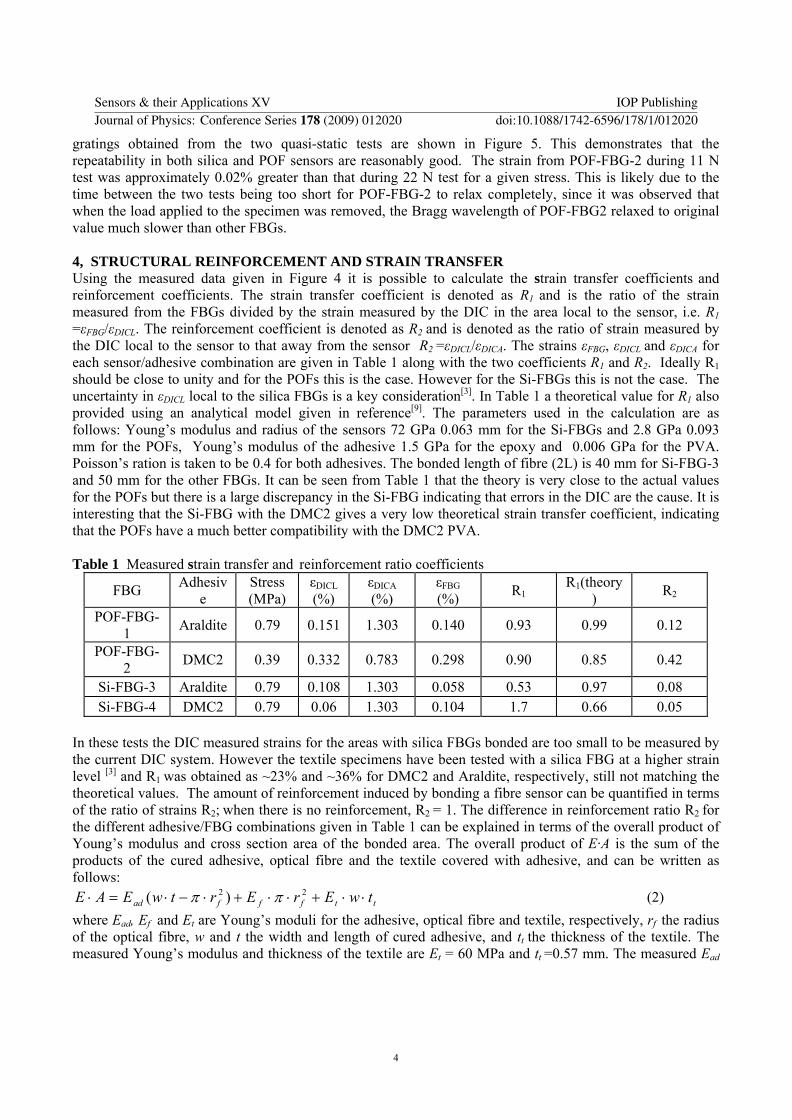
gratings obtained from the two quasi-static tests are shown in Figure 5 This demonstrates that the repeatability in both silica and POF sensors are reasonably good The strain from POF-FBG-2 during 11 N test was approximately 002 greater than that during 22 N test for a given stress This is likely due to the time between the two tests being too short for POF-FBG-2 to relax completely since it was observed that when the load applied to the specimen was removed the Bragg wavelength of POF-FBG2 relaxed to original value much slower than other FBGs
4 STRUCTURAL REINFORCEMENT AND STRAIN TRANSFER Using the measured data given in Figure 4 it is possible to calculate the strain transfer coefficients and reinforcement coefficients The strain transfer coefficient is denoted as R1 and is the ratio of the strain measured from the FBGs divided by the strain measured by the DIC in the area local to the sensor ie R1 =εFBGεDICL The reinforcement coefficient is denoted as R2 and is denoted as the ratio of strain measured by the DIC local to the sensor to that away from the sensor R2 =εDICLεDICA The strains εFBG εDICL and εDICA for each sensoradhesive combination are given in Table 1 along with the two coefficients R1 and R2 Ideally R1 should be close to unity and for the POFs this is the case However for the Si-FBGs this is not the case The uncertainty in εDICL local to the silica FBGs is a key consideration[3] In Table 1 a theoretical value for R1 also provided using an analytical model given in reference[9] The parameters used in the calculation are as follows Youngrsquos modulus and radius of the sensors 72 GPa 0063 mm for the Si-FBGs and 28 GPa 0093 mm for the POFs Youngrsquos modulus of the adhesive 15 GPa for the epoxy and 0006 GPa for the PVA Poissonrsquos ration is taken to be 04 for both adhesives The bonded length of fibre (2L) is 40 mm for Si-FBG-3 and 50 mm for the other FBGs It can be seen from Table 1 that the theory is very close to the actual values for the POFs but there is a large discrepancy in the Si-FBG indicating that errors in the DIC are the cause It is interesting that the Si-FBG with the DMC2 gives a very low theoretical strain transfer coefficient indicating that the POFs have a much better compatibility with the DMC2 PVA Table 1 Measured strain transfer and reinforcement ratio coefficients
FBG Adhesive
Stress (MPa)
εDICL ()
εDICA ()
εFBG () R1
R1(theory) R2
POF-FBG-1 Araldite 079 0151 1303 0140 093 099 012
POF-FBG-2 DMC2 039 0332 0783 0298 090 085 042
Si-FBG-3 Araldite 079 0108 1303 0058 053 097 008 Si-FBG-4 DMC2 079 006 1303 0104 17 066 005
In these tests the DIC measured strains for the areas with silica FBGs bonded are too small to be measured by the current DIC system However the textile specimens have been tested with a silica FBG at a higher strain level [3] and R1 was obtained as ~23 and ~36 for DMC2 and Araldite respectively still not matching the theoretical values The amount of reinforcement induced by bonding a fibre sensor can be quantified in terms of the ratio of strains R2 when there is no reinforcement R2 = 1 The difference in reinforcement ratio R2 for the different adhesiveFBG combinations given in Table 1 can be explained in terms of the overall product of Youngrsquos modulus and cross section area of the bonded area The overall product of EmiddotA is the sum of the products of the cured adhesive optical fibre and the textile covered with adhesive and can be written as follows
ttfffad twErErtwEAE sdotsdot+sdotsdot+sdotminussdot=sdot 22 )( ππ (2)
where Ead Ef and Et are Youngrsquos moduli for the adhesive optical fibre and textile respectively rf the radius of the optical fibre w and t the width and length of cured adhesive and tt the thickness of the textile The measured Youngrsquos modulus and thickness of the textile are Et = 60 MPa and tt =057 mm The measured Ead
Sensors amp their Applications XV IOP PublishingJournal of Physics Conference Series 178 (2009) 012020 doi1010881742-65961781012020
4
values and the EmiddotA values for the two POF fibres as well as three specimens tested previously [3] are given in Table 2 The EmiddotA value for the specimen with Araldite is approximately 3 times greater than those with conservation adhesives which is consistent with the difference in ratio R2 For the two POF FBGs the EmiddotA value for the specimen with Araldite is more than 10 times greater than those with conservation adhesives This provides an adequate explanation for the reinforcement Table 2 EmiddotA values for different specimens
Specimens Ead (GPA) W (mm) t (mm) EmiddotA (GPa middotmm2) Si-FBG-Araldite 15 32 04 292 Si-FBG-DMC2 0006 31 03 102 Si-FBG-Vinamul 0002 32 03 102 POF-FBG-1 (Araldite) 15 3 040 194 POF-FBG-2 (DMC2) 0006 3 022 018
5 CONCLUSIONS Both POF-based and silica-based FBGs have been used to measured strain in a woven textile specimen It has been demonstrated that the POFs provide a favourable strain transfer coefficient and that the POFs bonded with PVA offer less structural reinforcement Further investigation on the feasibility of POF FBGs for tapestrytextile applications is required including the creep behaviours of the POF FBGs and the effects of temperature and humidity 6 ACKNOWLEDGEMENTS The support of the EU (FP7 Project PHOSFOS) the UK Engineering and Physical Sciences Research Council and the UK Arts and Humanities Research Council is gratefully acknowledged
REFERENCES 1 Dulieu-Barton JM Sahin M Lennard FJ Eastop DE and Chambers AR ldquoAssessing the feasibility of monitoring the
condition of historic tapestries using engineering techniquesrdquo Key Engineering Materials 347 pp187-192 2007 2 Dulieu-Barton JM Ye CC Chambers AR Lennard FJ and Eastop DE ldquoOptical fibre sensors for monitoring damage in
historic tapestriesrdquo SEM XI International Congress on Experimental and Applied Mechanics 2008 Orlando Florida 3 Ye CC Dulieu-Barton JM Chambers AR Lennard FJ Eastop D D ldquoCondition monitoring of textiles using optical
techniquesrdquo to be presented in DAMASrsquo2009 (Beijing China 2009) 4 Webb DJ Kalli K Carroll K Zhang C Komodromos M Argyros A Large M Emiliyanov G Bang O Kjaer E ldquoSingle-
mode polymer optical fiber sensors for high-strain applicationsrdquo Proceedings of SPIE Advanced Sensor Systems and Applications III 6830 art no 700467 2007
5 Silva-Lopez M Fender A MacPherson W N Barton J S Jones J D C Zhao D Dobb H Webb D J Zhang L Bennion I ldquoStrain and temperature sensitivity of a single-mode polymer optical fiberrdquo Optics Letters 30 (23) pp3129-3131 2005
6 Chu TC Rason WF Sutton MA and Peters WH ldquoApplications of digital image correlation techniques to experimental mechanicsrdquo Experimental Mechanics 25 232-244 1985
7 httpwwwparadigmopticscompofpoffaqshtml [Accessed 200942] 8 LaVision DIC Product-Manual StrainMaster 3D - Getting Started 9 Li D Li H Ren L Song G ldquoStrain transferring analysis of fiber Bragg grating sensorsrdquo Optical Engineering 45(2) 024402-1-
8 2006
Sensors amp their Applications XV IOP PublishingJournal of Physics Conference Series 178 (2009) 012020 doi1010881742-65961781012020
5

Applications of polymer optical fibre grating sensors to condition monitoring of textiles
CCYe1 JMDulieu-Barton2 DJWebb3 CZhang3 G-D Peng4 ARChambers2 FJLennard1 DDEastop1
1 Textile Conservation Centre University of Southampton SO23 8DL UK 2 School of Engineering Sciences University of Southampton SO17 1BJ UK 3 Photonics Research Group Aston University Birmingham B4 7ET UK 4 University of New South Wales Sydney Australia ABSTRACT Fibre Bragg gratings (FBGs) in polymer optical fibres (POFs) have been used to measure the strain in a woven textile FBGs in both POFs and silica optical fibres were attached to a woven textile specimen and their performance characterised It was demonstrated that the POF FBGs provide improved strain transfer coefficients and reduce local structural reinforcement compared to silica FBGs and therefore make a more suitable proposition for textile monitoring Keywords polymer optical fibre fibre Bragg grating strain sensor textile tapestry
1 INTRODUCTION Tapestries are hand-woven textiles that are often large and heavy so that the strain imposed by their own weight may be the key factor in their deterioration[1 2] Previous experimental investigations using standard silica FBGs have shown that they were an attractive prospect for monitoring the deformations that occur in tapestries[2] However it has been shown[3] that silica optical fibres did not produce an effective strain transfer and that the reinforcement introduced by the sensor attachment was significant[3] The purpose of this paper is to demonstrate that POFs provide an improved performance over silica fibres in applications to textiles This work also represents what is to the authorsrsquo knowledge the first application of POF FBG technology away from the optical bench The implementation of FBGs in single mode POFs has advanced dramatically[4] The majority of POFs are based on polymethylmethacrylate (PMMA) which has been shown to be photosensitive Such POF-based FBGs offer significant advantages over silica-based devices for application to tapestries and textiles as POFs can withstand and measure much higher strains than those possible with a silica fibre In particular the Youngrsquos modulus of PMMA POF is approximately 25 times smaller than that of a silica fibre[5] which is more compatible with the modulus of the textile In this paper studies on single mode POF-based FBGs attached to a woven wool textile specimen are described The step-index single-mode POF FBGs were photoinscribed using a 325nm HeCd laser at Aston University in fibre fabricated at UNSW Sydney POF and silica-based FBGs were attached to a woven textile specimen with different adhesives and their performance characteristics determined under quasi-static loading The performance of the FBGadhesive installations are characterised in terms of strain transfer and reinforcement To provide an independent measure of strain in a non-contact fashion a digital image correlation (DIC) system[6] was used to obtain full-field data 2 TEXTILE SPECIMEN AND EXPERIMENTAL DETAILS The textile specimen was 49 mm wide 057 mm thick and 340 mm long Both the warp and weft yarns on the textile are wool with a spacing of 08 mm in the warp direction and 17 mm in the weft direction Four FBGs
Sensors amp their Applications XV IOP PublishingJournal of Physics Conference Series 178 (2009) 012020 doi1010881742-65961781012020
ccopy 2009 IOP Publishing Ltd 1
were bonded to the central part of the specimen with the axis of each FBG parallel to the weft yarns The centres of the four FBGs are respectively on the corners of a rectangle which is 16x50 mm The specimen is loaded in the weft direction as this is how tapestries are hung The Bragg wavelengths of the two POF-based FBGs POF-FBG-1 and POF-FBG-2 were 1562 and 1565 nm respectively For the silica FBGs Si-FBG-3 and Si-FBG-4 the Bragg wavelengths were 1542 and 1547 nm respectively POF-FBG-1 and Si-FBG-3 were bonded to the textile surface with two part epoxy Araldite 2015 whilst POF-FBG-2 and Si-FBG-4 were with the PVA based conservation adhesives Mowilith DMC2 For each FBG the area covered with adhesive was 3 mm wide and up to 50 mm long The thickness of adhesive was up to 04 mm Since the attenuation in the POF at a wavelength of 1560 nm is high each POF FBG was written in a short length of POF(~5 cm) with a single mode silica fibre connected to one end using an optical adhesive This arrangement allowed sufficient definition for the measurement The mechanical strength of the connection between the POF and the silica fibre is low as the section of silica fibre near the connection has the coating stripped and is brittle To accommodate a stable mounting of the sensor to the textile the fibre connection and the section of silica fibre with coating stripped as well as a short length of silica fibre with coating was bonded to the textile The penalty for doing this is that the area with adhesive is comparatively long (~50 mm) Furthermore the maximum strain applied to the specimen is limited by the weak fibre connection These problems would not exist if the Bragg wavelengths of the POF FBGs were shorter for example the attenuation at 800nm is approximately 100 times less than at 1550nm[7] The specimen was mounted in an Instron 5569 test machine in wedge grips the distance between the grips was 240 mm For quasi static tests a constant displacement of 10 mmminute was applied to the specimen The deviation of the load was typically plusmn07 N The Bragg wavelengths of the FBGs were recorded using a Swept Laser Interrogator (FBG-SLI) by Micron Optics The resolution of measured wavelength is 1 pm corresponding approximately to 1 microε The wavelength range of FBG-SLI is from 1520 to 1570 nm During the tests a LaVision DIC system[8] with a single camera was used to monitor the strain over the entire specimen Data were collected from the side of the specimen without adhesives to maximise the strain accuracy of DIC by eliminating any possible effects of adhesives on the image correlation processing Tthe size of the interrogation window was chosen to be 32 x 32 pixels corresponding to 3 x 3 mm in the specimen For the area away from the FBGs and adhesive the uncertainty of the measured strain from DIC is reduced by averaging over a number of interogation windows and is estimated to be 006 For the area with a FBG bonded the strain from DIC is a lsquovirtual extensometerrsquo measurement[8] taken by correlating the interrogation cells at either end of the 20 mm line overlapped the FBG The uncertainty for the measured strain is estimated to be 02 x 2214 = 019 3 QUASI STATIC TESTS In the first test a maximum load of 22 N was applied to the specimen to provide the strain map shown in Figure 3 The strain values in the two areas covered by Araldite (POF-FBG-1 and Si-FBG-3) are significantly lower than the rest of the sample The strain in the area where a silica fibre Si-FBG-3 was bonded with DMC2 is also lower than the surrounding areas while the strain in the area of the POF-FBG-2 bonded with DMC2 is closer to that of the background material
Sensors amp their Applications XV IOP PublishingJournal of Physics Conference Series 178 (2009) 012020 doi1010881742-65961781012020
2
In Figure 4 the recorded stress is plotted against the strains from the different FBGs and from DIC for different locations The stress is the total load divided by the area of cross section of the textile specimen The strains from FBGs were obtained using the measured strain sensitivity of 133 pmmicroε for POF FBGs and 120 pmmicroε for silica fibre FBGs For POF-FBG-2 it was not possible to record strain data when the stress was greater than 04 MPa since the maximum wavelength of the interrogation system was exceeded The strain from the POF FBG is greater than that from the silica FBG with the same adhesive The recorded strain from each type of FBGs with DMC2 is greater than that with Araldite 2015 The strains from the two POF FBGs match the corresponding strains from DIC although the one bonded using the epoxy adhesive shows much more scatter The strains from DIC for the areas where the two silica FBGs were bonded are noisy and even became negative when the load was small indicating the unreliability of the DIC data in this area This shows that the strain resolution of the DIC system is not enough to measure accurately strains smaller than 02 [3] The second quasi-static test was done with a maximum load of 11 N The stress-strain curves for the four
Figure 5 Stress plotted against strains from FBGs for 11 N quasi-static test (solid blue markers and lines) and 22 N quasi-static test (open red markers and lines)
0
02
04
06
08
0 01 02 03
Stre
ss (M
Pa)
Strain ()
11N POF-FBG-111N POF-FBG-211N si-FBG-311N si-FBG-422N POF-FBG-122N POF-FBG-222N si-FBG-322N si-FBG-4
Figure 3 The strain map obtained from DIC Load applied to the specimen 20 N
Figure 4 Stress plotted against strains from FBGs and from DIC for different locations
POF-FBG-2 C2
Si-FBG-3Araldite
Si-FBG-4DMC2
POF-FBG-1 Araldite
DMPOF-FBG-2
C2
Si-FBG-3Araldite
Si-FBG-4DMC2
POF-FBG-1 Araldite
0
02
04
06
08
0 04 08 12
Stre
ss (M
Pa)
Strain ()
POF FBG-1POF-FBG2Si-FBG-3Si-FBG-4DIC textileDIC POF-FBG-1DIC POF-FBG-2DIC si-FBG-3DIC si-FBG-4
DM
Sensors amp their Applications XV IOP PublishingJournal of Physics Conference Series 178 (2009) 012020 doi1010881742-65961781012020
3
gratings obtained from the two quasi-static tests are shown in Figure 5 This demonstrates that the repeatability in both silica and POF sensors are reasonably good The strain from POF-FBG-2 during 11 N test was approximately 002 greater than that during 22 N test for a given stress This is likely due to the time between the two tests being too short for POF-FBG-2 to relax completely since it was observed that when the load applied to the specimen was removed the Bragg wavelength of POF-FBG2 relaxed to original value much slower than other FBGs
4 STRUCTURAL REINFORCEMENT AND STRAIN TRANSFER Using the measured data given in Figure 4 it is possible to calculate the strain transfer coefficients and reinforcement coefficients The strain transfer coefficient is denoted as R1 and is the ratio of the strain measured from the FBGs divided by the strain measured by the DIC in the area local to the sensor ie R1 =εFBGεDICL The reinforcement coefficient is denoted as R2 and is denoted as the ratio of strain measured by the DIC local to the sensor to that away from the sensor R2 =εDICLεDICA The strains εFBG εDICL and εDICA for each sensoradhesive combination are given in Table 1 along with the two coefficients R1 and R2 Ideally R1 should be close to unity and for the POFs this is the case However for the Si-FBGs this is not the case The uncertainty in εDICL local to the silica FBGs is a key consideration[3] In Table 1 a theoretical value for R1 also provided using an analytical model given in reference[9] The parameters used in the calculation are as follows Youngrsquos modulus and radius of the sensors 72 GPa 0063 mm for the Si-FBGs and 28 GPa 0093 mm for the POFs Youngrsquos modulus of the adhesive 15 GPa for the epoxy and 0006 GPa for the PVA Poissonrsquos ration is taken to be 04 for both adhesives The bonded length of fibre (2L) is 40 mm for Si-FBG-3 and 50 mm for the other FBGs It can be seen from Table 1 that the theory is very close to the actual values for the POFs but there is a large discrepancy in the Si-FBG indicating that errors in the DIC are the cause It is interesting that the Si-FBG with the DMC2 gives a very low theoretical strain transfer coefficient indicating that the POFs have a much better compatibility with the DMC2 PVA Table 1 Measured strain transfer and reinforcement ratio coefficients
FBG Adhesive
Stress (MPa)
εDICL ()
εDICA ()
εFBG () R1
R1(theory) R2
POF-FBG-1 Araldite 079 0151 1303 0140 093 099 012
POF-FBG-2 DMC2 039 0332 0783 0298 090 085 042
Si-FBG-3 Araldite 079 0108 1303 0058 053 097 008 Si-FBG-4 DMC2 079 006 1303 0104 17 066 005
In these tests the DIC measured strains for the areas with silica FBGs bonded are too small to be measured by the current DIC system However the textile specimens have been tested with a silica FBG at a higher strain level [3] and R1 was obtained as ~23 and ~36 for DMC2 and Araldite respectively still not matching the theoretical values The amount of reinforcement induced by bonding a fibre sensor can be quantified in terms of the ratio of strains R2 when there is no reinforcement R2 = 1 The difference in reinforcement ratio R2 for the different adhesiveFBG combinations given in Table 1 can be explained in terms of the overall product of Youngrsquos modulus and cross section area of the bonded area The overall product of EmiddotA is the sum of the products of the cured adhesive optical fibre and the textile covered with adhesive and can be written as follows
ttfffad twErErtwEAE sdotsdot+sdotsdot+sdotminussdot=sdot 22 )( ππ (2)
where Ead Ef and Et are Youngrsquos moduli for the adhesive optical fibre and textile respectively rf the radius of the optical fibre w and t the width and length of cured adhesive and tt the thickness of the textile The measured Youngrsquos modulus and thickness of the textile are Et = 60 MPa and tt =057 mm The measured Ead
Sensors amp their Applications XV IOP PublishingJournal of Physics Conference Series 178 (2009) 012020 doi1010881742-65961781012020
4
values and the EmiddotA values for the two POF fibres as well as three specimens tested previously [3] are given in Table 2 The EmiddotA value for the specimen with Araldite is approximately 3 times greater than those with conservation adhesives which is consistent with the difference in ratio R2 For the two POF FBGs the EmiddotA value for the specimen with Araldite is more than 10 times greater than those with conservation adhesives This provides an adequate explanation for the reinforcement Table 2 EmiddotA values for different specimens
Specimens Ead (GPA) W (mm) t (mm) EmiddotA (GPa middotmm2) Si-FBG-Araldite 15 32 04 292 Si-FBG-DMC2 0006 31 03 102 Si-FBG-Vinamul 0002 32 03 102 POF-FBG-1 (Araldite) 15 3 040 194 POF-FBG-2 (DMC2) 0006 3 022 018
5 CONCLUSIONS Both POF-based and silica-based FBGs have been used to measured strain in a woven textile specimen It has been demonstrated that the POFs provide a favourable strain transfer coefficient and that the POFs bonded with PVA offer less structural reinforcement Further investigation on the feasibility of POF FBGs for tapestrytextile applications is required including the creep behaviours of the POF FBGs and the effects of temperature and humidity 6 ACKNOWLEDGEMENTS The support of the EU (FP7 Project PHOSFOS) the UK Engineering and Physical Sciences Research Council and the UK Arts and Humanities Research Council is gratefully acknowledged
REFERENCES 1 Dulieu-Barton JM Sahin M Lennard FJ Eastop DE and Chambers AR ldquoAssessing the feasibility of monitoring the
condition of historic tapestries using engineering techniquesrdquo Key Engineering Materials 347 pp187-192 2007 2 Dulieu-Barton JM Ye CC Chambers AR Lennard FJ and Eastop DE ldquoOptical fibre sensors for monitoring damage in
historic tapestriesrdquo SEM XI International Congress on Experimental and Applied Mechanics 2008 Orlando Florida 3 Ye CC Dulieu-Barton JM Chambers AR Lennard FJ Eastop D D ldquoCondition monitoring of textiles using optical
techniquesrdquo to be presented in DAMASrsquo2009 (Beijing China 2009) 4 Webb DJ Kalli K Carroll K Zhang C Komodromos M Argyros A Large M Emiliyanov G Bang O Kjaer E ldquoSingle-
mode polymer optical fiber sensors for high-strain applicationsrdquo Proceedings of SPIE Advanced Sensor Systems and Applications III 6830 art no 700467 2007
5 Silva-Lopez M Fender A MacPherson W N Barton J S Jones J D C Zhao D Dobb H Webb D J Zhang L Bennion I ldquoStrain and temperature sensitivity of a single-mode polymer optical fiberrdquo Optics Letters 30 (23) pp3129-3131 2005
6 Chu TC Rason WF Sutton MA and Peters WH ldquoApplications of digital image correlation techniques to experimental mechanicsrdquo Experimental Mechanics 25 232-244 1985
7 httpwwwparadigmopticscompofpoffaqshtml [Accessed 200942] 8 LaVision DIC Product-Manual StrainMaster 3D - Getting Started 9 Li D Li H Ren L Song G ldquoStrain transferring analysis of fiber Bragg grating sensorsrdquo Optical Engineering 45(2) 024402-1-
8 2006
Sensors amp their Applications XV IOP PublishingJournal of Physics Conference Series 178 (2009) 012020 doi1010881742-65961781012020
5