
Applications of Data Mining to Diagnosis and Control of Manufacturing...
21
10 Applications of Data Mining to Diagnosis and Control of Manufacturing Processes Marcin Perzyk, Robert Biernacki, Andrzej Kochanski, Jacek Kozlowski and Artur Soroczynski Warsaw University of Technology Poland 1. Introduction In the majority of manufacturing companies large amounts of data are collected and stored, related to designs, products, equipment, materials, manufacturing processes etc. Utilization of that data for the improvement of product quality and lowering manufacturing costs requires extraction of knowledge from the data, in the form of conclusions, rules, relationships and procedures. Consequently, a rapidly growing interest in DM applications in manufacturing organizations, including the development of complex DM systems, can be observed in recent years (Chen et al. 2004; Chen et al. 2005; Dagli & Lee, 2001; Hur et al., 2006; Malh & Krikler, 2007; Tsang et al., 2007). A comprehensive and insightful characterization of the problems in manufacturing enterprises, as well as the potential benefits from the application of data mining (DM) in this area was presented in (Shahbaz et al., 2006). Examples and general characteristics of problems related to the usage of data mining techniques and systems in a manufacturing environment can be found in several review papers (Harding et al., 2006; Kusiak, 2006; Wang, 2007). Application of DM techniques can bring valuable information, both for designing new processes and for control of currently running ones. Designing the processes and tooling can be assisted by varied computer tools, including simulation software, expert systems based on knowledge acquired from human experts, as well as the knowledge extracted semi automatically by DM methods. The proper choice of the manufacturing process version and its parameters allows to reduce the number of necessary corrections resulting from simulation and/or floor tests. The knowledge obtained by DM methods can significantly contribute to the right decision making and optimum settings of the process parameters. In the design phase two main forms of knowledge may be particularly useful: the decision logic rules in the form: ‘IF (conditions) THEN (decision class)’ and the regression–type relationships. Although the latter have been widely utilized before the emergence of DM methods (e.g. in the form of empirical formulas) and the rules created by the human experts were also in use, the computational intelligence (CI) methods (learning systems) have remarkably enhanced possibilities of the knowledge extraction and its quality. For the manufacturing process control many varied methods are used, ranging from paper Statistical Process Control (SPC) charts to automated closed loop systems. In spite of the www.intechopen.com
Transcript of Applications of Data Mining to Diagnosis and Control of Manufacturing...

10
Applications of Data Mining to Diagnosis and Control of Manufacturing Processes
Marcin Perzyk, Robert Biernacki, Andrzej Kochanski, Jacek Kozlowski and Artur Soroczynski
Warsaw University of Technology Poland
1. Introduction
In the majority of manufacturing companies large amounts of data are collected and stored,
related to designs, products, equipment, materials, manufacturing processes etc. Utilization
of that data for the improvement of product quality and lowering manufacturing costs
requires extraction of knowledge from the data, in the form of conclusions, rules,
relationships and procedures. Consequently, a rapidly growing interest in DM applications
in manufacturing organizations, including the development of complex DM systems, can be
observed in recent years (Chen et al. 2004; Chen et al. 2005; Dagli & Lee, 2001; Hur et al.,
2006; Malh & Krikler, 2007; Tsang et al., 2007). A comprehensive and insightful
characterization of the problems in manufacturing enterprises, as well as the potential
benefits from the application of data mining (DM) in this area was presented in (Shahbaz et
al., 2006). Examples and general characteristics of problems related to the usage of data
mining techniques and systems in a manufacturing environment can be found in several
review papers (Harding et al., 2006; Kusiak, 2006; Wang, 2007).
Application of DM techniques can bring valuable information, both for designing new
processes and for control of currently running ones. Designing the processes and tooling can
be assisted by varied computer tools, including simulation software, expert systems based
on knowledge acquired from human experts, as well as the knowledge extracted semi
automatically by DM methods. The proper choice of the manufacturing process version and
its parameters allows to reduce the number of necessary corrections resulting from
simulation and/or floor tests. The knowledge obtained by DM methods can significantly
contribute to the right decision making and optimum settings of the process parameters. In
the design phase two main forms of knowledge may be particularly useful: the decision
logic rules in the form: ‘IF (conditions) THEN (decision class)’ and the regression–type
relationships. Although the latter have been widely utilized before the emergence of DM
methods (e.g. in the form of empirical formulas) and the rules created by the human experts
were also in use, the computational intelligence (CI) methods (learning systems) have
remarkably enhanced possibilities of the knowledge extraction and its quality.
For the manufacturing process control many varied methods are used, ranging from paper
Statistical Process Control (SPC) charts to automated closed loop systems. In spite of the
www.intechopen.com

Knowledge-Oriented Applications in Data Mining
148
degree of automation of the control system it is always essential to identify the input process
parameters that can be effectively used to control the process, to develop the appropriate
relationships between process parameters as inputs and process results as outputs, as well
as to understand and diagnose manufacturing process problems. Just like in the design
stage, the input-output dependencies can be of various types, including classification and
regression models. A more specific task is prediction of process parameters or product
characteristics on the basis of current and past values recorded as a sequence type data, i.e.
the time–series analysis.
It should be noticed that for diagnosis and control of manufacturing processes a particular
type of information is extremely important: relative significances of process variables,
including possible interactions existing among them. In particular, determination of the
most significant process parameters can help to detect root causes of deteriorating product
quality. The idea is that the process variables which are found to be the most significant for
a given quality parameter, e.g. percent of defective parts, should be regarded as potential
causes of the quality decline. It is important to point out that statistical methods which have
been used extensively in manufacturing industry for many years, such as the SPC tools, are
not capable of providing that kind of knowledge. They are useful in detecting the
appearance of abnormalities of the process in the form of excessive variations of process
parameters, but they are not capable of indicating their causes. Finding the most important
process parameters can also be useful in prediction of break-downs of machines, equipment
etc., as well as in prediction of results of manufacturing process changes, including
indication of optimal or critical process parameters that can be used for the process control.
Also, finding the least significant process variables can be valuable. Variations of such
variables can be allowed without consequences in product quality, which can lead to
remarkable savings due to reduction of time and costs of the inspections.
DM includes various types of tools of which the CI methods are certainly best suited for the
tasks described above. There is a variety of learning systems available, based on different
principles, e.g. artificial neural networks (ANNs), support vector machines (SVMs),
prediction or decision trees (DTs), including classification trees (CTs) and regression tress
(RTs), as well as the systems dedicated to classification only, such as naïve Bayesian
classifier (NBC) and those based on the rough sets theory (RST).
Models used in DM can be parametric or non-parametric. Non-parametric models differ
from parametric ones in that the model structure is not specified a priori but is instead
determined from data, e.g. in decision trees. The non-parametric models are essentially
more suitable for knowledge discovery as the nature of the relationships hidden in the data
is usually not known.
Making a right choice of a CI model is important, particularly in the construction of DM
systems. However, there are few comparative studies available in the literature, addressing
the above discussed issues, which could show the advantages and weakness of individual
tools. The purpose of the present paper is to make an appraisal of several DM methods from
the standpoint of their performances in the extraction of knowledge appropriate for
diagnosis and control of manufacturing processes, including some new developments made
by the present authors. The research was focused on the two main tasks appearing in the
application of DM in manufacturing: determination of relative significances of input process
variables and logic rules extraction.
www.intechopen.com

Applications of Data Mining to Diagnosis and Control of Manufacturing Processes
149
2. General methodology
Selected methods discussed in the previous chapter were assessed with the use of simulated and industrial data sets. The synthetic data were obtained by assuming analytical formulas of the type Y=f(X1, X2, …), from which, for random values of continuous–type input variables X1, X2, …, the continuous–type dependent variable Y was calculated. Thus, the relationships hidden in the data are assumed and can be compared to those predicted by the models. A Gaussian–type noise was imposed on the input variables, with maximum deviation ±20%; that value was found to be characteristic of many real processes. For the classification models all the continuous values were converted to categorical ones, assuming the equal intervals method. Two numbers of categories were assumed: 5 and 10. In most cases, the sets comprising 1000 records were generated in this way. Three basic formulas were used, giving simulated data sets of the characteristics described below.
Sim 1, obtained from the basic formula: Y=X1+2⋅X2+3⋅X3+4⋅X4+5⋅X5; linearly increasing significances of variables, in additive manner, without interactions.
Sim 2, obtained from the basic formula: Y=X1⋅X2+X3+X4+X5; strong interactions between two variables of equal significances, the remaining variables have significances equal to the joint significance of the first two, without interactions among them.
Sim 3, obtained from the basic formula: Y=tanh(0.1⋅X1+0.2⋅X2+0.4⋅X3+0.8⋅X4+1.6.X5); increasing significances of variables, an additive model with asymptotic output limit (saturation value) resulting in a specific form of interaction between all input variables. Situations similar to those represented in the above relationships often appear in practice. For example, Sim 3 may reflect simultaneous action of several chemical elements, which change the alloy microstructure and properties in the same manner. These cannot exceed certain physical limits and the actual effect of each variable depends on the structure and properties produced by the other elements. All the industrial data sets were related to metal casting processes. Ind 1, Ind 2 and Ind 3 data sets were collected in a regular production of ductile cast iron in a cooperating foundry; the numbers of records were 861. Ind 1 correlates chemical composition of ductile cast iron, defined by 5 elements, often considered as most important for its microstructure and mechanical properties (Mn, Si, Cr, Ni and Cu), with the material tensile strength. Ind 2 correlates chemical composition of ductile cast iron, defined by all 9 elements controlled in the foundry (C, Mn, Si, P, S, Cr, Ni, Cu and Mg), with its tensile strength. Ind 3 correlates chemical composition of ductile cast iron, defined by 5 elements, as in Ind 1, with its grade, assumed as the output class variable with the following four values: ‘400/18’, ‘500/07’, ‘special 500/07 with increased hardness’ and ‘not classified’. The remaining two data sets: Ind 4 and Ind 5 were obtained as readouts from a semi-empirical nomograph, which permits to calculate solidification shrinkage of grey cast iron as a function of four variables: carbon contents C (5 different values – categories), sum of silicon and phosphorus content Si+P (4 values), casting modulus M (4 values) and pouring temperature Tpor (4 values). The outputs were the decisions concerning necessity and size of application of feeders to avoid the shrinkage defects. In Ind 4 data set the output, named ‘Feeder’, had 2 classes (‘No’ – when the volume change between pouring and the end of solidification was zero or positive and ‘Yes’ – when the overall volume change was negative). In the Ind 5 data set the output had 3 classes (‘No’, ‘Small’ and ‘Large’, dependent on the magnitude of the shrinkage). The numbers of records in these data sets was 190. The
www.intechopen.com

Knowledge-Oriented Applications in Data Mining
150
discretisation of the continuous – by nature – input variables was not required, as the readouts were made for selected, fixed values of these variables. It is worth noticing that, unlike the previously described simulated and industrial data sets, Ind 4 and Ind 5 have an important feature: a very low level of noise, which could be only a result of inaccuracies in the readouts of the nomograph. Generally, the noise existing in typical production data, as well as the simulated data generated as described above, may result in their inconsistency, defined as the occurrence of different output variable values (decision classes) for an identical combination of input values. In Ind 4 and Ind 5 data sets such inconsistencies were absent. The appropriate computations were partly made with the use of Statistica DataMiner
commercial software (StatSoft, 2008). For the ANNs and RST-related computations the
software developed by the present authors’ was utilized.
The other methodology issues assumed in the present research are strongly problem-dependent and will be described in the following sections.
3. Relative significances of process input variables
Several approaches to the extraction of useful information from CI models have been
proposed. Most of them utilize input – output type models, however, the association rules
can also be used (e.g. Chen et al., 2005; Shahbaz et al., 2006). In the first case two basic
approaches can be applied: ‘decompositional’, which is based on an analysis of the model’s
parameters, and ‘pedagogical’, which treats the model as a black-box, i.e. uses a specially
designed interrogation procedure to obtain the desired information. In finding the relative
importances of input variables based on interrogation of the model, the variable significance
is usually defined as the degree in which its removal from the input variables, or setting its
value at a constant level, increases the model’s prediction error.
It is important that a significance definition used for the problems characterised in Section 1
should reflect the overall influence of an input variable on the output rather then the
sensitivity of the output to that input. The sensitivity analysis returns the output changes
due to small variations of input at particular levels of the input. In the opinion of the authors
the approach assumed in the present work better meets the expectations of industrial
practitioners, who would be interested in finding potentially the greatest overall effect of a
process variable (or group of variables) on the process results.
Two basic types of the output variables can appear: numerical continuous, represented by
real numbers (regression problem) and categorical, with values represented by classes
expressed verbally or by integral numbers (classification problem). In the manufacturing
environment the first type seems to occur more commonly and will be treated here in a
more complex way, including the approach proposed by the present authors.
Output class variables can be of two types: nominal and ordinal. In many industrial
applications the ordinal type variables are of particular interest as they can be used for
expressing some uncertainties and approximations of the quantities involved. It is worth
noticing that the widespread approach, especially in process control applications, is based
on fuzzy logic, utilizing linguistic variables. However, utilization of the fuzzy calculus
requires that the input – output relationships are assumed, based on human’s knowledge or
intuition, whereas the CI methods are capable of semi-automated finding such
dependencies, using data collected in the normal production (Czogala et al., 1995).
www.intechopen.com

Applications of Data Mining to Diagnosis and Control of Manufacturing Processes
151
3.1 Advanced significance analysis of input variables for regression-type tasks
Algorithms for finding relative significances of input variables and possible interactions among them, based on a direct understanding of variable importance, have been developed by the present authors. The significance factor for a single input or for a group of inputs is defined as the maximum difference of the output, which can be obtained by changing the value of the analysed input (or inputs). The two extremes of the output are found by the conjugate gradient method, with the starting points found by a specially developed procedure, permitting to avoid local minima in most cases. All the significances thus obtained are normalised by dividing them by the value obtained for the most significant variable (or group of variables). The definition of interaction coefficient between variables in a selected group is expressed as
the ratio of the significance factor of the group to the arithmetic mean of significances of all
the single variables from the group. However, the latter are taken as their minimum values
with respect to the rest of the variables in the group, thus eliminating the ‘assistance’ of the
other variables in the group. The synergy coefficient is defined as the ratio of the
significance factor of the group to the sum of the above defined significances of all the single
variables from the group, minus 1. It expresses (in percents) the degree in which
simultaneous action of several inputs are larger than the sum of actions of the individual
inputs working independently. Similarly like in the algorithms used for the relative
significance factors, the significances of the single input signals within the group used for
interaction and synergy computations are determined from the two extremes of the output
found by the conjugate gradient method. The minima of these significances with respect to
the rest of the variables in the group are found, in external computation loops, by the
simulated annealing method.
The significance factors of a single input variable or a selected group of variables, as well as
the interaction factors between variables within the group, are calculated repeatedly a
number of times for the other variables set at random levels. The final values of significance
or interaction factors are calculated as their arithmetic averages. The magnitude of the
scatter of the significance factor of a given input resulting from the other inputs’ levels can
be a measure of the possible interactions with the other input variables.
The above algorithms were implemented using MLP-type ANNs, with one hidden layer
with the number of neurons equal to the number of the network’s inputs in most cases. That
type of ANN architecture was found to be effective and accurate in a number of preliminary
tests. The significance factors of single variables were also calculated using SVM and RT
models. Some results were also compared to those obtained from one--way ANOVA, in
which the significance factor was defined as the normalised F statistics values calculated for
dependency between a considered independent variable and the dependent variable. The
definition of interaction coefficient between two variables tested in the present work is
based on the test statistics F for the interaction of the two variables in the two--way
ANOVA. Further details concerning the above presented definitions and methodology can
be found in (Perzyk et al., 2008).
In Fig. 1 comparisons of the relative significance factors of single variables, obtained from various regression models and ANOVA for simulated data sets, are presented. These results generally agree with the expectations, i.e. the assumed, hidden relationships in the data. The most accurate values were obtained form ANNs and SVMs. The predictions of RTs and ANOVA are much less accurate and tend to remarkably underestimate significances of the
www.intechopen.com

Knowledge-Oriented Applications in Data Mining
152
less important variables. Dispersions of relative significance factors, expressed by their average deviations resulting from randomly set values of other variables, can be observed for all models. However, negligible scatters for variables with no interactions (all variables in Sim 1 and X3, X4 and X5 in Sim 2) are observed for ANNs and SVMs only, while RTs evidently revealed non-existent interactions between input variables. It is worth noticing that the observed differences between the relative significances of the equally strong variables (such as X1 and X2 or X3, X4 and X5 in Sim 2) are mainly a result of variations which appear in the training data set due to the artificial noise imposed on the data. It was found that different training sessions of ANNs or different settings for RTS induction (for a given generation) lead to much smaller discrepancies of the significance factors. Sim 1 Sim 2
0
0,2
0,4
0,6
0,8
1
1,2
X1 X2 X3 X4 X5
0
0,2
0,4
0,6
0,8
1
1,2
X1 X2 X3 X4 X5
Sim 3
0
0,2
0,4
0,6
0,8
1
1,2
X1 X2 X3 X4 X5
ANN
SVM
RT
ANOVA
Expected
Fig. 1. Relative significance factors obtained from CI regression models and ANOVA for the simulated data sets; the scatter bars are calculated as average deviations resulting from randomly set values of the other variables
For the real, industrial data the expected values of relative significances, hidden in the data, are often not known or can be evaluated only in a qualitative manner. The data sets related to ductile cast iron production (Ind 1, Ind 2 and Ind 3) were collected in a particular plant, where some of the chemical elements could be kept at the levels which do not allow them to exhibit their full effect on the mechanical properties of the alloy. The only important information obtained from that foundry was that copper was the main element used for control of the microstructure and, consequently, the tensile strength of the alloy, and that it can be expected to have the largest significance. For Ind 2 all the models shown in Fig. 2
www.intechopen.com

Applications of Data Mining to Diagnosis and Control of Manufacturing Processes
153
pointed at copper as the most significant alloying element. Different predictions from different models were obtained for the other elements, however, in the case of the probably least significant variables, such as C, P, S and Mg, all models were also fairly conformable. The control of these elements could be possibly limited or even eliminated in that particular plant.
0
0,2
0,4
0,6
0,8
1
1,2
C Mn Si P S Cr Ni Cu Mg
ANN
SVM
RT
ANOVA
Fig. 2. Relative significance factors for the Ind 1 data set (tensile strength of ductile cast iron vs its chemical composition defined by 9 elements)
The above presented results, especially for the simulated data sets, indicated that
performance of ANN and SVM models is remarkably better compared to RT and ANOVA.
Further tests, concerning significances of groups of variables and interactions among them
were made using the neural models only. It was found that the adjustment of appropriate
settings for SVM models can be troublesome and sometimes may lead to wrong results.
Despite the fact that neural models are in principle ambiguous models, in the sense that a
change of the network architecture or each training session may lead to different results,
they seem to be more predictable compared to SVM.
The significance factors for groups of variables were calculated for all possible combinations
of the variables appearing in the simulated data sets. The tendencies of the predictions agree
well with expectations in all cases. Exemplary results are shown in Fig. 3. The positive
deviations, appearing for most of the variable combinations, result from the fact that all the
calculated values were normalised in relation to the most significant group, which is clearly
the group including all the variables. It was found that the extreme responses of the neural
model, which are used for the significance computations of that group, are attenuated, i.e.
the maximum response is lesser and the minimum response is larger then expected. Thus,
the incompatible values, such as observed in Fig. 3, result only from the inaccuracies of the
maximum significances. This behaviour of the trained network is a result of the structure of
the training data: it is very unlikely that the extreme values of all five inputs, necessary to
obtain the extreme value of the output, will be represented in the data set. The graphs
presented in Fig. 3 also illustrate typical scatter resulting from different training sessions of
ANNs.
The interaction and synergy coefficients obtained from ANNs for pairs of variables were
correct in all cases (selected results are presented in Fig. 4). It should also be noticed that the
proposed method offers an easy way for the estimation of interactions and synergies among
larger number of variables.
www.intechopen.com

Knowledge-Oriented Applications in Data Mining
154
0
0,2
0,4
0,6
0,8
1
X1
X2
X1
X2
X
3
X4
X
5
X1
X3
X1
X4
X
1 X
5
X2
X3
X
2 X
4
X2
X5
X1
X2
X3
X
1 X
2 X
4
X1
X2
X5
X3
X4
X
3 X
5
X4
X5
X
1 X
3 X
4
X1
X3
X5
X1
X4
X5
X
2 X
3 X
4
X2
X3
X5
X
2 X
4 X
5
X1
X2
X3
X4
X1
X2
X3
X5
X
1 X
2 X
4 X
5
X3
X4
X5
X
1 X
3 X
4 X
5
X2
X3
X4
X5
X1
X2
X3
X4
X5
Training no 1
Training no 2
Training no 3
Training no 4
Training no 5
Expected
Fig. 3. Comparison of relative significance factors for all possible groups (combinations) of input variables obtained from ANNs for Sim 2 synthetic data
0
1
2
3
4
5
6
X1, X2 X1, X5 X4, X5
Input variables
Sim 1 Sim 2
0%
50%
100%
150%
X1, X2 X1, X5 X4, X5
Input variables
Sim 1 Sim 2
(a) (b)
Fig. 4. Assessment of the interaction and synergy coefficients obtained from a trained ANN by the developed methodology: (a) – interaction coefficients, (b) – corresponding synergy coefficients
Results obtained from the two-factor ANOVA for Sim 2 data sets, also used for the
ANNs-based computations, are presented in Table 1. It can be seen that the p-value does not
indicate the existence of any interactions. Just like in the single variable analysis, this is
probably a result of larger error variance appearing in the denominator of the expression for
F, leading to the high p-value. This observation means that evident interactions between
selected variables in the presence of other variables may not be detected by the
ANOVA-based method even when the potential significance of the interacting variables is
comparable to the other variables.
www.intechopen.com
Applications of Data Mining to Diagnosis and Control of Manufacturing Processes
155
Input variables
F statistics value
p-value Interaction
detected Interaction expected
X1, X2 1.221 0.1013 No Yes
X4, X5 0.947 0.6038 No No
Table 1. Interactions-related parameters obtained from two-factor ANOVA for Sim 2 data set
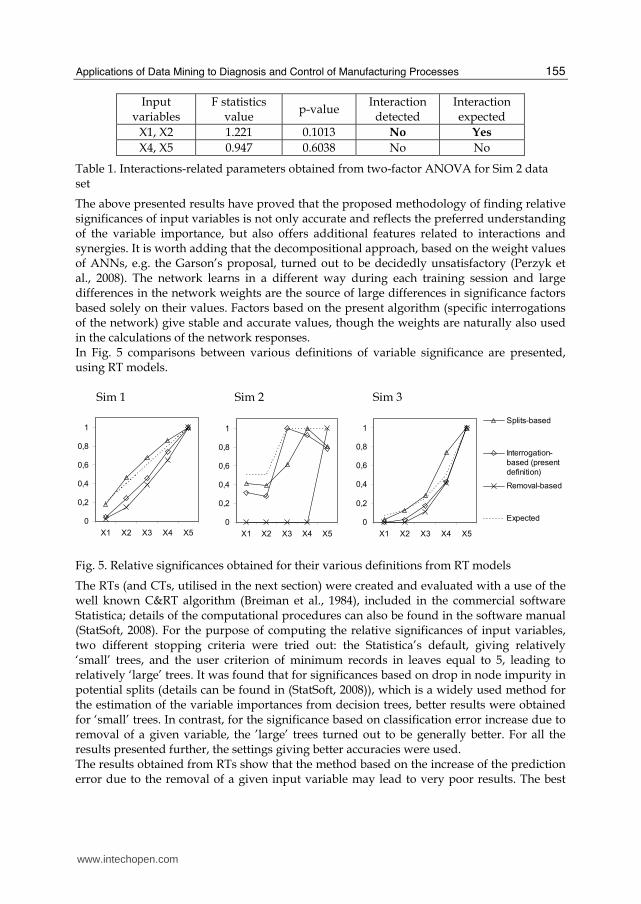
The above presented results have proved that the proposed methodology of finding relative significances of input variables is not only accurate and reflects the preferred understanding of the variable importance, but also offers additional features related to interactions and synergies. It is worth adding that the decompositional approach, based on the weight values of ANNs, e.g. the Garson’s proposal, turned out to be decidedly unsatisfactory (Perzyk et al., 2008). The network learns in a different way during each training session and large differences in the network weights are the source of large differences in significance factors based solely on their values. Factors based on the present algorithm (specific interrogations of the network) give stable and accurate values, though the weights are naturally also used in the calculations of the network responses. In Fig. 5 comparisons between various definitions of variable significance are presented, using RT models. Sim 1 Sim 2 Sim 3
0
0,2
0,4
0,6
0,8
1
X1 X2 X3 X4 X5
0
0,2
0,4
0,6
0,8
1
X1 X2 X3 X4 X5
0
0,2
0,4
0,6
0,8
1
X1 X2 X3 X4 X5
Splits-based
Interrogation-
based (present
definition)
Removal-based
Expected
Fig. 5. Relative significances obtained for their various definitions from RT models
The RTs (and CTs, utilised in the next section) were created and evaluated with a use of the well known C&RT algorithm (Breiman et al., 1984), included in the commercial software Statistica; details of the computational procedures can also be found in the software manual (StatSoft, 2008). For the purpose of computing the relative significances of input variables, two different stopping criteria were tried out: the Statistica’s default, giving relatively ‘small’ trees, and the user criterion of minimum records in leaves equal to 5, leading to relatively ‘large’ trees. It was found that for significances based on drop in node impurity in potential splits (details can be found in (StatSoft, 2008)), which is a widely used method for the estimation of the variable importances from decision trees, better results were obtained for ‘small’ trees. In contrast, for the significance based on classification error increase due to removal of a given variable, the ’large’ trees turned out to be generally better. For all the results presented further, the settings giving better accuracies were used. The results obtained from RTs show that the method based on the increase of the prediction error due to the removal of a given input variable may lead to very poor results. The best
www.intechopen.com

Knowledge-Oriented Applications in Data Mining
156
accuracies of the variable significances were obtained from the approach based on split quality. However, these results are still worse, compared to the methodology proposed by the present authors and implemented with ANNs or SVMs. The successful application of advanced regression models to finding the most significant process variables requires some additional comments. First, the computation times are long for the proposed algorithm, resulting from necessity of finding extremes of multivariable functions. Second, in some situations, only small data sets, i.e. sets including a very limited number of training examples, are available. This situation is typical for many machine break-down problems where failures are rare but costly. ANNs are demanding from the point of view of the amount of training data as the number of the model parameters (network’s weights) are large and the number of training examples should be at least two times greater then the number of weights to obtain reliable results, without overfitting. The other types of models could be more suitable in such cases.
3.2 Assessment of significances of process input variables for classification tasks
For manufacturing-related problems, CTs are probably the most frequently used tools for knowledge extraction from data (e.g. (Chen et al., 2005; Huang & Wu, 2006; Hur et al., 2006; Koonce et al., 1997; Rokach & Maimon, 2006; Wang, 2007)), whereas the RST–based methods seem to be their newer alternative (e.g. (Kusiak & Kurasek, 2001; Sadoyan et al., 2006; Shen et al., 2000; Tseng et al., 2004)). Both algorithms are relative simple, especially compared to neural or fuzzy-neural systems, and easy to interpret by the users. Both of them treat the data in a natural way, however, they are based on completely different principles and algorithms. The practical aspects of application of these tools are also different. The computation times necessary for CTs are generally short and the interpretation of rules obtained from CT can be facilitated by the graphical representation of the trees. The RST theory may require long computational times and may lead to much larger number of rules constituting the model, compared to CTs. It should be noticed, that whereas CTs are widely spread both in handbooks and in commercially available software, the RST can be rather seldom found, except for scientific literature. A RST–based procedure, oriented at generation of full set of logic rules, was written by the
present authors with a somewhat similar approach as used in the ‘Explore’ algorithm
(Stefanowski & Vanderpooten, 2001). First, all the combinations of single input variables
appearing in the data are placed in the rules (i.e. rules including only one condition are
generated) and their confidences are calculated. Then the further conditions are added,
providing the confidence of a rule thus obtained is increased, compared to the rule with
shorter conditional part. The relative significances of input variables were calculated in a
typical way, i.e. on the basis of the reduction of the so called positive region of data (i.e.
giving rules of 100% confidence) resulting from removing a given variable. More details
concerning RST computations can be found in (Polkowski, 2002). Details of methodology
applied for CTs were presented in the previous section.
The relative significances of input variables were also calculated using the statistical method appropriate for discrete type variables, based on contingency tables. The Cramer’s V statistics was used as a measure of significance. In Fig. 6 comparisons of the calculated relative significances with the expected ones are
shown and in Fig. 7 the average errors, defined as absolute differences between calculated
www.intechopen.com

Applications of Data Mining to Diagnosis and Control of Manufacturing Processes
157
and expected values, are presented for several cases. It can be seen that for all the simulated
data sets with 1000 records the CT predictions are very poor, compared to RST and the
statistic method: not only the errors are much higher but it is also important that CTs often
do not reflect the expected tendencies of the variable significances. However, the good
performance of RST and statistical method is not confirmed for small data sets.
Sim 1 1000 records Sim 2 1000 records
0
0,2
0,4
0,6
0,8
1
X1 X2 X3 X4 X5
CT, splits-
based
CT, removal-
based
RST
Naive Bayes
Statistics
Expected
0
0,2
0,4
0,6
0,8
1
X1 X2 X3 X4 X5
CT, splits-
based
CT, removal-
based
RST
Naive Bayes
Statistics
Expected
Sim 3 1000 records Sim 1 100 records
0
0,2
0,4
0,6
0,8
1
X1 X2 X3 X4 X5
CT, splits-
based
CT, removal-
based
RST
Naive Bayes
Statistics
Expected
0
0,2
0,4
0,6
0,8
1
X1 X2 X3 X4 X5
CT, splits-
based
CT, removal-
based
RST
Naive Bayes
Statistics
Expected
Fig. 6. Relative significances of input variables, obtained by various methods and expected, for simulated data sets with the assumed number of categories equal 5
As mentioned earlier, for the industrial data the expected values of relative significances are
generally not known. The expected largest significance of copper was confirmed by more
precise regression modelling presented in Fig. 2, which allowed to avoid conversion of the
real numbers to categories. In Fig. 8 the results obtained for categorical type variables are
presented (assuming 5 input variables) and in Fig. 9 the results for 9 chemical elements are
shown, together with the above mentioned results obtained from the neural regression
model – for comparison purposes.
It can be seen that for the case of 5 elements assumed as inputs and tensile strength as
output (Fig. 8 left) the three methods brought generally divergent results and only the
statistical approach pointed at copper contents as the most significant variable. When the
ductile iron grade was assumed as the output (Fig. 8 right) the results obtained by the three
methods are fairly similar and indicate copper as a significant element.
www.intechopen.com

Knowledge-Oriented Applications in Data Mining
158
1000 records, 5 categories 100 records, 5 categories
0,0
0,1
0,2
0,3
0,4
0,5
Sim 1 Sim 2 Sim 3
0,0
0,1
0,2
0,3
0,4
0,5
Sim 1 Sim 2 Sim 3
Sim 1
0,0
0,1
0,2
0,3
0,4
0,5
1000
records, 5
categories
1000
records, 10
categories
100 records,
5 categories
CT, splits-based
CT, removal-based
RST
Naive Bayes
Statistics (contingencytable)
Fig. 7. Average errors of relative significances obtained by various methods and different numbers of records and categories
Ind 1 Ind 3
0
0,2
0,4
0,6
0,8
1
Mn Si Cr Ni Cu
CT, splits-
based
CT, removal-
based
RST
Statistics
Naive Bayes
0
0,2
0,4
0,6
0,8
1
Mn Si Cr Ni Cu
CT, splits-
based
CT, removal-
based
RST
Statistics
Fig. 8. Relative significances of input variables, obtained by various methods for two industrial data sets related to ductile iron production: Ind 1 – tensile strength assumed as the output (5 categories), Ind 3 – alloy grade assumed as the output (4 classes)
www.intechopen.com

Applications of Data Mining to Diagnosis and Control of Manufacturing Processes
159
0
0,2
0,4
0,6
0,8
1
C Mn Si P S Cr Ni Cu Mg
CT, splits-based
CT, removal-based
RST
Naive Bayes
Statistics
ANN (regression)
Fig. 9. Relative significances of input variables, obtained by various methods for Ind 2 data set – ductile iron tensile strength assumed as the output (5 categories, solid lines) and obtained from regression neural model for all continuous variables (dotted line)
For the case of 9 elements assumed as inputs and tensile strength as output (Fig. 9) the three methods studied in the present work give differentiated predictions for most of the input variables (except sulphur as the least significant element and manganese as a very important one). None of the present methods pointed at copper as the most significant element, as indicated by the regression analysis (Fig. 2). It is important to notice, that the latter have also shown divergent results for some variables, e.g. Mn and Si.
Ind 4 Ind 5
0
0,2
0,4
0,6
0,8
1
C Si+P M Tpor
CT, splits-
based
CT, removal-
based
RST
Statistics
Naive Bayes
0
0,2
0,4
0,6
0,8
1
C Si+P M Tpor
CT, splits-
based
CT, removal-
based
RST
Statistics
Naive Bayes
Fig. 10. Relative significances of input variables, obtained by various methods for two industrial data sets related to the feeding of grey cast iron castings: Ind 4 – requirement of feeder application assumed as the output (2 categories), Ind 5 – requirement and size of feeder assumed as the output (3 classes)
In Fig. 10 the results for two data sets related to feeding of grey cast iron castings (Ind 4 and Ind 5) are shown. The industrial experience indicates that the alloy chemical composition, commonly expressed by its carbon content and the sum of silicon and phosphorus contents, has a minor effect on shrinkage and, consequently, feeding requirements. The main influencing factors should be the pouring temperature, which directly determines the magnitude of volume change from pouring to the solidification onset, and the casting
www.intechopen.com

Knowledge-Oriented Applications in Data Mining
160
modulus which expresses the casting cooling rate, affecting kinetics of the volume changes during solidification. The results obtained by all the three methods fully confirmed these expectations for the case of two output classes (Fig. 5a). However, for the more complex output (Fig. 5b), the CTs predictions based on drop in node impurity in potential splits appeared to be very far from the expectations. The results presented in this section indicate that for the simulated, categorical-type data, identification of significances of process parameters by the RST–based systems generally appeared to be much more precise and reliable, compared to CTs. The widely used statistical method, based on contingency tables, also demonstrated a good performance and turned out to be the best in most cases. This substantial advantage of RST–based and statistical methods was partly confirmed by the real data, related to foundry production. However, this general observation does not concern small data sets, for which the errors of those two methods increased 2 to 3 times, compared to the corresponding large sets. These errors were comparable to those obtained from CTs and may be regarded as non–acceptable for many applications.
4. Assessment of knowledge rule systems obtained from RST and CTs
4.1 Requirements for knowledge rules applicable to manufacturing processes
General requirements for knowledge rules which could be useful in manufacturing industry are rather obvious and similar to those for other areas of applications. First, the rules should be reliable, which means that there is a real chance that an application of the rule will bring the predicted result. This can be expressed by the rule quality parameters: confidence and support. Second, the rules should not be unnecessarily demanding, i.e. they should not comprise conditions which are not important, particularly redundant. Most algorithms used for knowledge extraction are first of all oriented at generation of a set of rules which best characterize the problem, i.e. the most reliable ones. However, in many industrial appliactions, particularly in manufacturing, some more specific requirements are relevant, related to design and development of new processes or control of currently running ones. Typical questions to be answered by using the rules can be formulated as follows:
• What are the most effective and reliable ways (i.e. process parameters – input values) to achieve an assumed result (class variable)?
• What would happen if we were not able to apply certain input values, i.e. what would we get if we use different ones? Do we still have a chance (and how big) to get the required result?
• What will be the predictions (and how reliable) in the case when some input variables cannot be specified, e.g. they may be out of control?
• What are all alternative ways to achieve our goal and how reliable are they? Answering some of the above questions may result in the necessity of predictions for combination of parameters (input variables values) which have never appeared in the past (i.e. are not present in the data). It should be noticed that a user may be interested not only in obtaining a one-time prediction for such input values but also in having an appropriate rule or rules with estimated quality parameters. The requirements for rule system and the knowledge extraction tools, suitable for manufacturing industry applications, are not only a consequence of the issues described above, but also the specificity of the available data. Typically, the number of independent variables (i.e. problem dimensionality) is not large, it seldom exceeds 10. The number of
www.intechopen.com

Applications of Data Mining to Diagnosis and Control of Manufacturing Processes
161
available records can vary within broad ranges, from only a few to many thousands, especially when the automatic data acquisition system is utilized. Typical industrial data are noisy, which results in their inconsistency, i.e. an occurrence of different output variable values for an identical combination of input values (conditions in a rule). The characteristics of industrial process problems presented above imply that the following requirements for rule systems are essential or at least important:
• The rules should make use of all information in the data. This means, for example, that all output values (classes) must be represented. Even single cases can be valuable and therefore they should be reflected in the rule system.
• The rules should not contain redundant conditions as they can be misleading for the user.
• It should be possible to find a rule ‘tailored’ to the user specifications, including combinations of input variable values which are not represented in the data.
• Reliability of all rules should be evaluated, using the confidence and support as the primary parameters.
4.2 Characteristic behaviour of CTs and RST in rules extraction
A structure of a CT model is uniquely defined by a set of the logic expressions,
corresponding to the knowledge rules. The nature of CT models, based on recursive
partitioning of the data records, results in a set of conditions, which may be different from
the combinations of input variables in the training data records. Some of the combinations
appearing in the data set may be absent in the tree and vice versa, also some sequences of
conditions occurring in the data may be abbreviated in the tree. The lack of some
combinations of input values in CTs which are present in the training data, may result in the
rule system in which some important rules are missing.
Another consequence is that CTs can give wrong predictions for training data. In the case of
consistent data, this may be a result of improper tree structure, i.e. one in which the given
combination of input values (attributes) is connected with a class of the output variable
which is different from that which appears in the data. Partly incorrect predictions may be a
consequence of the fact that CTs are able to give only one prediction for a given combination
of input variables values. For noisy, inconsistent data it must always lead to a fraction of
false predictions. Considering a CT as a knowledge rule system means that for that type of
data CTs must omit some rules, potentially also important for a user. In particular, those
omitted rules can be the only ones which give a certain output.
Rules obtained from CTs may include redundant conditions as the splitting variable used in the core must appear in all rules (generally, the splitting variable in a node must appear in all rules resulting from subsequent splits). In contrast, RST provides ‘fitted’ rules, i.e. without unnecessary conditions. That type of behaviour of both algorithms was commented in detail in (Kusiak & Kurasek, 2001). It is essential that all of the above discussed drawbacks of the rule systems obtained from CTs are absent in the RST–based systems. Below, some results of numerical tests are presented, which demonstrate to what extent this fundamental difference may be significant. More details can be found in (Perzyk & Soroczynski, 2010). Most of the methodology issues concerning CTs and RST computations were described at the beginning of Section 3.2. Slightly different settings were assumed here for CTs: in order to obtain possibly the largest choice of logic rules from the data, comparable to that available
www.intechopen.com

Knowledge-Oriented Applications in Data Mining
162
from RST, various splitting conditions, stopping criteria and pruning parameters were tried. The smallest trees which ensured the smallest fraction of false predictions for training sets were chosen. In Fig. 11 the fractions of wrong predictions obtained from CTs for all consistent data subsets (i.e. all the discernible input values combinations pointing at one output value only) are shown, for selected data sets.
0%
20%
40%
60%
80%
Sim 1 Sim 2 Ind 2 Ind 3 Ind 4 Ind 5
Fig. 11. Average fractions of false predictions obtained from CTs for consistent data subsets (including single records)
The general level of false predictions for the real data is much lower, compared to simulated data. An interpretation of this observation would require a deeper analysis of the data sets structures, e.g. representativeness of the classes of input and output variables. In Fig. 12 some statistical information obtained for inconsistent data subsets is shown. It is interesting to note that in several cases CTs have pointed at the decision classes which are not predominant for the given combination of input values.
44
%
44
%
30
%
33
%
67
%
67
%
67
%
67
%
2
32
3
Sim 1 Sim 2 Ind 2 Ind 3
Average % of wrongpredictions for allinconsistent subsets
Maximum % of wrongpredictions for allinconsistent subsets
Number ofinconsistent subsetswith over 50% ofwrong predictions
Fig. 12. Statistics of false predictions obtained from CTs for inconsistent data subsets
In Fig. 13 the fractions of rules included in CTs, which are not supported by the data, are shown, exhibiting quite large values in several cases. In principle, this can be a positive feature of CTs as such rules may be desired by a user. However, the usefulness of such rules may be questionable. First, because they do not necessarily meet the user’s specific needs and second, because their reliability, defined by confidence and support, is not determined. In Fig. 14 the numbers of rules absent in CTs, but extracted by RST, are presented, together with the total numbers of rules in CTs and from RST. The missing rules may be valuable for a user, as it was found that their confidences are relatively high and comparable with those
www.intechopen.com

Applications of Data Mining to Diagnosis and Control of Manufacturing Processes
163
0%
20%
40%
60%
80%
Sim 1 Sim 2 Ind 2 Ind 3 Ind 4 Ind 5
Fig. 13. Fractions of rules in CTs not supported by data
30
9
33
3
13
1
25
1852 11
7
11
6 1
20
82
21
10
11
27
38
9
14
6
Sim 1 Sim 2 Ind 2 Ind 3 Ind 5
Number of rules in CT
Number of absent rules inCT (obtained from RST)
Number of rules from RST
Fig. 14. Numbers of CTs rules and obtained from RST – total and missing in CTs systems obtained for the rules which are included in CTs. It is worth noticing that for some of the simulated data sets, some of the missing rules had 100% confidences.
In Fig. 15 fractions of CT rules with redundant conditions are shown. Obviously, the RST rules, taken as reference, had the same confidence values. It was also found that the average number of redundant conditions was similar to the number of important conditions. The conclusion is that the presence of redundant conditions in rules obtained from CTs, being a result of the nature of that type of models, may be their significant disadvantage.
0%
20%
40%
60%
80%
100%
Sim 1 Sim 2 Ind 2 Ind 3 Ind 4 Ind 5
Fig. 15. Fractions of CTs rules with redundant conditions
www.intechopen.com

Knowledge-Oriented Applications in Data Mining
164
An important feature of a rule system is its predictive capability for new data, i.e. combinations of the input variable values which have not appeared in the past. Some preliminary simple tests confirmed that for some cases CTs are unable to give predictions for the desired new input value combinations, as discussed earlier. Also, relatively large fractions of false predictions by RST–based rule systems were found; this requires treating this problem in more detail in a separate study. In spite of that last finding, RST–based rule systems seem to be fundamentally better in almost every respect, compared to those obtained from CTs, including completeness, reliability and lack of redundant conditions of the rules.
5. Conclusion
This chapter reviews characteristic problems related to manufacturing and points out potential benefits from applications of DM in this area. Research results in two aspects of those applications are presented. The first topic is determination of relative significances of process input variables and possible interactions among them, particularly helpful in finding root causes of product defects and optimum control of the manufacturing processes. A few different approaches and methods are discussed and evaluated, including various computational intelligence and statistical methods. Two types of data were used for testing: simulated, with assumed hidden relationships, and real, collected in manufacturing industry. For the regression-type tasks, the methodology proposed by the present authors, based on an interrogation algorithm of advanced models, in particular artificial neural networks, appeared to be fully successful. Some limitations of that approach are also discussed. For the classification-type tasks, the rough sets theory approach was found to be superior, however a simple statistical method, based on contingency tables, also demonstrated a good performance. Remarkable inaccuracies of relative significances obtained from decision trees, both in regression and classification tasks, have been shown. The second topic of the research was knowledge rules extraction from recorded data, meeting the requirements related to control and diagnosis of manufacturing processes. The issues emphasized in the study covered completeness of the information included in the rule systems, avoidance of redundant conditions appearing in the rules and possibility of creation reliable rules for combinations of conditions absent in the training data. Two types of classification systems frequently used for knowledge extraction are compared: based on classification trees and rough sets theory. Decision trees have revealed several disadvantages as knowledge extraction tools for the applications where not only a characterization of a problem is required, but also detailed and precise rules are needed, according to actual, specific problems to be solved. For such applications the rules obtainable from RST turned out to be fundamentally better. The study presented in this chapter pointed out at needs for further research in several areas. The methods of finding the relative significances of input variables for small data sets, both in regression and classification type tasks, require further analyses and improvements. Research aimed at development of the control systems for production processes, involving combinations of approaches utilizing rough sets theory and fuzzy sets, as suggested in (Czogala et al., 1995) would also be desirable. Although the present paper is focused on industrial manufacturing processes, it can be expected that the obtained results, particularly those related to the significance analysis of input variables, can be useful also in other application areas.
www.intechopen.com

Applications of Data Mining to Diagnosis and Control of Manufacturing Processes
165
6. Acknowledgment
This work was partly supported by grant N R07 0015 04 from Ministry of Science and Higher Education, Poland.
7. References
Breiman, L.; Friedman, J. H.; Olshen, R. A. & Stone. C. J. (1984). Classification and regression trees, Chapman & Hall/CRC, ISBN 0412048418, Boca Raton, Florida, USA
Chen, R. S.; Wu, R. C. & Chang, C. C. (2005). Using data mining technology to design an intelligent CIM system for IC manufacturing. in Proc. Networking and Parallel/Distributed Computing and 1st ACIS International Workshop on Self-Assembling Wireless Networks, pp. 70–75, ISBN 0769522947, United States, Towson
Chen, W. C.; Tseng, S. S.; Hsiao, K. R. & Liu, C. C. (2004). A data mining project for solving low-yield situations of semiconductor manufacturing. IEEE Int Symp Semicond Manuf Conf Proc, 129–134, ISSN 1523553X
Chen, W.C.; Tseng, S. S. & Wang, C. Y. (2005). A novel manufacturing defect detection method using association rule mining techniques. Expert Systems with Applications, Vol. 29, No. 4, 807–815, ISSN 09574174
Czogala, E.; Mrozek, A.; Pawlak, Z. (1995). The idea of a rough fuzzy controller and its application to the stabilization of a pendulum-car system. Fuzzy Sets and Systems, Vol. 72, No. 1, 61–73, ISSN 01650114
Dagli, C. H. & Lee, H. C. (2001). Engineering smart data mining systems for internet aided design and manufacturing. International Journal of Smart Engineering System Design, Vol. 3, No. 4, 217–225, ISSN 10255818
Harding, J. A.; Shahbaz, M.; Srinivas, M.; Kusiak, A. (2006) Data mining in manufacturing: A review. Journal of Manufacturing Science and Engineering, Transactions of the ASME, Vol. 128, No. 4, 969–976, ISSN 10871357
Huang, H.; Wu, D. (2006). Product quality improvement analysis using data mining: A case study in ultra–precision manufacturing industry. Lect. Notes Comput. Sci, 577–580, ISSN 03029743
Hur, J.; Lee, H.; Baek, F. G. (2006). An intelligent manufacturing process diagnosis system using hybrid data mining. Lect. Notes Comput. Sci., Vol. 4065 LNAI, 561–575, ISSN 03029743
Koonce, D.; Fang, C. H.; Tsai, S. C. (1977) Data mining tool for learning from manufacturing systems. Computers and Industrial Engineering, Vol. 33, No. 1-2, 27–30, ISSN 03608352
Kusiak, A. (2006) Data mining: manufacturing and service applications. International Journal of Production Research, Vol. 44, No. 18–19, 4175–4191, ISSN 00207543
Kusiak, A.; Kurasek, C. (2001). Data mining of printed-circuit board defects. IEEE Transactions on Robotics and Automation, Vol. 17, No. 2, Apr 2001, 191–196, 1042296X
Mahl, A. & Krikler, R. (2007). Approach for a rule based system for capturing and usage of knowledge in the manufacturing industry. Journal of Intelligent Manufacturing, Vol. 18, No. 4, 519–526, ISSN 09565515
Perzyk, M.; Biernacki, R.; Kozlowski, J. (2008). Data mining in manufacturing: Significance analysis of process parameters. Proc.Inst.Mech.Eng.Pt.B: J.Eng.Manuf, Vol. 222, No. 12, 1503–1516, ISSN 09544054
www.intechopen.com

Knowledge-Oriented Applications in Data Mining
166
Perzyk, M.; Soroczynski, A. (2010). Comparative Study of Decision Trees and Rough Sets Theory as Knowledge Extraction Tools for Design and Control of Industrial Processes. Proceedings of World Academy of Science, Engineering and Technology, Vol. 61, 234–239, ISSN 20703740
Polkowski, L. (2002). Rough Sets: mathematical Foundations. Physica-Verlag, ISBN 390815101, Heidelberg New York
Rokach, L.; Maimon, O. (2006). Data mining for improving the quality of manufacturing: A feature set decomposition approach. Journal of Intelligent Manufacturing,Vol. 17, No. 3, 285–299, ISSN 09565515
Sadoyan, H.; Zakarian, A.; Mohanty, P. (2006). Data mining algorithm for manufacturing process control. International Journal of Advanced Manufacturing Technology, Vol. 28, No. 3-4, 342–350, ISSN 02683768
Shahbaz, M.; Srinivas, M.; Harding, J. A. & Turner, M. (2006). Product design and manufacturing process improvement using association rules. Proceedings of the Institution of Mechanical Engineers, Part B: Journal of Engineering Manufacture, Vol. 220, No. 2, 243–254, ISSN 09544054
Shen, L.; Tay, F. E. H.; Qu, L.; Shen, Y. (2000). Fault diagnosis using Rough Sets Theory. Computers in Industry, Vol. 43, No. 1, August 2000, 61–72, ISSN 01663615
StatSoft, Inc. (2008). STATISTICA (data analysis software system), version 8.0. www.statsoft.com
Stefanowski, J. & Vanderpooten, D. (2001). Induction of decision rules in classification and discovery-oriented perspectives. International Journal of Intelligent Systems, Vol. 16, No. 1, 13–27, ISSN 08848173
Tsang, K. F.; W.Lau, W. Kwok, S. K. (2007). Development of a data mining system for continual process quality improvement. Proceedings of the Institution of Mechanical Engineers, Part B: Journal of Engineering Manufacture, Vol. 221, No. 2, 179–193, ISSN 09544054
Tseng, T. L.; Jothishankar, M. C.; Wu, T.; Xing, G.; Jiang, F. (2004). Applying data mining approaches for defect diagnosis in manufacturing industry. IIE Annual Conference and Exhibition, pp. 1441-1447, Houston, May 2004, Institute of Industrial Engineers
Wang, K. (2007). Applying data mining to manufacturing: The nature and implications. Journal of Intelligent Manufacturing, Vol. 18, No. 4, 487–495, ISSN 09565515
www.intechopen.com

Knowledge-Oriented Applications in Data MiningEdited by Prof. Kimito Funatsu
ISBN 978-953-307-154-1Hard cover, 442 pagesPublisher InTechPublished online 21, January, 2011Published in print edition January, 2011
InTech EuropeUniversity Campus STeP Ri Slavka Krautzeka 83/A 51000 Rijeka, Croatia Phone: +385 (51) 770 447 Fax: +385 (51) 686 166www.intechopen.com
InTech ChinaUnit 405, Office Block, Hotel Equatorial Shanghai No.65, Yan An Road (West), Shanghai, 200040, China
Phone: +86-21-62489820 Fax: +86-21-62489821
The progress of data mining technology and large public popularity establish a need for a comprehensive texton the subject. The series of books entitled by 'Data Mining' address the need by presenting in-depthdescription of novel mining algorithms and many useful applications. In addition to understanding each sectiondeeply, the two books present useful hints and strategies to solving problems in the following chapters. Thecontributing authors have highlighted many future research directions that will foster multi-disciplinarycollaborations and hence will lead to significant development in the field of data mining.
How to referenceIn order to correctly reference this scholarly work, feel free to copy and paste the following:
Marcin Perzyk, Robert Biernacki, Andrzej Kochanski, Jacek Kozlowski and Artur Soroczynski (2011).Applications of Data Mining to Diagnosis and Control of Manufacturing Processes, Knowledge-OrientedApplications in Data Mining, Prof. Kimito Funatsu (Ed.), ISBN: 978-953-307-154-1, InTech, Available from:http://www.intechopen.com/books/knowledge-oriented-applications-in-data-mining/applications-of-data-mining-to-diagnosis-and-control-of-manufacturing-processes


![ECG Signal processing (2) ECE, UA. ECG signal processing - Case [1] Diagnosis of Cardiovascular Abnormalities From Compressed ECG: A Data Mining-Based.](https://static.fdocuments.net/doc/165x107/56649dbf5503460f94ab3016/ecg-signal-processing-2-ece-ua-ecg-signal-processing-case-1-diagnosis.jpg)


