Application pratique de l’analyse de l’interaction sol … 2017.pdfProceedings of the 19 th...
20
Practical application of soil structure interaction analysis Application pratique de l’analyse de l’interaction sol-structure Chris Haberfield Golder Associates Pty Ltd, Melbourne Australia, [email protected] ABSTRACT: Appropriately conducted SSI analyses are essential for prudent, robust and economical design of a variety of structures including tall towers, large or sensitive (heritage) buildings, retention systems and excavation support, tunnels, dams and bridges. SSI analyses also allow engineers to extrapolate well beyond what has been experienced in the past. Our tools for undertaking SSI analyses have improved significantly over the last two decades. However, perhaps because of the increasing complexity of the tools available and/or the ease at which these tools can be used (or misused) by the inexperienced and experienced alike, the fundamentals of SSI are too often forgotten, and can lead to misguided confidence and both overly conservative and unconservative designs. Through a series of case studies, this paper provides some practical insights into SSI analyses gained from many years of designing foundation systems for a range of structures. Such analyses are undertaken on a daily basis by geotechnical engineers operating out of commercial consulting and design offices. Examples covered include foundations for tall towers and support for deep excavations. RÉSUMÉ: Les analyses des interactions sol-structure (ISS) adéquatement menées sont essentielles pour la conception prudente, robuste et économique d'une variété de structures, y compris les tours hautes, les bâtiments importants ou sensibles (patrimoine protégé), les systèmes de retenue et le support d'excavation, les tunnels, les barrages et les ponts. Les analyses ISS permettent également aux ingénieurs d'extrapoler bien au-delà de ce qui a été connu dans le passé. Nos outils d'analyse ISS se sont considérablement améliorés au cours des deux dernières décennies. Cependant, peut-être en raison de la complexité croissante des outils disponibles et/ou de la facilité avec laquelle ces outils peuvent être utilisés (ou mal utilisés) par les ingénieurs inexpérimentés ou expérimentés, ces principes sont trop souvent oubliés et peuvent mener à une confiance erronée et à des conceptions excessivement conservatrices ou non conservatrices. Cet article, à travers une série d'études de cas, fournit quelques aperçus pratiques sur les analyses ISS acquises depuis de nombreuses années de conception des systèmes de fondations pour une gamme variée de structures. Ces analyses sont effectuées quotidiennement par des ingénieurs géotechniciens opérant à partir de bureaux de conseil et d'études de conception. Parmi les exemples couverts figurent les fondations de tours hautes et le soutien de fouilles profondes. KEYWORDS: Soil structure interaction, case study, tall towers, retention systems. 1 INTRODUCTION The importance of understanding the interaction between a structure and the ground on which it is supported was recognised long ago. Whilst the early pioneers in soil structure interaction (SSI) such as Prof Tschebotarioff had little if any computing tools at their disposal, they identified and developed the basis of modern day SSI. SSI is now widely recognised as a key component of design for a variety of structures including tall towers, large or sensitive (heritage) buildings, retention systems and excavation support, tunnels, dams, bridges and other such structures. Appropriately conducted SSI analyses help to provide key insights into the performance of buildings and other structures which are essential for prudent, robust and economical design of structures. SSI analyses also provide the engineer with a tool to extrapolate well beyond what has been experienced in the past and provides the confidence to push structures well beyond what has been built before, e.g. very tall towers in excess of 500 m. Whilst our tools for undertaking SSI analyses and our understanding of soil and rock behaviour have improved significantly, the fundamentals of SSI remain the same. However, perhaps because of increasing complexity of the tools available and/or the ease at which these tools can be used (or mis-used), these fundamentals are too often forgotten, and can lead to misguided confidence and both overly conservative and unconservative designs. Through a series of case studies, this paper provides some practical insights into SSI analyses gained from many years of designing foundation systems for structures and support systems for excavation and underground openings. Such analyses are undertaken on a daily basis by geotechnical engineers operating out of commercial consulting and design offices. Examples covered will include foundations for tall towers and heritage structures and support for deep excavations. 2 WHAT IS SOIL STRUCTURE INTERACTION Most “structures” whether they are made from timber, concrete, steel, soil or rock (e.g. embankments) are in contact with the ground. This may be because the structure requires support from the ground to maintain serviceability and safety of the structure, e.g a footing system for a building or as support for an embankment. Alternatively, the structure may be required to resist earth or groundwater pressure loads, e.g tunnel linings, retaining walls, culverts, pipes and underground structures. In some applications the ground both supports the structure and also applies load to the structure (e.g. cantilever retaining walls). In all of these applications the performance of the structure is to some extent dependent on the behaviour of the ground. Even for the simplest structures, e.g a flag pole, the behaviour of the ground (e.g. variation in soil properties with depth over the length of embedment of the pole in the ground) can have a significant impact on the reactions (i.e. bending moment, axial force and shear force distributions) in the structure. In some applications, the structure interacting with the ground can comprise several elements, for example an anchored piled retention system comprises piles, anchors and the ground. In this application the structure changes through a number of construction stages (e.g. the piles are installed prior to any excavation, then some excavation is carried out and the upper row of soil anchors is installed and stressed, further excavation is carried out, the next row of anchors is installed, and so on until the excavation is completed to the required depth). The - 81 -
Transcript of Application pratique de l’analyse de l’interaction sol … 2017.pdfProceedings of the 19 th...
Practical application of soil structure interaction analysis Application pratique de l’analyse de l’interaction sol-structure Chris Haberfield Golder Associates Pty Ltd, Melbourne Australia, [email protected] ABSTRACT: Appropriately conducted SSI analyses are essential for prudent, robust and economical design of a variety of structures including tall towers, large or sensitive (heritage) buildings, retention systems and excavation support, tunnels, dams and bridges. SSI analyses also allow engineers to extrapolate well beyond what has been experienced in the past. Our tools for undertaking SSI analyses have improved significantly over the last two decades. However, perhaps because of the increasing complexity of the tools available and/or the ease at which these tools can be used (or misused) by the inexperienced and experienced alike, the fundamentals of SSI are too often forgotten, and can lead to misguided confidence and both overly conservative and unconservative designs. Through a series of case studies, this paper provides some practical insights into SSI analyses gained from many years of designing foundation systems for a range of structures. Such analyses are undertaken on a daily basis by geotechnical engineers operating out of commercial consulting and design offices. Examples covered include foundations for tall towers and support for deep excavations. RÉSUMÉ: Les analyses des interactions sol-structure (ISS) adéquatement menées sont essentielles pour la conception prudente, robuste et économique d'une variété de structures, y compris les tours hautes, les bâtiments importants ou sensibles (patrimoine protégé), les systèmes de retenue et le support d'excavation, les tunnels, les barrages et les ponts. Les analyses ISS permettent également aux ingénieurs d'extrapoler bien au-delà de ce qui a été connu dans le passé. Nos outils d'analyse ISS se sont considérablement améliorés au cours des deux dernières décennies. Cependant, peut-être en raison de la complexité croissante des outils disponibles et/ou de la facilité avec laquelle ces outils peuvent être utilisés (ou mal utilisés) par les ingénieurs inexpérimentés ou expérimentés, ces principes sont trop souvent oubliés et peuvent mener à une confiance erronée et à des conceptions excessivement conservatrices ou non conservatrices. Cet article, à travers une série d'études de cas, fournit quelques aperçus pratiques sur les analyses ISS acquises depuis de nombreuses années de conception des systèmes de fondations pour une gamme variée de structures. Ces analyses sont effectuées quotidiennement par des ingénieurs géotechniciens opérant à partir de bureaux de conseil et d'études de conception. Parmi les exemples couverts figurent les fondations de tours hautes et le soutien de fouilles profondes.
KEYWORDS: Soil structure interaction, case study, tall towers, retention systems.
1 INTRODUCTION
The importance of understanding the interaction between a structure and the ground on which it is supported was recognised long ago. Whilst the early pioneers in soil structure interaction (SSI) such as Prof Tschebotarioff had little if any computing tools at their disposal, they identified and developed the basis of modern day SSI. SSI is now widely recognised as a key component of design for a variety of structures including tall towers, large or sensitive (heritage) buildings, retention systems and excavation support, tunnels, dams, bridges and other such structures. Appropriately conducted SSI analyses help to provide key insights into the performance of buildings and other structures which are essential for prudent, robust and economical design of structures. SSI analyses also provide the engineer with a tool to extrapolate well beyond what has been experienced in the past and provides the confidence to push structures well beyond what has been built before, e.g. very tall towers in excess of 500 m.
Whilst our tools for undertaking SSI analyses and our understanding of soil and rock behaviour have improved significantly, the fundamentals of SSI remain the same. However, perhaps because of increasing complexity of the tools available and/or the ease at which these tools can be used (or mis-used), these fundamentals are too often forgotten, and can lead to misguided confidence and both overly conservative and unconservative designs.
Through a series of case studies, this paper provides some practical insights into SSI analyses gained from many years of designing foundation systems for structures and support systems for excavation and underground openings. Such analyses are undertaken on a daily basis by geotechnical engineers operating
out of commercial consulting and design offices. Examples covered will include foundations for tall towers and heritage structures and support for deep excavations. 2 WHAT IS SOIL STRUCTURE INTERACTION
Most “structures” whether they are made from timber, concrete, steel, soil or rock (e.g. embankments) are in contact with the ground. This may be because the structure requires support from the ground to maintain serviceability and safety of the structure, e.g a footing system for a building or as support for an embankment. Alternatively, the structure may be required to resist earth or groundwater pressure loads, e.g tunnel linings, retaining walls, culverts, pipes and underground structures. In some applications the ground both supports the structure and also applies load to the structure (e.g. cantilever retaining walls). In all of these applications the performance of the structure is to some extent dependent on the behaviour of the ground.
Even for the simplest structures, e.g a flag pole, the behaviour of the ground (e.g. variation in soil properties with depth over the length of embedment of the pole in the ground) can have a significant impact on the reactions (i.e. bending moment, axial force and shear force distributions) in the structure.
In some applications, the structure interacting with the ground can comprise several elements, for example an anchored piled retention system comprises piles, anchors and the ground. In this application the structure changes through a number of construction stages (e.g. the piles are installed prior to any excavation, then some excavation is carried out and the upper row of soil anchors is installed and stressed, further excavation is carried out, the next row of anchors is installed, and so on until the excavation is completed to the required depth). The
- 81 -

Proceedings of the 19th International Conference on Soil Mechanics and Geotechnical Engineering, Seoul 2017
interaction between the various elements of the retention system (and hence actions within the structure) therefore changes during construction and over time following construction (e.g. due to time dependent behaviour of the various elements of the structure).
It is generally possible to undertake analysis of structures in contact with the ground using simplified approaches or structural analysis where the soil is simply treated as support (e.g. footing) or a load to be resisted (soil above a buried structure). This type of analysis may only require geotechnical input to establish reasonable values of soil spring stiffness or loading, for example. Structural engineers would typically carry out this type of analysis, using one of the many widely available structural analysis programs (such as various general purpose frame analysis or finite element analysis programs). As most structures are typically designed to operate in the elastic range, it is common for the structural engineer to use a relatively simple linear elastic analysis methodology. Adjustments can typically be made to take account for modest non-linear effects in the structure (such as creep of concrete) without the need to resort to a full non-linear analysis.
Such analyses will usually result in a conservative estimate of structural actions and performance, but not always. For relatively small and inexpensive structures (e.g. domestic dwellings) this may be practical and cost effective. However, as the structures become larger and more costly (e.g. tall buildings and buried structures), there may be significant economic advantages in considering a more realistic model of the ground and the ground structure interaction effects. Such analyses are referred to as foundation structure interaction analysis or more generally as soil structure interaction (SSI) analysis.
In SSI, the analysis method needs to incorporate all major aspects of the soil and the structural components that make up the structure. All of these components need to be modelled in a realistic manner (for the range of expected behaviour). This includes changes to the structure through various stages of construction and changes in ground and structure properties over the service life of the structure. Whilst structural components are typically designed to remain in the elastic range, their properties can change with time and loading (for example through creep or cracking). The behaviour of the ground is usually far more complex as the ground is variable and can exhibit non-linear and inelastic behaviour at low load levels as well as have properties that vary with time, load history, stress level and other factors. For this reason, it is common for the modelling of the ground to incorporate some degree of non-linearity which takes account of the variability, shear strength and compressibility of the ground, and other interdependencies.
The variable behaviour of soil and rock has resulted in the development of a large number of “soil models”. These models attempt to simulate a range of observed non-linearities in the soil behaviour. The selection of the most appropriate soil model to use for an analysis, the material parameters to use for the soil and the analyses themselves require experienced and expert geotechnical knowledge.
Because the most complex part of SSI analyses typically relates to the modelling of the soil, and the main non-linear effects relate to soil behaviour and the staging of construction as soil is added to or removed from the construction, specialist programs for carrying out SSI analyses have been developed and are widely used by geotechnical engineers. These programs are usually based on finite element (e.g. PLAXIS) or finite difference analysis methods (e.g. FLAC), but can incorporate boundary elements and other numerical techniques. These specialist programs have a particular focus on the modelling of the soil and groundwater, on the highly non-linear nature of the problem, and
on the need to construct and analyse the model in stages which reflect the proposed actual stages of construction and loading.
Soil-structure interaction analyses require both geotechnical and structural input, including for the development of the various analysis inputs, and for the assessment and interpretation of the analysis results. Quite often this requires the geotechnical and structural engineers to work closely together, with each providing knowledge and experience with respect to the ground and structure respectively.
3 KEY FEATURES OF SSI ANALYSIS
3.1 Complexities of SSI analysis
The complexities of SSI analysis are illustrated below using an example of a precast concrete arch culvert buried under deep fill. The analysis of such structures incorporates many of the aspects mentioned above.
Consider the example of two concrete arches (culverts) that are to be constructed within a deep shaft in competent ground as shown in Figure 1. Following placement of the arches, the shaft or trench is backfilled with compacted gravel (crushed rock – coloured green in Figure 1) around the arches and then compacted clay (coloured yellow in Figure 1) above. Such a situation may arise when extending tunnels through TBM access shafts. A similar problem arises in providing access in trenches beneath high earth or rockfill embankments (e.g. dams).
Figure 1. Arches constructed in a deep shaft (only half of problem modelled – symmetry about left hand side).
A simplistic approach to analyzing the structural actions in the arch could be using a structural analysis package by applying calculated vertical and horizontal pressures to each arch (see Figure 2) which are equivalent to the calculated vertical and horizontal earth pressures acting on the arch under the full weight of the trench backfill and the overlying embankment. This effectively models the backfill as applying a load to the arches and ignores the changes in geometry and behaviour of the backfill and the arches during construction. This is in fact a very poor simulation of the reality and could, depending on the situation and assumptions made, result in calculated actions and performance that could range from over-conservative to unconservative. Whilst both result in excessive cost, an unconservative design could also be catastrophic.
- 82 -
Honours Lectures / Discours Honoraire
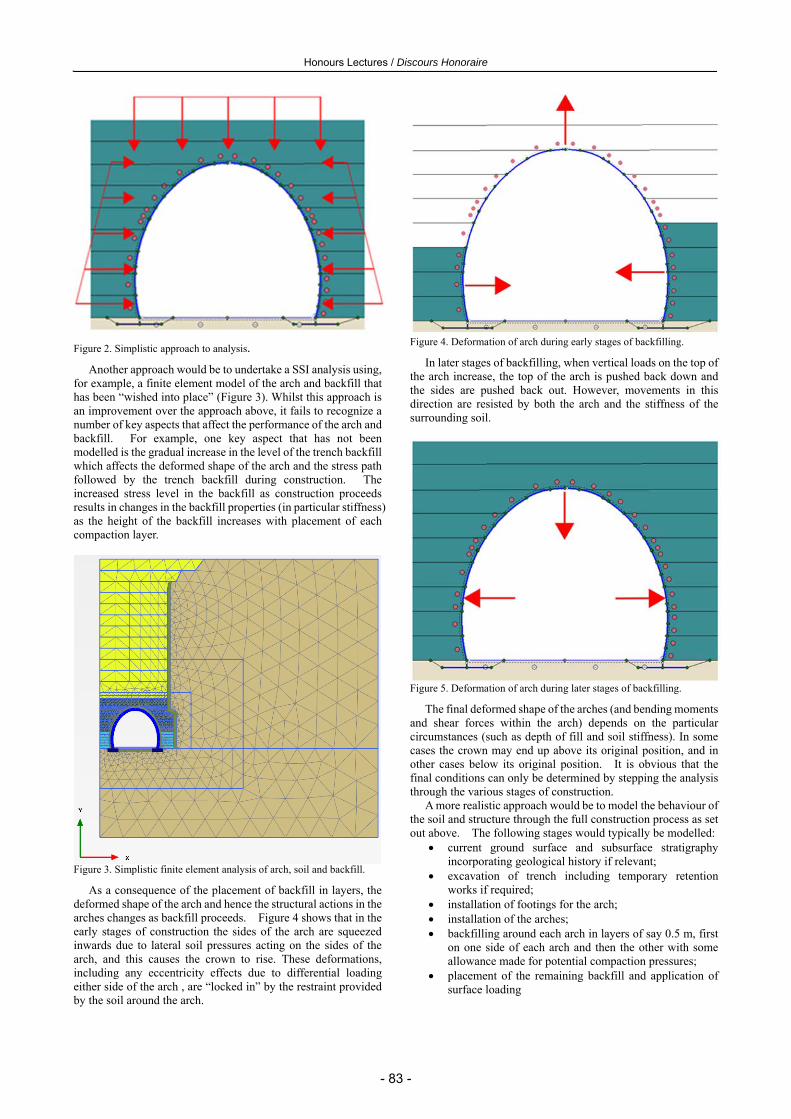
Figure 2. Simplistic approach to analysis.
Another approach would be to undertake a SSI analysis using, for example, a finite element model of the arch and backfill that has been “wished into place” (Figure 3). Whilst this approach is an improvement over the approach above, it fails to recognize a number of key aspects that affect the performance of the arch and backfill. For example, one key aspect that has not been modelled is the gradual increase in the level of the trench backfill which affects the deformed shape of the arch and the stress path followed by the trench backfill during construction. The increased stress level in the backfill as construction proceeds results in changes in the backfill properties (in particular stiffness) as the height of the backfill increases with placement of each compaction layer.
Figure 3. Simplistic finite element analysis of arch, soil and backfill.
As a consequence of the placement of backfill in layers, the deformed shape of the arch and hence the structural actions in the arches changes as backfill proceeds. Figure 4 shows that in the early stages of construction the sides of the arch are squeezed inwards due to lateral soil pressures acting on the sides of the arch, and this causes the crown to rise. These deformations, including any eccentricity effects due to differential loading either side of the arch , are “locked in” by the restraint provided by the soil around the arch.
Figure 4. Deformation of arch during early stages of backfilling.
In later stages of backfilling, when vertical loads on the top of the arch increase, the top of the arch is pushed back down and the sides are pushed back out. However, movements in this direction are resisted by both the arch and the stiffness of the surrounding soil.
Figure 5. Deformation of arch during later stages of backfilling.
The final deformed shape of the arches (and bending moments and shear forces within the arch) depends on the particular circumstances (such as depth of fill and soil stiffness). In some cases the crown may end up above its original position, and in other cases below its original position. It is obvious that the final conditions can only be determined by stepping the analysis through the various stages of construction.
A more realistic approach would be to model the behaviour of the soil and structure through the full construction process as set out above. The following stages would typically be modelled:
current ground surface and subsurface stratigraphy incorporating geological history if relevant;
excavation of trench including temporary retention works if required;
installation of footings for the arch; installation of the arches; backfilling around each arch in layers of say 0.5 m, first
on one side of each arch and then the other with some allowance made for potential compaction pressures;
placement of the remaining backfill and application of surface loading
- 83 -

Proceedings of the 19th International Conference on Soil Mechanics and Geotechnical Engineering, Seoul 2017
To obtain reasonable results, an appropriate soil model and properties need to be adopted. In this application it may be necessary to adopt a soil model that simulates the change in void ratio and stiffness of the backfill as the overburden pressure on the backfill increases (e.g. a modified Cam Clay model or similar instead of a Mohr-Coulomb model). It may also be necessary to consider time dependent effects such as creep and consolidation or changes in the properties of the structure (e.g. cracked or uncracked section modulus for concrete and masonry).
It is clear from this example, that to obtain reasonable estimates of the deformation and structural actions in the arch requires an understanding not only of the soil and structure properties but also of the construction stages. Only if the whole process is modelled can the performance of the structure through construction and during service be reasonably assessed and designed. 4 RAPID EVOLUTION OF SSI
Computer based tools for undertaking SSI analyses have evolved rapidly over the last decade or so. This can be illustrated by the rapid development of sophisticated three dimensional tools used to undertake SSI analysis of buildings.
For some time, structural engineers have understood the importance of understanding the vertical and lateral response of footings supporting the buildings they are designing. This is because the internal actions (bending moments and shear forces) within structural frames are highly dependent on the performance of the footing system, both in respect to isolated footing performance and group effects.
Up until fairly recently, structural engineers took this into account in their structural analysis of the building frame by modelling the footings as springs (Winkler or sub-grade reaction model), usually assuming a constant stiffness which was provided by the geotechnical engineer. However this approach provides an inaccurate model of the footing performance, and ignores any interaction effects between footings and group effects of the footing system as a whole.
Unfortunately this approach is still adopted by many structural engineers and is often not questioned by geotechnical engineers, even for iconic type buildings. For example, on one very tall tower project in the Middle East, a structural engineer presented the results of their piled raft analysis which indicated very low bending moments in the raft. On questioning it was revealed that they had used constant spring stiffness values across the piled raft, resulting in almost no “dishing” of the piled raft and a gross underestimate of differential settlements across the raft. As a consequence of inaccurate differential settlement estimates, the calculated internal actions in the raft and structural frame were grossly in error. The engineering team involved had no concept of the limitations of this simplistic approach.
The author has also been asked many times by both structural and geotechnical engineers what value of subgrade reaction should be adopted as the reference books all give different values. My reply has always been – none of them.
It is clear from these experiences that there are many structural and geotechnical engineers who do not understand the limitations of subgrade reaction theory, do not understand the difference between modulus of subgrade reaction (which applies to a 300 mm square plate) and spring stiffness (which applies to a footing of any type or size) and who have the misconception that spring constants are a soil property. Spring constants for a pad footing or pile for example, defined as load divided by displacement, depend upon many factors including geometry, scale, load magnitude and duration and soil properties. Spring stiffness values will also vary for the same footing with location across the foundation system (for example) and with each load
case. Fortunately, this situation appears to be improving, with most
SSI analysis of tall buildings being based on more rational approaches involving advanced numerical modelling (e.g. non-linear finite element) approaches.
The most common approach is for the analysis of the footing system (including raft and retention system) and ground to be undertaken by a geotechnical engineer using geotechnical engineering software packages (e.g. PLAXIS and FLAC) with estimates of loads provided by the structural engineer. The outputs from these analyses include estimates of settlements, pile and raft reactions (bending moments, shear forces and axial loads as appropriate) and spring stiffness values for each footing element (e.g. pile or shallow footing) and every load case. For rafts (or footings of larger plan dimension), the calculated spring stiffness values will likely vary across the raft. The spring stiffness values are simply calculated by dividing the column loads (or footing/raft bearing pressures) by the calculated displacements from the analysis. Armed with this information, the structural engineer can then update his estimate of spring stiffness for each footing element and rerun the structural frame analysis to obtain revised column loads and settlement estimates. This needs to be done for each critical load case. The output from this analysis includes estimates of settlement and column loads. The aim of the structural analysis is to match as closely as practical the estimates of settlement from the geotechnical analysis. This will usually require the structural engineer adjusting the spring stiffness values obtained from the geotechnical engineer, until a reasonable match between calculated settlements of the structural and geotechnical analyses is obtained. The revised column loads are then provided back to the geotechnical engineer and the process repeated. This iterative process converges rapidly, with only two or perhaps three iterations required.
Whilst this process is somewhat cumbersome, it provides a reasonable estimate of likely building performance in a reasonable time without requiring large computing resources. It requires close interaction between the structural and geotechnical engineers and allows each engineer to concentrate on their area of expertise. It also allows more detailed modelling of the interaction between the ground and the footing system which may not be possible if the ground, footing system and building structure are modelled in the one analysis. This approach was used for the design of the Nakheel Tower described later in this paper.
An alternative approach is to model the ground, footing system and entire building structure in one analysis. Some impressive examples of such analyses are provided in Ulitsky et al (2012). Ulitsky et al. utilize this approach very effectively to understand the damage to fragile heritage structures from ground movements and thereby assisting in the development of practical remediation and protection measures. The basis of the computational approach is described in Ulitsky et al. (2003).
Whilst the advantages of this all-inclusive approach are obvious, significant time is required to develop, check and extract results from the analysis. With further development and increasing commercial availability, it is likely that such all-inclusive approaches may become common. However, at the current time, the use of such approaches may, for many projects, be too costly and impractical to undertake in the short time frames that are commonly available for design of such structures.
As the SSI tools develop, they inevitably become more sophisticated than our ability to obtain soul design parameters and become more complex and difficult to check. There also is a tendency to believe the results of the analysis without undertaking the required checks or calibrating against known performance. Engineers undertaking SSI analysis must be
- 84 -

Honours Lectures / Discours Honoraire
vigilant and not fall into this trap. SSI analysis is a useful design tool, but if not used appropriately, can result in inappropriate design and failures.
Figure 6. SSI modelling of structure, ground and footings (After Ulitsky et al. (2012)). 5 COMPARISON OF OLD AND NEW SSI ANALYSES
As set out above, the development of computer based SSI tools has advanced significantly over the last decade or so and there are now a range of sophisticated two and three dimensional software packages available that can model a wide variety of SSI problems. However before these tools became available, engineers had to make assessments of SSI problems using other, and often significantly simple computational techniques. The example set out below compares one such simplified method with a modern day three dimensional analysis of a residential tower for which there were concerns regarding the settlement performance of the piled footings for the building. The analyses undertaken at the time are described first followed by a current day three dimensional finite element analysis.
5 .1 Background
A redevelopment of the south bank of the Yarra River in Melbourne starting in the late 1990’s comprised eight multi-level residential towers and a number of other related structures. Two of the towers, Tower 2 (20 levels with a six level podium) and Tower 3 (31 levels with a six level podium) experienced problems with their piled foundations.
The geology at the site comprises alluvial deposits over siltstone bedrock at about 37m depth. The subsurface stratigraphy can be described as about 2 m fill overlying 25m of soft grading to stiff marine clay (CIS), over 3m to 7m of dense to very dense sand (MSG) and/or very stiff clay and very dense gravel (WF) overlying 3.5m to 6m of stiff to very stiff clay (US) overlying siltstone. Ground water level is at about 2 m depth. At the very eastern end of the site (near Tower 2), a thin layer of basalt rock overlies the WF.
The buildings have a total footprint of about 120 m by 50 m and comprise two heavily loaded tower structures surrounded by a more lightly loaded podium. There is no basement, but excavations up to 4 m depth in fill and soft clay were required for
the lift overrun pits. Preliminary design calculations indicated that for
serviceability considerations, the towers should be supported on piles founding in the siltstone. The preferred piling solution for the towers was for the main columns and central core to be supported on large diameter bored piles socketed up to about 10 m into the siltstone. The more lightly loaded podium structures could be founded on smaller diameter CFA piles or driven piles founding in the MSG, basalt or WF.
Several piling contractors proposed alternative driven or jacked segmental precast pile foundation solutions which comprised groups of 350 mm and 400 mm square precast concrete piles driven to refusal in the top of the siltstone. The driven or jacked pile solution potentially provided a more cost effective approach both in terms of cost and construction time, but presented greater risk if driven piles were not able to penetrate through the MSG to the siltstone. The piling contractor was confident that they would be able to penetrate through the MSG and WF and found in the siltstone and carried out preliminary driving tests to confirm this. The tests proved successful and a driven pile solution was subsequently adopted.
Following installation of the precast piles for the Towers, excavation of the lift overrun pits was carried out. The unsupported battered excavation in the fill and soft clay resulted in significant lateral movement of the piles (in excess of 400 mm) at some locations. As a result, there was a significant risk that the moment capacity of the piles had been exceeded and the durability of a significant number of installed piles was considered unsatisfactory. New piles were installed to replace piles that had been assessed to be unsatisfactory.
Towards the completion of installation of the additional piles in 2001, a review of as-built pile founding levels showed that a significant number of the piles for both Towers 2 and 3 had not penetrated through the MSG and WF as was expected by the piling contractor which formed the basis of their pile design. The load from the Towers would therefore be directly applied to the stiff to very stiff clay of the US underlying the toe of the piles, thereby creating a significant risk that the settlement of the Tower structures would be unacceptable and remedial action would be required. The developer requested that detailed analyses be undertaken to provide a best estimate of the likely settlement of the as-constructed tower foundations under the full building loads, and to assess the effectiveness of any remedial actions proposed by the piling contractors.
5 .2 Assessment of settlement
Preliminary estimates of global settlement of the installed piled footings using standard elastic solutions for a flexible footing (spanning the footprint of the towers) indicated that the settlement of Tower 3 would probably be excessive and the settlement of Tower 2 was at best marginal. More accurate estimates of settlement were therefore required to assess what form of remedial action, if any, was required to reduce settlement of the towers to an acceptable level.
To obtain a best estimate of settlement, it was considered necessary that the following aspects of the problem be modelled as accurately as possible:
the subsurface stratigraphy the different founding levels of the piles within each pile
cap the loads applied to each pile cap the interaction between piles in each cap the three dimensional geometry of the foundation the interaction between pile caps the consolidation and creep characteristics of the US the increase in effective stress and variation of this
- 85 -

Proceedings of the 19th International Conference on Soil Mechanics and Geotechnical Engineering, Seoul 2017
increase with depth and location within the US negative skin friction on the piles due to settlement of the
soft clay In particular, it was recognised that the major component of
settlement resulted from consolidation and creep of the US below the piles. It was essential that to obtain an accurate estimate of settlement, the analysis method must be able to include the effects of creep and consolidation of this layer. Good data on the consolidation and creep properties of the US were therefore required. As this was not of primary concern for piles founding in rock, no site specific information on these parameters was available. As a result further boreholes were drilled and samples of the US clay recovered and tested in one dimensional consolidation. In addition piezo cone testing was undertaken including pore pressure dissipation testing.
Various analysis packages available at the time were considered for calculating the settlement of the as constructed foundations. However, none of these packages could satisfactorily model all of the aspects listed above without major simplifying assumptions and as a result, confidence in the results obtained would have been low. For example, consideration was given to using the pile group analysis program DEFPIG (Poulos, 1990) but it was found to be unsatisfactory as it did not appear to give reasonable results when a soft layer was present below the toe of the piles. General two-dimensional numerical packages such as FLAC (ITASCA, 2000) and finite element codes were considered to be unsuitable due to the three dimensional aspects of the problem.
A hybrid approach was finally adopted. In this approach FLAC was used to model the behaviour of individual pile groups and to obtain the distribution of vertical effective stress throughout the US. An EXCEL (Microsoft, 1997) spread sheet was then used to model the interaction between pile groups and to calculate the total change in effective vertical stress in the US. One-dimensional consolidation theory was used to assess consolidation settlements from the change in vertical effective stress. Creep settlements were also estimated assuming a linear log-time settlement response. Details of this approach are set out below.
Using the results of the FLAC analyses, the variation in vertical effective stress with radius from the centre of each pile group was determined for the top, middle and bottom of the US layer. The variations of vertical stress with radius were normalised with respect to pile group radius and the applied loads. For each size of pile group, sixth order polynomials were fitted to the vertical stress variation with radius obtained for the middle of the US layer. These polynomials were subsequently used to calculate the vertical effective stress distribution in the US below each pile group supporting the two towers.
The FLAC solutions were checked by assuming the pile groups were a circular elastic footing resting on the top of the MSG and used an elastic finite layer program (FLEA) (Small and Booker, 1995) to assess the vertical effective stress change with radius at the centre of the US layer. The consistency that was obtained between the FLAC and FLEA distributions confirmed that a large proportion of the load applied to the top of the piles is carried by base resistance at the toe of the piles. This causes a higher concentration of stress within the US beneath the pile group than would be expected from elastic analyses using pile group programs such as DEFPIG.
An EXCEL spreadsheet was developed which contained the (x, y) coordinates (in plan) of the centre of every pile group (including single piles) for both Tower 2 and Tower 3. The centre to centre distances of each group to every other group were calculated. The vertical stress in the US at each pile group location due to all other pile groups was then calculated by using the appropriate stress polynomial and the load and diameter of
each pile group. The distribution of vertical stress in the US at each pile group
location was then estimated by summing all of the stress contributions for that group. A contour plot of the estimated increase in vertical stress at the middle of the US is shown in Figures 7 and 8 for Towers 2 and 3 respectively. Column locations and identification numbers are shown in both figures. For Tower 3, the increase in vertical stress in the vicinity of the core was estimated to be in the order of 500 kPa. Based on the results of the oedometer tests, this stress increase is sufficient to load the US to near to its preconsolidation pressure. (The initial effective stress in the US was estimated to be about 250 kPa. The addition of 500 kPa increases the final effective stress to 750 kPa).
Figure 7. Contours of calculated increase in vertical stress at mid-height of US (Tower 2).
Figure 8. Contours of calculated increase in vertical stress at mid-height of US (Tower 3).
The settlement at each pile group was obtained by applying the one dimensional compresssion curve for the US obtained from the oedometer testing. Settlement estimates were made for the short term (which included 1 log cycle of creep) and the long-term (which included 3 log cycles of creep). Settlements were calculated assuming a one-dimensional model. Consideration of the size of the loaded area with respect to the thickness of the US indicates that a one-dimensional approach appears reasonable as the US is a relatively thin layer in close proximity to the base of the piles. Nevertheless, the one-dimensional approach adopted may slightly over-estimate settlements. Comparison of the results of FLEA analyses with one dimensional analyses indicated the settlements estimated
-30 -20 -10 0 10 20 30
-10
0
10
20
30
40
12
14
15
16
1718
19
27
38
39
40
41
42
44
51
52
53
54
55
56
65
66
67
6869
70
95 96 97
98 99
108 109
116
144
146 147 303
305 306 307 308
310 311
312
400
401
402403
404405
406
407
408
409
410411
412413414
415
416
417
418419
420
421
422423424
425426
427
428429430
431
432433
434435
436437
438439440
441442443444
445446
447448
449450
451452
453454455
456
457
458
459460 Core RAFT 6 & 7
-30 -20 -10 0 10 20 30
-10
0
10
20
30
40
10 20 30 40 50 60 70
10
20
30
40
Raft 1a
C211 C204C107
C145 C21
C214C212
C31 C32 C33C202 C34 C35
C43 C207 C101 C100
C102 C47 C48 C49
C59 C60
C143
C61 C62 C63
6B2
5B1
6B3
RAFT1B
C1 C2 C3 C5 C6 C7C7A C7B C9 C10 C11 C12
C106C22
RAFT3
RAFT4 C25 C26 C27
C103
C29C30
C142C104
C45 C46
C36 C37 C38
C50 C51
FW2
FW3
C1302C1
C64 C65
3A 545546 549 552 553488
491581
742 743 744
481474
475
255
7931 32 3334 35 36 37 38 39 40 4142 46 4748735 49 50 51 52 53
5
473
80 45
492
10 20 30 40 50 60 70
10
20
30
40
- 86 -

Honours Lectures / Discours Honoraire
using the one dimensional analyses should be reduced by between 20% and 25%.
Allowance was also made within the spreadsheet for settlement of the MSG and siltstone, as well as for pile shortening.
Contour plots showing estimated end-of-construction settlements (with settlement values reduced by 20% to account for 3-D effects) are shown in Figures 9 and 10 for Towers 2 and 3 respectively. Long term settlement estimates were about 20 % higher than the end-of-construction values. On the basis of these settlement estimates, it was decided that Tower 2 would not require any remedial foundation works. However, the estimated settlements for Tower 3 were considered to be too high, and remedial foundation works were deemed to be necessary.
Independent analysis to estimate the potential settlement of the two towers was also undertaken independently by another engineering company using a completely different approach. The results of its analysis were reasonably consistent with those presented above, confirming that remedial works were required for Tower 3 and not for Tower 2. Figure 9. Contours of calculated end-of-construction settlement
(Tower 2).
Figure 10. Contours of calculated end-of-construction settlement (Tower 3).
5 .3 Remedial works for Tower 3
Several remedial actions were considered including installation of additional piles to rock, preloading of foundations, removal of soil support, spanning between pile groups with a raft and jet grouting. The solution finally adopted was to supplement a number of the more heavily loaded footings with steel H-piles driven to refusal in the siltstone. It was assessed that by
installing H-piles the increase in vertical stress experienced by the US due to construction of Tower 3 could be reduced, thereby reducing settlements.
However, several geotechnical issues still required resolution, including
could H-piles be driven hard enough to penetrate to the siltstone?
how many H-piles are required and at which columns? how could the interaction between H-piles and the
existing floating footings (pile groups) be assessed and what is the proportion of load carried by each. Would the H-piles be over stressed as they are founded on rock?
how is the interaction between adjacent footings which may or may not contain H-piles to be assessed?
how can the composite H-pile/floating footings be analysed so there is sufficient confidence in the estimated performance?
what impact does variability in the thickness and properties of the various soil units have on the assessed performance of the composite footings?
The piling contractor carried out pile driving tests in several areas already densely populated with existing precast piles to confirm that the H-piles would penetrate to the siltstone. The installed H-piles were dynamically tested and the results analysed using CAPWAP to assess their load-settlement characteristics. The load versus settlement curves obtained from the CAPWAP analyses were analysed to obtain estimates of secant pile stiffness. Stiffness values varied with load level and from pile to pile with values between about 0.12 MN/mm and 0.16 MN/mm being obtained.
The settlement performance of the composite footings was modelled by modifying the EXCEL spreadsheet described earlier to account for the presence of H-piles within individual footings. This was achieved by the following iterative process:
1. The stresses and settlements within the US were calculated using the spreadsheet analysis and ignoring the presence of the H-piles.
2. The stiffness of each (floating) footing was assessed by dividing the load applied to the footing by the calculated footing settlement.
3. For footings that contained H-piles and/or existing precast piles to rock, a new total footing stiffness was calculated by modelling the floating footing and the H-piles and precast piles as springs acting in parallel.
4. The proportion of column load carried by the floating footing, H-piles and precast piles was calculated according to the ratio of their individual stiffness values to the total stiffness of the composite footing.
5. The loads applied to the floating footings were corrected to their new (reduced) values and the vertical stress in the US calculated. The settlement of the floating footings were then calculated.
6. The steps 2 to 5 were then repeated until convergence was obtained.
The above calculation process was set up within EXCEL so that it ran automatically without the need for user intervention. Typical input and run times per analyses were less than 5 minutes. The process converged rapidly and provided estimates of vertical stresses in the US, settlement at every footing location and loads in the H-piles. Figure 11 shows contours of the increase in vertical stress at the mid-height of the US due to the footing loads for an analysis that includes 76 H-piles. Figure 12 shows contours of estimated short-term settlement for the same analysis. Maximum H-pile load was estimated to be 2.7 MN in the short-term and 3.3 MN in the long-term which were satisfactory with respect to long-tem durability and structural requirements.
Using this calculation process it was possible to rapidly assess
Raft 1a
C211 C204C107
C145 C21
C214C212
C31 C32 C33C202 C34 C35
C43 C207 C101 C100
C102 C47 C48 C49
C59 C60
C143
C61 C62 C63
6B2
5B1
6B3
RAFT1B
C1 C2 C3 C5 C6 C7 C7A C7B C9 C10 C11 C12
C106C22
RAFT3
RAFT4 C25 C26 C27
C103
C29C30
C142C104
C45 C46
C36 C37 C38
C50 C51
FW2
FW3
C1302C1
C64 C65
3A 545546 549 552 553488
491581
742 743 744
481474
475
255
79
31 32 3334 35 36 37 38 39 40 4142 46 4748735 49 50 51 52 53
5
473
80 45
492
10 20 30 40 50 60 70
10
20
30
40
10 20 30 40 50 60 70
10
20
30
40
12
14
15
16
1718
19
27
38
39
40
41
42
44
51
52
53
54
55
56
65
66
67
6869
70
95 96 97
98 99
108 109
116
144
146 147 303
305 306 307 308
310 311
312
400
401
402403
404405
406
407
408
409
410411
412413414
415
416
417
418419
420
421
422423424
425426
427
428429430
431
432433
434435
436437
438439440
441442443444
445446
447448
449450
451452
453454455
456
457
458
459460 Core RAFT 6 & 7
-30 -20 -10 0 10 20 30
-10
0
10
20
30
40
-30 -20 -10 0 10 20 30
-10
0
10
20
30
40
- 87 -

Proceedings of the 19th International Conference on Soil Mechanics and Geotechnical Engineering, Seoul 2017
a wide range of variables. In particular, it provided a rapid method to assess the impact of the following parameters:
Number and location of H-piles H-pile stiffness Variability in the thickness and properties of the US and
MSG The final H-pile configuration that was adopted included 73
H-piles spread over 26 footings. The calculated results shown in Figures 11 and 12 are for this configuration.
Independent analysis to estimate the potential settlement of Tower 2 remediated with H-piles was also undertaken independently by another engineering company, again using a completely different approach. The results of its analysis were reasonably consistent with those presented above. This gave confidence that the proposed remedial solution would likely be satisfactory.
Figure 11. Vertical stress increase at mid-height of US following installation of H-piles (Tower 3).
Figure 12. Calculated end-of-construction settlement following installation of H-piles (Tower 3).
5 .4 Calculation versus measured performance
The settlement of selected columns was monitored throughout construction of both towers. Figure 13 shows a contour plot of measured settlements at the end of construction of Tower 2. These can be compared to the estimated settlements shown in Figure 9. The column location and numbers are indicated on the contour plots. The maximum settlements that have been measured are in the vicinity of Columns 55 and 56. Measured settlements were about 35 mm. Estimated settlement at these locations was about 24 mm to 28 mm. The difference between estimated and measured settlements for these two columns can be attributed to heave of the precast piles following driving of adjacent piles. Most of the precast piles were restruck following installation of the H-piles and before pouring of the pile cap to minimise the effects of pile heave. Measured heave
for piles that were restruck varied between 0 mm and 16 mm. However, at columns 55 and 56 it was not possible to restrike the piles as the pile cap had already been poured.
The settlement increase per tower level in the most heavily loaded columns was less than about 1.5 mm per level. The estimated column settlement increases per level generally agreed well with the observed values. However for some column locations (e.g. columns 55 and 56) observed settlement increases per level are slightly higher than were estimated.
Monitoring of settlements also occurred at Tower 3. In general the measured settlements up until Level 17 (after which monitoring data was no longer available) agreed closely with estimated values. Measured settlement rates varied between 0.1 mm per level for the lightly loaded columns to 0.7 mm per level for the most heavily loaded columns.
Figure 13. Measured end-of-construction settlement (Tower 2).
5 .5 Calculated performance using 3D PLAXIS
The SSI analysis packages available today are much more advanced than they were in 2001 when the above analysis was undertaken. If this problem was considered in 2017, it is likely that a three dimensional numerical modelling package, such as PLAXIS 3D would be utilized rather than the simple spreadsheet analysis described above. It is of interest to compare the results from the analyses set out above with those from a three dimensional SSI numerical modelling package such as PLAXIS 3D. The results of a PLAXIS 3D analysis of Tower 3 with and without remedial H-piles are presented below.
A plan of the PLAXIS 3D model is shown in Figure 14. To reduce the complexity of the model, not all footings were modelled. A total of 330 piles (comprising 277 No. 350 mm x 350 mm square precast concrete piles and 53 steel H piles)) were included in the model in the installed configuration shown by the squares and crosses respectively in Figure 14. All of the precast piles were founded in the MSG, whilst all H piles were founded in the siltstone.
Raft 1a
C211 C204C107
C145 C21
C214C212
C31 C32 C33C202 C34 C35
C43 C207 C101 C100
C102 C47 C48 C49
C59 C60
C143
C61 C62 C63
6B2
5B1
6B3
RAFT1B
C1 C2 C3 C5 C6 C7 C7A C7B C9 C10 C11 C12
C106C22
RAFT3
RAFT4 C25 C26 C27
C103
C29C30
C142C104
C45 C46
C36 C37 C38
C50 C51
FW2
FW3
C1302C1
C64 C65
3A 545546 549 552 553488
491581
742 743 744
481474
475
255
79
31 32 3334 35 36 37 38 39 40 4142 46 4748735 49 50 51 52 53
5
473
80 45
492
10 20 30 40 50 60 70
10
20
30
40
10 20 30 40 50 60 70
10
20
30
40
12
14
15
16
1718
19
27
38
3940
41
42
44
51
52
53
5455
56
65
66
6768
69
70
95 9697
98 99
108 109
116
144
146 147 303
305 306 307 308
310311
312
400
401402
403
404 405
406
407
408409
410411
412413414
415416
417
418419 420
421
422423424
425426
427
428429430
431
432433
434435
436437
438439440
441442443444445
446447
448449
450451452
453454455
456
457
458
459460 Core RAFT 6 & 7
-30 -20 -10 0 10 20 30
-10
0
10
20
30
40
-30 -20 -10 0 10 20 30
-10
0
10
20
30
40
- 88 -
Honours Lectures / Discours Honoraire
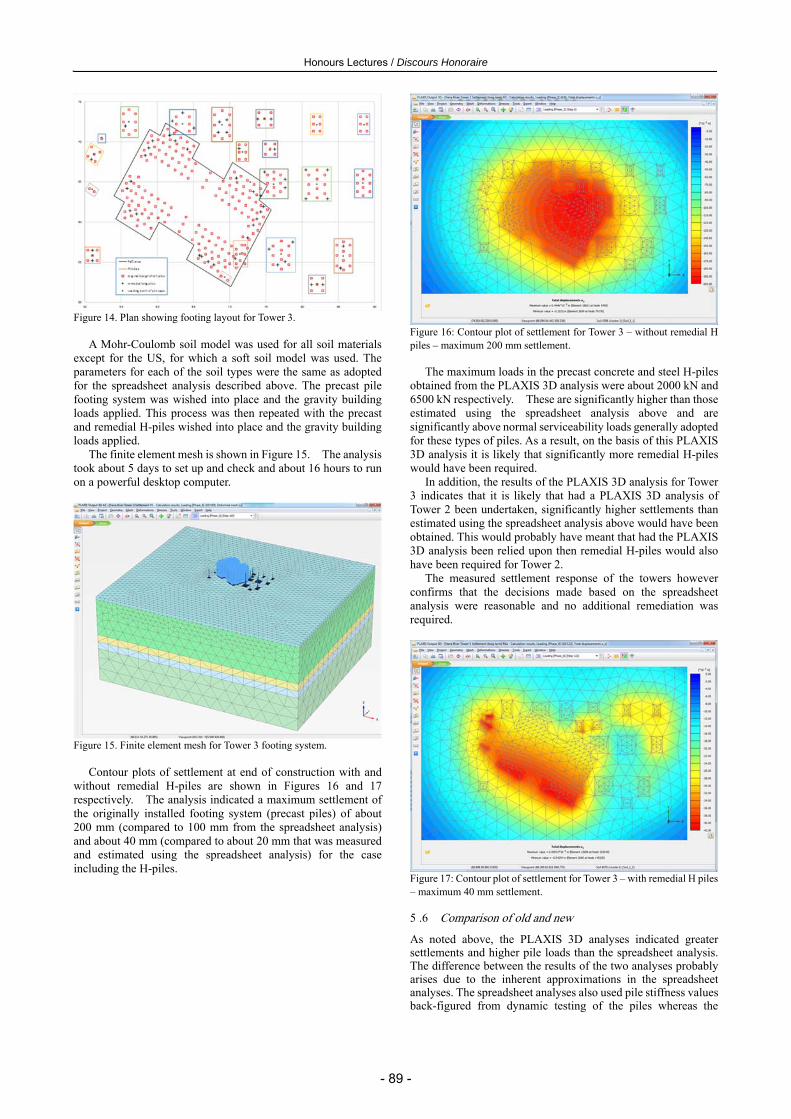
Figure 14. Plan showing footing layout for Tower 3.
A Mohr-Coulomb soil model was used for all soil materials
except for the US, for which a soft soil model was used. The parameters for each of the soil types were the same as adopted for the spreadsheet analysis described above. The precast pile footing system was wished into place and the gravity building loads applied. This process was then repeated with the precast and remedial H-piles wished into place and the gravity building loads applied.
The finite element mesh is shown in Figure 15. The analysis took about 5 days to set up and check and about 16 hours to run on a powerful desktop computer.
Figure 15. Finite element mesh for Tower 3 footing system.
Contour plots of settlement at end of construction with and
without remedial H-piles are shown in Figures 16 and 17 respectively. The analysis indicated a maximum settlement of the originally installed footing system (precast piles) of about 200 mm (compared to 100 mm from the spreadsheet analysis) and about 40 mm (compared to about 20 mm that was measured and estimated using the spreadsheet analysis) for the case including the H-piles.
Figure 16: Contour plot of settlement for Tower 3 – without remedial H piles – maximum 200 mm settlement.
The maximum loads in the precast concrete and steel H-piles obtained from the PLAXIS 3D analysis were about 2000 kN and 6500 kN respectively. These are significantly higher than those estimated using the spreadsheet analysis above and are significantly above normal serviceability loads generally adopted for these types of piles. As a result, on the basis of this PLAXIS 3D analysis it is likely that significantly more remedial H-piles would have been required.
In addition, the results of the PLAXIS 3D analysis for Tower 3 indicates that it is likely that had a PLAXIS 3D analysis of Tower 2 been undertaken, significantly higher settlements than estimated using the spreadsheet analysis above would have been obtained. This would probably have meant that had the PLAXIS 3D analysis been relied upon then remedial H-piles would also have been required for Tower 2.
The measured settlement response of the towers however confirms that the decisions made based on the spreadsheet analysis were reasonable and no additional remediation was required.
Figure 17: Contour plot of settlement for Tower 3 – with remedial H piles – maximum 40 mm settlement.
5 .6 Comparison of old and new
As noted above, the PLAXIS 3D analyses indicated greater settlements and higher pile loads than the spreadsheet analysis. The difference between the results of the two analyses probably arises due to the inherent approximations in the spreadsheet analyses. The spreadsheet analyses also used pile stiffness values back-figured from dynamic testing of the piles whereas the
- 89 -
Proceedings of the 19th International Conference on Soil Mechanics and Geotechnical Engineering, Seoul 2017
PLAXIS 3D analyses assumed pile shaft and base resistance values and allowed the analysis to calculate pile stiffness. It is likely that calibration of individual pile performance in the PLAXIS 3D analysis to match measured pile performance would have resulted in a better match between measured performance and calculated performance of the tower using PLAXIS 3D. This indicates the importance of calibrating SSI analysis against measured performance. In the author’s experience, as SSI tools have become more advanced, it appears that engineers more readily accept the results of such analysis without undertaking the necessary checks, calibration against measured results and sensitivity studies to understand potential variations in performance due to variation in properties and other inputs into the analysis.
Although the two forms of analysis gave different results, both analyses indicated that remedial action was required for Tower 3. However the extent of the remediation required varied significantly depending on the type of analysis undertaken.
The effort required to analyse a suitable remedial solution also depended on the form of analysis adopted. The spreadsheet and PLAXIS 3D analyses took about the same time to set up. However the spreadsheet analysis was considerably quicker to change input and to re-run (about 5 mins) compared to the PLAXIS 3D analysis (about 24 hours). The spreadsheet analysis was very efficient for assessing different H-pile configurations (location and number) and assessing the impact of US properties and thickness, with each analysis only taking about 5 minutes. The PLAXIS 3D analysis however is very cumbersome in this regard, taking 24 hours for each run.
A PLAXIS 3D analysis is not particularly conducive for investigating the impact of variations in input. As a result, the variation in properties, stratigraphy and other factors are rarely undertaken in SSI using advanced three dimensional techniques such as PLAXIS 3D. In most applications, “best guessed” inputs are adopted for the analysis. This is a significant problem with these types of analysis, as there is often little consideration given to the impact that such variations have on the results.
Another advantage of the simple spreadsheet analysis is that it is easy to check and review. This is not a simple process for advanced three dimensional SSI analysis.
6 SELECTION OF SOIL MODEL
Retention systems and retaining walls are commonly designed by structural engineers using estimates of earth pressure provided by geotechnical engineers. In such applications the ground provides both load and resistance, and the loads and resistances generated depend on displacement. Structural engineers may adopt simple beam theory to estimate reactions (bending moments, shear forces and anchor or strut forces) within the retention system with little if any assessment of displacement. It is well known that active loads develop at very low displacement, whilst full passive resistance requires significant displacement to be mobilized. The simple application of earth pressures to a beam as described above can therefore result in significant errors in the estimated displacements and structural reactions in the retention system. In addition, in most applications, deformation of the wall and deformations behind the wall are also of primary concern. These are difficult to reasonably quantify unless an appropriate SSI analysis is undertaken in which the behavior of the soil and the retention system are appropriately modelled.
The estimate of displacements of a retention system is not a simple process. The stiffness of soil and rock depends on a number of factors including stress level, whether the material is unloading or loading, the constitutive behavior of the soil, time and a number of other factors. In addition, the in situ stress within the soil or rock can significantly impact on the displacement of
the retention system, especially in materials where the in situ stress is high (for example due to tectonic movements). The stiffness of the structural elements forming the retention system (e.g. soldier piles and anchors) can also vary depending on factors such as stress level and time. This further complicates any SSI analysis of a retention system.
An appropriate choice of “soil model” and soil properties (including in situ stress) used in the SSI analysis is key to obtaining reasonable estimates of performance of a retention system. For this reason, it is the author’s opinion and experience that SSI analyses should be undertaken using a soil model that captures the important aspects of the soil behavior along with “prudently conservative best-estimate” properties. The following example of a retention system in a weak sedimentary rock illustrates the importance of selecting the right soil model.
Deep basements are a common feature of most modern tall and large buildings in cities around the world. In Melbourne, Australia many such basements are excavated through overburden soils into weak, weathered, fractured siltstone, the strength of which gradually increases with depth as the degree of weathering decreases. The siltstone comprises interbedded siltstone and fine grained sandstone with minor mudstone. Bedding planes can be persistent over 100s of metres and with strengths that vary locally on the same bedding plane from relatively high (essentially intact rock strength) to very low (about 12o on slickensided planes), although the occurrence of such low strength over any significant length of a bedding plane is rare. A relatively large number of laboratory direct shear tests have been undertaken on bedding plane joints in the siltstone over a number of years. The results of these tests generally indicate friction angles in excess of 35o with a reasonable lower bound value of about 23o which is similar to the residual strength of the rock. On rare occasions, testing has indicated friction angles as low as 12o for slickensided bedding planes. Such slickensides are relatively common but are generally restricted in their persistence. That is, the areas of slickensiding are generally not extensive, and hence in most situations do not significantly impact the performance of a retention system. However, on at least two occasions that the author is aware of, the presence of an extensive slickensided bedding plane which was persistent over at least 50 m resulted in one case of a batter collapse and in the other case excessive movement of a retention system requiring remedial action.
Due to tectonic history, the siltstone has been compressed in the east west direction, causing folding of the material with fold axes striking approximately north – south. As a result, the in situ stress in the east west direction is significantly higher than in the north south direction.
The variable nature of the siltstone and the prevalence of the bedding presents challenges for the analysis and design of retention systems in this material.
A common retention system solution is to use soldier piles supported by post-tensioned rock anchors and passive rock bolts. The retention system for the north and south faces of an excavation are usually not problematic because of the lower in situ stress and the absence of bedding planes dipping out of these faces. However, the east and west faces can be problematic if bedding is unfavourable (i.e. dipping into the excavation) and bedding planes are of low strength. It is important therefore that the potential impact of bedding be considered in the analysis of the retention system.
The analysis approach adopted varies from engineer to engineer, but most approaches can be categorized into two main types. Either the bedding is included in an assessment of the mass strength and deformation properties of the siltstone (continuum approach) resulting in lower strength and
- 90 -
Honours Lectures / Discours Honoraire
deformation properties, or alternatively less conservative parameters are adopted for the siltstone rock mass and distinct bedding planes are included directly in the analysis at critical locations (discontinuum approach). Full discontinuum analyses (e.g. using UDEC) are not usually undertaken.
6.1 Comparison of approaches
The following compares the results obtained using continuum and discontinuum approaches for a deep basement retention system in siltstone.
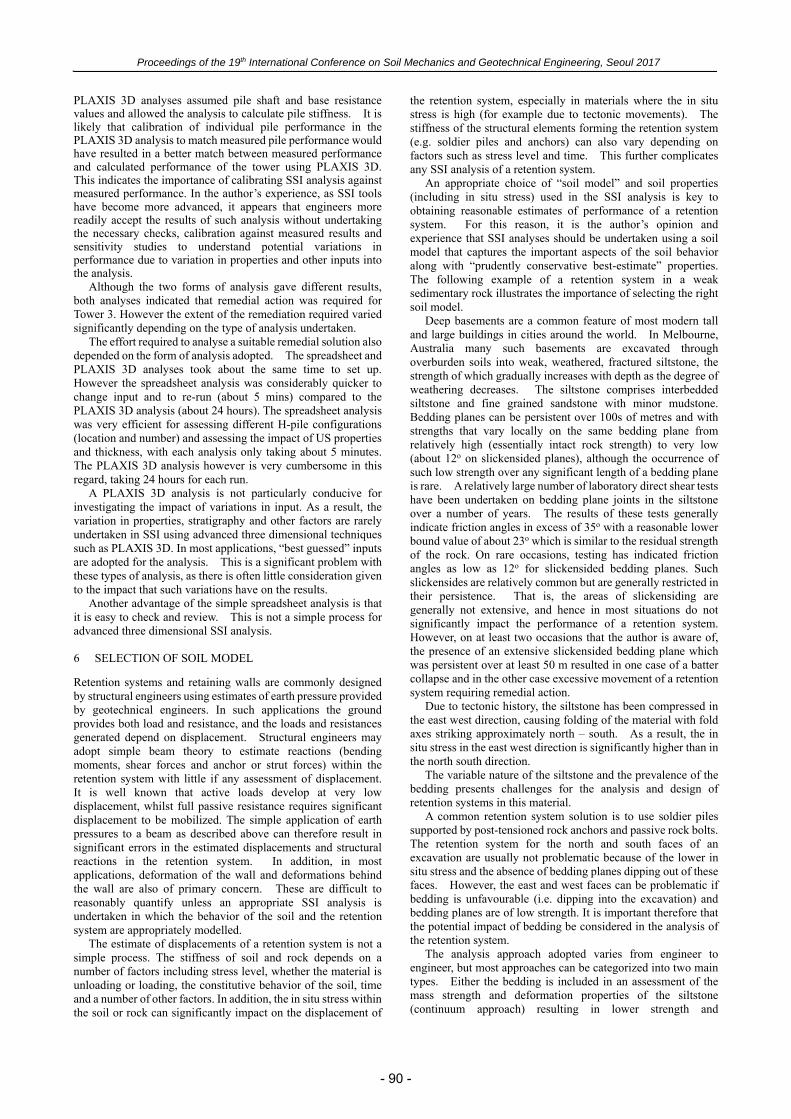
Figure 18 shows a PLAXIS 2D model of a retention system supporting a 25 m deep excavation using the continuum approach. The subsurface stratigraphy comprises weathered siltstone from the surface with different colours indicating siltstone of different weathering grade and hence properties. The retention system comprises a soldier pile wall consisting of 0.75 m diameter piles at 2.25 m centres supported by 5 rows of temporary post-tensioned anchors and 3 rows of temporary rock bolts. Groundwater level is below the base of the excavation, and sub-horizontal drains at close spacing have been drilled into the siltstone to drain the rock mass in the unlikely event of a temporary rise in groundwater level during construction. In the permanent condition the retention system is drained and supported by floor slabs.
The bedding planes in the siltstone have a dip of 25o into the excavation. As average bedding plane strength (friction angle) is generally greater than 35o, the bedding planes should not be a major factor in the design of the retention system (as friction angle is greater than bedding dip) and the rock face is largely self-supporting. However, there is a possibility that one or more bedding planes has a low friction angle of 23o. The location of these low strength bedding planes cannot be reasonably known and cannot be discounted.
There are a number of soil models within PLAXIS 2D that can be adopted to model the rock mass including a Mohr-Coulomb model, a Hoek-Brown model and a jointed rock model. A hardening model could also be used to model different loading and unloading stiffnesses, but this is not considered further here.
Figure 18: PLAXIS 2D continuum model of retention system.
The rock mass parameters for each of the soil models were
calculated based on an estimate of the Hoek and Brown GSI (Geotechnical Strength Index) properties (Hoek et al, 2013) of the siltstone for the scale of the rock mass under consideration (i.e. the full 25 m depth of the excavation). For the Mohr-Coulomb model, equivalent effective rock mass cohesion and friction angles were calculated at a representative normal stress. For the Hoek-Brown model, the GSI parameters were used directly. The same rock mass moduli, dilation and unit weights
were used for all three continuum models. The continuum model analyses essentially represent a worst case condition for the rock mass as they make an allowance for the presence of low strength bedding planes by assuming lower rock mass properties. Nevertheless, these analyses are usually still assumed to represent SLS conditions and therefore an appropriate load factor (e.g. 1.35) needs to be applied to the calculated structural reactions for design.
The same Mohr-Coulomb properties have been used for the jointed rock model as appropriate, along with bedding plane friction angles of 35o for the SLS case and 23o for the ULS case.
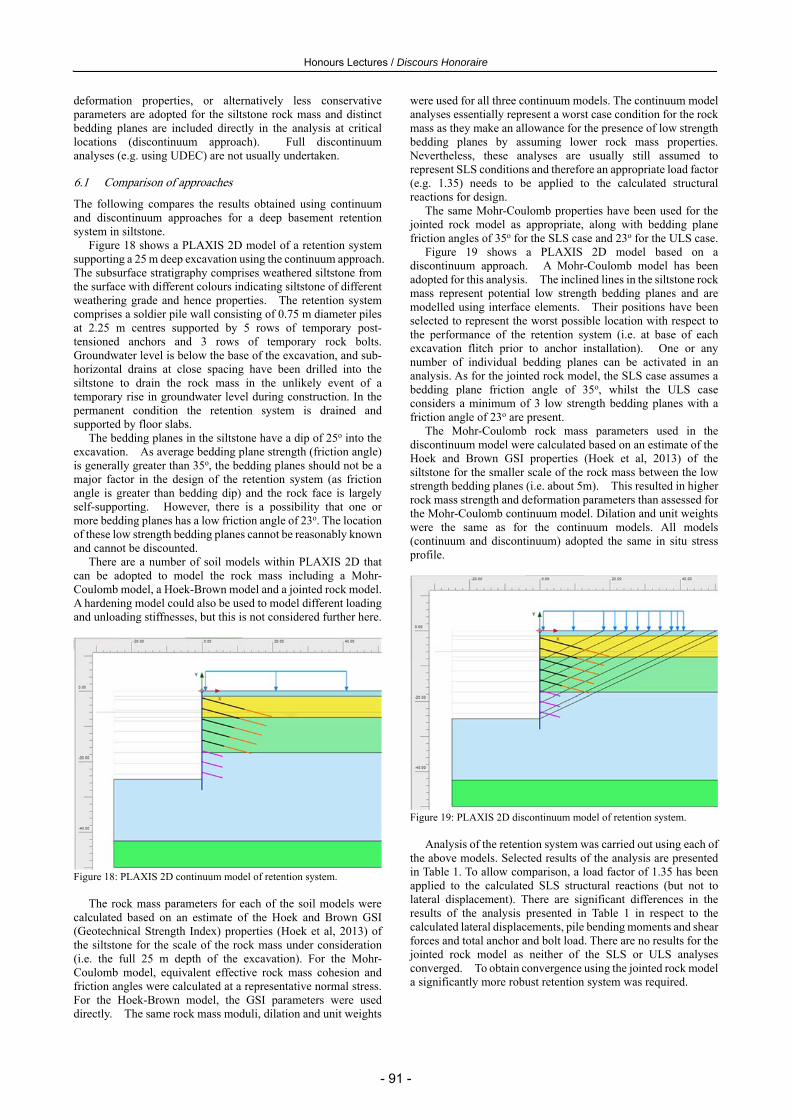
Figure 19 shows a PLAXIS 2D model based on a discontinuum approach. A Mohr-Coulomb model has been adopted for this analysis. The inclined lines in the siltstone rock mass represent potential low strength bedding planes and are modelled using interface elements. Their positions have been selected to represent the worst possible location with respect to the performance of the retention system (i.e. at base of each excavation flitch prior to anchor installation). One or any number of individual bedding planes can be activated in an analysis. As for the jointed rock model, the SLS case assumes a bedding plane friction angle of 35o, whilst the ULS case considers a minimum of 3 low strength bedding planes with a friction angle of 23o are present.
The Mohr-Coulomb rock mass parameters used in the discontinuum model were calculated based on an estimate of the Hoek and Brown GSI properties (Hoek et al, 2013) of the siltstone for the smaller scale of the rock mass between the low strength bedding planes (i.e. about 5m). This resulted in higher rock mass strength and deformation parameters than assessed for the Mohr-Coulomb continuum model. Dilation and unit weights were the same as for the continuum models. All models (continuum and discontinuum) adopted the same in situ stress profile.
Figure 19: PLAXIS 2D discontinuum model of retention system.
Analysis of the retention system was carried out using each of
the above models. Selected results of the analysis are presented in Table 1. To allow comparison, a load factor of 1.35 has been applied to the calculated SLS structural reactions (but not to lateral displacement). There are significant differences in the results of the analysis presented in Table 1 in respect to the calculated lateral displacements, pile bending moments and shear forces and total anchor and bolt load. There are no results for the jointed rock model as neither of the SLS or ULS analyses converged. To obtain convergence using the jointed rock model a significantly more robust retention system was required.
- 91 -

Proceedings of the 19th International Conference on Soil Mechanics and Geotechnical Engineering, Seoul 2017
Table 1: Design structural reactions using different soil models
Structural Reactions
Continuum (x 1.35) Discontinuum
Mohr-Coulomb
Hoek-Brown
SLS (x 1.35)
ULS
Max. lateral disp. (mm)
29 48 13 20
Pile max. bending moment (kNm/m)
400 470 240 333
Pile max. shear force (kN/m)
350 400 660 860
Total anchor/bolt force (kN/m)
1080 1280 750 850
The range in results set out in Table 1 has significant
consequences for the design of the retention system. The continuum model results indicate significantly higher anchor forces, bending moments and displacements than the discontinuum model. It is therefore likely that a retention system design based on a continuum approach would likely require larger diameter piles or piles with a greater percentage of reinforcement and higher capacity anchors. It is also likely that anchor lock-off loads may need to be increased to reduce lateral displacements. The continuum model also indicates significantly lower shear forces in the piles than calculated using a discontinuum model. This may indicate that piles designed using a continuum approach have insufficient shear capacity.
It is not known which of the above models provides the most accurate assessment of the performance of the modelled retention system. However, the author has used the discontinuum approach to design many retention systems in the siltstone and all have performed satisfactorily with movements generally within design expectations.
The above example does not consider a high groundwater table nor the presence of a persistent 12o bedding plane. Inclusion of both of these into the analysis will significantly impact on the performance of the retention system. The most likely outcome is that the retention system adopted above will not be satisfactory and the anchor and pile support will need to be strengthened. Both the continnum and discontinuum approaches described above can satisfactorily model high groundwater conditions. However, the presence of a slickensided bedding plane cannot be reasonably modelled in the continuum models.
A question arises as to whether or not a retention system should be designed to accommodate the rare occurrence of an extensive, slickensided bedding plane. Such bedding planes are almost impossible to identify through ground investigation, but their inclusion in the analysis significantly increases the cost of the retention system, possibly making the proposed development uneconomic. The approach that has been adopted is to not include such very low strength bedding planes in analysis, but to rely on monitoring and an observational approach, and hope to identify a potential problem early so that strengthening measures can be implemented if required.
7 DESIGN PHILOSPHY
The above example highlights the importance of adopting realistic soil models and properties in SSI analysis. Results of SSI analysis can be seriously in error if inputs into the analysis are not reasonable and appropriate.
There are a number of standards, codes and local statutory rules which require various factors to be applied to soil and rock properties for the design of earth retaining structures. Many relatively common design approaches require application of reduction factors to elements that provide resistance (e.g. soil strength) and load factors to disturbing elements (e.g. soil weight). However for many SSI problems (e.g. retention systems), soil weight also contributes to soil strength, and hence
applying a load factor on bulk unit weight of the soil will add to the strength and resistance of the soil. This is clearly illogical when an SSI approach is adopted.
The author therefore questions the practice of using factored down strength parameters and factored up loads (e.g. bulk density) in SSI analysis for ultimate limit state (ULS) considerations.
As stated above, it is the author’s opinion that SSI analyses should be undertaken using “prudently conservative best-estimate” properties. This applies to both serviceability (SLS) and ultimate limit state (ULS) analyses, both of which should be undertaken. The SLS analysis should be undertaken assuming reasonably likely scenarios/conditions and prudently conservative properties. ULS analysis should be undertaken for the worst credible conditions but still using prudently conservative properties.
For example, in the context of the retention system example above, the SLS analysis should consider prudent, reasonably likely ground conditions, groundwater levels, loading and construction sequencing. The ULS analysis should consider credible worst case conditions (e.g. accidental overdig, temporary high groundwater table (e.g. due to water main failure), unfavourable, persistent slickensided fissures or bedding, earthquake etc).
The structural reactions obtained from these analyses must then be factored up for design. Different factors should apply to the SLS and ULS reactions, and the maximum factored reactions adopted.
This approach is different to the approach set out in CIRIA C580 (2003), for example, which recommends that “Moderately conservative” strength parameters are used for SLS analyses, whilst for ULS analyses, either factored down “Moderately conservative” strength parameters or “Worst credible” strength parameters (whichever are lowest) are used. CIRIA C580 also suggest a reduction factor of 0.5 be applied to deformation modulus for ULS analysis. Presumably, this reduction factor is applied to “Moderately conservative” deformation parameters. However, other important parameters such as bulk density and in situ stress (which for many soils and rocks are independent of the strength parameters) are not factored. The CIRIA C580 approach is likely to result in an overly pessimistic estimate of performance and is likely to significantly over-estimate displacements and hence reactions in the retention system. The CIRIA C580 approach of applying reduction factors to inputs is in the authors view not appropriate for SSI analysis, where the aim of the analysis is to provide the best estimate of performance.
Whilst the above comments were illustrated using an SSI analysis of a retention system, they also apply to other SSI analyses. In the author’s opinion, SSI analysis can only be meaningful if properties, soil models and other analysis inputs are reasonably realistic. 8 GOING BEYOND EXPERIENCE - NAKHEEL TOWER
A significant benefit of SSI analysis is that it provides a rational method to extrapolate experience and knowledge to the design of structures that are well beyond what has been built in the past. One example of this is the ever increasing height of tall towers.
The Nakheel Tower in Dubai was designed to extend to a height in excess of 1 km and to be about 100 m in diameter. With about 2,000,000 tonnes of dead load, the structure would have been one of the heaviest ever built. The project was placed on hold in early 2009 at a stage when about half of the foundations had been constructed. Construction is yet to recommence.
At the time of the ground investigation in 2007, a number of very tall towers in excess of 300 m had been completed or were
- 92 -
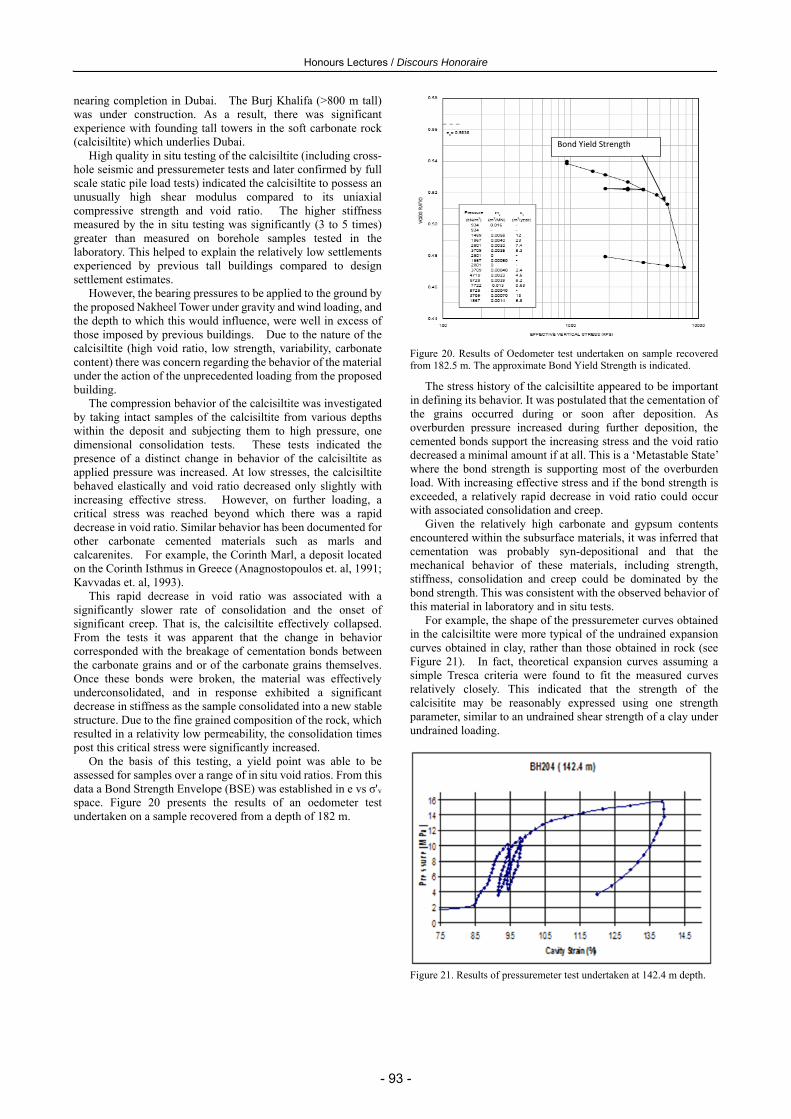
Honours Lectures / Discours Honoraire
nearing completion in Dubai. The Burj Khalifa (>800 m tall) was under construction. As a result, there was significant experience with founding tall towers in the soft carbonate rock (calcisiltite) which underlies Dubai.
High quality in situ testing of the calcisiltite (including cross-hole seismic and pressuremeter tests and later confirmed by full scale static pile load tests) indicated the calcisiltite to possess an unusually high shear modulus compared to its uniaxial compressive strength and void ratio. The higher stiffness measured by the in situ testing was significantly (3 to 5 times) greater than measured on borehole samples tested in the laboratory. This helped to explain the relatively low settlements experienced by previous tall buildings compared to design settlement estimates.
However, the bearing pressures to be applied to the ground by the proposed Nakheel Tower under gravity and wind loading, and the depth to which this would influence, were well in excess of those imposed by previous buildings. Due to the nature of the calcisiltite (high void ratio, low strength, variability, carbonate content) there was concern regarding the behavior of the material under the action of the unprecedented loading from the proposed building.
The compression behavior of the calcisiltite was investigated by taking intact samples of the calcisiltite from various depths within the deposit and subjecting them to high pressure, one dimensional consolidation tests. These tests indicated the presence of a distinct change in behavior of the calcisiltite as applied pressure was increased. At low stresses, the calcisiltite behaved elastically and void ratio decreased only slightly with increasing effective stress. However, on further loading, a critical stress was reached beyond which there was a rapid decrease in void ratio. Similar behavior has been documented for other carbonate cemented materials such as marls and calcarenites. For example, the Corinth Marl, a deposit located on the Corinth Isthmus in Greece (Anagnostopoulos et. al, 1991; Kavvadas et. al, 1993).
This rapid decrease in void ratio was associated with a significantly slower rate of consolidation and the onset of significant creep. That is, the calcisiltite effectively collapsed. From the tests it was apparent that the change in behavior corresponded with the breakage of cementation bonds between the carbonate grains and or of the carbonate grains themselves. Once these bonds were broken, the material was effectively underconsolidated, and in response exhibited a significant decrease in stiffness as the sample consolidated into a new stable structure. Due to the fine grained composition of the rock, which resulted in a relativity low permeability, the consolidation times post this critical stress were significantly increased.
On the basis of this testing, a yield point was able to be assessed for samples over a range of in situ void ratios. From this data a Bond Strength Envelope (BSE) was established in e vs σ'v space. Figure 20 presents the results of an oedometer test undertaken on a sample recovered from a depth of 182 m.
Figure 20. Results of Oedometer test undertaken on sample recovered from 182.5 m. The approximate Bond Yield Strength is indicated.
The stress history of the calcisiltite appeared to be important in defining its behavior. It was postulated that the cementation of the grains occurred during or soon after deposition. As overburden pressure increased during further deposition, the cemented bonds support the increasing stress and the void ratio decreased a minimal amount if at all. This is a ‘Metastable State’ where the bond strength is supporting most of the overburden load. With increasing effective stress and if the bond strength is exceeded, a relatively rapid decrease in void ratio could occur with associated consolidation and creep.
Given the relatively high carbonate and gypsum contents encountered within the subsurface materials, it was inferred that cementation was probably syn-depositional and that the mechanical behavior of these materials, including strength, stiffness, consolidation and creep could be dominated by the bond strength. This was consistent with the observed behavior of this material in laboratory and in situ tests.
For example, the shape of the pressuremeter curves obtained in the calcisiltite were more typical of the undrained expansion curves obtained in clay, rather than those obtained in rock (see Figure 21). In fact, theoretical expansion curves assuming a simple Tresca criteria were found to fit the measured curves relatively closely. This indicated that the strength of the calcisitite may be reasonably expressed using one strength parameter, similar to an undrained shear strength of a clay under undrained loading.
Figure 21. Results of pressuremeter test undertaken at 142.4 m depth.
Bond Yield Strength
- 93 -

Proceedings of the 19th International Conference on Soil Mechanics and Geotechnical Engineering, Seoul 2017
8.1 Subsurface stratigraphy
The general subsurface stratigraphy at the tower site comprised of:
An upper 6 m thick layer of loose saturated sand. This unit is subsequently referred to as Unit A. A surficial layer of gypsum and other precipitates form a thin crust at the surface of the site. (The groundwater table is about 2 m to 3 m below ground surface);
Recent aeolian deposits comprised of carbonate rich sand with thin, high strength indurated layers. This forms a capping layer over the site. The sand extends from ground surface to a depth of about 20 m. This unit is subsequently referred to as Unit B;
Shallow marine deposits, inferred to be of Quaternary age and comprised of predominantly calcisiltite unconformably underlie Unit B. This material is a low strength rock with carbonate content typically greater than 70%. It extends to a depth of about 70 m below ground surface;
A second shallow marine sedimentary sequence underlies Unit C and extends to the maximum depth investigated of about 200 m. This unit is comprised predominantly of calcareous siltstone with some calcisiltite. Although the carbonate content is variable, it is typically lower than that of Unit C. This Unit D is characterized by high gypsum content. Gypsum is present as massive layers of up to 2.5 m thick, as well as nodules and veins. Borehole correlation between the massive gypsum layers suggest the bedding within this material has a shallow dip of about 8°.
Units C and D described above are generally massive. Some tight, closed joints are present within these units which are thought to have formed as a result of stress changes. The general site stratigraphy is presented in Figure 22.
8.2 Basis of foundation design
The proposed footing raft was to have a diameter of about 105 m. A preliminary assessment showed that while the building could be supported on a near-surface raft, the settlements would be excessive. A design based on a pile-supported raft was therefore proposed.
The schematic design for the Nakheel Tower footing system comprised a raft slab generally between 4 m and 8 m thickness. The raft slab was to be founded at about RL -17.5 at the top of the calcisiltite, and be supported by 184 barrettes of 2.8 m by 1.2 m (plan dimension) and 224 barrettes of about 2.8 m by 1.5 m, a total of 408 barrettes. The final design, as modified by later analyses used 392 barrettes. The number of barrettes was dictated by the ultimate structural load that could be carried by each barrette, and not by geotechnical factors. The near 20 m deep, 100 m diameter excavation to be supported by a 1.2 m thick diaphragm wall with no anchor or strut support (i.e. the stability of the wall relied on developing hoop action in the circular diaphragm wall).
The footing layout is shown in Figure 23. Particular concentrations of load occurred at the inner drum wall and main columns and these areas contained the highest concentration of barrettes. Analyses were carried out for various combinations of dead load, live load, wind load and earthquake load. Loads and load combinations for these analyses were provided by the structural engineers. As explained below, preliminary analyses were undertaken using PLAXIS 2D (both axisymmetric and plane strain analyses) and REPUTE to assess preliminary barrette lengths and concentrations to limit settlement and spread load to mitigate the potential for “collapse” of the calcisiltite. These analyses were followed by three dimensional analyses
using PLAXIS 3D and spreadsheet analysis using monte-carlo simulations to assess, on a probabilistic basis, potential settlement and tilt of the tower.
Figure 22. Generalised subsurface stratigraphy.
Figure 23. Final footing layout showing barrette locations.
- 94 -
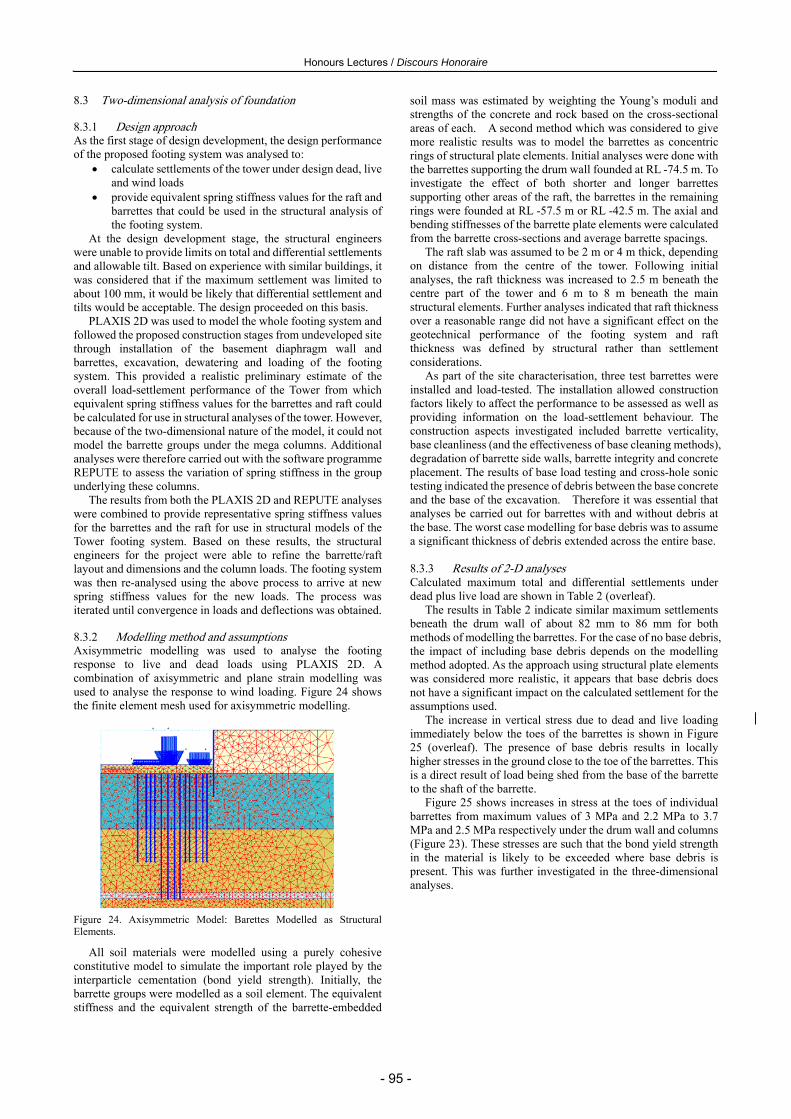
Honours Lectures / Discours Honoraire
8.3 Two-dimensional analysis of foundation
8.3.1 Design approach As the first stage of design development, the design performance of the proposed footing system was analysed to:
calculate settlements of the tower under design dead, live and wind loads
provide equivalent spring stiffness values for the raft and barrettes that could be used in the structural analysis of the footing system.
At the design development stage, the structural engineers were unable to provide limits on total and differential settlements and allowable tilt. Based on experience with similar buildings, it was considered that if the maximum settlement was limited to about 100 mm, it would be likely that differential settlement and tilts would be acceptable. The design proceeded on this basis.
PLAXIS 2D was used to model the whole footing system and followed the proposed construction stages from undeveloped site through installation of the basement diaphragm wall and barrettes, excavation, dewatering and loading of the footing system. This provided a realistic preliminary estimate of the overall load-settlement performance of the Tower from which equivalent spring stiffness values for the barrettes and raft could be calculated for use in structural analyses of the tower. However, because of the two-dimensional nature of the model, it could not model the barrette groups under the mega columns. Additional analyses were therefore carried out with the software programme REPUTE to assess the variation of spring stiffness in the group underlying these columns.
The results from both the PLAXIS 2D and REPUTE analyses were combined to provide representative spring stiffness values for the barrettes and the raft for use in structural models of the Tower footing system. Based on these results, the structural engineers for the project were able to refine the barrette/raft layout and dimensions and the column loads. The footing system was then re-analysed using the above process to arrive at new spring stiffness values for the new loads. The process was iterated until convergence in loads and deflections was obtained.
8.3.2 Modelling method and assumptions Axisymmetric modelling was used to analyse the footing response to live and dead loads using PLAXIS 2D. A combination of axisymmetric and plane strain modelling was used to analyse the response to wind loading. Figure 24 shows the finite element mesh used for axisymmetric modelling.
Figure 24. Axisymmetric Model: Barettes Modelled as Structural Elements.
All soil materials were modelled using a purely cohesive constitutive model to simulate the important role played by the interparticle cementation (bond yield strength). Initially, the barrette groups were modelled as a soil element. The equivalent stiffness and the equivalent strength of the barrette-embedded
soil mass was estimated by weighting the Young’s moduli and strengths of the concrete and rock based on the cross-sectional areas of each. A second method which was considered to give more realistic results was to model the barrettes as concentric rings of structural plate elements. Initial analyses were done with the barrettes supporting the drum wall founded at RL -74.5 m. To investigate the effect of both shorter and longer barrettes supporting other areas of the raft, the barrettes in the remaining rings were founded at RL -57.5 m or RL -42.5 m. The axial and bending stiffnesses of the barrette plate elements were calculated from the barrette cross-sections and average barrette spacings.
The raft slab was assumed to be 2 m or 4 m thick, depending on distance from the centre of the tower. Following initial analyses, the raft thickness was increased to 2.5 m beneath the centre part of the tower and 6 m to 8 m beneath the main structural elements. Further analyses indicated that raft thickness over a reasonable range did not have a significant effect on the geotechnical performance of the footing system and raft thickness was defined by structural rather than settlement considerations.
As part of the site characterisation, three test barrettes were installed and load-tested. The installation allowed construction factors likely to affect the performance to be assessed as well as providing information on the load-settlement behaviour. The construction aspects investigated included barrette verticality, base cleanliness (and the effectiveness of base cleaning methods), degradation of barrette side walls, barrette integrity and concrete placement. The results of base load testing and cross-hole sonic testing indicated the presence of debris between the base concrete and the base of the excavation. Therefore it was essential that analyses be carried out for barrettes with and without debris at the base. The worst case modelling for base debris was to assume a significant thickness of debris extended across the entire base. 8.3.3 Results of 2-D analyses Calculated maximum total and differential settlements under dead plus live load are shown in Table 2 (overleaf).
The results in Table 2 indicate similar maximum settlements beneath the drum wall of about 82 mm to 86 mm for both methods of modelling the barrettes. For the case of no base debris, the impact of including base debris depends on the modelling method adopted. As the approach using structural plate elements was considered more realistic, it appears that base debris does not have a significant impact on the calculated settlement for the assumptions used.
The increase in vertical stress due to dead and live loading immediately below the toes of the barrettes is shown in Figure 25 (overleaf). The presence of base debris results in locally higher stresses in the ground close to the toe of the barrettes. This is a direct result of load being shed from the base of the barrette to the shaft of the barrette.
Figure 25 shows increases in stress at the toes of individual barrettes from maximum values of 3 MPa and 2.2 MPa to 3.7 MPa and 2.5 MPa respectively under the drum wall and columns (Figure 23). These stresses are such that the bond yield strength in the material is likely to be exceeded where base debris is present. This was further investigated in the three-dimensional analyses.
- 95 -

Proceedings of the 19th International Conference on Soil Mechanics and Geotechnical Engineering, Seoul 2017
Table 2. Settlement results for axisymmetric PLAXIS 2D analysis – DL + LL only.
Barrette Founding Level (RL m DMD)
Description Maximum settlement (mm)
Differential settlement* (mm)
-74.5 and -50 Barrettes modelled as soil elements without base debris
86 19
-75.5 and -50 Barrettes modelled as soil elements with base debris
103 26
-62.5 and -50 Barrettes modelled as soil elements with base debris
123 36
.74.5 and -57.5 Barrettes modelled as soil elements without base debris
82 21
-74.5 and -57.5 Barrettes modelled as soil elements with base debris
83 22
-74.5 and -42.5 Barrettes modelled as soil elements without base debris
86 21
*across width of piled raft
Figure 25. End bearing pressure with barrette groups modelled as structural elements.
The impact of base debris, should it be present, may be reduced by using the much stronger gypsum layers to spread the load from the barrettes onto the underlying Unit D material. The test barrettes indicated that relatively high shaft resistances (1730 kPa) can be achieved in the gypsum. If the barrettes were founded through the uppermost gypsum layers at about RL -75 m, the shaft resistance developed in the gypsum would off-set the loss of base resistance due to base debris and hence reduce the local areas of high vertical stress in the Unit D material. For the same analyses set out above using barrettes modelled as plate elements, but adopting the design gypsum properties (and not Unit D properties as was used above), the increase in stresses in the Unit D material due to loading from the Tower were found to be similar to those obtained assuming no base debris.
Spring stiffness value for the raft and barrettes as a function of radius from the centre point of the raft were calculated from the PLAXIS 2D results.
Analysis under wind loading was carried out using a combination of plane strain and axisymmetric models, and modelling the barrettes as plate elements without base debris
(due to the incompressibility of the debris under short term loading). The response was also analysed using twice the design modulus to represent the short term nature of the wind loading.
The results presented earlier show that where base debris, and therefore poor base contact, is assumed at the toe of the barrettes, the increase in vertical stress applied to the ground near the toe of the barrettes is higher than the case where no base debris is assumed. The consequences of a higher increase in vertical stress near the toe of the barrettes could be exceedence of the bond yield strength of the carbonate cemented materials (Units C and D) and associated time-dependent compression of these materials. There was a risk of greater settlement or tower tilt from this factor.
The risk of higher stresses in the vicinity of the toe of the barrettes could be reduced by adjusting the founding level of the barrettes. Analyses showed that the increase in vertical stress below the base of the barrettes could be reduced by:
a) staggering the length of the barrettes beneath the hammer (radial) walls and founding the drum wall (refer to Figure 23) barrettes through the upper layer of gypsum; or
b) increasing the length of the centre row of the barrettes supporting the hammer walls resulting in a more equal share in load between the three rows of barrettes and reducing the risk associated with locally high stresses.
8 .4 Three Dimensional analysis of foundation
8.4.1 Purpose of analyses The results of the two dimensional axisymmetric analyses provided the basis for a viable footing system for the Tower. Although versatile and relatively quick to undertake, these analyses only provide an indication of the three dimensional response of the footing system. The two dimensional analyses enabled evaluation of the benefit or otherwise of changing barrette layouts and lengths, and development of the final footing system. Three dimensional analyses using PLAXIS 3D were undertaken to allow a better assessment of the performance of the footing system under non-symmetrical load cases such as wind and earthquake loading. The objectives of the three dimensional analyses were:
To calculate the settlement profile of the tower raft under gravity and wind working load cases.
To confirm geotechnical stability of the footing system under ultimate load conditions.
To calculate the stiffness of the barrettes and the raft for gravity and wind working load cases for use in structural analysis of the foundation system by the structural engineers.
To calculate barrette actions (shear force and bending moment) within barrettes for ultimate load cases including base shear).
To estimate the impact of debris at the base of the barrettes on the settlement performance of the footing system.
To estimate the vertical stress increase below the toe of the barrettes under working load and ultimate load conditions for estimation of potential long term settlement (creep).
8.4.2 Loads and load cases Loads provided by the structural engineers were used in the analyses. In general three working load combinations and two ultimate load combinations as defined below were analysed:
Working load combinations: i) DL + LL, ii) DL + 0.8 WL iii) DL + 0.75 LL + 0.6 WL
- 96 -

Honours Lectures / Discours Honoraire
Ultimate load combinations: iv) 1.2 DL + 0.5 LL + WL v) 1.2 DL + 0.5 LL + E
Analyses were undertaken for each working load combination assuming cases of full base resistance and no base resistance. The analyses assuming full base resistance were considered to provide a reasonable estimate of short term performance while the analyses with no base resistance provided a conservative estimate of long term performance (for the properties and conditions assumed). For each analysis, the following values were evaluated:
Vertical settlement at the head of the barrettes. Vertical load at the head of the barrettes. Axial stiffness of each barrette. Geotechnical factor of safety for each barrette.
The three dimensional model used in the PLAXIS 3D analyses is shown in Figure 26. As described earlier, the subsurface stratigraphy at the site comprises relatively uniform beds of sedimentary material. The bedding within the different units and the contacts between them are generally sub-horizontal, or with a slight dip. The dip of the beds was modelled in PLAXIS 3D as seen in Figure 26.
The outputs of the analyses were presented in spreadsheets which gave for each of the 392 barrettes the load and settlement estimates. These results were used by the structural engineers as input to their analyses, which resulted initially in revised barrette loads. Further foundation analyses were performed until the calculated barrette head loads and settlements converged with the structural inputs.
Figure 26. PLAXIS 3D model of Tower footing system.
8.4.3 Results of analysis The calculated maximum and minimum settlements under working load conditions are summarised in Table 3.
For the dead load plus live load case, the calculated settlements assuming full base resistance were about 10 mm to 15 mm less than those obtained from the analyses assuming no base resistance. It was considered the analyses assuming full base resistance provided a reasonable estimate of settlement performance of the tower footing system in the short-term.
Table 3. Calculated settlements of major columns and walls.
The analyses indicated also that under full design gravity
loading of the tower, the bond yield stress immediately below the barrettes was likely to be exceeded and some creep would occur. This would lead to load transfer from the base of the barrettes to the shaft. Alternatively, on the assumption that some debris was present at the base of the barrettes, in the short term the debris would be incompressible and hence the full base resistance may be relevant. However, over time the fluid within the debris would drain and hence load would be transferred from the base to the shaft. It is probable that both mechanisms could occur concurrently.
The consequence is that over time, at least some load would be transferred from the base of the barrettes to the shaft of the barrettes. The extreme end condition of this is that the base of the barrettes may carry little or no load. This condition was modelled by the analyses assuming no base resistance. It was therefore considered that a reasonable upper estimate of the long-term settlement of the tower footing system under the design case parameters was provided by analyses which assumed no base resistance.
Where full base resistance was assumed, barrette axial loads under the dead load plus live load combination varied from 16 MN to 57 MN and from 12 MN to 79 MN for the wind loading cases, with the higher loaded barrettes tending to lie towards the outside of the hammer walls. These loads translated to a geotechnical factor of safety typically greater than 2.5. Barrette stiffness values ranged between about 0.2 MN/mm and 1 MN/mm.
The maximum axial load in the 1.2 m by 2.8 m and 1.5 m by 2.8 m barrettes under the working load cases analysed were 64 MN and 79 MN respectively. These are less than the barrette structural working load capacities of 64.5 MN and 80.6 MN provided by the structural engineers.
Where no base resistance was assumed, barrette axial loads under the dead load plus live load combination ranged between 13 MN and 47 MN and for the wind load combinations between 7 MN and 56 MN. For the most onerous wind load case analysed, the geotechnical factor of safety was typically greater than 2.5. Barrette stiffness values ranged from 0.16 MN/mm to 0.6 MN/mm.
Where the raft was 4 m thick or greater, the calculated raft stiffness was about 12 MN/mm.
Load CaseFull Base Resistance
(Short Term) No Base Resistance
(Long Term) Hammer
Walls (mm)
Drum Wall (mm)
Mega Columns
(mm)
Hammer Walls (mm)
Drum Wall (mm)
Mega Columns
(mm)
DL + LL 66 – 72 70 62 82-87 82 74
DL + 0.8WL
Winward Minimum
34 – 45 46 35 42 – 57 54 45
Leeward Maximum
74 – 80 74 70 90 – 99 93 87
DL + 0.75LL + 0.6 WL
Winward Minimum
50 – 60 56 46 62 – 70 66 58
Leeward Maximum
78 – 82 76 72 96 – 100 90 86
- 97 -

Proceedings of the 19th International Conference on Soil Mechanics and Geotechnical Engineering, Seoul 2017
8.4.4 Probabilistic analysis The numerical analyses were carried out for a single design set of properties. To investigate the potential range of settlement and tilt that could occur due to variation in the subsurface stratigraphy and variation of the stiffness of the Unit C and D materials, a probabilistic analysis was performed using PLAXIS 2D.
During the field investigation, a simple hardness (scratch test) test was carried out on all of the core and a continuous profile of hardness with depth obtained in each borehole. This hardness was then correlated with modulus of the calcisiltite. The mean and standard deviation values were calculated for each field hardness value and these normal distributions of modulus values were then applied to each of the continuous field hardness profiles at each borehole location. For every field hardness in each borehole, a Young’s modulus was randomly selected from the normal distribution of modulus values for the appropriate field hardness value at that depth. This was repeated 100 times for each borehole, resulting in 100 possible modulus versus depth, or stiffness profiles at each borehole location.
A simplified model encoded into a spreadsheet analysis was used to calculate the settlement of the ground below the base of the barrettes. The vertical stress distribution was estimated from the results of the PLAXIS 2D model and applied to the modulus estimates to calculate the settlements. This calculation was repeated for each modulus versus depth profile to give 100 settlement estimates at each borehole location. The mean and standard deviation of these 100 settlement estimates for each borehole location were then calculated and used to define a normal distribution of settlement at each borehole location.
The probability/settlement distributions for eight boreholes located within the tower footprint are shown in Figure 27. This also shows the results of analyses using a credible upper and lower bound approach to the estimation of strength and stiffness properties.
The upper and lower bound estimates were based on the highest and lowest credible strength and stiffness data obtained from in situ testing undertaken during the geotechnical investigation. The effects of stress relief on core samples recovered from the boreholes were assessed to be significant, and therefore the strength and stiffness results from laboratory testing were discarded.
Figure 27. Probabilistic estimates of Tower settlement.
8.5 Review
Independent SSI analysis of the footing system for the Nakheel Tower were undertaken by two other engineering companies. The approaches adopted used different SSI tools and techniques
than described above. Nevertheless, the conclusion of the independent reviews was that the proposed footing system was reasonable and indicated similar performance to that obtained using the methods set out above.
8.6 Summary
The SSI analysis for the proposed Nakheel Tower incorporated a number of approaches which sought to identify the potential impact of unprecedented loads from the building onto the underlying founding materials. The approaches used in the SSI analyses targeted various aspects of behavior of the founding materials identified through careful laboratory and field testing. Together, the various analyses (in combination with field testing of full scale barrettes) provided confidence that the Tower would perform in a satisfactory manner.
9 CONCLUSION
This paper has presented a number of examples of SSI analyses that are carried out on a daily basis by practicing geotechnical engineers. The importance of SSI analyses to the understanding of the performance of structures and to their design cannot be over-stated. However, as illustrated in the above examples, there are a number of key requirements for SSI analysis to be reasonable and meaningful. These include:
1. representative subsurface stratigraphy and an understanding of the geological history and groundwater hydrology of the site;
2. correct modelling of the engineering constitutive behavior of the materials (soil and structure) involved;
3. understanding of material behavior and identification of key aspects of behavior that are critical to performance of the structure;
4. realistic (i.e. not factored) strength, deformation and compressibility properties (and perhaps other properties such as permeability, shrink/swell characteristics) of the materials, including their likely variation;
5. realistic (SLS and ULS) design loads for all major load cases including during construction and over the working life (e.g. gravity, earthquake, wind, water);
6. both SLS and ULS analyses. SLS analyses should consider the most likely situation using prudent best estimate parameters. ULS analyses should consider unlikely, but credible situations and adopt unfactored properties. Structural reactions need to be factored up for design, with different factors applying to SLS and ULS conditions;
7. consideration of the construction process; 8. engineering experience capable of identifying the key
aspects of behaviour that need to be modelled; 9. appropriate software that is capable of modelling these
key aspects of behavior. Just because the software is sophisticated and complex, doesn’t mean it is appropriate;
10. use of a range of SSI tools to target different key aspects of behavior and to provide confidence in the results;
11. a reasonable understanding of the capabilities and limitations of the software and of the models incorporated into the software;
12. data to correlate calculated performance against measured performance;
13. check calculations by alternative simple methods; 14. analyses to investigate the impact of reasonable
variations in properties, ground conditions and loads etc.
0
0.1
0.2
0.3
0.4
0.5
0.6
0.7
0.8
0.9
1
0 50 100 150 200 250
Pro
bab
ility
Sett lement (mm)
BH201
BH202
BH203
BH204
BH205
BH206
BH207
BH208
3D analysis using credible upper bound properties
3D analysis using credible lower bound properties
- 98 -

Honours Lectures / Discours Honoraire
10 ACKNOWLEDGEMENTS
My sincere thankyou to TC207 for bestowing on me the honour of giving this lecture and to Drs Andrew Lochaden, David Gu and Gary Chapman and Darren Paul for help with preparing the paper.
11 REFERENCES
Anagnostopoulos, A.G,. Kalteziotis, N, Tsiambos, G.K., Kavvadas, M., (1991) Geotechnical Properties of the Corinth Canal Marls, Geotechnical and Geological Engineering, Vol 9, 1-26.
Bond, A. J. & Basile, F. 2010. Repute 2.0, Software for pile design and analysis. Reference Manual, Geocentrix Ltd, United Kingdom, 49p.
Brinkgreve, R.B.J, Broere, W. & Waterman, D., 2008. PLAXIS 2D Reference Manual, PLAXIS, The Netherlands.
Brinkgreve, R.B.J, & Swolfs, W.M., 2007. PLAXIS 3D Reference Manual, PLAXIS, The Netherlands.
CIRIA C580 (2003). Embedded retaining walls – guidance for economic design. 390 p.
Hoek, E., Carter, T.G., Diederichs, M.S. (2013) Quantification of the Geological Strength Index, 47th US Rock Mechanics / Geomechanics Symposium, June 2013.
ITASCA (2000) FLAC, Fast Lagrangian Analysis of Contiuum. Kavvadas, M., Anagnostopoulos, A., Kalteziotis, N. 1993. A Framework
for the Mechanical Behaviour of the Cemented Corinth Marl, Geotechnical Engineering of Hard Soils-Soft Rocks, Anagnostopoulos et.al. (eds), Balkema
Microsoft (1997) EXCEL Poulos, H.G. (1990) Program DEFPIG, Deformation Analysis of Pile
Groups. University of Sydney. Small, J and Booker, J. (1995) FLEA Finite Layer Elastic Analysis.
University of Sydney. Ulitsky, V.M., Shashkin, A.G., Shashkin, C.G. and Lisyuk, M.B. (2012).
Preservation and reconstruction of historical monuments with provision for soil-structure interaction analyses. Proceedings of US-Russian Geotechnical Workshop, American Geo-Congress. Oakland, USA, 29-30 March
Ulitsky, V., Shashkin, А., Shashkin, K., and Lisyuk, M. 2003. Soil-structure interaction: methodology of analysis and application in design. ASV Publishers. St. Petersburg – Moscow. 40 p.
- 99 -

- 100 -


![[E. Atlee Jackson] Equilibrium Statistical Mechani(BookFi.org)](https://static.fdocuments.net/doc/165x107/563dba71550346aa9aa5a9bb/e-atlee-jackson-equilibrium-statistical-mechanibookfiorg.jpg)