
Application Performance Monitoring for WhatsUp …...Application Performance Monitoring for WhatsUp...
162
Application Performance Monitoring for WhatsUp Gold v16.1 User Guide
Transcript of Application Performance Monitoring for WhatsUp …...Application Performance Monitoring for WhatsUp...
Application Performance Monitoring for WhatsUp Gold v16.1 User Guide
i
Contents
Table of Contents
Introduction
APM Overview................................................................................................................................................................ 1 Learning about APM terminology .......................................................................................................................... 2 Getting Started with APM .......................................................................................................................................... 3
Application Profiles.......................................................................................................................................... 4 Application Components .............................................................................................................................. 5 Action Policies ................................................................................................................................................... 6
APM licensing ................................................................................................................................................................. 7
Application Discovery
Discovering applications ............................................................................................................................................ 8
APM configuration
Viewing application performance configuration ............................................................................................ 13 Understanding applications ................................................................................................................................... 14 Configuring Application Performance Monitoring to monitor applications ........................................ 14 Working with application profiles ........................................................................................................................ 15
Creating a new application profile ........................................................................................................... 16 Setting up a WUGSpace user account .................................................................................................... 21 Importing and downloading application profiles .............................................................................. 23 Exporting an application profile ............................................................................................................... 25 Publishing an application profile to WUGSpace ................................................................................. 26
Working with components ..................................................................................................................................... 27 Adding components to an application instance ................................................................................ 28 Testing components ..................................................................................................................................... 30 Adding a CPU Utilization component ..................................................................................................... 33 Adding a MySQL Query component ....................................................................................................... 35 Adding an Oracle Query component ...................................................................................................... 38 Adding a SQL Server Query component ................................................................................................ 40 Adding a Disk Utilization component ..................................................................................................... 42 Adding a Physical Memory Utilization component to an application profile .......................... 45 Adding a Virtual Memory Utilization component .............................................................................. 47 Adding a Custom Port Check component ............................................................................................ 49 Adding an Echo Port Check component ............................................................................................... 51 Adding an FTP Port Check component .................................................................................................. 53
ii
Adding an HTTP Port Check component ............................................................................................... 55 Adding an HTTPS Port Check component ............................................................................................ 58 Adding an IMAP4 Port Check component ............................................................................................ 60 Adding an NNTP Port Check component .............................................................................................. 62 Adding a POP3 Port Check component ................................................................................................. 64 Adding a Radius Port Check component to an application profile.............................................. 67 Adding an SMTP Port Check component .............................................................................................. 69 Adding a Time Port Check component .................................................................................................. 71 Adding an SNMP Process Check component ...................................................................................... 73 Adding a WMI Process Check component ............................................................................................ 75 Adding a PowerShell Execution Check component .......................................................................... 77 Adding an End User Monitoring component ...................................................................................... 80 Adding an SNMP Service Check component ....................................................................................... 86 Adding a WMI Service Check component ............................................................................................. 88 Adding an SNMP Check component ....................................................................................................... 90 Adding an SSH Active Monitor Check component ............................................................................ 93 Adding an SSH Performance Monitor Check component ............................................................... 94 Adding a WMI Formatted Counter Check component ..................................................................... 97 Adding a WMI Raw Counter Check component ................................................................................. 99
Working with application instances ................................................................................................................. 101 Creating an application instance ........................................................................................................... 102 Configuring inherited profile components in an application instance ................................... 103
Working with critical component groups ....................................................................................................... 104 Adding critical component groups to an application profile...................................................... 105 Adding critical component groups to an application instance .................................................. 107
Working with discrete applications .................................................................................................................. 109 Adding discrete applications to an application profile ................................................................. 109 Adding discrete applications to an application instance ............................................................. 110
APM actions
Working with action policies in APM ................................................................................................................ 112 Creating an action policy in APM ....................................................................................................................... 113 Managing Action Policies ..................................................................................................................................... 116 Assigning an action policy to an APM instance or component .............................................................. 116 Working with actions in APM .............................................................................................................................. 118
Creating an action in APM........................................................................................................................ 119 Percent variables for APM actions ......................................................................................................... 129
Working with blackout policies in APM ........................................................................................................... 130 Creating a blackout policy in APM ........................................................................................................ 131
iii
Working with application states......................................................................................................................... 132 APM Actions Log ......................................................................................................................................... 133
Application Performance Monitoring status
Viewing application performance status ........................................................................................................ 134 Viewing application status details ..................................................................................................................... 137
Application State Summary ..................................................................................................................... 138 Component State Summary .................................................................................................................... 140 Running Action Policies ............................................................................................................................ 142
Viewing historical status ....................................................................................................................................... 143 Hourly Availability ....................................................................................................................................... 145 State Change ................................................................................................................................................. 146 Polled Values ................................................................................................................................................. 146 Instance Summary ...................................................................................................................................... 147 Component Summary ............................................................................................................................... 148 State Change Log ........................................................................................................................................ 149 Action Log ...................................................................................................................................................... 150 Resolved Actions Log ................................................................................................................................. 151
APM Dashboard Reports
About the APM: State Summary Dashboard Report ................................................................................... 153 About the APM: Application Event Log Dashboard Report ..................................................................... 154
Application Performance Monitoring Application Settings
Configuring APM application settings ............................................................................................................. 155
Finding more information and updates
For more information and updates ................................................................................................................... 157 Copyright notice ...................................................................................................................................................... 158
1
CHAPTER 1
Introduction
In This Chapter
APM Overview ........................................................................................................ 1
Learning about APM terminology ................................................................... 2
Getting Started with APM................................................................................... 3
APM licensing ......................................................................................................... 7
APM Overview
Application Performance Monitoring for WhatsUp Gold monitors applications across multiple devices, servers, and systems, providing performance statistics and overall application health, while alerting on performance degradation and potential problems before they result in service outages. Application Performance Monitoring helps IT organizations measure and guarantee Service Level Agreements (SLAs) and assists in pinpointing application performance bottlenecks and points of failure. For more information, see Getting Started with APM (on page 3) and the Application Performance Monitoring for WhatsUp Gold v16.1 Getting Started Guide (http://www.whatsupgold.com/WUGAPM_161GSG).
Note: This feature is available with WhatsUp Gold Premium Edition only. To update your license, visit the WhatsUp Customer Portal (http://www.whatsupgold.com/wugCustPortal).
Each application monitored by Application Performance Monitoring is comprised of a collection of individual components (on page 27) as defined in the application profile. This application profile is then applied to a WhatsUp Gold device, creating an application instance.
Following are some of the application types that the WhatsUp Gold Application Performance Monitoring plug-in supports:
§ Microsoft Exchange 2010
§ Microsoft Exchange 2007
§ Microsoft Server 2008
§ Microsoft Server 2003
§ Microsoft Active Directory/Domain Controller
§ Oracle 11G
§ Microsoft SQL 2008
§ Microsoft SQL 2005
§ IIS 7.X
Application Performance Monitoring for WhatsUp Gold v16 User Guide
2
§ Ipswitch WhatsUp Gold
§ Microsoft SharePoint 2010
§ Apache
§ IBM WebSphere Version 7
§ My SQL 5.X
§ Cisco Unified Communications Manager
§ Ipswitch iMail
Application Performance Monitoring is licensed on a per-component basis, meaning that each component monitored uses one license. A license is also required for a discrete application (on page 20), an application that acts as a component of another application.
Learning about APM terminology
The following terms are used throughout Application Performance Monitoring:
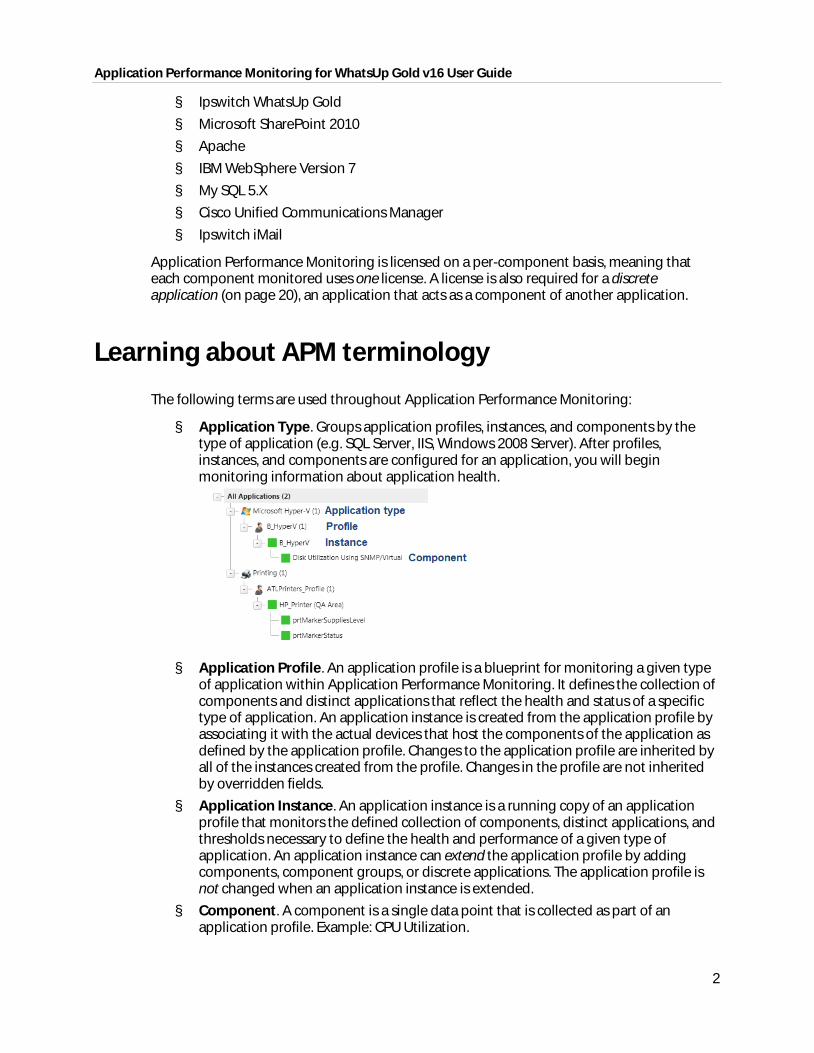
§ Application Type. Groups application profiles, instances, and components by the type of application (e.g. SQL Server, IIS, Windows 2008 Server). After profiles, instances, and components are configured for an application, you will begin monitoring information about application health.
§ Application Profile. An application profile is a blueprint for monitoring a given type
of application within Application Performance Monitoring. It defines the collection of components and distinct applications that reflect the health and status of a specific type of application. An application instance is created from the application profile by associating it with the actual devices that host the components of the application as defined by the application profile. Changes to the application profile are inherited by all of the instances created from the profile. Changes in the profile are not inherited by overridden fields.
§ Application Instance. An application instance is a running copy of an application profile that monitors the defined collection of components, distinct applications, and thresholds necessary to define the health and performance of a given type of application. An application instance can extend the application profile by adding components, component groups, or discrete applications. The application profile is not changed when an application instance is extended.
§ Component. A component is a single data point that is collected as part of an application profile. Example: CPU Utilization.
Application Performance Monitoring for WhatsUp Gold v16 User Guide
3
§ Critical component. A critical component is a component that impacts the status of an application instance. As a result, a critical component that goes into the down state, causes the application instance to go into the down state. However, if a non-critical component goes into a down state, the application instance goes into a warning state and only the component indicates being in the down state.
§ Critical component group. A critical component group is a grouping of components that contains specific logic to allow for complex evaluation of the up/down state of an application. For example, given four components A,B,C and D, the following logic can be applied, so that if A and B are down or C and D are down the application is placed into the down state. ((A and B) or (C and D)). Critical component groups are always considered "critical", in that if a critical component group is evaluated to be in the down state, the entire application is in the down state.
§ Application. An application is made up of one or more programs running on one or more monitored systems.
§ Simple application. A simple application is an application that is not dependent on another application to run. Example: Microsoft Server 2008 R2.
§ Complex application. A complex application is an application configured to be dependent on one or more applications to run. Example: WhatsUp Gold (requires IIS and SQL Server).
§ Discrete application. A discrete application is an application upon which a complex application has a dependency. For example, IIS and SQL Server are discrete applications on which the complex application WhatsUp Gold is dependent. A discrete application is used when you are monitoring a complex application.
Getting Started with APM
Configuring Application Performance Monitoring to monitor an application is a simple process that starts with selecting a profile that captures the data points necessary to understand the performance, health, and status of a given type of application. The application profile groups the components, discrete applications, and associated thresholds necessary to capture the data points into a blueprint that can be used to create individual application instances. These instances actively monitor your applications.
Ipswitch provides a selection of profiles for use with Application Performance Monitoring which are available in the Application Performance Monitoring installation, or by download from the WUGSpace Community (http://www.whatsupgold.com/WUGProfilesInfo). You can also create your own application profiles which can be shared on the WUGSpace Community (http://www.whatsupgold.com/WUGProfilesInfo).
After you have the necessary profiles, you can use Application Performance Monitoring to automatically discover your applications and create instances for each discovered application, or you may choose to manually create and modify instances individually before you begin monitoring.
The following flowcharts represent the typical process of setting up an application to be monitored with APM:
§ Application Profile Workflow (on page 4)
Application Performance Monitoring for WhatsUp Gold v16 User Guide
4
§ Application Component Workflow (on page 5)
§ Action Policy Workflow (on page 6)
For more information, see the Application Performance Monitoring for WhatsUp Gold v16.1 Getting Started Guide (http://www.whatsupgold.com/WUGAPM_161GSG).
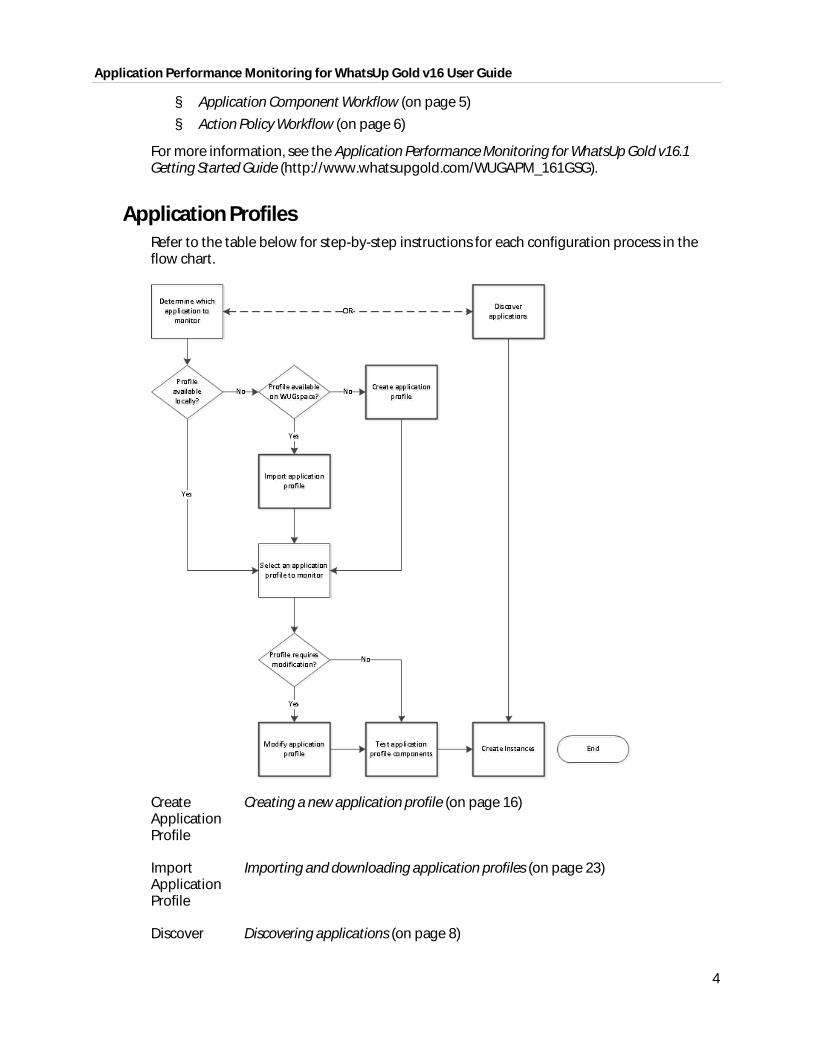
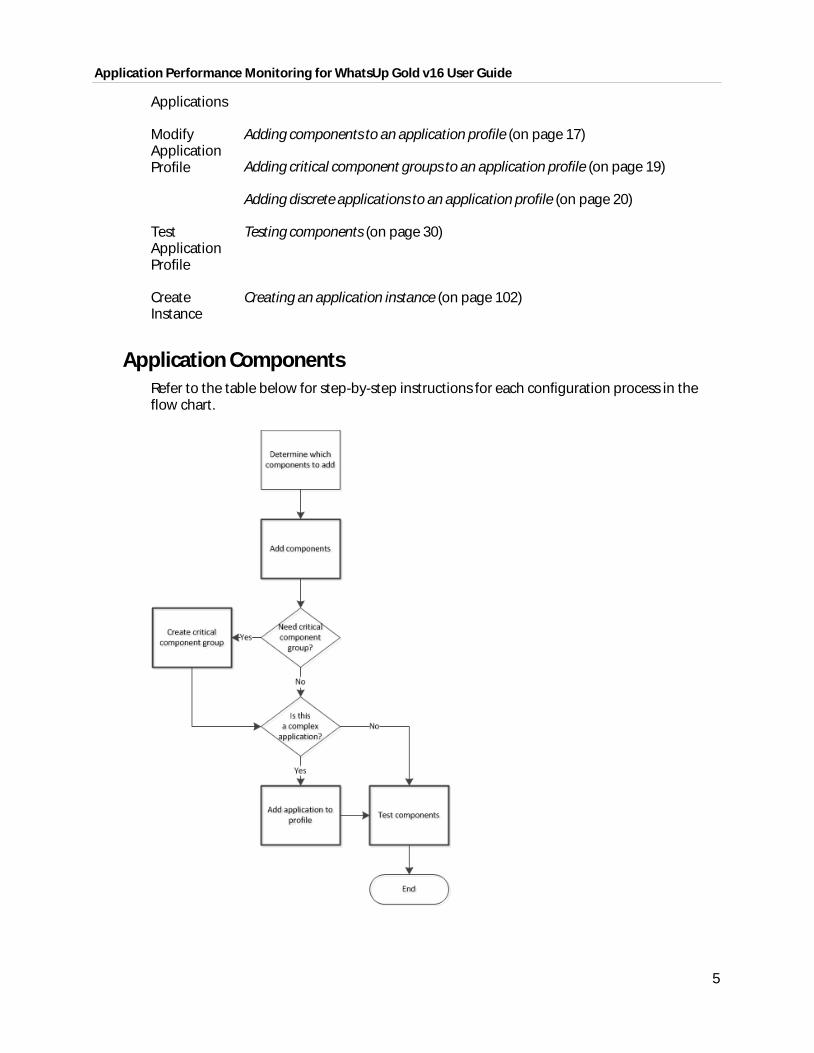
Application Profiles Refer to the table below for step-by-step instructions for each configuration process in the flow chart.
Create Application Profile
Creating a new application profile (on page 16)
Import Application Profile
Importing and downloading application profiles (on page 23)
Discover Discovering applications (on page 8)
Application Performance Monitoring for WhatsUp Gold v16 User Guide
5
Applications
Modify Application Profile
Adding components to an application profile (on page 17)
Adding critical component groups to an application profile (on page 19)
Adding discrete applications to an application profile (on page 20)
Test Application Profile
Testing components (on page 30)
Create Instance
Creating an application instance (on page 102)
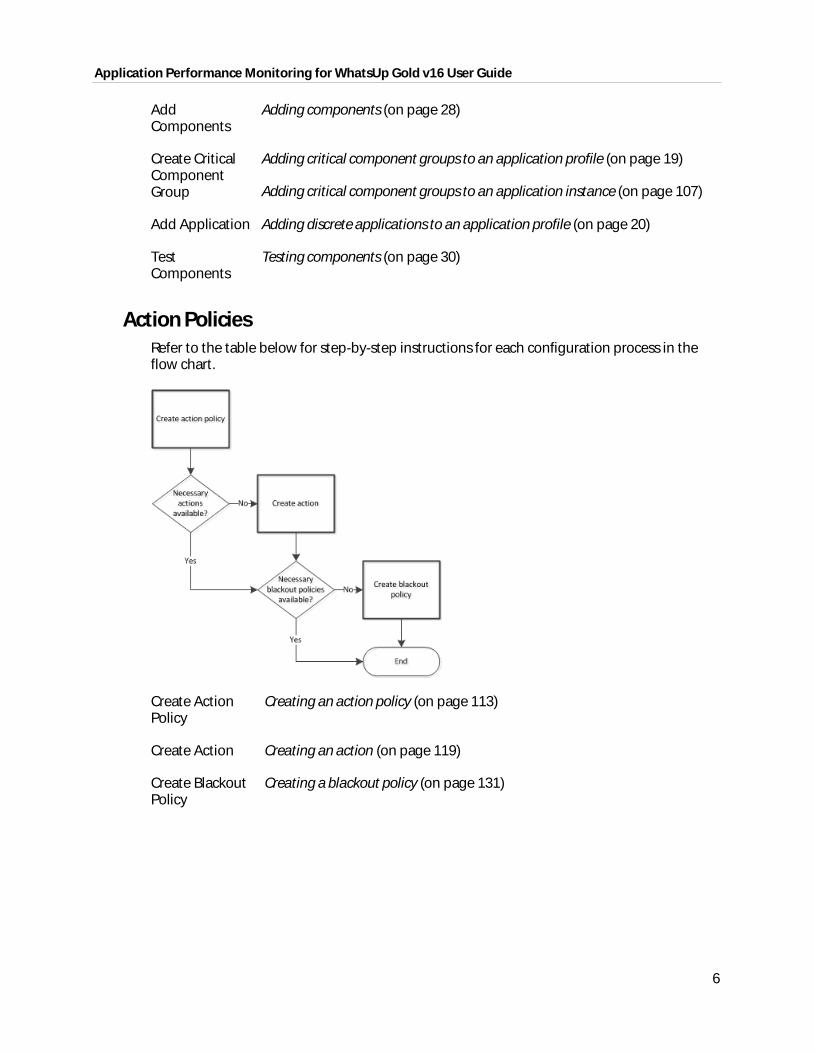
Application Components Refer to the table below for step-by-step instructions for each configuration process in the flow chart.
Application Performance Monitoring for WhatsUp Gold v16 User Guide
6
Add Components
Adding components (on page 28)
Create Critical Component Group
Adding critical component groups to an application profile (on page 19)
Adding critical component groups to an application instance (on page 107)
Add Application Adding discrete applications to an application profile (on page 20)
Test Components
Testing components (on page 30)
Action Policies Refer to the table below for step-by-step instructions for each configuration process in the flow chart.
Create Action Policy
Creating an action policy (on page 113)
Create Action Creating an action (on page 119)
Create Blackout Policy
Creating a blackout policy (on page 131)
Application Performance Monitoring for WhatsUp Gold v16 User Guide
7
APM licensing
Application Performance Monitoring is installed during the WhatsUp Gold installation. Your license determines whether the Application Performance Monitoring plug-in is available in WhatsUp Gold. To update your license for Application Performance Monitoring, visit the WhatsUp Customer Portal (http://www.whatsupgold.com/wugCustPortal). Application Performance Monitoring is licensed on a per-component basis. This means that each component that makes up an application instance uses one license, since they are each individual components of the application instance. For more information on Application Performance Monitoring licensing or to upgrade your license, click Details during the application setup process.
8
CHAPTER 2
Application Discovery
In This Chapter
Discovering applications .................................................................................... 8
Discovering applications
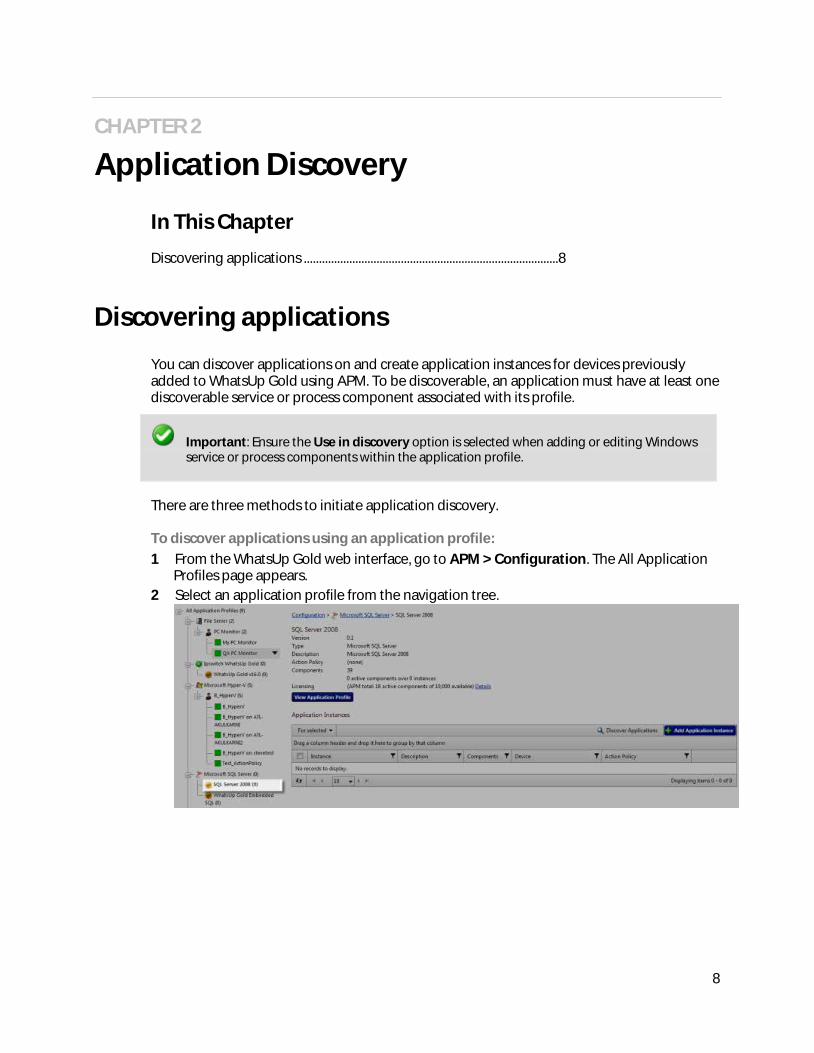
You can discover applications on and create application instances for devices previously added to WhatsUp Gold using APM. To be discoverable, an application must have at least one discoverable service or process component associated with its profile.
Important: Ensure the Use in discovery option is selected when adding or editing Windows service or process components within the application profile.
There are three methods to initiate application discovery.
To discover applications using an application profile: 1 From the WhatsUp Gold web interface, go to APM > Configuration. The All Application
Profiles page appears. 2 Select an application profile from the navigation tree.
Application Performance Monitoring for WhatsUp Gold v16 User Guide
9
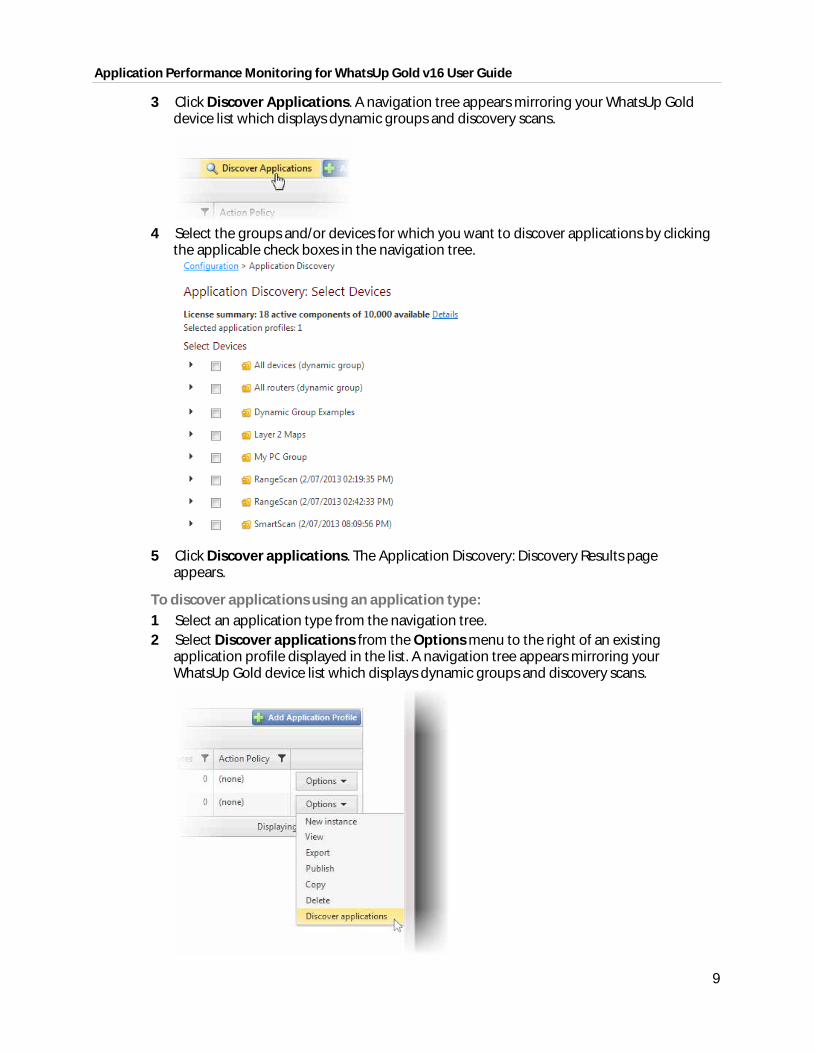
3 Click Discover Applications. A navigation tree appears mirroring your WhatsUp Gold device list which displays dynamic groups and discovery scans.
4 Select the groups and/or devices for which you want to discover applications by clicking
the applicable check boxes in the navigation tree.
5 Click Discover applications. The Application Discovery: Discovery Results page
appears.
To discover applications using an application type: 1 Select an application type from the navigation tree. 2 Select Discover applications from the Options menu to the right of an existing
application profile displayed in the list. A navigation tree appears mirroring your WhatsUp Gold device list which displays dynamic groups and discovery scans.
Application Performance Monitoring for WhatsUp Gold v16 User Guide
10
3 Select the groups and/or devices for which you want to discover applications by clicking the applicable check boxes in the navigation tree.
4 Click Discover applications. The Application Discovery: Discovery Results page appears.
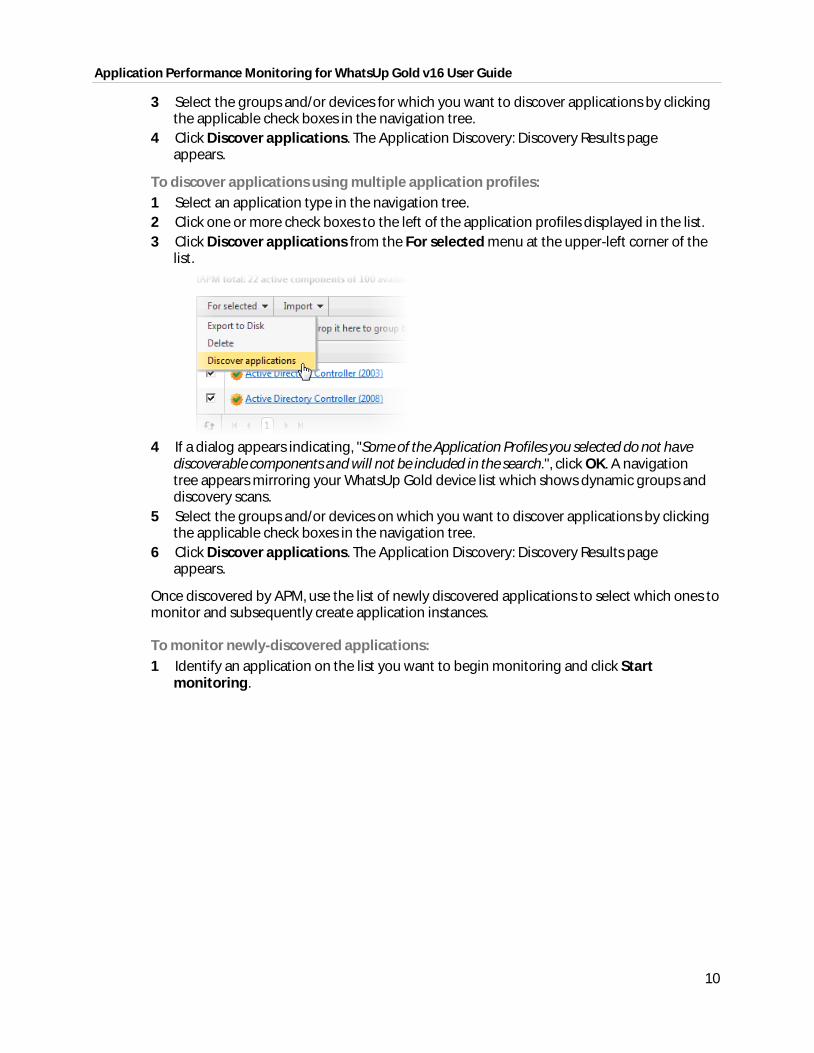
To discover applications using multiple application profiles: 1 Select an application type in the navigation tree. 2 Click one or more check boxes to the left of the application profiles displayed in the list. 3 Click Discover applications from the For selected menu at the upper-left corner of the
list.
4 If a dialog appears indicating, "Some of the Application Profiles you selected do not have
discoverable components and will not be included in the search.", click OK. A navigation tree appears mirroring your WhatsUp Gold device list which shows dynamic groups and discovery scans.
5 Select the groups and/or devices on which you want to discover applications by clicking the applicable check boxes in the navigation tree.
6 Click Discover applications. The Application Discovery: Discovery Results page appears.
Once discovered by APM, use the list of newly discovered applications to select which ones to monitor and subsequently create application instances.
To monitor newly-discovered applications: 1 Identify an application on the list you want to begin monitoring and click Start
monitoring.
Application Performance Monitoring for WhatsUp Gold v16 User Guide
11
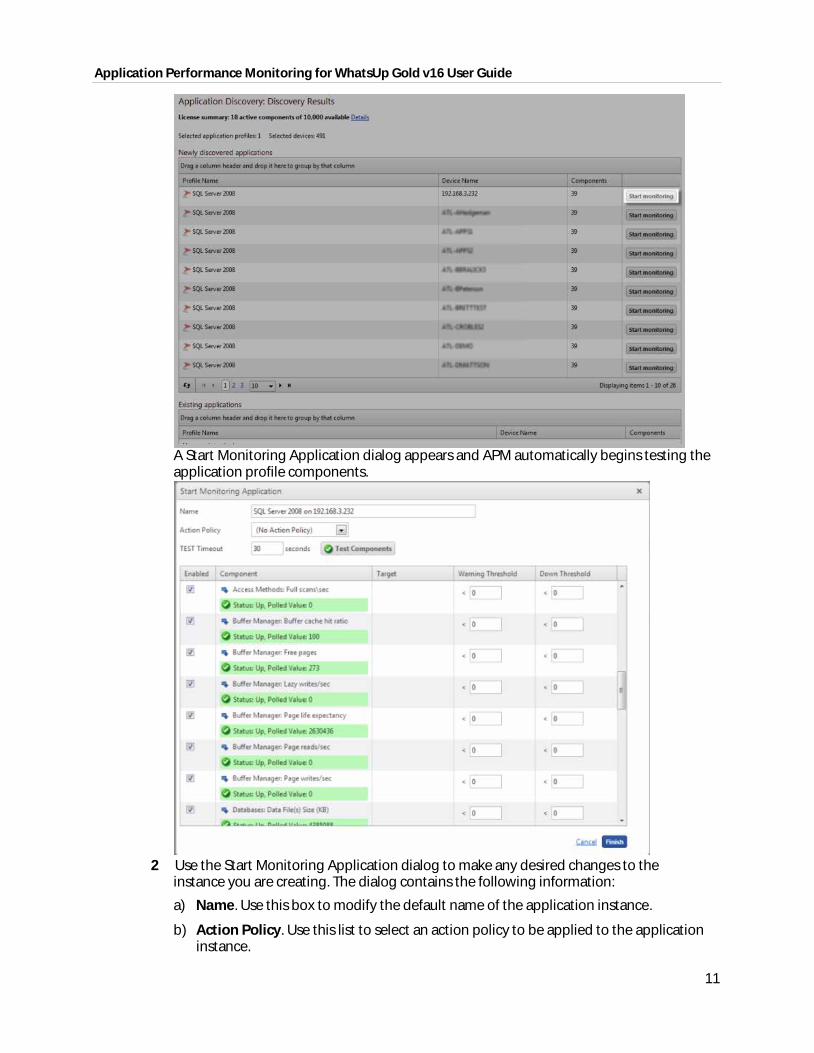
A Start Monitoring Application dialog appears and APM automatically begins testing the application profile components.
2 Use the Start Monitoring Application dialog to make any desired changes to the
instance you are creating. The dialog contains the following information:
a) Name. Use this box to modify the default name of the application instance.
b) Action Policy. Use this list to select an action policy to be applied to the application instance.
Application Performance Monitoring for WhatsUp Gold v16 User Guide
12
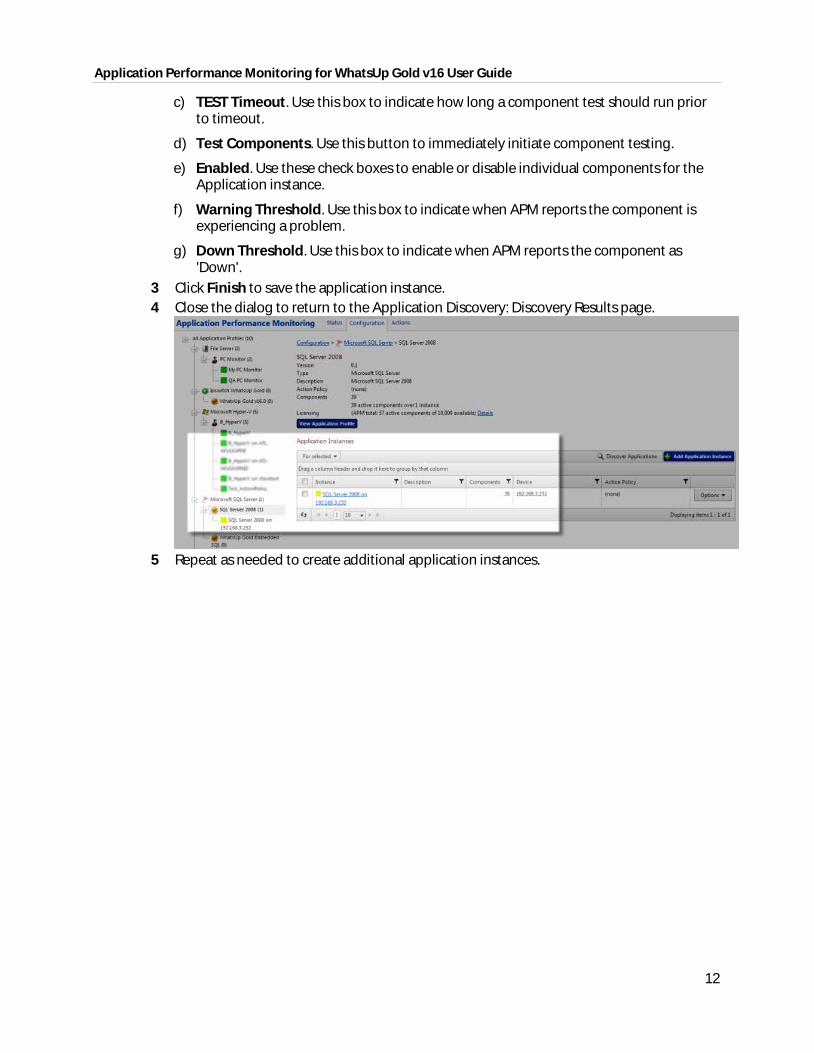
c) TEST Timeout. Use this box to indicate how long a component test should run prior to timeout.
d) Test Components. Use this button to immediately initiate component testing.
e) Enabled. Use these check boxes to enable or disable individual components for the Application instance.
f) Warning Threshold. Use this box to indicate when APM reports the component is experiencing a problem.
g) Down Threshold. Use this box to indicate when APM reports the component as 'Down'.
3 Click Finish to save the application instance. 4 Close the dialog to return to the Application Discovery: Discovery Results page.
5 Repeat as needed to create additional application instances.
13
CHAPTER 3
APM configuration
In This Chapter
Viewing application performance configuration.................................... 13
Understanding applications ........................................................................... 14
Configuring Application Performance Monitoring to monitor applications 14
Working with application profiles ................................................................ 15
Working with components ............................................................................. 27
Working with application instances .......................................................... 101
Working with critical component groups ................................................ 104
Working with discrete applications ........................................................... 109
Viewing application performance configuration
The Application Performance Monitoring configuration page allows you to view detailed information about the application profiles currently in use as well as a summary of components, instances, and action policies active for each profile. From here, you can select a specific application profile to view and/or edit.
To access the Application Performance Monitoring Status page, go to APM > Configuration page.
On the left of the Configuration page, the Application tree provides a way to determine the scope of the data provided in the right-hand content pane, as well as to provide the status of instances and components. The tree has a root that provides information on All Applications configured for Application Performance Monitoring. Below this root, if configured, there are three levels:
§ Application Type. Groups application profiles, instances, and components by the type of application (e.g. SQL Server, IIS, Windows 2008 Server).
§ Profile. Groups the instances and components by the profile used to create the individual instance. Where the data points being monitored are different between two versions of the same application, there may be separate application profiles for each version.
§ Instance. Groups the components used to monitor the individual data points described in the profile.
To configure Application Profiles, see Working with application profiles (on page 15).
Application Performance Monitoring for WhatsUp Gold v16 User Guide
14
Understanding applications
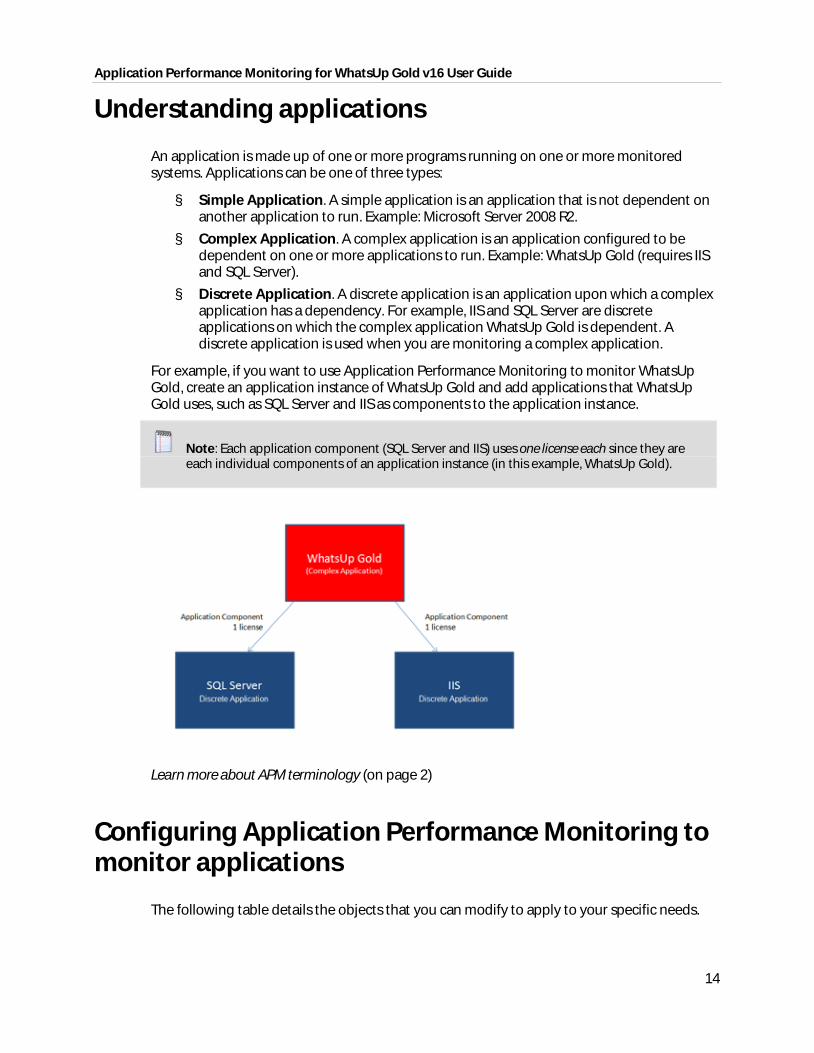
An application is made up of one or more programs running on one or more monitored systems. Applications can be one of three types:
§ Simple Application. A simple application is an application that is not dependent on another application to run. Example: Microsoft Server 2008 R2.
§ Complex Application. A complex application is an application configured to be dependent on one or more applications to run. Example: WhatsUp Gold (requires IIS and SQL Server).
§ Discrete Application. A discrete application is an application upon which a complex application has a dependency. For example, IIS and SQL Server are discrete applications on which the complex application WhatsUp Gold is dependent. A discrete application is used when you are monitoring a complex application.
For example, if you want to use Application Performance Monitoring to monitor WhatsUp Gold, create an application instance of WhatsUp Gold and add applications that WhatsUp Gold uses, such as SQL Server and IIS as components to the application instance.
Note: Each application component (SQL Server and IIS) uses one license each since they are each individual components of an application instance (in this example, WhatsUp Gold).
Learn more about APM terminology (on page 2)
Configuring Application Performance Monitoring to monitor applications
The following table details the objects that you can modify to apply to your specific needs.
Application Performance Monitoring for WhatsUp Gold v16 User Guide
15
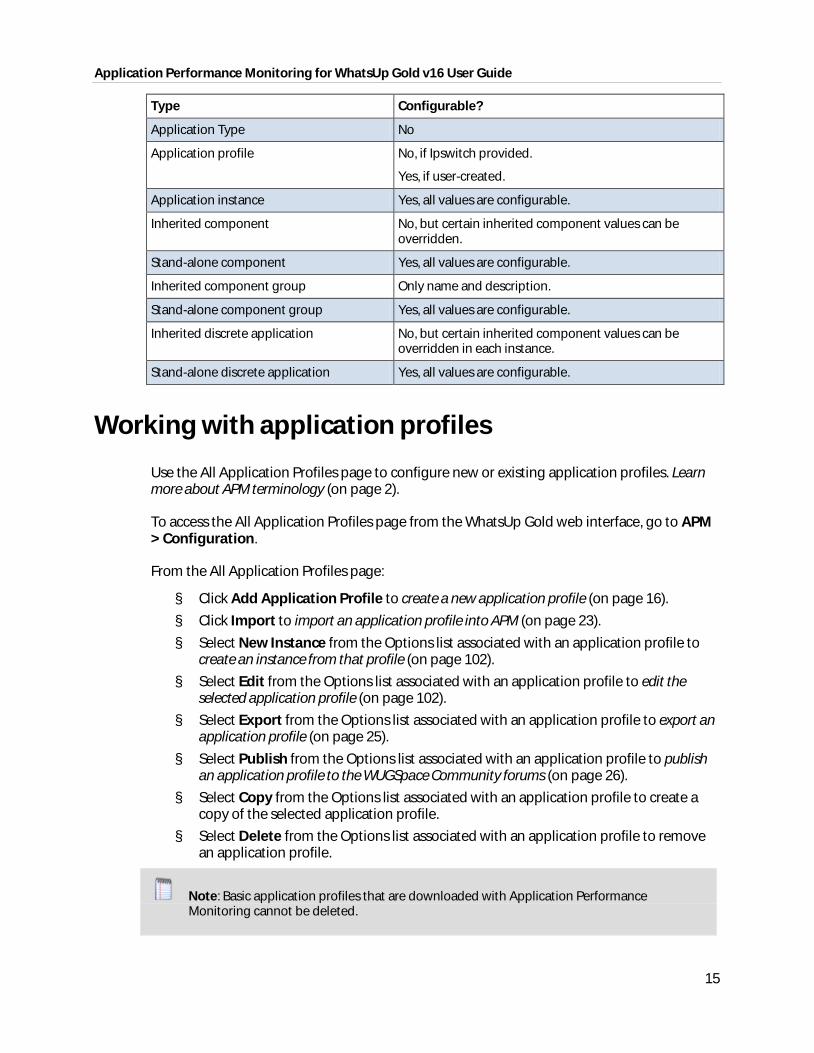
Type Configurable?
Application Type No
Application profile No, if Ipswitch provided.
Yes, if user-created.
Application instance Yes, all values are configurable.
Inherited component No, but certain inherited component values can be overridden.
Stand-alone component Yes, all values are configurable.
Inherited component group Only name and description.
Stand-alone component group Yes, all values are configurable.
Inherited discrete application No, but certain inherited component values can be overridden in each instance.
Stand-alone discrete application Yes, all values are configurable.
Working with application profiles
Use the All Application Profiles page to configure new or existing application profiles. Learn more about APM terminology (on page 2).
To access the All Application Profiles page from the WhatsUp Gold web interface, go to APM > Configuration.
From the All Application Profiles page:
§ Click Add Application Profile to create a new application profile (on page 16).
§ Click Import to import an application profile into APM (on page 23).
§ Select New Instance from the Options list associated with an application profile to create an instance from that profile (on page 102).
§ Select Edit from the Options list associated with an application profile to edit the selected application profile (on page 102).
§ Select Export from the Options list associated with an application profile to export an application profile (on page 25).
§ Select Publish from the Options list associated with an application profile to publish an application profile to the WUGSpace Community forums (on page 26).
§ Select Copy from the Options list associated with an application profile to create a copy of the selected application profile.
§ Select Delete from the Options list associated with an application profile to remove an application profile.
Note: Basic application profiles that are downloaded with Application Performance Monitoring cannot be deleted.
Application Performance Monitoring for WhatsUp Gold v16 User Guide
16
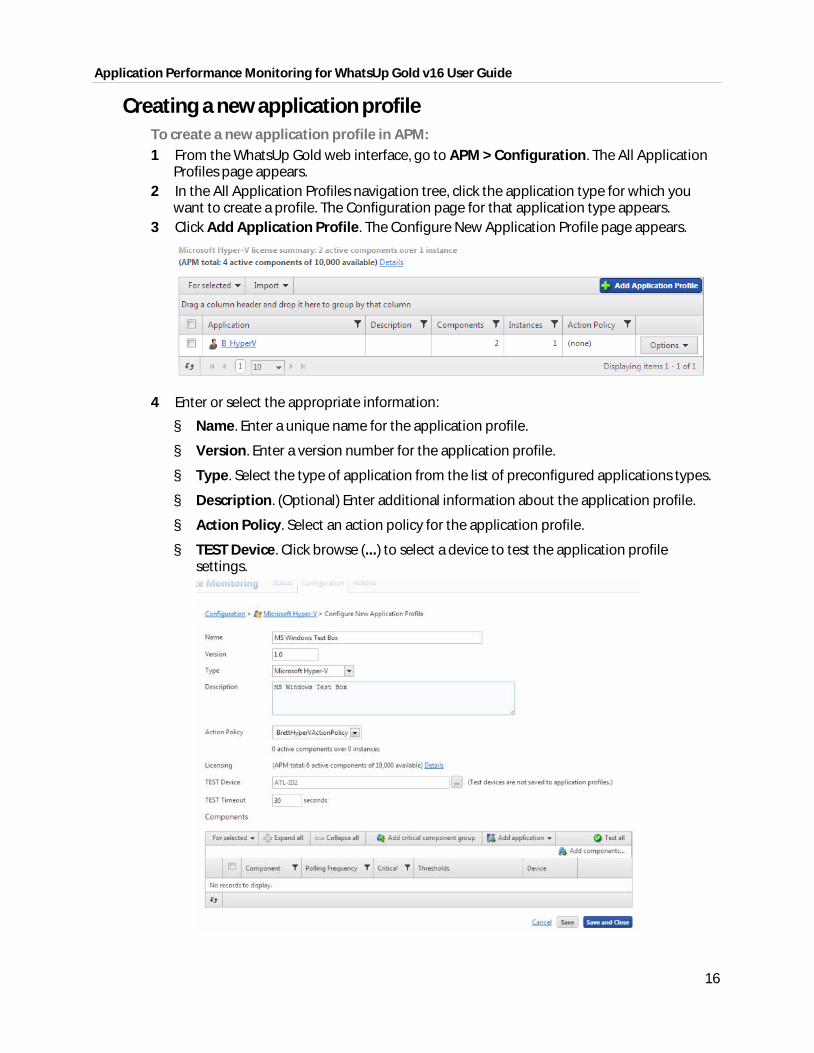
Creating a new application profile To create a new application profile in APM: 1 From the WhatsUp Gold web interface, go to APM > Configuration. The All Application
Profiles page appears. 2 In the All Application Profiles navigation tree, click the application type for which you
want to create a profile. The Configuration page for that application type appears. 3 Click Add Application Profile. The Configure New Application Profile page appears.
4 Enter or select the appropriate information:
§ Name. Enter a unique name for the application profile.
§ Version. Enter a version number for the application profile.
§ Type. Select the type of application from the list of preconfigured applications types.
§ Description. (Optional) Enter additional information about the application profile.
§ Action Policy. Select an action policy for the application profile.
§ TEST Device. Click browse (...) to select a device to test the application profile settings.
Application Performance Monitoring for WhatsUp Gold v16 User Guide
17
Note: Clicking browse (...) allows you to test the configuration settings of an application profile, but does not save the device to the application profile.
5 (Optional) Click Add components to add a component to the application profile (on page 17).
6 (Optional) Click Add critical component group to add a critical component group to the application profile (on page 19).
7 (Optional) Click Add application to add a discrete application to the application profile (on page 20).
8 (Optional) Click Test all to test all of the components added to the application profile. 9 Click Save to save your changes or click Save and Close to complete your changes.
Adding components to an application profile A component is a single data point that is collected as part of an application profile. For example, the CPU Utilization component.
APM is licensed on a per-component basis, meaning that each component monitored uses one license. However, adding components to an application profile does not consume a license. A license is only consumed when a component is used by an application instance (on page 102). Learn more about APM terminology (on page 2).
Note: Applications as a whole can be components of another application (i.e. complex application).
To add a component to an existing application profile: 1 From the WhatsUp Gold web interface, go to APM > Configuration. The All Application
Profiles page appears. 2 Select the application profile for which you want to add a component, then click
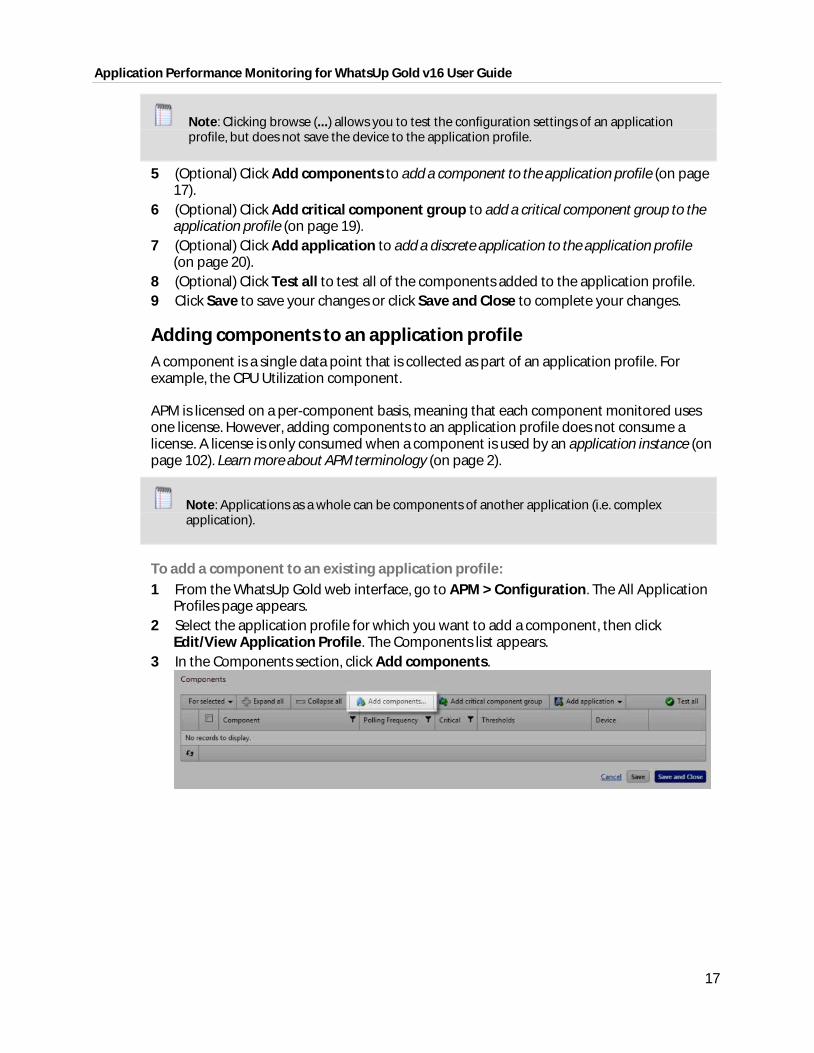
Edit/View Application Profile. The Components list appears. 3 In the Components section, click Add components.
Application Performance Monitoring for WhatsUp Gold v16 User Guide
18
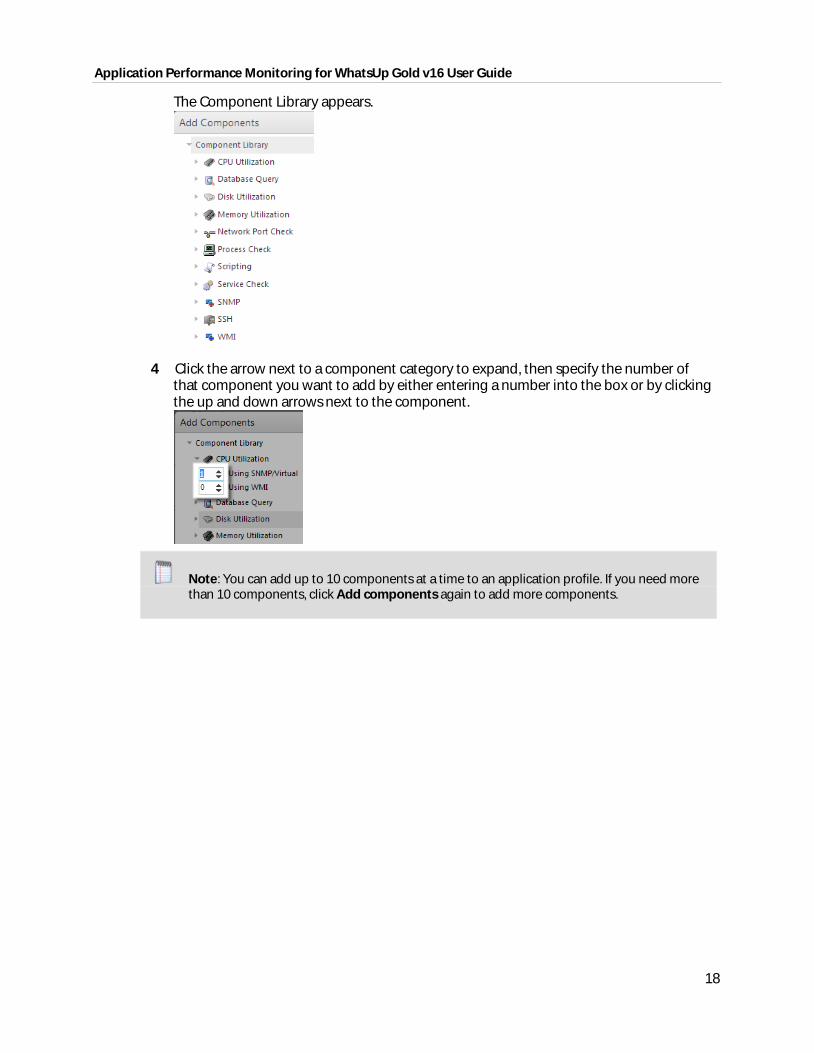
The Component Library appears.
4 Click the arrow next to a component category to expand, then specify the number of
that component you want to add by either entering a number into the box or by clicking the up and down arrows next to the component.
Note: You can add up to 10 components at a time to an application profile. If you need more than 10 components, click Add components again to add more components.
Application Performance Monitoring for WhatsUp Gold v16 User Guide
19
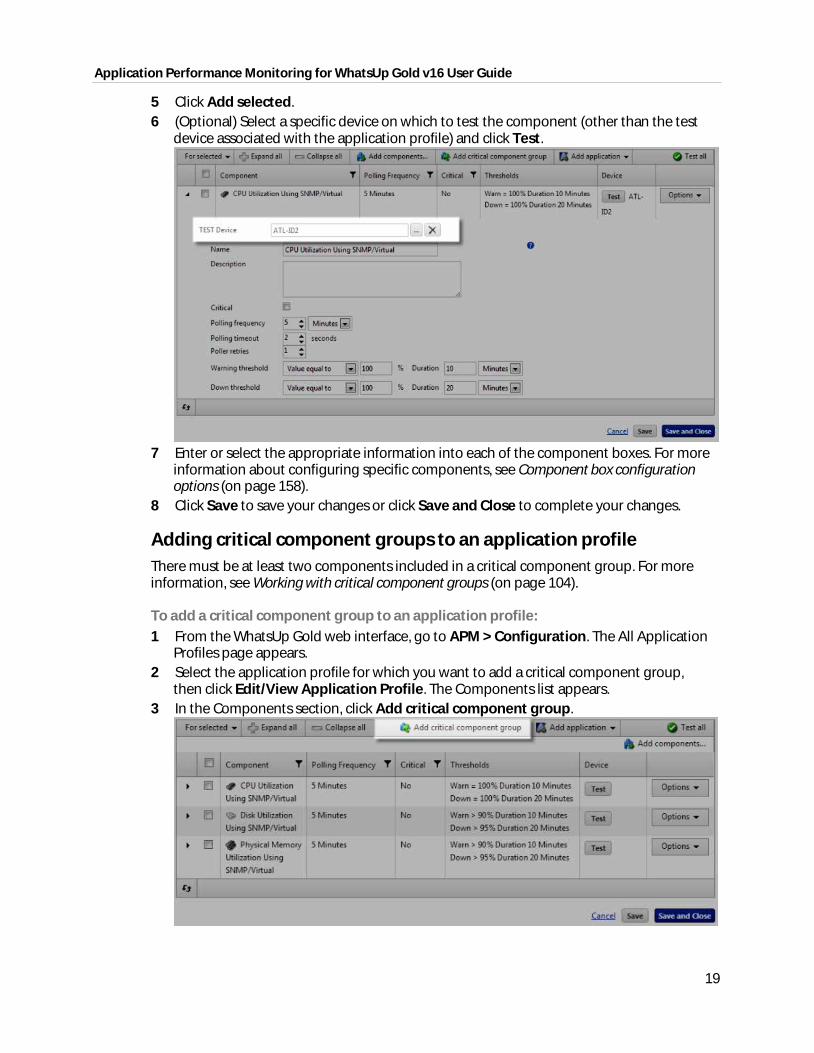
5 Click Add selected. 6 (Optional) Select a specific device on which to test the component (other than the test
device associated with the application profile) and click Test.
7 Enter or select the appropriate information into each of the component boxes. For more
information about configuring specific components, see Component box configuration options (on page 158).
8 Click Save to save your changes or click Save and Close to complete your changes.
Adding critical component groups to an application profile There must be at least two components included in a critical component group. For more information, see Working with critical component groups (on page 104).
To add a critical component group to an application profile: 1 From the WhatsUp Gold web interface, go to APM > Configuration. The All Application
Profiles page appears. 2 Select the application profile for which you want to add a critical component group,
then click Edit/View Application Profile. The Components list appears. 3 In the Components section, click Add critical component group.
Application Performance Monitoring for WhatsUp Gold v16 User Guide
20
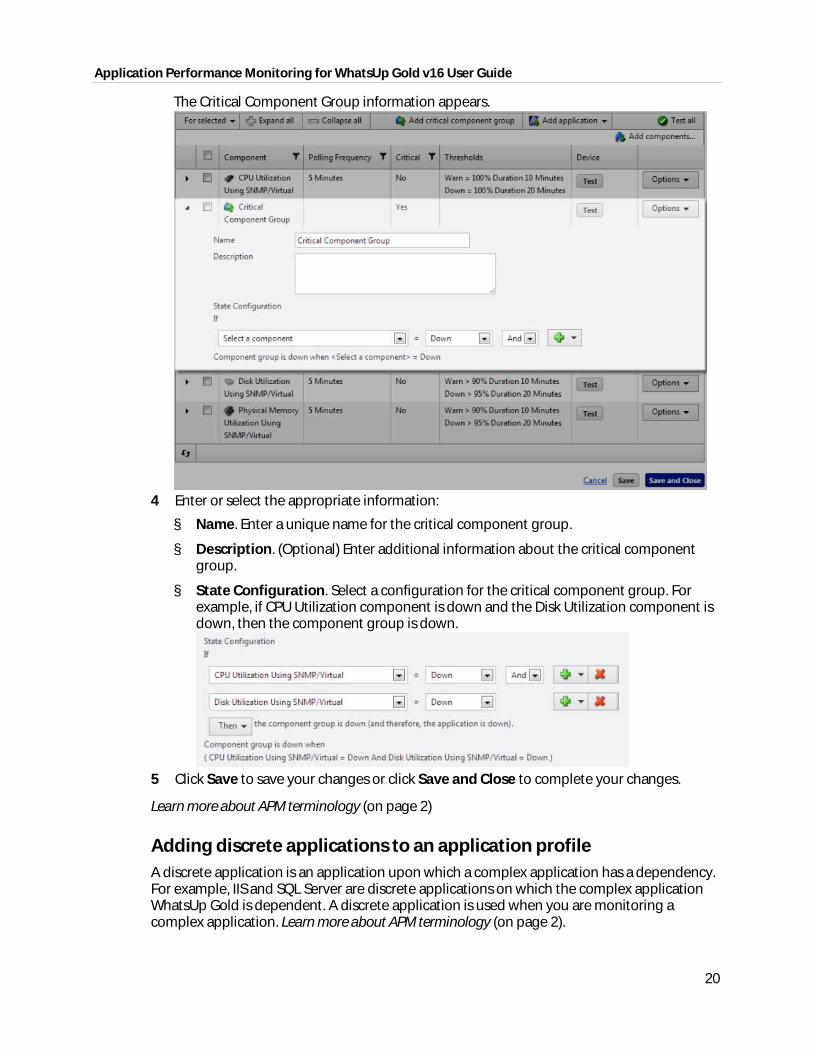
The Critical Component Group information appears.
4 Enter or select the appropriate information:
§ Name. Enter a unique name for the critical component group.
§ Description. (Optional) Enter additional information about the critical component group.
§ State Configuration. Select a configuration for the critical component group. For example, if CPU Utilization component is down and the Disk Utilization component is down, then the component group is down.
5 Click Save to save your changes or click Save and Close to complete your changes.
Learn more about APM terminology (on page 2)
Adding discrete applications to an application profile A discrete application is an application upon which a complex application has a dependency. For example, IIS and SQL Server are discrete applications on which the complex application WhatsUp Gold is dependent. A discrete application is used when you are monitoring a complex application. Learn more about APM terminology (on page 2).
Application Performance Monitoring for WhatsUp Gold v16 User Guide
21
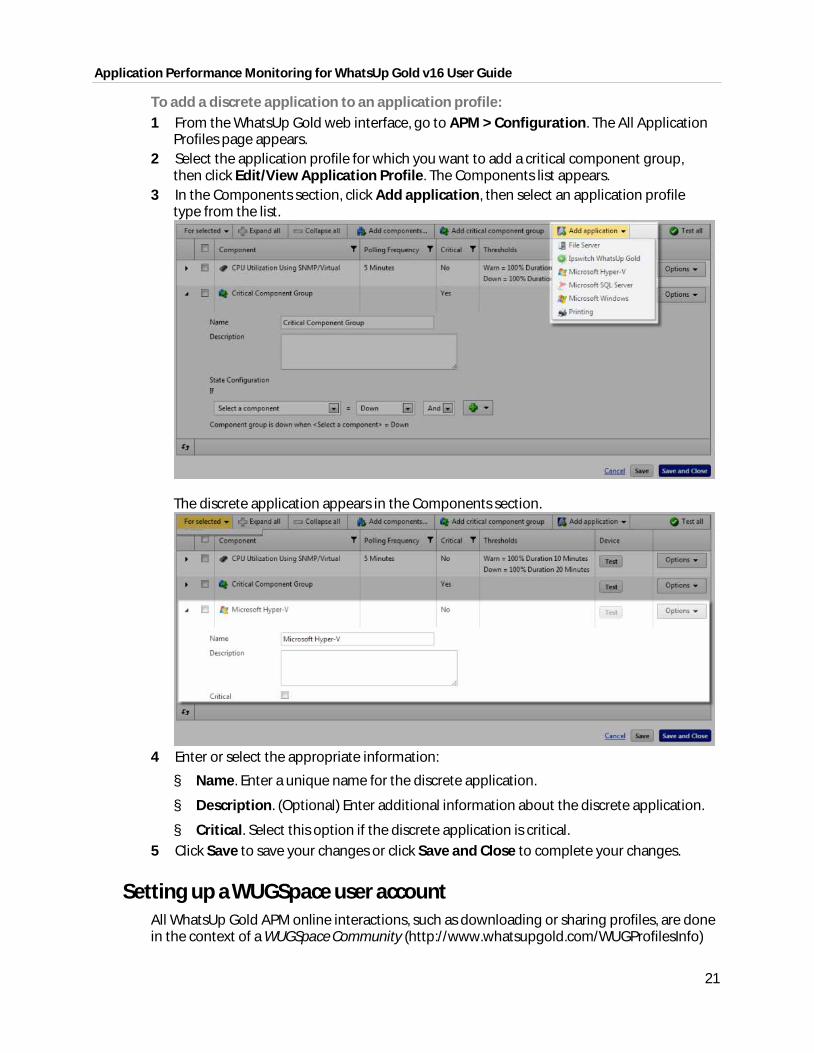
To add a discrete application to an application profile: 1 From the WhatsUp Gold web interface, go to APM > Configuration. The All Application
Profiles page appears. 2 Select the application profile for which you want to add a critical component group,
then click Edit/View Application Profile. The Components list appears. 3 In the Components section, click Add application, then select an application profile
type from the list.
The discrete application appears in the Components section.
4 Enter or select the appropriate information:
§ Name. Enter a unique name for the discrete application.
§ Description. (Optional) Enter additional information about the discrete application.
§ Critical. Select this option if the discrete application is critical. 5 Click Save to save your changes or click Save and Close to complete your changes.
Setting up a WUGSpace user account All WhatsUp Gold APM online interactions, such as downloading or sharing profiles, are done in the context of a WUGSpace Community (http://www.whatsupgold.com/WUGProfilesInfo)
Application Performance Monitoring for WhatsUp Gold v16 User Guide
22
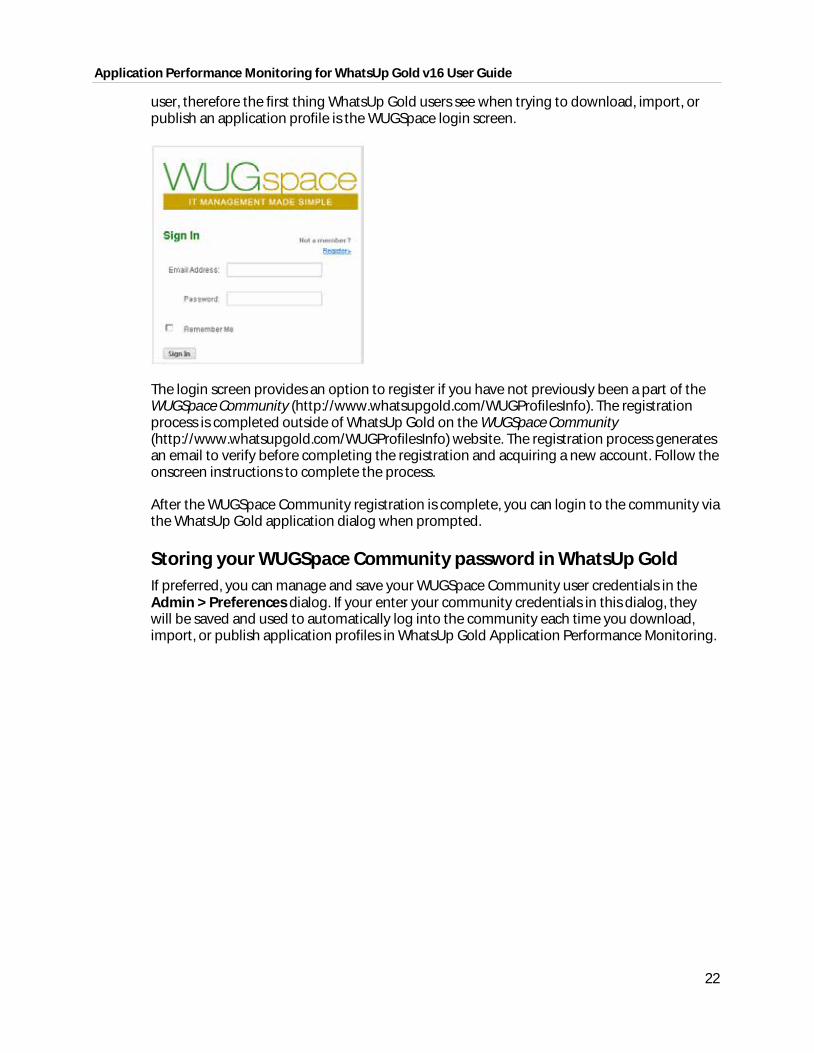
user, therefore the first thing WhatsUp Gold users see when trying to download, import, or publish an application profile is the WUGSpace login screen.
The login screen provides an option to register if you have not previously been a part of the WUGSpace Community (http://www.whatsupgold.com/WUGProfilesInfo). The registration process is completed outside of WhatsUp Gold on the WUGSpace Community (http://www.whatsupgold.com/WUGProfilesInfo) website. The registration process generates an email to verify before completing the registration and acquiring a new account. Follow the onscreen instructions to complete the process.
After the WUGSpace Community registration is complete, you can login to the community via the WhatsUp Gold application dialog when prompted.
Storing your WUGSpace Community password in WhatsUp Gold If preferred, you can manage and save your WUGSpace Community user credentials in the Admin > Preferences dialog. If your enter your community credentials in this dialog, they will be saved and used to automatically log into the community each time you download, import, or publish application profiles in WhatsUp Gold Application Performance Monitoring.
Application Performance Monitoring for WhatsUp Gold v16 User Guide
23
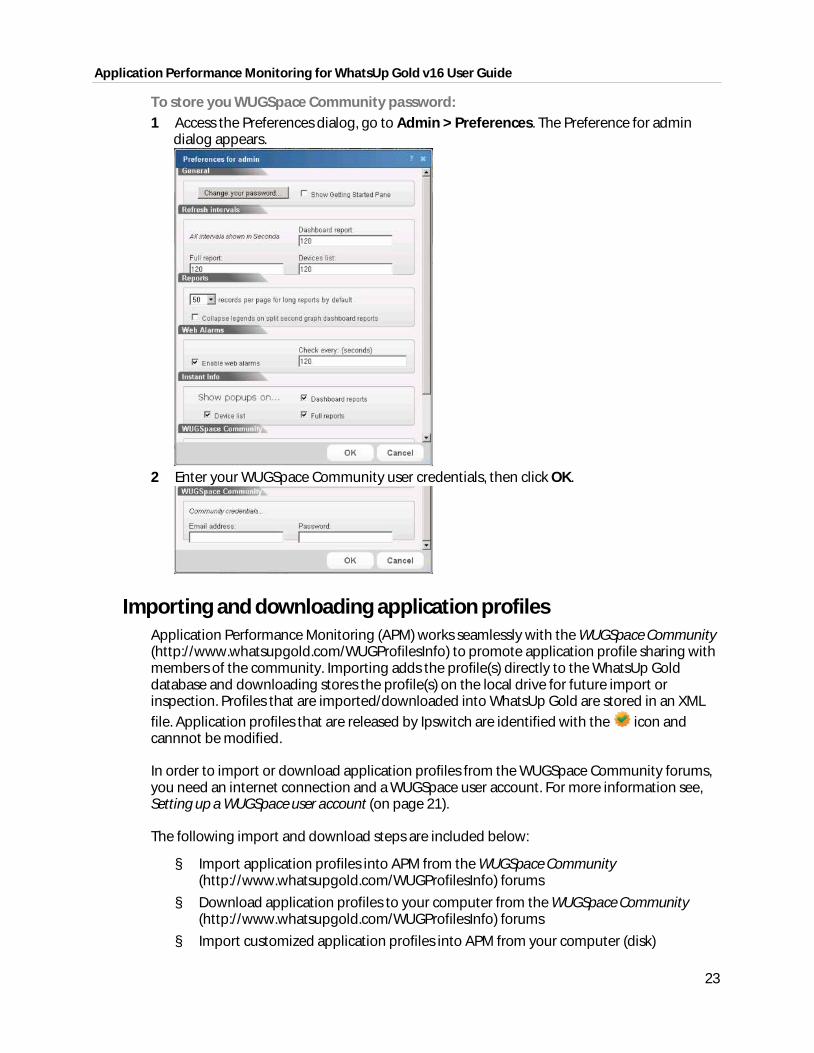
To store you WUGSpace Community password: 1 Access the Preferences dialog, go to Admin > Preferences. The Preference for admin
dialog appears.
2 Enter your WUGSpace Community user credentials, then click OK.
Importing and downloading application profiles Application Performance Monitoring (APM) works seamlessly with the WUGSpace Community (http://www.whatsupgold.com/WUGProfilesInfo) to promote application profile sharing with members of the community. Importing adds the profile(s) directly to the WhatsUp Gold database and downloading stores the profile(s) on the local drive for future import or inspection. Profiles that are imported/downloaded into WhatsUp Gold are stored in an XML file. Application profiles that are released by Ipswitch are identified with the icon and cannnot be modified.
In order to import or download application profiles from the WUGSpace Community forums, you need an internet connection and a WUGSpace user account. For more information see, Setting up a WUGSpace user account (on page 21).
The following import and download steps are included below:
§ Import application profiles into APM from the WUGSpace Community (http://www.whatsupgold.com/WUGProfilesInfo) forums
§ Download application profiles to your computer from the WUGSpace Community (http://www.whatsupgold.com/WUGProfilesInfo) forums
§ Import customized application profiles into APM from your computer (disk)
Application Performance Monitoring for WhatsUp Gold v16 User Guide
24
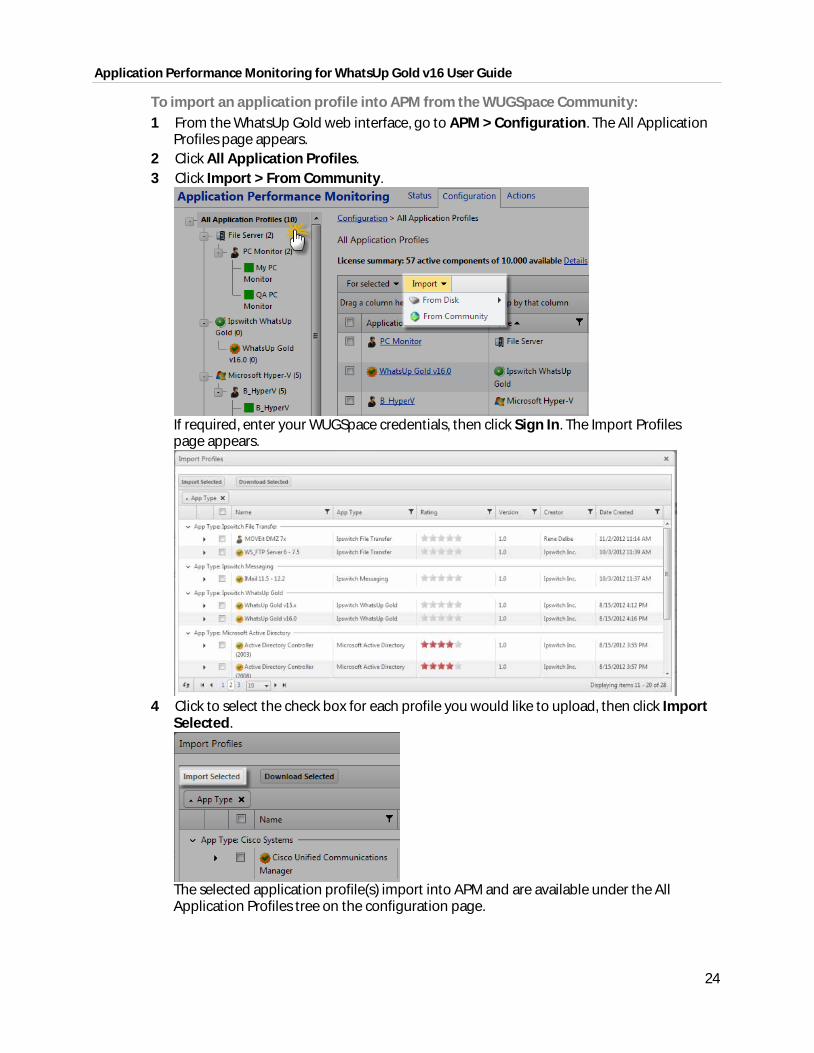
To import an application profile into APM from the WUGSpace Community: 1 From the WhatsUp Gold web interface, go to APM > Configuration. The All Application
Profiles page appears. 2 Click All Application Profiles. 3 Click Import > From Community.
If required, enter your WUGSpace credentials, then click Sign In. The Import Profiles page appears.
4 Click to select the check box for each profile you would like to upload, then click Import
Selected.
The selected application profile(s) import into APM and are available under the All Application Profiles tree on the configuration page.
Application Performance Monitoring for WhatsUp Gold v16 User Guide
25
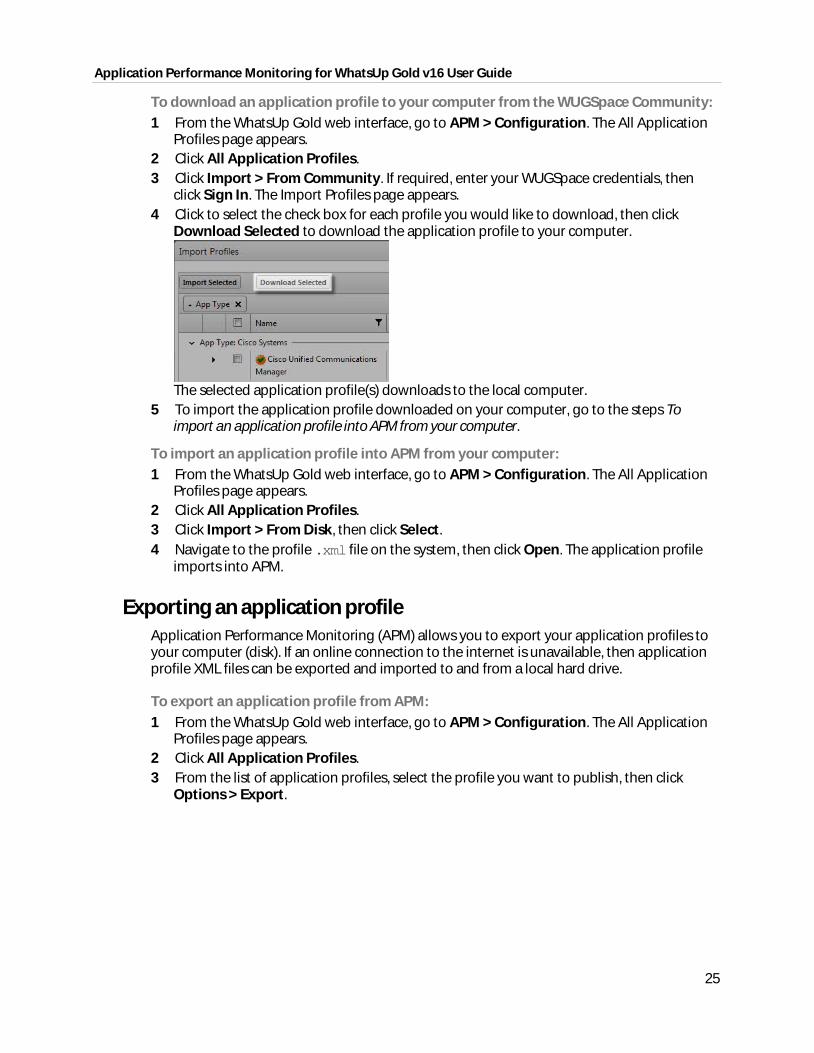
To download an application profile to your computer from the WUGSpace Community: 1 From the WhatsUp Gold web interface, go to APM > Configuration. The All Application
Profiles page appears. 2 Click All Application Profiles. 3 Click Import > From Community. If required, enter your WUGSpace credentials, then
click Sign In. The Import Profiles page appears. 4 Click to select the check box for each profile you would like to download, then click
Download Selected to download the application profile to your computer.
The selected application profile(s) downloads to the local computer.
5 To import the application profile downloaded on your computer, go to the steps To import an application profile into APM from your computer.
To import an application profile into APM from your computer: 1 From the WhatsUp Gold web interface, go to APM > Configuration. The All Application
Profiles page appears. 2 Click All Application Profiles. 3 Click Import > From Disk, then click Select. 4 Navigate to the profile .xml file on the system, then click Open. The application profile
imports into APM.
Exporting an application profile Application Performance Monitoring (APM) allows you to export your application profiles to your computer (disk). If an online connection to the internet is unavailable, then application profile XML files can be exported and imported to and from a local hard drive.
To export an application profile from APM: 1 From the WhatsUp Gold web interface, go to APM > Configuration. The All Application
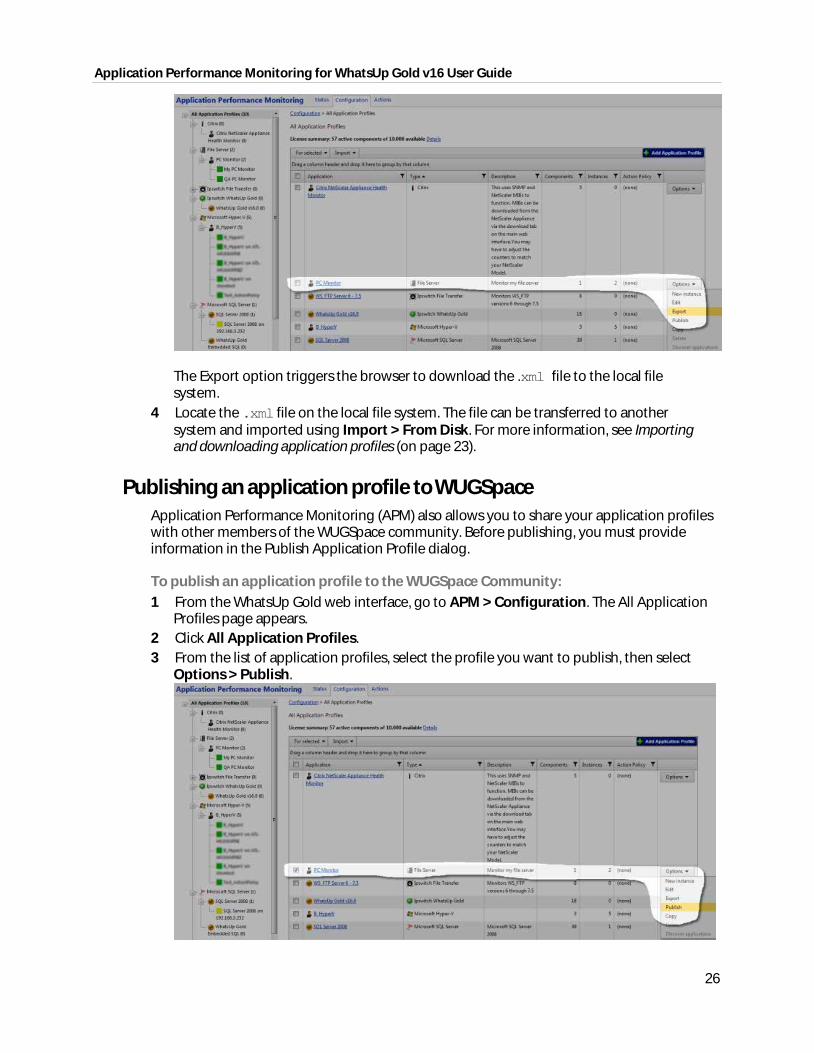
Profiles page appears. 2 Click All Application Profiles. 3 From the list of application profiles, select the profile you want to publish, then click
Options > Export.
Application Performance Monitoring for WhatsUp Gold v16 User Guide
26
The Export option triggers the browser to download the .xml file to the local file system.
4 Locate the .xml file on the local file system. The file can be transferred to another system and imported using Import > From Disk. For more information, see Importing and downloading application profiles (on page 23).
Publishing an application profile to WUGSpace Application Performance Monitoring (APM) also allows you to share your application profiles with other members of the WUGSpace community. Before publishing, you must provide information in the Publish Application Profile dialog.
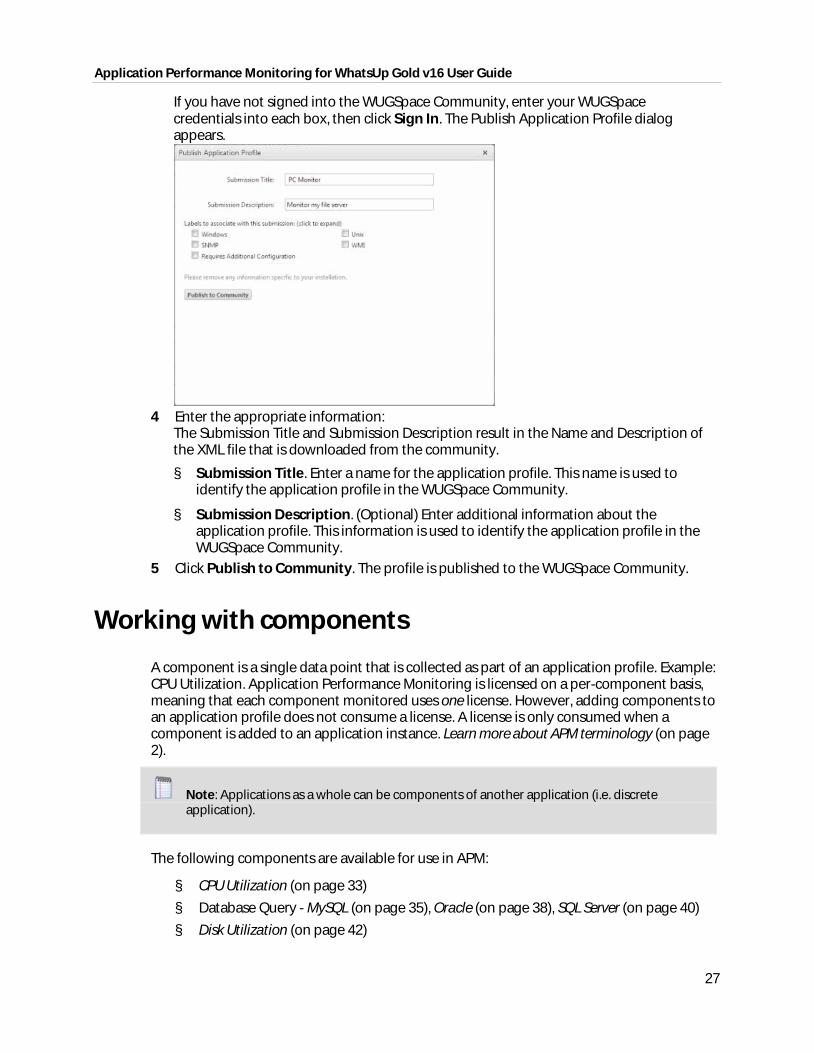
To publish an application profile to the WUGSpace Community: 1 From the WhatsUp Gold web interface, go to APM > Configuration. The All Application
Profiles page appears. 2 Click All Application Profiles. 3 From the list of application profiles, select the profile you want to publish, then select
Options > Publish.
Application Performance Monitoring for WhatsUp Gold v16 User Guide
27
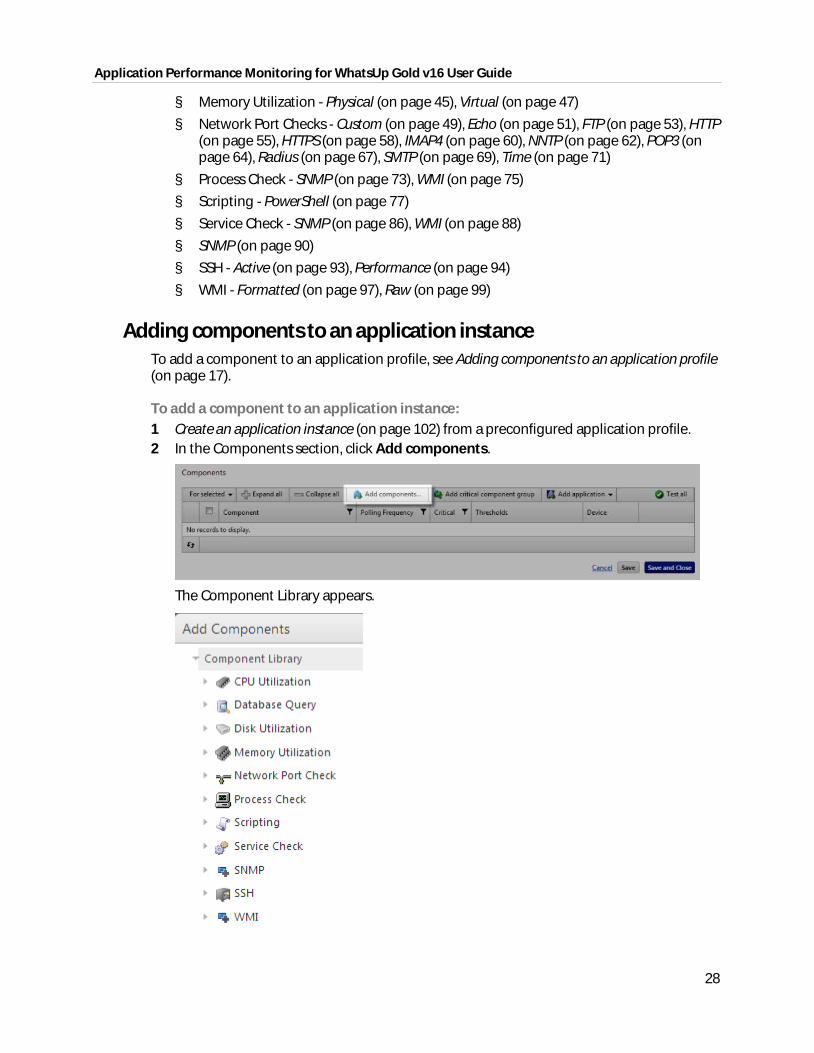
If you have not signed into the WUGSpace Community, enter your WUGSpace credentials into each box, then click Sign In. The Publish Application Profile dialog appears.
4 Enter the appropriate information:
The Submission Title and Submission Description result in the Name and Description of the XML file that is downloaded from the community.
§ Submission Title. Enter a name for the application profile. This name is used to identify the application profile in the WUGSpace Community.
§ Submission Description. (Optional) Enter additional information about the application profile. This information is used to identify the application profile in the WUGSpace Community.
5 Click Publish to Community. The profile is published to the WUGSpace Community.
Working with components
A component is a single data point that is collected as part of an application profile. Example: CPU Utilization. Application Performance Monitoring is licensed on a per-component basis, meaning that each component monitored uses one license. However, adding components to an application profile does not consume a license. A license is only consumed when a component is added to an application instance. Learn more about APM terminology (on page 2).
Note: Applications as a whole can be components of another application (i.e. discrete application).
The following components are available for use in APM:
§ CPU Utilization (on page 33)
§ Database Query - MySQL (on page 35), Oracle (on page 38), SQL Server (on page 40)
§ Disk Utilization (on page 42)
Application Performance Monitoring for WhatsUp Gold v16 User Guide
28
§ Memory Utilization - Physical (on page 45), Virtual (on page 47)
§ Network Port Checks - Custom (on page 49), Echo (on page 51), FTP (on page 53), HTTP (on page 55), HTTPS (on page 58), IMAP4 (on page 60), NNTP (on page 62), POP3 (on page 64), Radius (on page 67), SMTP (on page 69), Time (on page 71)
§ Process Check - SNMP (on page 73), WMI (on page 75)
§ Scripting - PowerShell (on page 77)
§ Service Check - SNMP (on page 86), WMI (on page 88)
§ SNMP (on page 90)
§ SSH - Active (on page 93), Performance (on page 94)
§ WMI - Formatted (on page 97), Raw (on page 99)
Adding components to an application instance To add a component to an application profile, see Adding components to an application profile (on page 17).
To add a component to an application instance: 1 Create an application instance (on page 102) from a preconfigured application profile. 2 In the Components section, click Add components.
The Component Library appears.
Application Performance Monitoring for WhatsUp Gold v16 User Guide
29
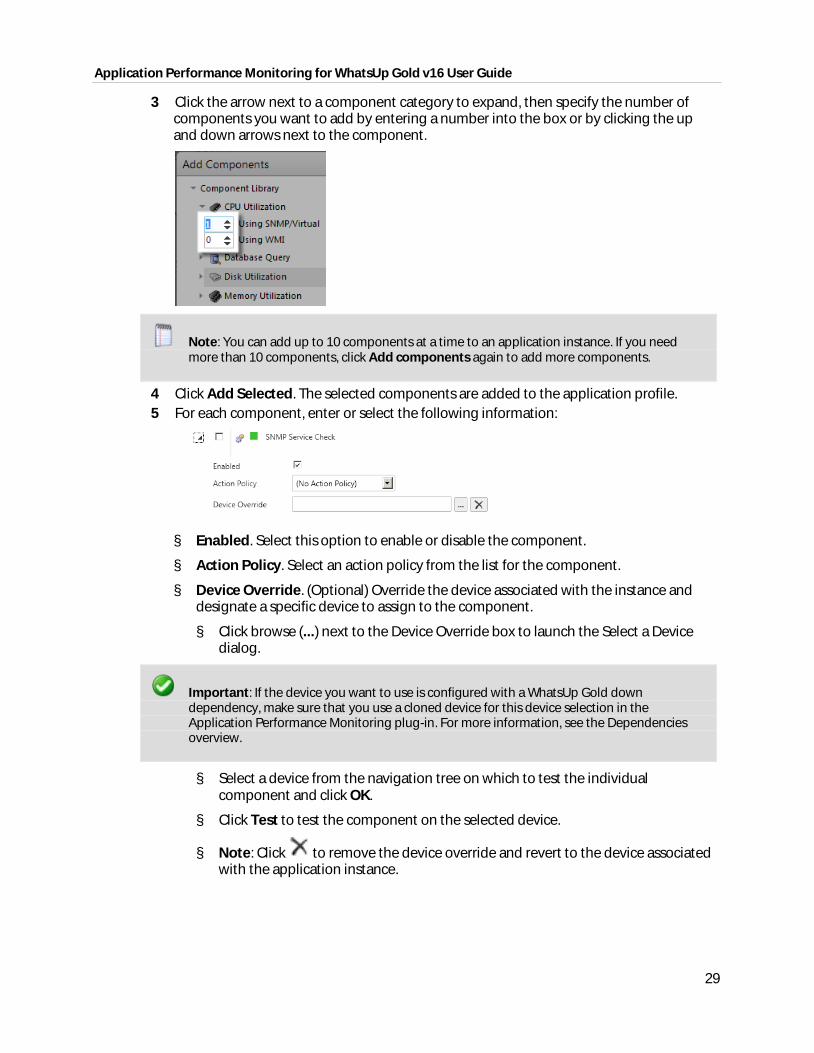
3 Click the arrow next to a component category to expand, then specify the number of components you want to add by entering a number into the box or by clicking the up and down arrows next to the component.
Note: You can add up to 10 components at a time to an application instance. If you need more than 10 components, click Add components again to add more components.
4 Click Add Selected. The selected components are added to the application profile. 5 For each component, enter or select the following information:
§ Enabled. Select this option to enable or disable the component.
§ Action Policy. Select an action policy from the list for the component.
§ Device Override. (Optional) Override the device associated with the instance and designate a specific device to assign to the component.
§ Click browse (...) next to the Device Override box to launch the Select a Device dialog.
Important: If the device you want to use is configured with a WhatsUp Gold down dependency, make sure that you use a cloned device for this device selection in the Application Performance Monitoring plug-in. For more information, see the Dependencies overview.
§ Select a device from the navigation tree on which to test the individual component and click OK.
§ Click Test to test the component on the selected device.
§ Note: Click to remove the device override and revert to the device associated with the application instance.
Application Performance Monitoring for WhatsUp Gold v16 User Guide
30
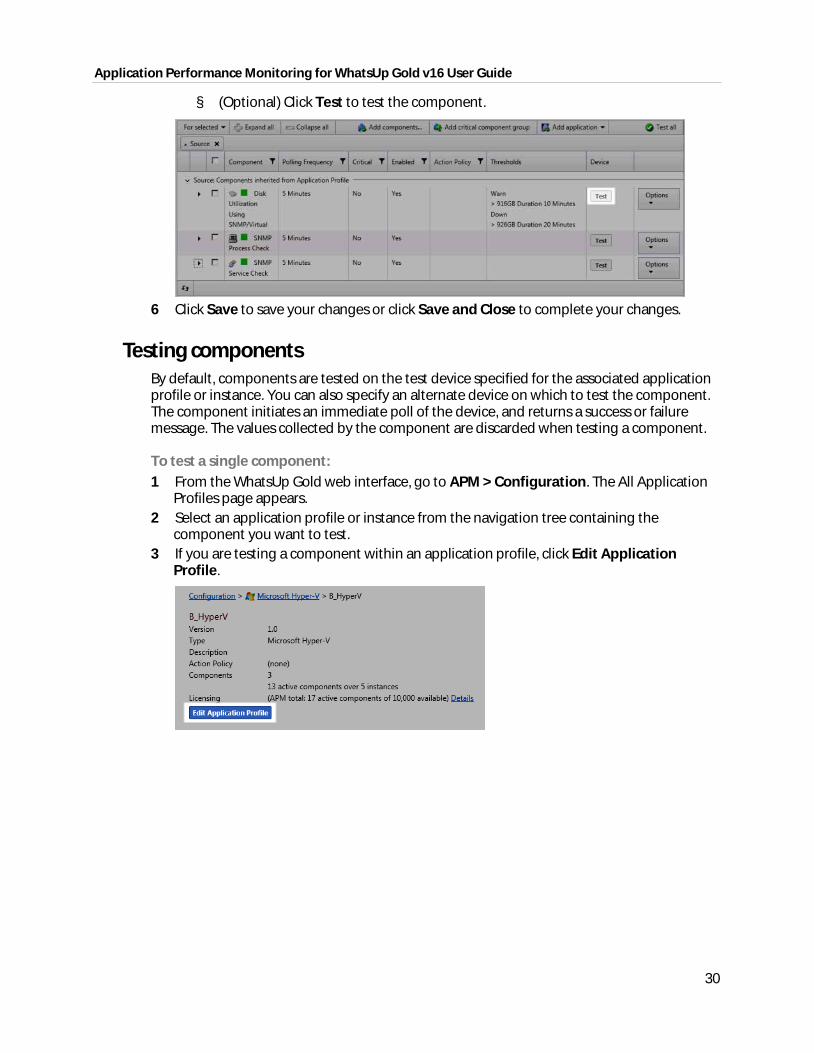
§ (Optional) Click Test to test the component.
6 Click Save to save your changes or click Save and Close to complete your changes.
Testing components By default, components are tested on the test device specified for the associated application profile or instance. You can also specify an alternate device on which to test the component. The component initiates an immediate poll of the device, and returns a success or failure message. The values collected by the component are discarded when testing a component.
To test a single component: 1 From the WhatsUp Gold web interface, go to APM > Configuration. The All Application
Profiles page appears. 2 Select an application profile or instance from the navigation tree containing the
component you want to test. 3 If you are testing a component within an application profile, click Edit Application
Profile.
Application Performance Monitoring for WhatsUp Gold v16 User Guide
31
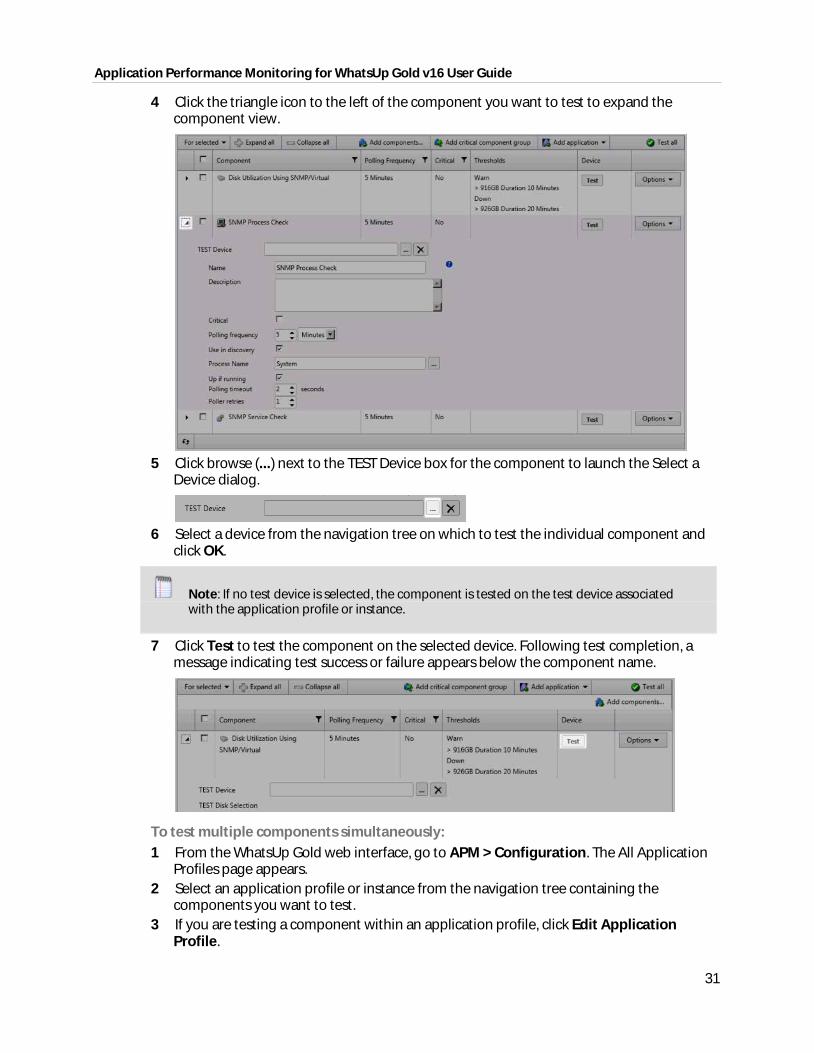
4 Click the triangle icon to the left of the component you want to test to expand the component view.
5 Click browse (...) next to the TEST Device box for the component to launch the Select a
Device dialog.
6 Select a device from the navigation tree on which to test the individual component and
click OK.
Note: If no test device is selected, the component is tested on the test device associated with the application profile or instance.
7 Click Test to test the component on the selected device. Following test completion, a message indicating test success or failure appears below the component name.
To test multiple components simultaneously: 1 From the WhatsUp Gold web interface, go to APM > Configuration. The All Application
Profiles page appears. 2 Select an application profile or instance from the navigation tree containing the
components you want to test. 3 If you are testing a component within an application profile, click Edit Application
Profile.
Application Performance Monitoring for WhatsUp Gold v16 User Guide
32
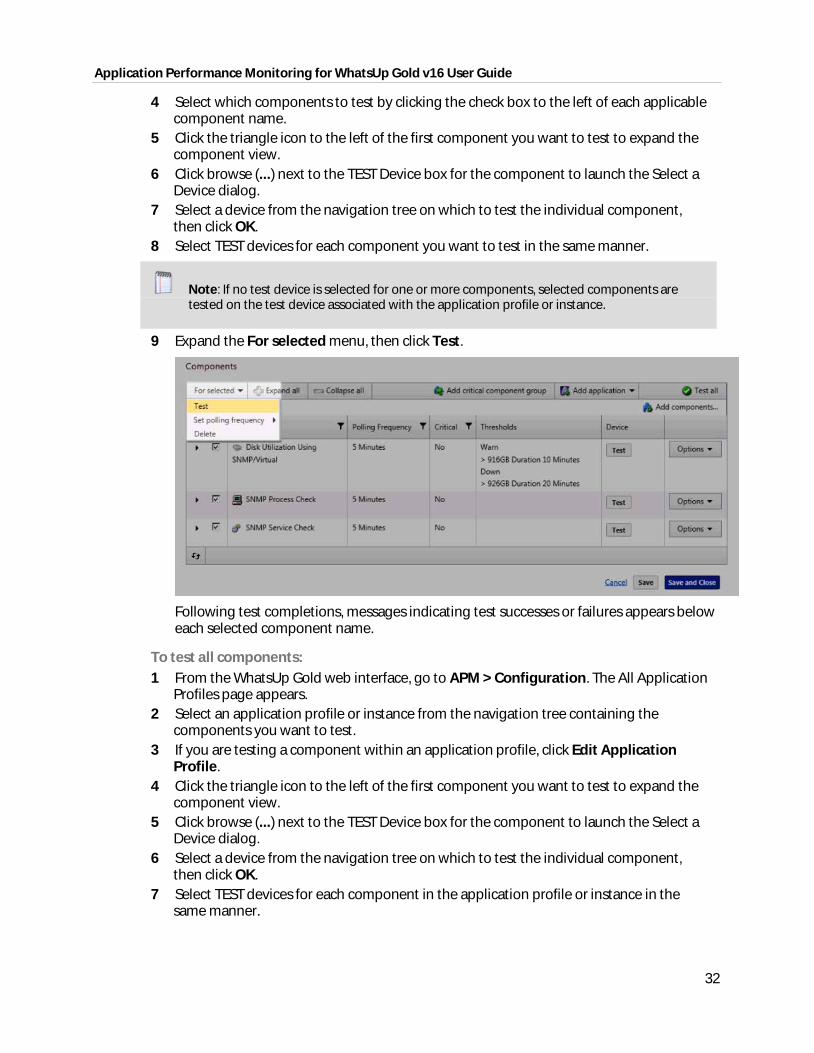
4 Select which components to test by clicking the check box to the left of each applicable component name.
5 Click the triangle icon to the left of the first component you want to test to expand the component view.
6 Click browse (...) next to the TEST Device box for the component to launch the Select a Device dialog.
7 Select a device from the navigation tree on which to test the individual component, then click OK.
8 Select TEST devices for each component you want to test in the same manner.
Note: If no test device is selected for one or more components, selected components are tested on the test device associated with the application profile or instance.
9 Expand the For selected menu, then click Test.
Following test completions, messages indicating test successes or failures appears below each selected component name.
To test all components: 1 From the WhatsUp Gold web interface, go to APM > Configuration. The All Application
Profiles page appears. 2 Select an application profile or instance from the navigation tree containing the
components you want to test. 3 If you are testing a component within an application profile, click Edit Application
Profile. 4 Click the triangle icon to the left of the first component you want to test to expand the
component view. 5 Click browse (...) next to the TEST Device box for the component to launch the Select a
Device dialog. 6 Select a device from the navigation tree on which to test the individual component,
then click OK. 7 Select TEST devices for each component in the application profile or instance in the
same manner.
Application Performance Monitoring for WhatsUp Gold v16 User Guide
33
Note: If no test device is selected for one or more components, selected components are tested on the test device associated with the application profile or instance.
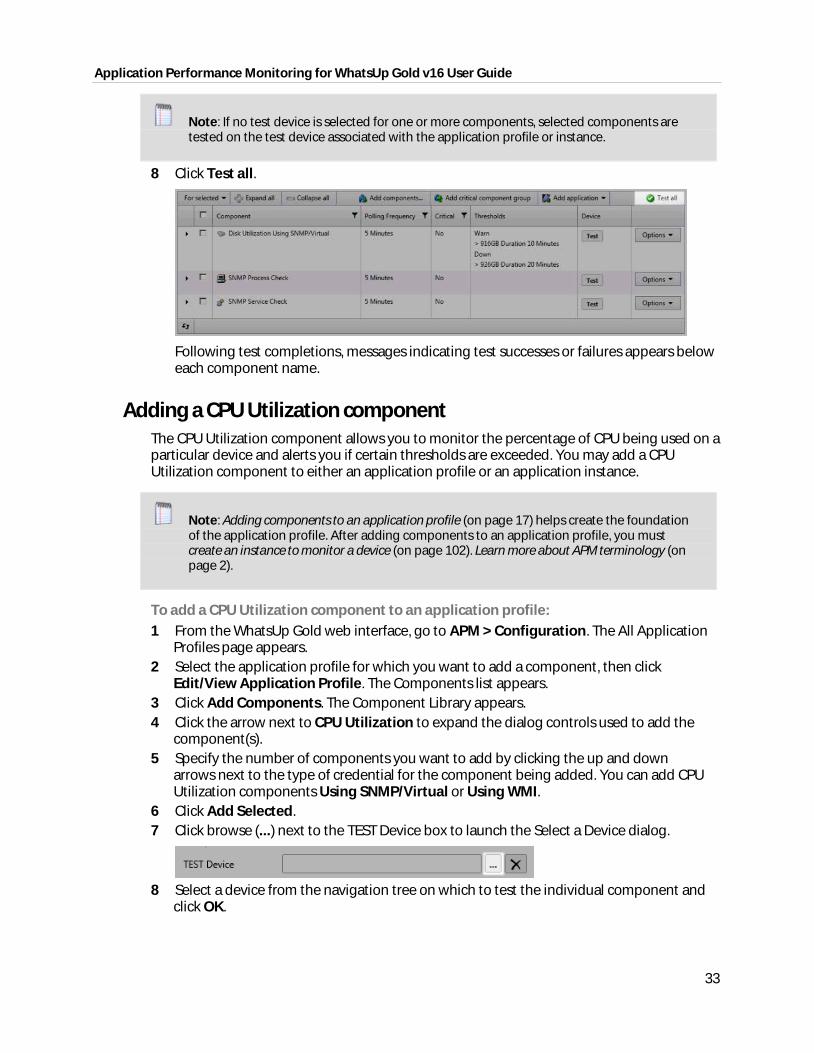
8 Click Test all.
Following test completions, messages indicating test successes or failures appears below each component name.
Adding a CPU Utilization component The CPU Utilization component allows you to monitor the percentage of CPU being used on a particular device and alerts you if certain thresholds are exceeded. You may add a CPU Utilization component to either an application profile or an application instance.
Note: Adding components to an application profile (on page 17) helps create the foundation of the application profile. After adding components to an application profile, you must create an instance to monitor a device (on page 102). Learn more about APM terminology (on page 2).
To add a CPU Utilization component to an application profile: 1 From the WhatsUp Gold web interface, go to APM > Configuration. The All Application
Profiles page appears. 2 Select the application profile for which you want to add a component, then click
Edit/View Application Profile. The Components list appears. 3 Click Add Components. The Component Library appears. 4 Click the arrow next to CPU Utilization to expand the dialog controls used to add the
component(s). 5 Specify the number of components you want to add by clicking the up and down
arrows next to the type of credential for the component being added. You can add CPU Utilization components Using SNMP/Virtual or Using WMI.
6 Click Add Selected. 7 Click browse (...) next to the TEST Device box to launch the Select a Device dialog.
8 Select a device from the navigation tree on which to test the individual component and
click OK.
Application Performance Monitoring for WhatsUp Gold v16 User Guide
34
9 Click Test to test the component on the selected device (optional). To remove the device override and revert to the device associated with the application component,
click .
Note: If no test device is selected, the component is tested on the test device associated with the application profile.
Test devices are not saved as part of the application profile.
10 Enter or select the appropriate information in the CPU Utilization component boxes (on page 35).
11 Click Save to save your changes or click Save and Close to complete your changes.
To add a CPU Utilization component to an application instance: 1 From the WhatsUp Gold web interface, go to APM > Configuration. The All Application
Profiles page appears. 2 Select the application instance for which you want to add a component. 3 Click Add components. The Component Library appears. 4 Click the arrow next to CPU Utilization. 5 Specify the number of components you want to add by clicking the up and down
arrows next to the type of credential for the component being added. You can add CPU Utilization components using SNMP/Virtual or WMI.
6 Click Add selected. 7 Enter or select the appropriate information:
§ Enabled. Select this option to enable or disable the component.
§ Action Policy. Select an action policy from the list for the component.
§ Device Override. (Optional) Override the device associated with the instance and designate a specific device to assign to the component.
§ Click browse (...) next to the Device Override box to launch the Select a Device dialog.
Important: If the device you want to use is configured with a WhatsUp Gold down dependency, make sure that you use a cloned device for this device selection in the Application Performance Monitoring plug-in. For more information, see the Dependencies overview.
§ Select a device from the navigation tree on which to test the individual component and click OK.
§ Click Test to test the component on the selected device.
Note: Click to remove the device override and revert to the device associated with the application instance.
8 Enter or select the appropriate information in the CPU Utilization component boxes (on page 35).
9 Click Save to save your changes or click Save and Close to complete your changes.
Application Performance Monitoring for WhatsUp Gold v16 User Guide
35
CPU Utilization component fields You may configure the following boxes for the CPU Utilization component:
§ Name. Enter a unique name for the component.
§ Description. (Optional) Enter additional information about the component.
§ Critical. Click to select this check box if the component is critical.
Note: Components specified as critical cause the application to go into a down state when the component is out of threshold. Non-critical components cause the application to go into a warning state. For more information on application states, see Working with application states (on page 132).
§ Polling frequency. Select a time (in minutes or hours) you want APM to wait between polls.
§ Polling timeout. Enter the length of time APM attempts to connect to the selected device. When the time you enter is exceeded without connecting, a timeout occurs and APM stops trying to connect to the device. This is considered a failed connection.
§ Poller retries. Enter the number of times APM attempts to send the command before the device is considered down.
§ Warning threshold. Enter the component thresholds for the warning state. For example, if the component value is greater than 90 percent for 5 minutes, put the component in the warning state.
§ Down threshold. Enter the component thresholds for the down state. For example, if the component value is greater than 95 percent for 5 minutes, put the component in the down state.
Adding a MySQL Query component The MySQL Query component allows you to create a query to run on a specific device to assess the health of a MySQL database. You can add a MySQL Query component to either an application profile or and application instance.
Note: Adding components to an application profile (on page 17) helps create the foundation of the application profile. After adding components to an application profile, you must create an instance to monitor a device (on page 102). Learn more about APM terminology (on page 2).
To add a MySQL Query component to an application profile: 1 From the WhatsUp Gold web interface, go to APM > Configuration. The All Application
Profiles page appears. 2 Select the application profile for which you want to add a component, then click
Edit/View Application Profile. The Components list appears. 3 Click Add Components. The Component Library appears. 4 Click the arrow next to Database Query to expand the dialog controls used to add the
component(s).
Application Performance Monitoring for WhatsUp Gold v16 User Guide
36
5 Specify the number of components you want to add by clicking the up and down arrows next to MySQL.
6 Click Add Selected. 7 Click browse (...) next to the TEST Device box to launch the Select a Device dialog.
8 Select a device from the navigation tree on which to test the individual component and
click OK. 9 Click Test to test the component on the selected device (optional). To remove the
device override and revert to the device associated with the application component,
click .
Note: If no test device is selected, the component is tested on the test device associated with the application profile.
Test devices are not saved as part of the application profile.
10 Enter or select the appropriate information in the MySQL Query component boxes (on page 37).
11 Click Save to save your changes or click Save and Close to complete your changes.
To add a MySQL Query component to an application instance: 1 From the WhatsUp Gold web interface, go to APM > Configuration. The All Application
Profiles page appears. 2 Select the application instance for which you want to add a component. 3 Click Add Components. The Component Library appears. 4 Click the arrow next to Database Query, then specify the number of components you
want to add by clicking the up and down arrows next to MySQL. 5 Click Add Selected. 6 Enter or select the appropriate information:
§ Enabled. Select this option to enable or disable the component.
§ Action Policy. Select an action policy from the list for the component.
§ Device Override. (Optional) Override the device associated with the instance and designate a specific device to assign to the component.
§ Click browse (...) next to the Device Override box to launch the Select a Device dialog.
Important: If the device you want to use is configured with a WhatsUp Gold down dependency, make sure that you use a cloned device for this device selection in the Application Performance Monitoring plug-in. For more information, see the Dependencies overview.
§ Select a device from the navigation tree on which to test the individual component and click OK.
§ Click Test to test the component on the selected device.
Application Performance Monitoring for WhatsUp Gold v16 User Guide
37
Note: Click to remove the device override and revert to the device associated with the application instance.
7 Enter or select the appropriate information in the MySQL Query component boxes (on page 37).
8 Click Save to save your changes or click Save and Close to complete your changes.
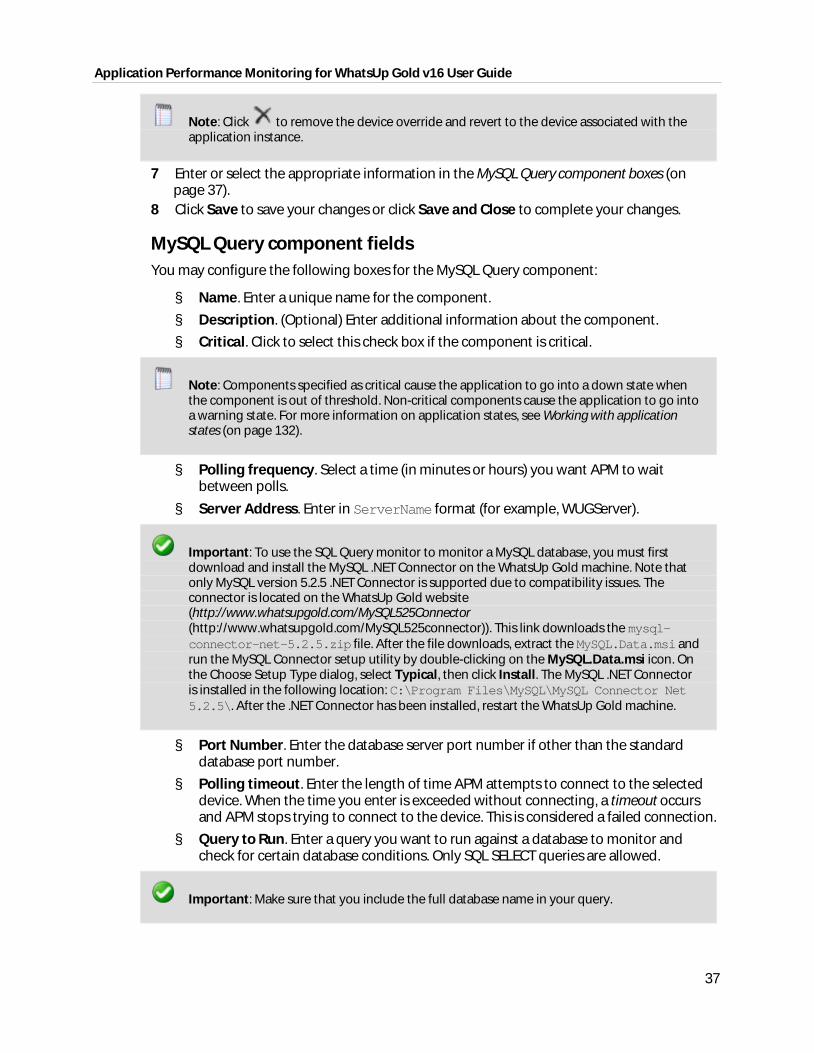
MySQL Query component fields You may configure the following boxes for the MySQL Query component:
§ Name. Enter a unique name for the component.
§ Description. (Optional) Enter additional information about the component.
§ Critical. Click to select this check box if the component is critical.
Note: Components specified as critical cause the application to go into a down state when the component is out of threshold. Non-critical components cause the application to go into a warning state. For more information on application states, see Working with application states (on page 132).
§ Polling frequency. Select a time (in minutes or hours) you want APM to wait between polls.
§ Server Address. Enter in ServerName format (for example, WUGServer).
Important: To use the SQL Query monitor to monitor a MySQL database, you must first download and install the MySQL .NET Connector on the WhatsUp Gold machine. Note that only MySQL version 5.2.5 .NET Connector is supported due to compatibility issues. The connector is located on the WhatsUp Gold website (http://www.whatsupgold.com/MySQL525Connector (http://www.whatsupgold.com/MySQL525connector)). This link downloads the mysql-connector-net-5.2.5.zip file. After the file downloads, extract the MySQL.Data.msi and run the MySQL Connector setup utility by double-clicking on the MySQL.Data.msi icon. On the Choose Setup Type dialog, select Typical, then click Install. The MySQL .NET Connector is installed in the following location: C:\Program Files\MySQL\MySQL Connector Net 5.2.5\. After the .NET Connector has been installed, restart the WhatsUp Gold machine.
§ Port Number. Enter the database server port number if other than the standard database port number.
§ Polling timeout. Enter the length of time APM attempts to connect to the selected device. When the time you enter is exceeded without connecting, a timeout occurs and APM stops trying to connect to the device. This is considered a failed connection.
§ Query to Run. Enter a query you want to run against a database to monitor and check for certain database conditions. Only SQL SELECT queries are allowed.
Important: Make sure that you include the full database name in your query.
Application Performance Monitoring for WhatsUp Gold v16 User Guide
38
§ Warning threshold. Enter the component thresholds for the warning state. For example, if the component value is greater than 90 for 5 minutes, put the component in the warning state.
§ Down threshold. Enter the component thresholds for the down state. For example, if the component value is greater than 95 for 5 minutes, put the component in the down state.
Adding an Oracle Query component The Oracle Query component allows you to create a query to run on a specific device to assess the health of an Oracle database. You may add an Oracle Query component to either an application profile or an application instance.
Note: Adding components to an application profile (on page 17) helps create the foundation of the application profile. After adding components to an application profile, you must create an instance to monitor a device (on page 102). Learn more about APM terminology (on page 2).
To add an Oracle Query component to an application profile: 1 From the WhatsUp Gold web interface, go to APM > Configuration. The All Application
Profiles page appears. 2 Select the application profile for which you want to add a component, then click
Edit/View Application Profile. The Components list appears. 3 Click Add Components. The Component Library appears. 4 Click the arrow next to Database Query to expand the dialog controls used to add the
component(s). 5 Specify the number of components you want to add by clicking the up and down
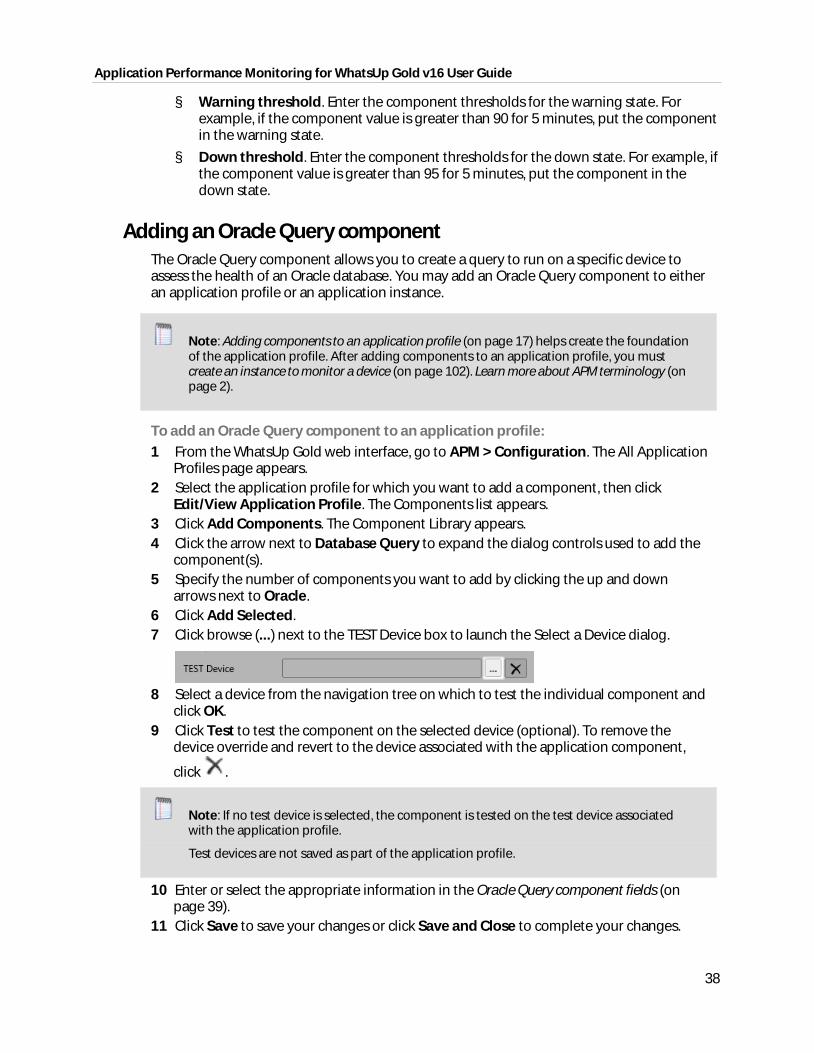
arrows next to Oracle. 6 Click Add Selected. 7 Click browse (...) next to the TEST Device box to launch the Select a Device dialog.
8 Select a device from the navigation tree on which to test the individual component and
click OK. 9 Click Test to test the component on the selected device (optional). To remove the
device override and revert to the device associated with the application component,
click .
Note: If no test device is selected, the component is tested on the test device associated with the application profile.
Test devices are not saved as part of the application profile.
10 Enter or select the appropriate information in the Oracle Query component fields (on page 39).
11 Click Save to save your changes or click Save and Close to complete your changes.
Application Performance Monitoring for WhatsUp Gold v16 User Guide
39
To add an Oracle Query component to an application instance: 1 From the WhatsUp Gold web interface, go to APM > Configuration. The All Application
Profiles page appears. 2 Select the application instance for which you want to add a component. 3 Click Add Components. The Component Library appears. 4 Click the arrow next to Database Query, then specify the number of components you
want to add by clicking the up and down arrows next to Oracle. 5 Click Add Selected. 6 Enter or select the appropriate information:
§ Enabled. Select this option to enable or disable the component.
§ Action Policy. Select an action policy from the list for the component.
§ Device Override. (Optional) Override the device associated with the instance and designate a specific device to assign to the component.
§ Click browse (...) next to the Device Override box to launch the Select a Device dialog.
Important: If the device you want to use is configured with a WhatsUp Gold down dependency, make sure that you use a cloned device for this device selection in the Application Performance Monitoring plug-in. For more information, see the Dependencies overview.
§ Select a device from the navigation tree on which to test the individual component and click OK.
§ Click Test to test the component on the selected device.
Note: Click to remove the device override and revert to the device associated with the application instance.
7 Enter or select the appropriate information in the Oracle Query component boxes (on page 39).
8 Click Save to save your changes or click Save and Close to complete your changes.
Oracle Query component fields You may configure the following boxes for the Oracle Query component:
§ Name. Enter a unique name for the component.
§ Description. (Optional) Enter additional information about the component.
§ Critical. Click to select this check box if the component is critical.
Note: Components specified as critical cause the application to go into a down state when the component is out of threshold. Non-critical components cause the application to go into a warning state. For more information on application states, see Working with application states (on page 132).
Application Performance Monitoring for WhatsUp Gold v16 User Guide
40
§ Polling frequency. Select a time (in minutes or hours) you want APM to wait between polls.
§ Service name. Enter the ServiceName.
§ Port (optional). Enter the database server port number if other than the standard database port number.
§ Connection timeout. Enter the length of time APM attempts to connect to the selected device. When the time you enter is exceeded without connecting, a timeout occurs and APM stops trying to connect to the device. This is considered a failed connection.
§ Query to Run. Enter a query you want to run against a database to monitor and check for certain database conditions. Only select queries are allowed.
Important: Make sure that you include the full database name in your query.
§ Warning threshold. Enter the component thresholds for the warning state. For example, if the component value is greater than 90 for 5 minutes, put the component in the warning state.
§ Down threshold. Enter the component thresholds for the down state. For example, if the component value is greater than 95 for 5 minutes, put the component in the down state.
Adding a SQL Server Query component The SQL Server component provides you with real-time information about the state and health of a Microsoft® SQL Server 2000 application on a specific device. You may add a SQL Server Query component to either an application profile or an application instance.
Note: Adding components to an application profile (on page 17) helps create the foundation of the application profile. After adding components to an application profile, you must create an instance to monitor a device (on page 102). Learn more about APM terminology (on page 2).
To add a SQL Server Query component to an application profile: 1 From the WhatsUp Gold web interface, go to APM > Configuration. The All Application
Profiles page appears. 2 Select the application profile for which you want to add a component, then click
Edit/View Application Profile. The Components list appears. 3 Click Add Components. The Component Library appears. 4 Click the arrow next to Database Query to expand the dialog controls used to add the
component(s). 5 Specify the number of components you want to add by clicking the up and down
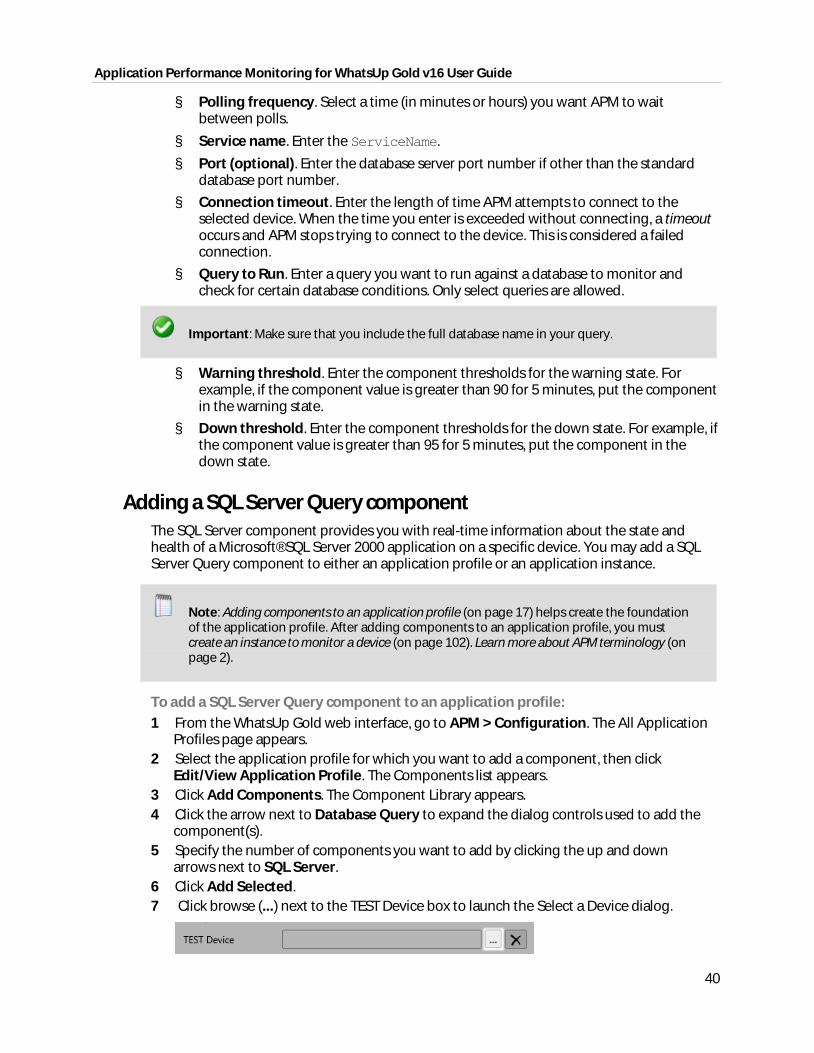
arrows next to SQL Server. 6 Click Add Selected. 7 Click browse (...) next to the TEST Device box to launch the Select a Device dialog.
Application Performance Monitoring for WhatsUp Gold v16 User Guide
41
8 Select a device from the navigation tree on which to test the individual component and click OK.
9 Click Test to test the component on the selected device (optional). To remove the device override and revert to the device associated with the application component,
click .
Note: If no test device is selected, the component is tested on the test device associated with the application profile.
Test devices are not saved as part of the application profile.
10 Enter or select the appropriate information in the SQL Server Query component boxes (on page 42).
11 Enter or select the appropriate information: 12 Click Save to save your changes or click Save and Close to complete your changes.
To add a SQL Server Query component to an application instance: 1 From the WhatsUp Gold web interface, go to APM > Configuration. The All Application
Profiles page appears. 2 Select the application instance for which you want to add a component. 3 Click Add Components. The Component Library appears. 4 Click the arrow next to Database Query, then specify the number of components you
want to add by clicking the up and down arrows next to SQL Server. 5 Click Add Selected. 6 Enter or select the appropriate information:
§ Enabled. Select this option to enable or disable the component.
§ Action Policy. Select an action policy from the list for the component.
§ Device Override. (Optional) Override the device associated with the instance and designate a specific device to assign to the component.
§ Click browse (...) next to the Device Override box to launch the Select a Device dialog.
Important: If the device you want to use is configured with a WhatsUp Gold down dependency, make sure that you use a cloned device for this device selection in the Application Performance Monitoring plug-in. For more information, see the Dependencies overview.
§ Select a device from the navigation tree on which to test the individual component and click OK.
§ Click Test to test the component on the selected device.
Note: Click to remove the device override and revert to the device associated with the application instance.
7 Enter or select the appropriate information in the SQL Server Query component boxes (on page 42).
Application Performance Monitoring for WhatsUp Gold v16 User Guide
42
8 Click Save to save your changes or click Save and Close to complete your changes.
SQL Server component fields You may configure the following boxes for the SQL Server component:
§ Name. Enter a unique name for the component.
§ Description. (Optional) Enter additional information about the component.
§ Critical. Click to select this check box if the component is critical.
Note: Components specified as critical cause the application to go into a down state when the component is out of threshold. Non-critical components cause the application to go into a warning state. For more information on application states, see Working with application states (on page 132).
§ Polling frequency. Select a time (in minutes or hours) you want APM to wait between polls.
§ Server Address. Enter in ServerName\Instance format (for example, WUGServer\SQLEXPRESS).
§ Port Number. Enter the database server port number if other than the standard database port number.
§ Polling timeout. Enter the length of time APM attempts to connect to the selected device. When the time you enter is exceeded without connecting, a timeout occurs and APM stops trying to connect to the device. This is considered a failed connection.
§ Query to Run. Enter a query you want to run against a database to monitor and check for certain database conditions. Only SQL SELECT queries are allowed.
Important: Make sure that you include the full database name in your query.
§ Warning threshold. Enter the component thresholds for the warning state. For example, if the component value is greater than 90 for 5 minutes, put the component in the warning state.
§ Down threshold. Enter the component thresholds for the down state. For example, if the component value is greater than 95 for 5 minutes, put the component in the down state.
Adding a Disk Utilization component The Disk Utilization component allows you to monitor the percentage of disk space being utilized on a specific device. You may add a Disk Utilization component to an application profile or an application instance.
Note: Adding components to an application profile (on page 17) helps create the foundation of the application profile. After adding components to an application profile, you must create an instance to monitor a device (on page 102). Learn more about APM terminology (on page 2).
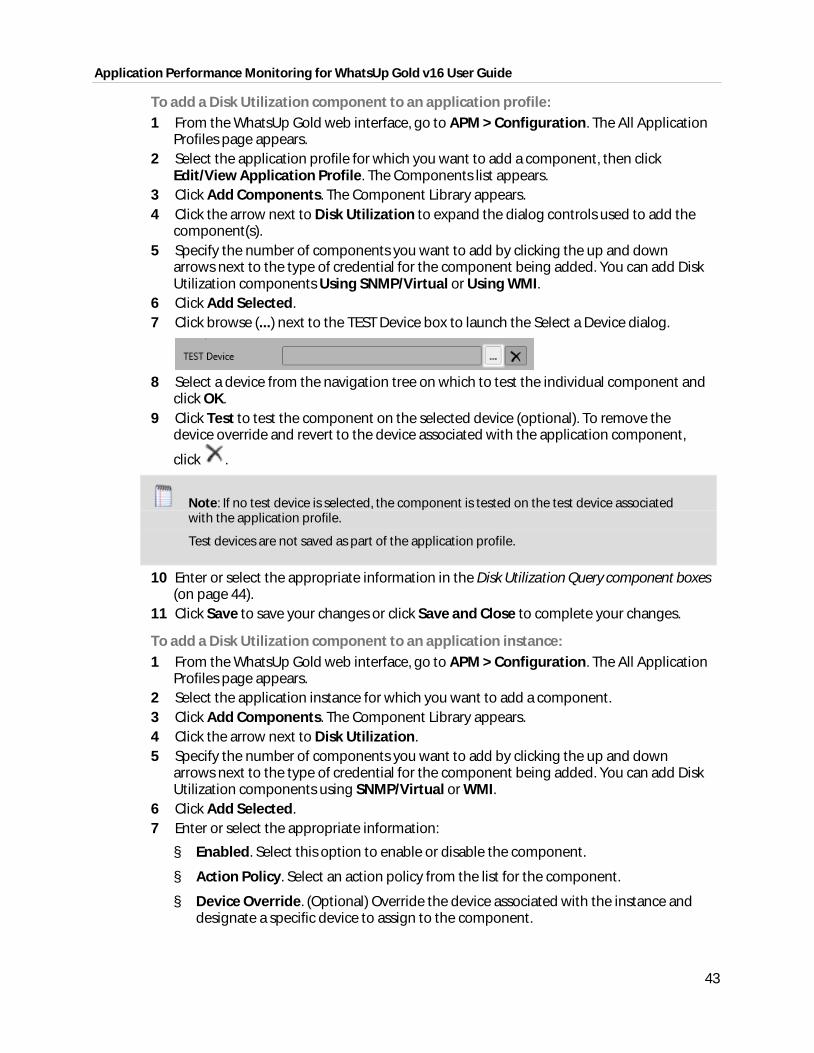
Application Performance Monitoring for WhatsUp Gold v16 User Guide
43
To add a Disk Utilization component to an application profile: 1 From the WhatsUp Gold web interface, go to APM > Configuration. The All Application
Profiles page appears. 2 Select the application profile for which you want to add a component, then click
Edit/View Application Profile. The Components list appears. 3 Click Add Components. The Component Library appears. 4 Click the arrow next to Disk Utilization to expand the dialog controls used to add the
component(s). 5 Specify the number of components you want to add by clicking the up and down
arrows next to the type of credential for the component being added. You can add Disk Utilization components Using SNMP/Virtual or Using WMI.
6 Click Add Selected. 7 Click browse (...) next to the TEST Device box to launch the Select a Device dialog.
8 Select a device from the navigation tree on which to test the individual component and
click OK. 9 Click Test to test the component on the selected device (optional). To remove the
device override and revert to the device associated with the application component,
click .
Note: If no test device is selected, the component is tested on the test device associated with the application profile.
Test devices are not saved as part of the application profile.
10 Enter or select the appropriate information in the Disk Utilization Query component boxes (on page 44).
11 Click Save to save your changes or click Save and Close to complete your changes.
To add a Disk Utilization component to an application instance: 1 From the WhatsUp Gold web interface, go to APM > Configuration. The All Application
Profiles page appears. 2 Select the application instance for which you want to add a component. 3 Click Add Components. The Component Library appears. 4 Click the arrow next to Disk Utilization. 5 Specify the number of components you want to add by clicking the up and down
arrows next to the type of credential for the component being added. You can add Disk Utilization components using SNMP/Virtual or WMI.
6 Click Add Selected. 7 Enter or select the appropriate information:
§ Enabled. Select this option to enable or disable the component.
§ Action Policy. Select an action policy from the list for the component.
§ Device Override. (Optional) Override the device associated with the instance and designate a specific device to assign to the component.
Application Performance Monitoring for WhatsUp Gold v16 User Guide
44
§ Click browse (...) next to the Device Override box to launch the Select a Device dialog.
Important: If the device you want to use is configured with a WhatsUp Gold down dependency, make sure that you use a cloned device for this device selection in the Application Performance Monitoring plug-in. For more information, see the Dependencies overview.
§ Select a device from the navigation tree on which to test the individual component and click OK.
§ Click Test to test the component on the selected device.
Note: Click to remove the device override and revert to the device associated with the application instance.
§ Disk Selection. Select the disk drive for which you want to monitor. 8 Enter or select the appropriate information in the Disk Utilization Query component boxes
(on page 44). 9 Click Save to save your changes or click Save and Close to complete your changes.
Disk Utilization component fields You may configure the following boxes for the Disk Utilization component:
§ Name. Enter a unique name for the component.
§ Description. (Optional) Enter additional information about the component.
§ Critical. Click to select this check box if the component is critical.
Note: Components specified as critical cause the application to go into a down state when the component is out of threshold. Non-critical components cause the application to go into a warning state. For more information on application states, see Working with application states (on page 132).
§ Polling frequency. Select a time (in minutes or hours) you want APM to wait between polls.
§ Polling timeout. Enter the length of time APM attempts to connect to the selected device. When the time you enter is exceeded without connecting, a timeout occurs and APM stops trying to connect to the device. This is considered a failed connection.
§ Poller retries. Enter the number of times APM attempts to send the command before the device is considered down.
§ Warning threshold. Enter the component thresholds for the warning state. For example, if the component value is greater than 90 percent for 5 minutes, put the component in the warning state.
§ Down threshold. Enter the component thresholds for the down state. For example, if the component value is greater than 95 percent for 5 minutes, put the component in the down state.

Application Performance Monitoring for WhatsUp Gold v16 User Guide
45
Adding a Physical Memory Utilization component to an application profile
The Physical Memory Utilization component allows you to monitor the percentage or absolute amount of physical memory being utilized on a specific device.
Note: Adding components to an application profile (on page 17) helps create the foundation of the application profile. After adding components to an application profile, you must create an instance to monitor a device (on page 102). Learn more about APM terminology (on page 2).
To add a Physical Memory Utilization component to an application profile: 1 From the WhatsUp Gold web interface, go to APM > Configuration. The All Application
Profiles page appears. 2 Select the application profile for which you want to add a component, then click
Edit/View Application Profile. The Components list appears. 3 Click Add Components. The Component Library appears. 4 Click the arrow next to Memory Utilization to expand the dialog controls used to add
the component(s). 5 Specify the number of components you want to add by clicking the up and down
arrows next to the credential and memory type for the component being added. You can add physical memory components using Physical Memory Using SNMP/Virtual or Physical Memory Using WMI.
6 Click Add Selected. 7 Click browse (...) next to the TEST Device box to launch the Select a Device dialog.
8 Select a device from the navigation tree on which to test the individual component and
click OK. 9 Click Test to test the component on the selected device (optional). To remove the
device override and revert to the device associated with the application component,
click .
Note: If no test device is selected, the component is tested on the test device associated with the application profile.
Test devices are not saved as part of the application profile.
10 Enter or select the appropriate information in the Physical Memory Utilization component boxes (on page 46).
11 Click Save to save your changes or click Save and Close to complete your changes.
To add a Physical Memory Utilization component to an application instance: 1 From the WhatsUp Gold web interface, go to APM > Configuration. The All Application
Profiles page appears. 2 Select the application instance for which you want to add a component. 3 Click Add Components. The Component Library appears.
Application Performance Monitoring for WhatsUp Gold v16 User Guide
46
4 Click the arrow next to Memory Utilization. 5 Specify the number of components you want to add by clicking the up and down
arrows next to the credential and memory type for the component being added. You can add physical memory components using Physical Memory Using SNMP/Virtual or Physical Memory Using WMI.
6 Click Add Selected. 7 Enter or select the appropriate information:
§ Enabled. Select this option to enable or disable the component.
§ Action Policy. Select an action policy from the list for the component.
§ Device Override. (Optional) Override the device associated with the instance and designate a specific device to assign to the component.
§ Click browse (...) next to the Device Override box to launch the Select a Device dialog.
Important: If the device you want to use is configured with a WhatsUp Gold down dependency, make sure that you use a cloned device for this device selection in the Application Performance Monitoring plug-in. For more information, see the Dependencies overview.
§ Select a device from the navigation tree on which to test the individual component and click OK.
§ Click Test to test the component on the selected device.
Note: Click to remove the device override and revert to the device associated with the application instance.
8 Enter or select the appropriate information in the Physical Memory Utilization component boxes (on page 46).
9 Click Save to save your changes or click Save and Close to complete your changes.
Physical Memory component fields You may configure the following boxes for the Physical Memory component:
§ Name. Enter a unique name for the component.
§ Description. (Optional) Enter additional information about the component.
§ Critical. Click to select this check box if the component is critical.
Note: Components specified as critical cause the application to go into a down state when the component is out of threshold. Non-critical components cause the application to go into a warning state. For more information on application states, see Working with application states (on page 132).
§ Polling frequency. Select a time (in minutes or hours) you want APM to wait between polls.
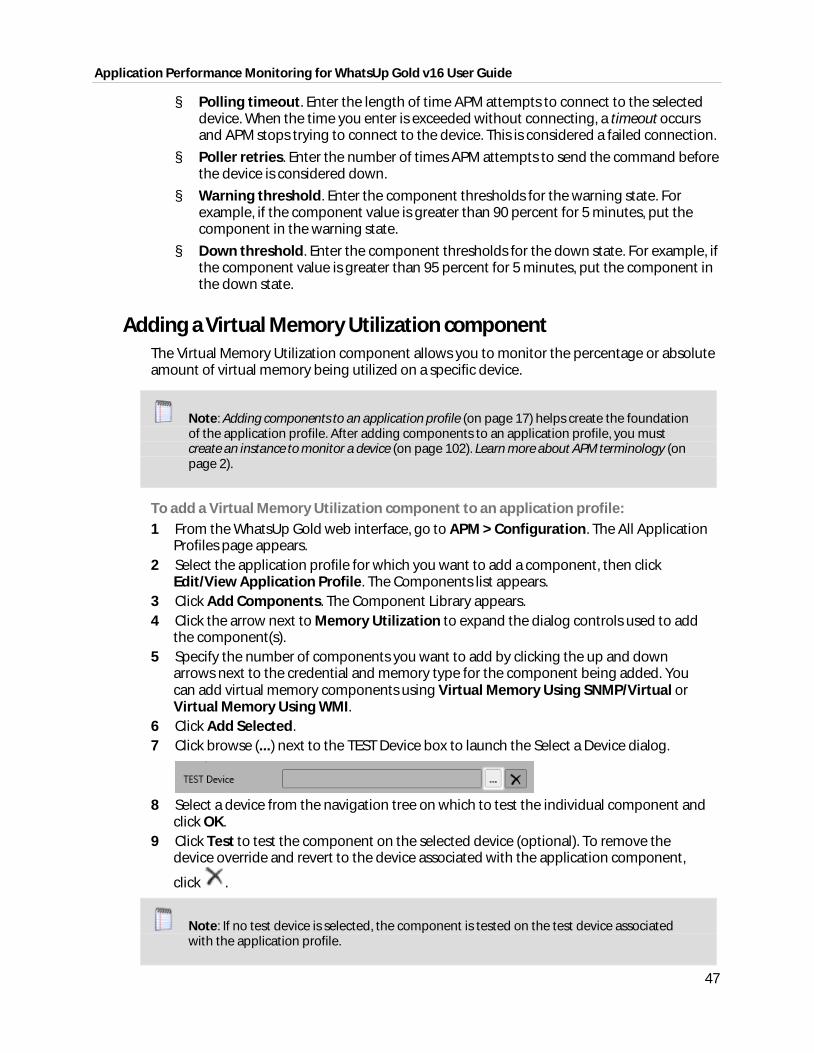
Application Performance Monitoring for WhatsUp Gold v16 User Guide
47
§ Polling timeout. Enter the length of time APM attempts to connect to the selected device. When the time you enter is exceeded without connecting, a timeout occurs and APM stops trying to connect to the device. This is considered a failed connection.
§ Poller retries. Enter the number of times APM attempts to send the command before the device is considered down.
§ Warning threshold. Enter the component thresholds for the warning state. For example, if the component value is greater than 90 percent for 5 minutes, put the component in the warning state.
§ Down threshold. Enter the component thresholds for the down state. For example, if the component value is greater than 95 percent for 5 minutes, put the component in the down state.
Adding a Virtual Memory Utilization component The Virtual Memory Utilization component allows you to monitor the percentage or absolute amount of virtual memory being utilized on a specific device.
Note: Adding components to an application profile (on page 17) helps create the foundation of the application profile. After adding components to an application profile, you must create an instance to monitor a device (on page 102). Learn more about APM terminology (on page 2).
To add a Virtual Memory Utilization component to an application profile: 1 From the WhatsUp Gold web interface, go to APM > Configuration. The All Application
Profiles page appears. 2 Select the application profile for which you want to add a component, then click
Edit/View Application Profile. The Components list appears. 3 Click Add Components. The Component Library appears. 4 Click the arrow next to Memory Utilization to expand the dialog controls used to add
the component(s). 5 Specify the number of components you want to add by clicking the up and down
arrows next to the credential and memory type for the component being added. You can add virtual memory components using Virtual Memory Using SNMP/Virtual or Virtual Memory Using WMI.
6 Click Add Selected. 7 Click browse (...) next to the TEST Device box to launch the Select a Device dialog.
8 Select a device from the navigation tree on which to test the individual component and
click OK. 9 Click Test to test the component on the selected device (optional). To remove the
device override and revert to the device associated with the application component,
click .
Note: If no test device is selected, the component is tested on the test device associated with the application profile.
Application Performance Monitoring for WhatsUp Gold v16 User Guide
48
Test devices are not saved as part of the application profile.
10 Enter or select the appropriate information in the Virtual Memory Utilization component boxes (on page 48).
11 Click Save to save your changes or click Save and Close to complete your changes.
To add a Virtual Memory Utilization component to an application instance: 1 From the WhatsUp Gold web interface, go to APM > Configuration. The All Application
Profiles page appears. 2 Select the application instance for which you want to add a component. 3 Click Add Components. The Component Library appears. 4 Click the arrow next to Memory Utilization. 5 Specify the number of components you want to add by clicking the up and down
arrows next to the credential and memory type for the component being added. You can add virtual memory components using Virtual Memory Using SNMP/Virtual or Virtual Memory Using WMI.
6 Click Add Selected. 7 Enter or select the appropriate information:
§ Enabled. Select this option to enable or disable the component.
§ Action Policy. Select an action policy from the list for the component.
§ Device Override. (Optional) Override the device associated with the instance and designate a specific device to assign to the component.
§ Click browse (...) next to the Device Override box to launch the Select a Device dialog.
Important: If the device you want to use is configured with a WhatsUp Gold down dependency, make sure that you use a cloned device for this device selection in the Application Performance Monitoring plug-in. For more information, see the Dependencies overview.
§ Select a device from the navigation tree on which to test the individual component and click OK.
§ Click Test to test the component on the selected device.
Note: Click to remove the device override and revert to the device associated with the application instance.
8 Enter or select the appropriate information in the Virtual Memory Utilization component boxes (on page 48).
9 Click Save to save your changes or click Save and Close to complete your changes.
Virtual Memory component fields You may configure the following boxes for the Virtual Memory component:
§ Name. Enter a unique name for the component.
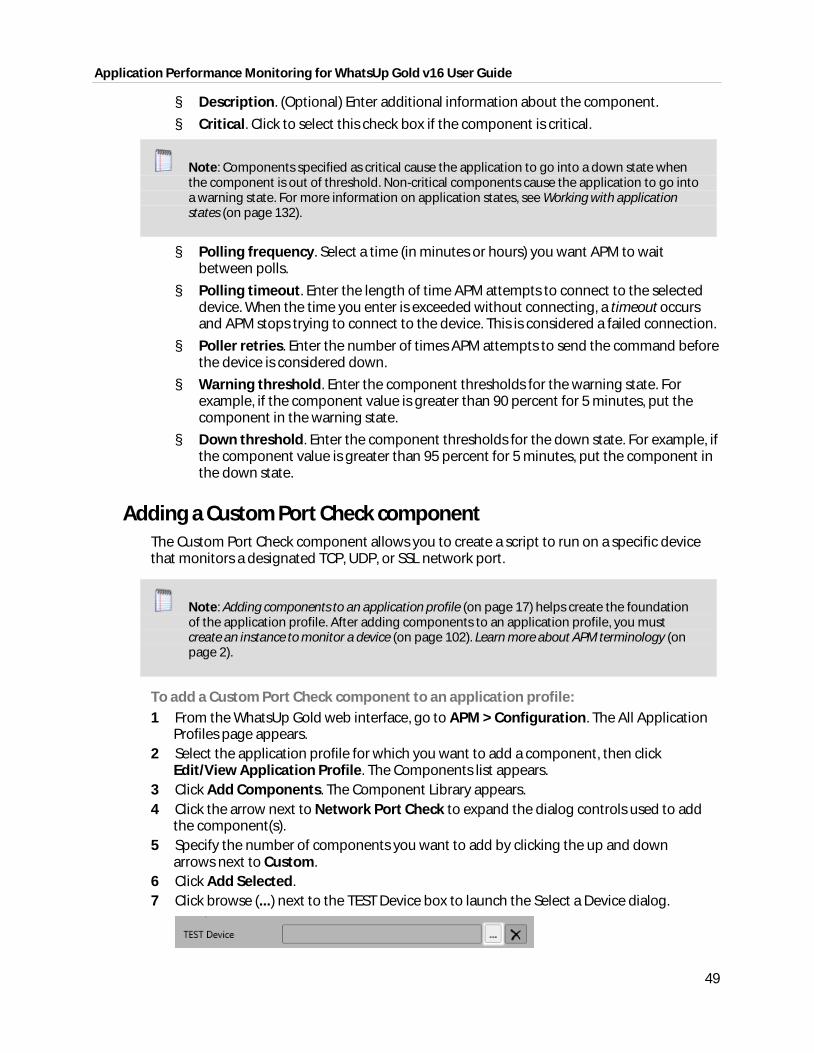
Application Performance Monitoring for WhatsUp Gold v16 User Guide
49
§ Description. (Optional) Enter additional information about the component.
§ Critical. Click to select this check box if the component is critical.
Note: Components specified as critical cause the application to go into a down state when the component is out of threshold. Non-critical components cause the application to go into a warning state. For more information on application states, see Working with application states (on page 132).
§ Polling frequency. Select a time (in minutes or hours) you want APM to wait between polls.
§ Polling timeout. Enter the length of time APM attempts to connect to the selected device. When the time you enter is exceeded without connecting, a timeout occurs and APM stops trying to connect to the device. This is considered a failed connection.
§ Poller retries. Enter the number of times APM attempts to send the command before the device is considered down.
§ Warning threshold. Enter the component thresholds for the warning state. For example, if the component value is greater than 90 percent for 5 minutes, put the component in the warning state.
§ Down threshold. Enter the component thresholds for the down state. For example, if the component value is greater than 95 percent for 5 minutes, put the component in the down state.
Adding a Custom Port Check component The Custom Port Check component allows you to create a script to run on a specific device that monitors a designated TCP, UDP, or SSL network port.
Note: Adding components to an application profile (on page 17) helps create the foundation of the application profile. After adding components to an application profile, you must create an instance to monitor a device (on page 102). Learn more about APM terminology (on page 2).
To add a Custom Port Check component to an application profile: 1 From the WhatsUp Gold web interface, go to APM > Configuration. The All Application
Profiles page appears. 2 Select the application profile for which you want to add a component, then click
Edit/View Application Profile. The Components list appears. 3 Click Add Components. The Component Library appears. 4 Click the arrow next to Network Port Check to expand the dialog controls used to add
the component(s). 5 Specify the number of components you want to add by clicking the up and down
arrows next to Custom. 6 Click Add Selected. 7 Click browse (...) next to the TEST Device box to launch the Select a Device dialog.
Application Performance Monitoring for WhatsUp Gold v16 User Guide
50
8 Select a device from the navigation tree on which to test the individual component and click OK.
9 Click Test to test the component on the selected device (optional). To remove the device override and revert to the device associated with the application component,
click .
Note: If no test device is selected, the component is tested on the test device associated with the application profile.
Test devices are not saved as part of the application profile.
10 Enter or select the appropriate information: 11 Click Save to save your changes or click Save and Close to complete your changes.
To add a Custom Port Check component to an application instance: 1 From the WhatsUp Gold web interface, go to APM > Configuration. The All Application
Profiles page appears. 2 Select the application instance for which you want to add a component. 3 Click Add Components. The Component Library appears. 4 Click the arrow next to Network Port Check, then specify the number of components
you want to add by clicking the up and down arrows next to Custom. 5 Click Add Selected. 6 Enter or select the appropriate information:
§ Enabled. Select this option to enable or disable the component.
§ Action Policy. Select an action policy from the list for the component.
§ Device Override. (Optional) Override the device associated with the instance and designate a specific device to assign to the component.
§ Click browse (...) next to the Device Override box to launch the Select a Device dialog.
Important: If the device you want to use is configured with a WhatsUp Gold down dependency, make sure that you use a cloned device for this device selection in the Application Performance Monitoring plug-in. For more information, see the Dependencies overview.
§ Select a device from the navigation tree on which to test the individual component and click OK.
§ Click Test to test the component on the selected device.
§ Note: Click to remove the device override and revert to the device associated with the application instance.
7 Enter or select the appropriate information in the Custom Port Check component boxes (on page 51).
8 Click Save to save your changes or click Save and Close to complete your changes.
Application Performance Monitoring for WhatsUp Gold v16 User Guide
51
Custom Port Check component fields You may configure the following boxes for the Custom Port Check component:
§ Name. Enter a unique name for the component.
§ Description. (Optional) Enter additional information about the component.
§ Critical. Click to select this check box if the component is critical.
Note: Components specified as critical cause the application to go into a down state when the component is out of threshold. Non-critical components cause the application to go into a warning state. For more information on application states, see Working with application states (on page 132).
§ Polling frequency. Select a time (in minutes or hours) you want APM to wait between polls.
§ Protocol. Select TCP, UDP, or SSL from the list. The network type for the FTP (File Transfer Protocol) service is TCP; the network type for the RADIUS (Remote Authentication and Dial-In User Service) service is UDP. The HTTPS monitor uses the SSL type.
§ Port number. Enter the port number that you want to monitor.
§ Polling timeout. Enter the length of time APM attempts to connect to the selected device. When the time you enter is exceeded without connecting, a timeout occurs and APM stops trying to connect to the device. This is considered a failed connection.
§ Script to Run. Write your script using as many Send, Expect, SimpleExpect, and Flow Control keywords as you want. For more information, see Script Syntax.
§ Expect. (Optional) Click to open the Rules Expression Editor (on page Error! Bookmark not defined.) and test a string of text for particular patterns.
Adding an Echo Port Check component The Echo Port Check component allows you to create a script to run on a specific device that monitors a designated TCP, UDP, SSL network port using the Echo protocol. You may add an Echo Port Check component to an application profile or an application instance.
Note: Adding components to an application profile (on page 17) helps create the foundation of the application profile. After adding components to an application profile, you must create an instance to monitor a device (on page 102). Learn more about APM terminology (on page 2).
To add an Echo Port Check component to an application profile: 1 From the WhatsUp Gold web interface, go to APM > Configuration. The All Application
Profiles page appears. 2 Select the application profile for which you want to add a component, then click
Edit/View Application Profile. The Components list appears. 3 Click Add Components. The Component Library appears. 4 Click the arrow next to Network Port Check, then specify the number of components
you want to add by clicking the up and down arrows next to Echo.
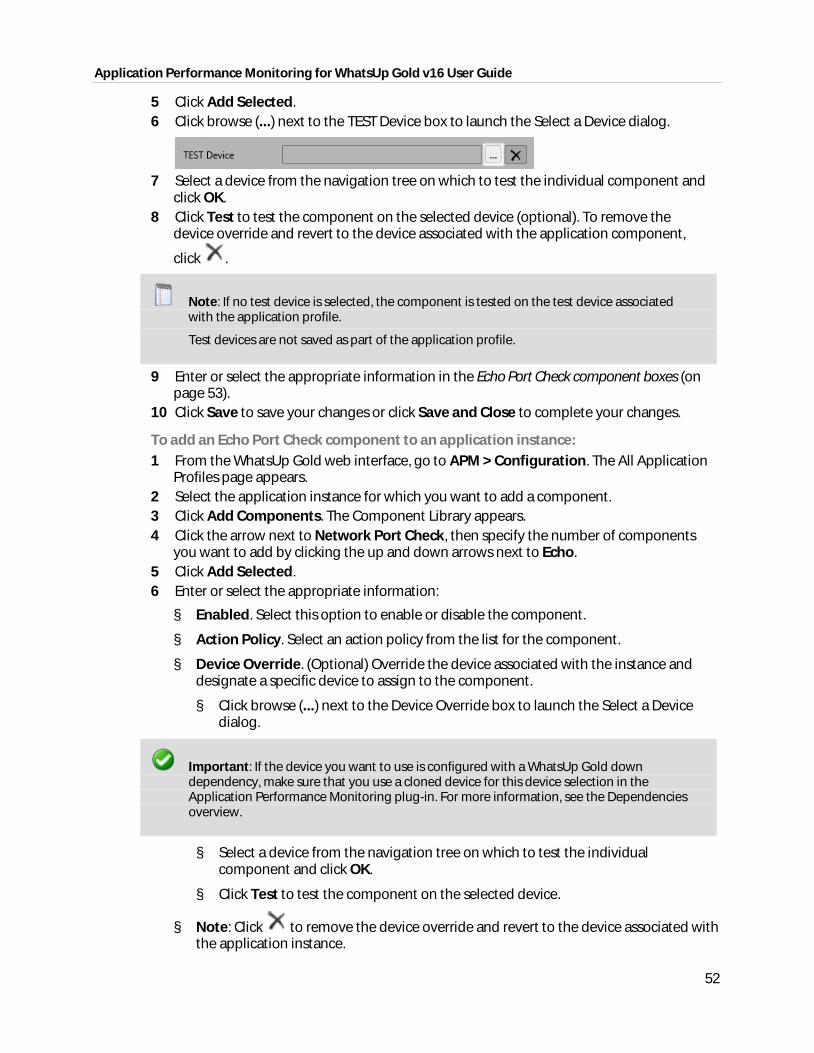
Application Performance Monitoring for WhatsUp Gold v16 User Guide
52
5 Click Add Selected. 6 Click browse (...) next to the TEST Device box to launch the Select a Device dialog.
7 Select a device from the navigation tree on which to test the individual component and
click OK. 8 Click Test to test the component on the selected device (optional). To remove the
device override and revert to the device associated with the application component,
click .
Note: If no test device is selected, the component is tested on the test device associated with the application profile.
Test devices are not saved as part of the application profile.
9 Enter or select the appropriate information in the Echo Port Check component boxes (on page 53).
10 Click Save to save your changes or click Save and Close to complete your changes.
To add an Echo Port Check component to an application instance: 1 From the WhatsUp Gold web interface, go to APM > Configuration. The All Application
Profiles page appears. 2 Select the application instance for which you want to add a component. 3 Click Add Components. The Component Library appears. 4 Click the arrow next to Network Port Check, then specify the number of components
you want to add by clicking the up and down arrows next to Echo. 5 Click Add Selected. 6 Enter or select the appropriate information:
§ Enabled. Select this option to enable or disable the component.
§ Action Policy. Select an action policy from the list for the component.
§ Device Override. (Optional) Override the device associated with the instance and designate a specific device to assign to the component.
§ Click browse (...) next to the Device Override box to launch the Select a Device dialog.
Important: If the device you want to use is configured with a WhatsUp Gold down dependency, make sure that you use a cloned device for this device selection in the Application Performance Monitoring plug-in. For more information, see the Dependencies overview.
§ Select a device from the navigation tree on which to test the individual component and click OK.
§ Click Test to test the component on the selected device.
§ Note: Click to remove the device override and revert to the device associated with the application instance.
Application Performance Monitoring for WhatsUp Gold v16 User Guide
53
7 Enter or select the appropriate information in the Echo Port Check component boxes (on page 53).
8 Click Save to save your changes or click Save and Close to complete your changes.
Echo Port Check component fields You may configure the following boxes for the Echo Port Check component:
§ Name. Enter a unique name for the component.
§ Description. (Optional) Enter additional information about the component.
§ Critical. Click to select this check box if the component is critical.
Note: Components specified as critical cause the application to go into a down state when the component is out of threshold. Non-critical components cause the application to go into a warning state. For more information on application states, see Working with application states (on page 132).
§ Polling frequency. Select a time (in minutes or hours) you want APM to wait between polls.
§ Protocol. Select TCP, UDP, or SSL from the list. The network type for the FTP (File Transfer Protocol) service is TCP; the network type for the RADIUS (Remote Authentication and Dial-In User Service) service is UDP. The HTTPS monitor uses the SSL type.
§ Port number. Enter the port number that you want to monitor.
§ Polling timeout. Enter the length of time APM attempts to connect to the selected device. When the time you enter is exceeded without connecting, a timeout occurs and APM stops trying to connect to the device. This is considered a failed connection.
§ Script to Run. Enter your script using as many Send, Expect, SimpleExpect, and Flow Control keywords as you want. For more information, see Script Syntax.
§ Expect. (Optional) Click to open the Rules Expression Editor (on page Error! Bookmark not defined.) and test a string of text for particular patterns.
Adding an FTP Port Check component The FTP Port Check component allows you to create a script to run on a specific device that monitors a designated TCP, UDP, SSL network port using the File Transfer Protocol (FTP). You may add an FTP Port Check component to an application profile or an application instance.
Note: Adding components to an application profile (on page 17) helps create the foundation of the application profile. After adding components to an application profile, you must create an instance to monitor a device (on page 102). Learn more about APM terminology (on page 2).
To add an FTP port Check component to an application profile: 1 From the WhatsUp Gold web interface, go to APM > Configuration. The All Application
Profiles page appears.

Application Performance Monitoring for WhatsUp Gold v16 User Guide
54
2 Select the application profile for which you want to add a component, then click Edit/View Application Profile. The Components list appears.
3 Click Add Components. The Component Library appears. 4 Click the arrow next to Network Port Check to expand the dialog controls used to add
the component(s). 5 Specify the number of components you want to add by clicking the up and down
arrows next to FTP. 6 Click Add Selected. 7 Click browse (...) next to the TEST Device box to launch the Select a Device dialog.
8 Select a device from the navigation tree on which to test the individual component and
click OK. 9 Click Test to test the component on the selected device (optional). To remove the
device override and revert to the device associated with the application component,
click .
Note: If no test device is selected, the component is tested on the test device associated with the application profile.
Test devices are not saved as part of the application profile.
10 Enter or select the appropriate information in the FTP Port Check component boxes (on page 55).
11 Click Save to save your changes or click Save and Close to complete your changes.
To add an Echo Port Check component to an application instance: 1 2 Click Add Components. The Component Library appears. 3 Click the arrow next to Network Port Check, then specify the number of components
you want to add by clicking the up and down arrows next to FTP. 4 Click Add Selected. 5 Enter or select the appropriate information:
§ Enabled. Select this option to enable or disable the component.
§ Action Policy. Select an action policy from the list for the component.
§ Device Override. (Optional) Override the device associated with the instance and designate a specific device to assign to the component.
§ Click browse (...) next to the Device Override box to launch the Select a Device dialog.
Important: If the device you want to use is configured with a WhatsUp Gold down dependency, make sure that you use a cloned device for this device selection in the Application Performance Monitoring plug-in. For more information, see the Dependencies overview.
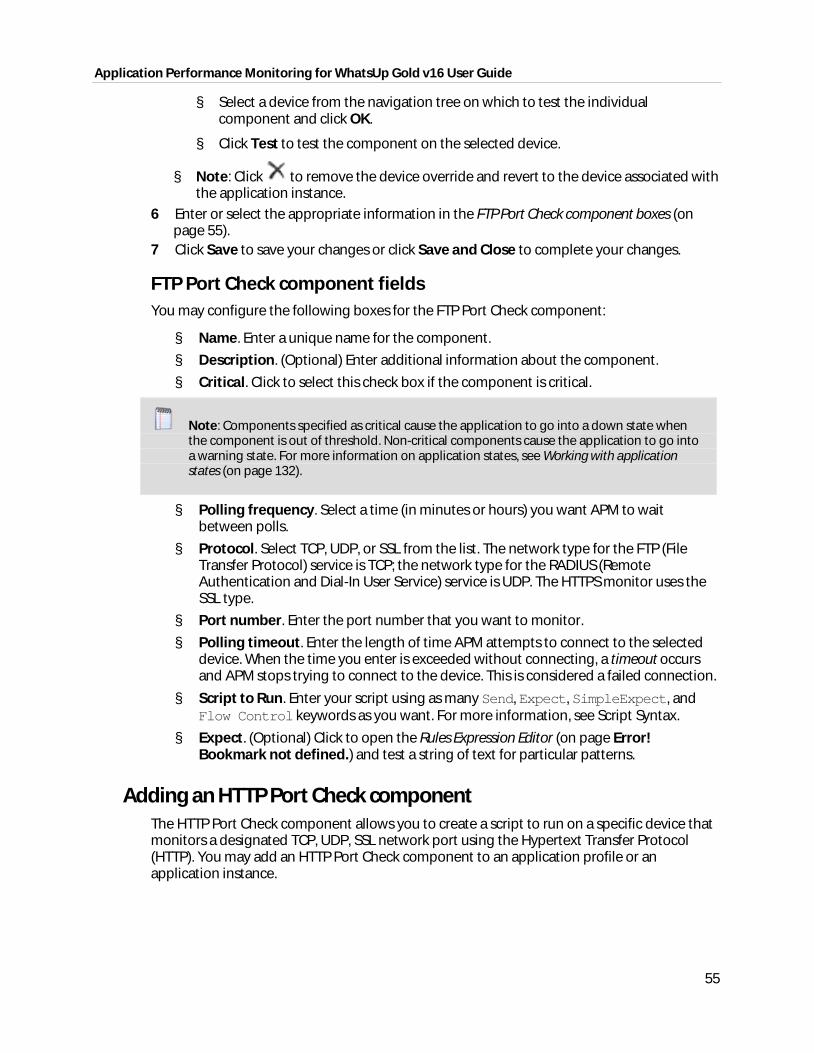
Application Performance Monitoring for WhatsUp Gold v16 User Guide
55
§ Select a device from the navigation tree on which to test the individual component and click OK.
§ Click Test to test the component on the selected device.
§ Note: Click to remove the device override and revert to the device associated with the application instance.
6 Enter or select the appropriate information in the FTP Port Check component boxes (on page 55).
7 Click Save to save your changes or click Save and Close to complete your changes.
FTP Port Check component fields You may configure the following boxes for the FTP Port Check component:
§ Name. Enter a unique name for the component.
§ Description. (Optional) Enter additional information about the component.
§ Critical. Click to select this check box if the component is critical.
Note: Components specified as critical cause the application to go into a down state when the component is out of threshold. Non-critical components cause the application to go into a warning state. For more information on application states, see Working with application states (on page 132).
§ Polling frequency. Select a time (in minutes or hours) you want APM to wait between polls.
§ Protocol. Select TCP, UDP, or SSL from the list. The network type for the FTP (File Transfer Protocol) service is TCP; the network type for the RADIUS (Remote Authentication and Dial-In User Service) service is UDP. The HTTPS monitor uses the SSL type.
§ Port number. Enter the port number that you want to monitor.
§ Polling timeout. Enter the length of time APM attempts to connect to the selected device. When the time you enter is exceeded without connecting, a timeout occurs and APM stops trying to connect to the device. This is considered a failed connection.
§ Script to Run. Enter your script using as many Send, Expect, SimpleExpect, and Flow Control keywords as you want. For more information, see Script Syntax.
§ Expect. (Optional) Click to open the Rules Expression Editor (on page Error! Bookmark not defined.) and test a string of text for particular patterns.
Adding an HTTP Port Check component The HTTP Port Check component allows you to create a script to run on a specific device that monitors a designated TCP, UDP, SSL network port using the Hypertext Transfer Protocol (HTTP). You may add an HTTP Port Check component to an application profile or an application instance.
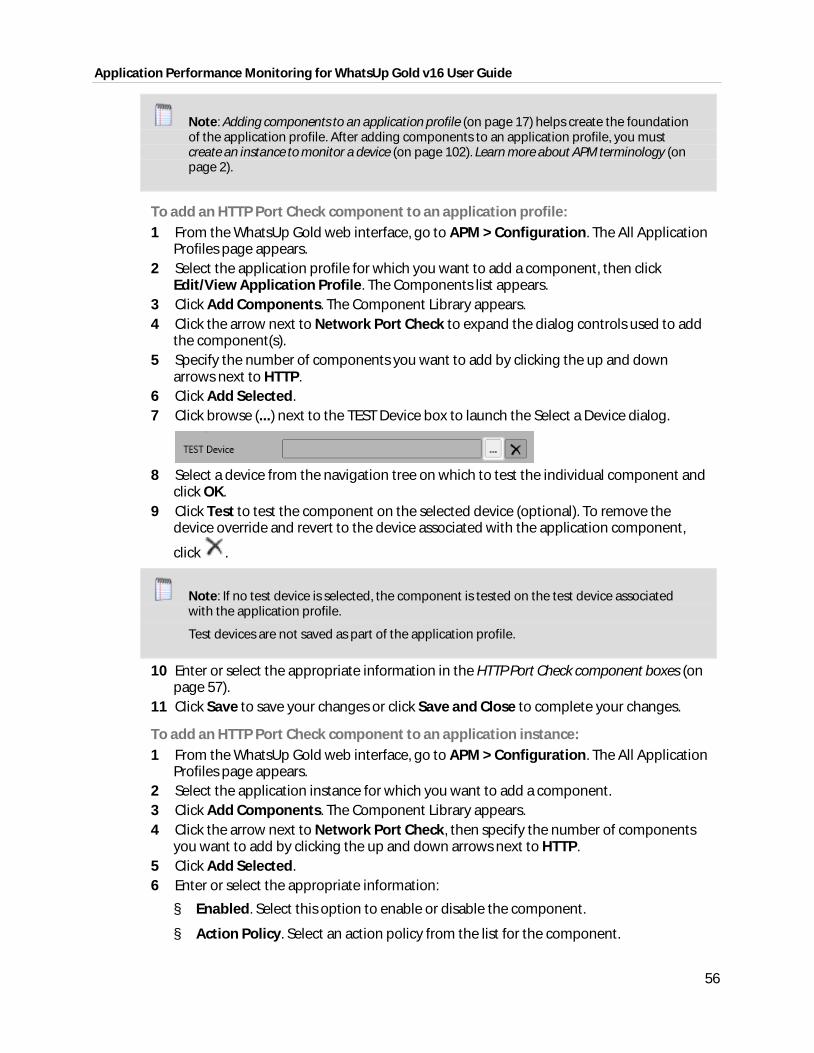
Application Performance Monitoring for WhatsUp Gold v16 User Guide
56
Note: Adding components to an application profile (on page 17) helps create the foundation of the application profile. After adding components to an application profile, you must create an instance to monitor a device (on page 102). Learn more about APM terminology (on page 2).
To add an HTTP Port Check component to an application profile: 1 From the WhatsUp Gold web interface, go to APM > Configuration. The All Application
Profiles page appears. 2 Select the application profile for which you want to add a component, then click
Edit/View Application Profile. The Components list appears. 3 Click Add Components. The Component Library appears. 4 Click the arrow next to Network Port Check to expand the dialog controls used to add
the component(s). 5 Specify the number of components you want to add by clicking the up and down
arrows next to HTTP. 6 Click Add Selected. 7 Click browse (...) next to the TEST Device box to launch the Select a Device dialog.
8 Select a device from the navigation tree on which to test the individual component and
click OK. 9 Click Test to test the component on the selected device (optional). To remove the
device override and revert to the device associated with the application component,
click .
Note: If no test device is selected, the component is tested on the test device associated with the application profile.
Test devices are not saved as part of the application profile.
10 Enter or select the appropriate information in the HTTP Port Check component boxes (on page 57).
11 Click Save to save your changes or click Save and Close to complete your changes.
To add an HTTP Port Check component to an application instance: 1 From the WhatsUp Gold web interface, go to APM > Configuration. The All Application
Profiles page appears. 2 Select the application instance for which you want to add a component. 3 Click Add Components. The Component Library appears. 4 Click the arrow next to Network Port Check, then specify the number of components
you want to add by clicking the up and down arrows next to HTTP. 5 Click Add Selected. 6 Enter or select the appropriate information:
§ Enabled. Select this option to enable or disable the component.
§ Action Policy. Select an action policy from the list for the component.
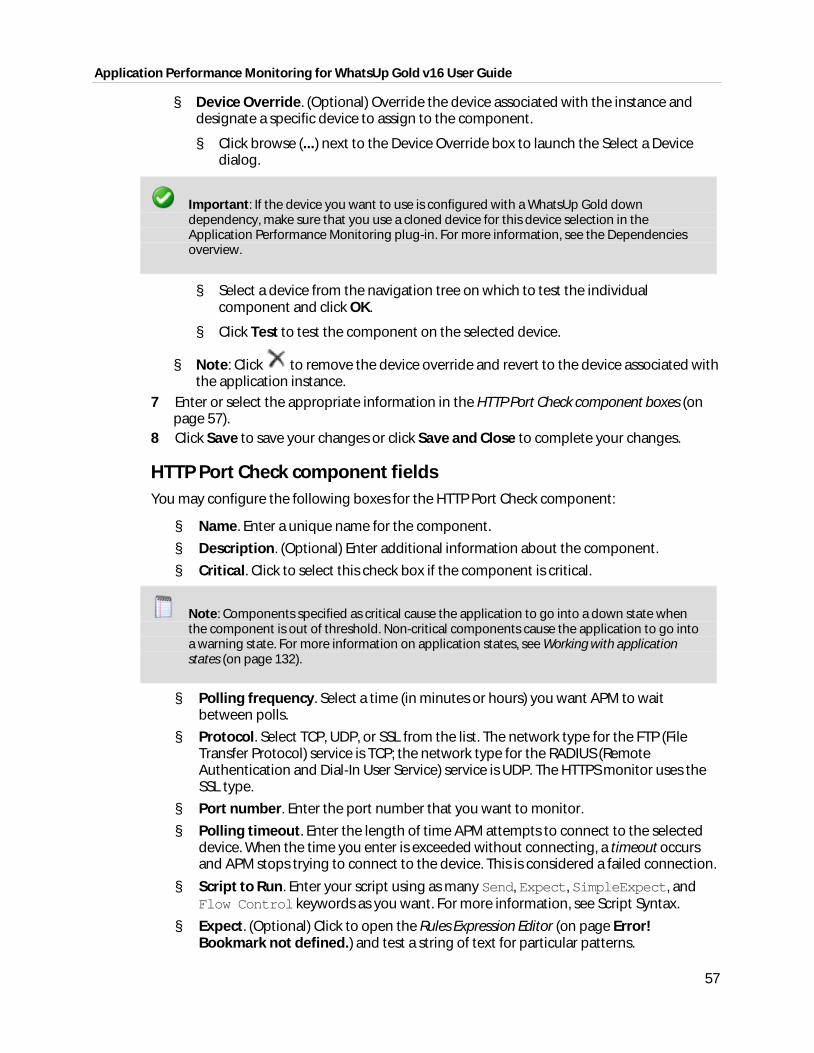
Application Performance Monitoring for WhatsUp Gold v16 User Guide
57
§ Device Override. (Optional) Override the device associated with the instance and designate a specific device to assign to the component.
§ Click browse (...) next to the Device Override box to launch the Select a Device dialog.
Important: If the device you want to use is configured with a WhatsUp Gold down dependency, make sure that you use a cloned device for this device selection in the Application Performance Monitoring plug-in. For more information, see the Dependencies overview.
§ Select a device from the navigation tree on which to test the individual component and click OK.
§ Click Test to test the component on the selected device.
§ Note: Click to remove the device override and revert to the device associated with the application instance.
7 Enter or select the appropriate information in the HTTP Port Check component boxes (on page 57).
8 Click Save to save your changes or click Save and Close to complete your changes.
HTTP Port Check component fields You may configure the following boxes for the HTTP Port Check component:
§ Name. Enter a unique name for the component.
§ Description. (Optional) Enter additional information about the component.
§ Critical. Click to select this check box if the component is critical.
Note: Components specified as critical cause the application to go into a down state when the component is out of threshold. Non-critical components cause the application to go into a warning state. For more information on application states, see Working with application states (on page 132).
§ Polling frequency. Select a time (in minutes or hours) you want APM to wait between polls.
§ Protocol. Select TCP, UDP, or SSL from the list. The network type for the FTP (File Transfer Protocol) service is TCP; the network type for the RADIUS (Remote Authentication and Dial-In User Service) service is UDP. The HTTPS monitor uses the SSL type.
§ Port number. Enter the port number that you want to monitor.
§ Polling timeout. Enter the length of time APM attempts to connect to the selected device. When the time you enter is exceeded without connecting, a timeout occurs and APM stops trying to connect to the device. This is considered a failed connection.
§ Script to Run. Enter your script using as many Send, Expect, SimpleExpect, and Flow Control keywords as you want. For more information, see Script Syntax.
§ Expect. (Optional) Click to open the Rules Expression Editor (on page Error! Bookmark not defined.) and test a string of text for particular patterns.
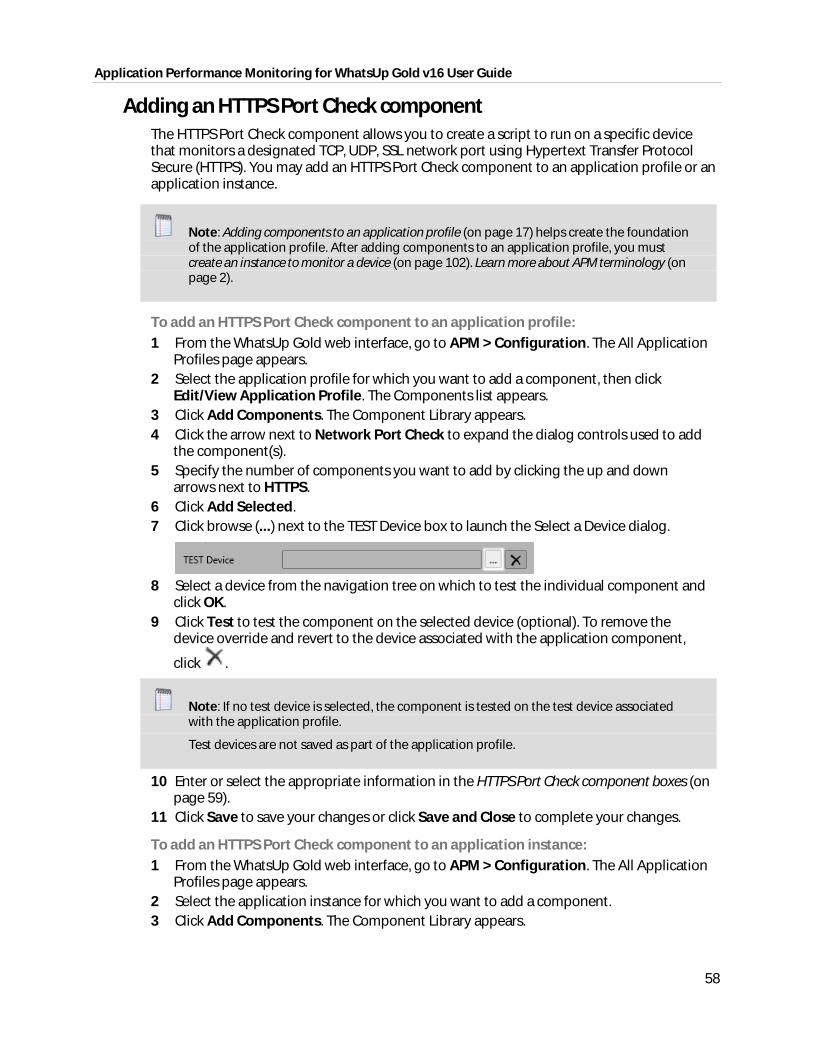
Application Performance Monitoring for WhatsUp Gold v16 User Guide
58
Adding an HTTPS Port Check component The HTTPS Port Check component allows you to create a script to run on a specific device that monitors a designated TCP, UDP, SSL network port using Hypertext Transfer Protocol Secure (HTTPS). You may add an HTTPS Port Check component to an application profile or an application instance.
Note: Adding components to an application profile (on page 17) helps create the foundation of the application profile. After adding components to an application profile, you must create an instance to monitor a device (on page 102). Learn more about APM terminology (on page 2).
To add an HTTPS Port Check component to an application profile: 1 From the WhatsUp Gold web interface, go to APM > Configuration. The All Application
Profiles page appears. 2 Select the application profile for which you want to add a component, then click
Edit/View Application Profile. The Components list appears. 3 Click Add Components. The Component Library appears. 4 Click the arrow next to Network Port Check to expand the dialog controls used to add
the component(s). 5 Specify the number of components you want to add by clicking the up and down
arrows next to HTTPS. 6 Click Add Selected. 7 Click browse (...) next to the TEST Device box to launch the Select a Device dialog.
8 Select a device from the navigation tree on which to test the individual component and
click OK. 9 Click Test to test the component on the selected device (optional). To remove the
device override and revert to the device associated with the application component,
click .
Note: If no test device is selected, the component is tested on the test device associated with the application profile.
Test devices are not saved as part of the application profile.
10 Enter or select the appropriate information in the HTTPS Port Check component boxes (on page 59).
11 Click Save to save your changes or click Save and Close to complete your changes.
To add an HTTPS Port Check component to an application instance: 1 From the WhatsUp Gold web interface, go to APM > Configuration. The All Application
Profiles page appears. 2 Select the application instance for which you want to add a component. 3 Click Add Components. The Component Library appears.
Application Performance Monitoring for WhatsUp Gold v16 User Guide
59
4 Click the arrow next to Network Port Check, then specify the number of components you want to add by clicking the up and down arrows next to HTTPS.
5 Click Add Selected. 6 Enter or select the appropriate information:
§ Enabled. Select this option to enable or disable the component.
§ Action Policy. Select an action policy from the list for the component.
§ Device Override. (Optional) Override the device associated with the instance and designate a specific device to assign to the component.
§ Click browse (...) next to the Device Override box to launch the Select a Device dialog.
Important: If the device you want to use is configured with a WhatsUp Gold down dependency, make sure that you use a cloned device for this device selection in the Application Performance Monitoring plug-in. For more information, see the Dependencies overview.
§ Select a device from the navigation tree on which to test the individual component and click OK.
§ Click Test to test the component on the selected device.
Note: Click to remove the device override and revert to the device associated with the application instance.
7 Enter or select the appropriate information in the HTTPS Port Check component boxes (on page 59).
8 Click Save to save your changes or click Save and Close to complete your changes.
HTTPS Port Check component fields You may configure the following boxes for the HTTPS Port Check component:
§ Name. Enter a unique name for the component.
§ Description. (Optional) Enter additional information about the component.
§ Critical. Click to select this check box if the component is critical.
Note: Components specified as critical cause the application to go into a down state when the component is out of threshold. Non-critical components cause the application to go into a warning state. For more information on application states, see Working with application states (on page 132).
§ Polling frequency. Select a time (in minutes or hours) you want APM to wait between polls.
§ Protocol. Select TCP, UDP, or SSL from the list. The network type for the FTP (File Transfer Protocol) service is TCP; the network type for the RADIUS (Remote Authentication and Dial-In User Service) service is UDP. The HTTPS monitor uses the SSL type.
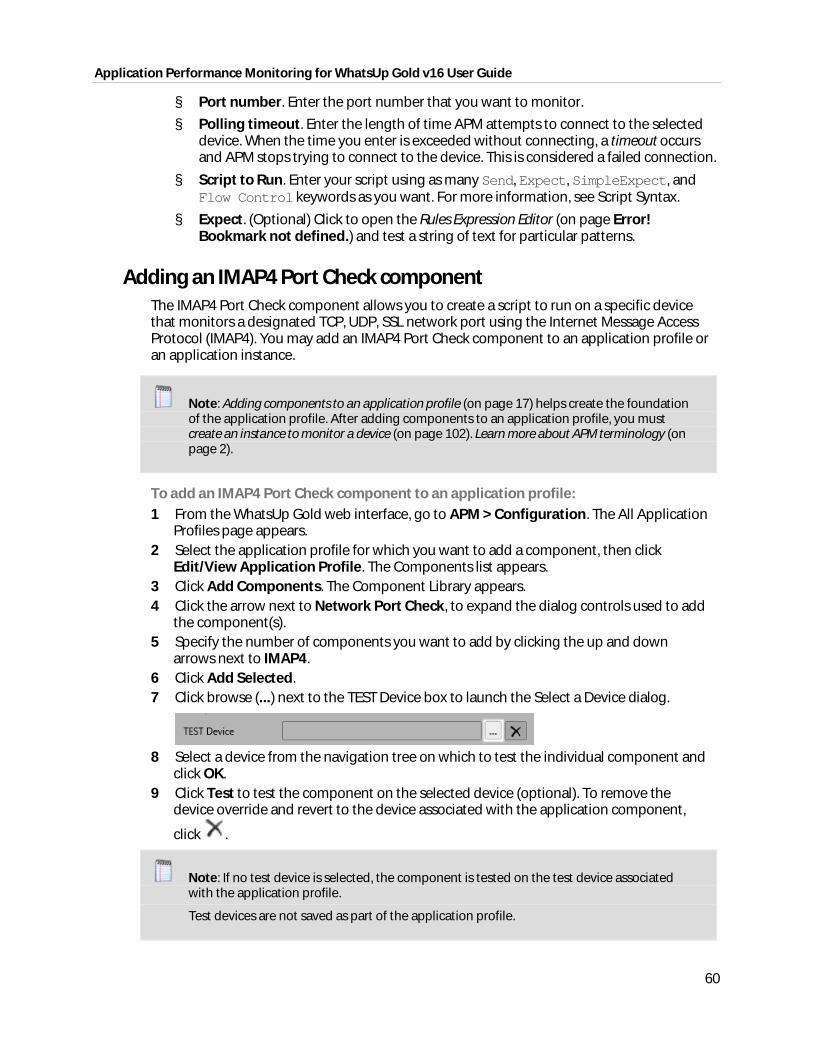
Application Performance Monitoring for WhatsUp Gold v16 User Guide
60
§ Port number. Enter the port number that you want to monitor.
§ Polling timeout. Enter the length of time APM attempts to connect to the selected device. When the time you enter is exceeded without connecting, a timeout occurs and APM stops trying to connect to the device. This is considered a failed connection.
§ Script to Run. Enter your script using as many Send, Expect, SimpleExpect, and Flow Control keywords as you want. For more information, see Script Syntax.
§ Expect. (Optional) Click to open the Rules Expression Editor (on page Error! Bookmark not defined.) and test a string of text for particular patterns.
Adding an IMAP4 Port Check component The IMAP4 Port Check component allows you to create a script to run on a specific device that monitors a designated TCP, UDP, SSL network port using the Internet Message Access Protocol (IMAP4). You may add an IMAP4 Port Check component to an application profile or an application instance.
Note: Adding components to an application profile (on page 17) helps create the foundation of the application profile. After adding components to an application profile, you must create an instance to monitor a device (on page 102). Learn more about APM terminology (on page 2).
To add an IMAP4 Port Check component to an application profile: 1 From the WhatsUp Gold web interface, go to APM > Configuration. The All Application
Profiles page appears. 2 Select the application profile for which you want to add a component, then click
Edit/View Application Profile. The Components list appears. 3 Click Add Components. The Component Library appears. 4 Click the arrow next to Network Port Check, to expand the dialog controls used to add
the component(s). 5 Specify the number of components you want to add by clicking the up and down
arrows next to IMAP4. 6 Click Add Selected. 7 Click browse (...) next to the TEST Device box to launch the Select a Device dialog.
8 Select a device from the navigation tree on which to test the individual component and
click OK. 9 Click Test to test the component on the selected device (optional). To remove the
device override and revert to the device associated with the application component,
click .
Note: If no test device is selected, the component is tested on the test device associated with the application profile.
Test devices are not saved as part of the application profile.
Application Performance Monitoring for WhatsUp Gold v16 User Guide
61
10 Enter or select the appropriate information in the IMAP4 Port Check component boxes (on page 60).
11 Click Save to save your changes or click Save and Close to complete your changes.
To add an IMAP4 Port Check component to an application instance: 1 From the WhatsUp Gold web interface, go to APM > Configuration. The All Application
Profiles page appears. 2 Select the application instance for which you want to add a component. 3 Click Add Components. The Component Library appears. 4 Click the arrow next to Network Port Check, then specify the number of components
you want to add by clicking the up and down arrows next to IMAP4. 5 Click Add Selected. 6 Enter or select the appropriate information:
§ Enabled. Select this option to enable or disable the component.
§ Action Policy. Select an action policy from the list for the component.
§ Device Override. (Optional) Override the device associated with the instance and designate a specific device to assign to the component.
§ Click browse (...) next to the Device Override box to launch the Select a Device dialog.
Important: If the device you want to use is configured with a WhatsUp Gold down dependency, make sure that you use a cloned device for this device selection in the Application Performance Monitoring plug-in. For more information, see the Dependencies overview.
§ Select a device from the navigation tree on which to test the individual component and click OK.
§ Click Test to test the component on the selected device.
Note: Click to remove the device override and revert to the device associated with the application instance.
7 Enter or select the appropriate information in the IMAP4 Port Check component boxes (on page 60).
8 Click Save to save your changes or click Save and Close to complete your changes.
IMAP4 Port Check component fields You may configure the following boxes for the IMAP4 Port Check component:
§ Name. Enter a unique name for the component.
§ Description. (Optional) Enter additional information about the component.
§ Critical. Click to select this check box if the component is critical.

Application Performance Monitoring for WhatsUp Gold v16 User Guide
62
Note: Components specified as critical cause the application to go into a down state when the component is out of threshold. Non-critical components cause the application to go into a warning state. For more information on application states, see Working with application states (on page 132).
§ Polling frequency. Select a time (in minutes or hours) you want APM to wait between polls.
§ Protocol. Select TCP, UDP, or SSL from the list. The network type for the FTP (File Transfer Protocol) service is TCP; the network type for the RADIUS (Remote Authentication and Dial-In User Service) service is UDP. The HTTPS monitor uses the SSL type.
§ Port number. Enter the port number that you want to monitor.
§ Polling timeout. Enter the length of time APM attempts to connect to the selected device. When the time you enter is exceeded without connecting, a timeout occurs and APM stops trying to connect to the device. This is considered a failed connection.
§ Script to Run. Enter your script using as many Send, Expect, SimpleExpect, and Flow Control keywords as you want. For more information, see Script Syntax.
§ Expect. (Optional) Click to open the Rules Expression Editor (on page Error! Bookmark not defined.) and test a string of text for particular patterns.
Adding an NNTP Port Check component The NNTP Port Check component allows you to create a script to run on a specific device that monitors a designated TCP, UDP, SSL network port using the Network News Transfer Protocol (NNTP). You may add an NNTP Port Check component to an application profile or an application instance.
Note: Adding components to an application profile (on page 17) helps create the foundation of the application profile. After adding components to an application profile, you must create an instance to monitor a device (on page 102). Learn more about APM terminology (on page 2).
To add an NNTP Port Check component to an application profile: 1 From the WhatsUp Gold web interface, go to APM > Configuration. The All Application
Profiles page appears. 2 Select the application profile for which you want to add a component, then click
Edit/View Application Profile. The Components list appears. 3 Click Add Components. The Component Library appears. 4 Click the arrow next to Network Port Check to expand the dialog controls used to add
the component(s). 5 Specify the number of components you want to add by clicking the up and down
arrows next to NNTP. 6 Click Add Selected.
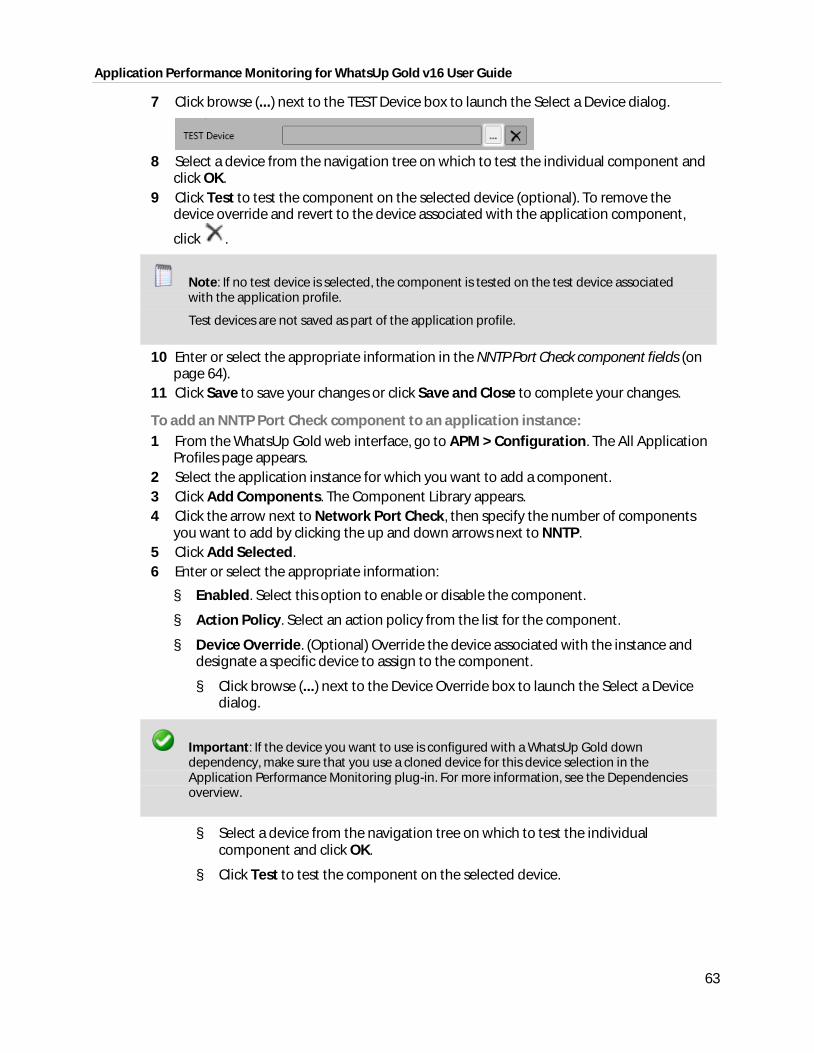
Application Performance Monitoring for WhatsUp Gold v16 User Guide
63
7 Click browse (...) next to the TEST Device box to launch the Select a Device dialog.
8 Select a device from the navigation tree on which to test the individual component and
click OK. 9 Click Test to test the component on the selected device (optional). To remove the
device override and revert to the device associated with the application component,
click .
Note: If no test device is selected, the component is tested on the test device associated with the application profile.
Test devices are not saved as part of the application profile.
10 Enter or select the appropriate information in the NNTP Port Check component fields (on page 64).
11 Click Save to save your changes or click Save and Close to complete your changes.
To add an NNTP Port Check component to an application instance: 1 From the WhatsUp Gold web interface, go to APM > Configuration. The All Application
Profiles page appears. 2 Select the application instance for which you want to add a component. 3 Click Add Components. The Component Library appears. 4 Click the arrow next to Network Port Check, then specify the number of components
you want to add by clicking the up and down arrows next to NNTP. 5 Click Add Selected. 6 Enter or select the appropriate information:
§ Enabled. Select this option to enable or disable the component.
§ Action Policy. Select an action policy from the list for the component.
§ Device Override. (Optional) Override the device associated with the instance and designate a specific device to assign to the component.
§ Click browse (...) next to the Device Override box to launch the Select a Device dialog.
Important: If the device you want to use is configured with a WhatsUp Gold down dependency, make sure that you use a cloned device for this device selection in the Application Performance Monitoring plug-in. For more information, see the Dependencies overview.
§ Select a device from the navigation tree on which to test the individual component and click OK.
§ Click Test to test the component on the selected device.
Application Performance Monitoring for WhatsUp Gold v16 User Guide
64
Note: Click to remove the device override and revert to the device associated with the application instance.
7 Enter or select the appropriate information in the NNTP Port Check component boxes (on page 64).
8 Click Save to save your changes or click Save and Close to complete your changes.
NNTP Port Check component fields You may configure the following boxes for the NNTP Port Check component:
§ Name. Enter a unique name for the component.
§ Description. (Optional) Enter additional information about the component.
§ Critical. Click to select this check box if the component is critical.
Note: Components specified as critical cause the application to go into a down state when the component is out of threshold. Non-critical components cause the application to go into a warning state. For more information on application states, see Working with application states (on page 132).
§ Polling frequency. Select a time (in minutes or hours) you want APM to wait between polls.
§ Protocol. Select TCP, UDP, or SSL from the list. The network type for the FTP (File Transfer Protocol) service is TCP; the network type for the RADIUS (Remote Authentication and Dial-In User Service) service is UDP. The HTTPS monitor uses the SSL type.
§ Port number. Enter the port number that you want to monitor.
§ Polling timeout. Enter the length of time APM attempts to connect to the selected device. When the time you enter is exceeded without connecting, a timeout occurs and APM stops trying to connect to the device. This is considered a failed connection.
§ Script to Run. Enter your script using as many Send, Expect, SimpleExpect, and Flow Control keywords as you want. For more information, see Script Syntax.
§ Expect. (Optional) Click to open the Rules Expression Editor (on page Error! Bookmark not defined.) and test a string of text for particular patterns.
Adding a POP3 Port Check component The POP3 Port Check component allows you to create a script to run on a specific device that monitors a designated TCP, UDP, SSL network port using the Post Office Protocol (POP3). You may add a POP3 Port Check component to an application profile or an application instance.
Note: Adding components to an application profile (on page 17) helps create the foundation of the application profile. After adding components to an application profile, you must create an instance to monitor a device (on page 102). Learn more about APM terminology (on page 2).
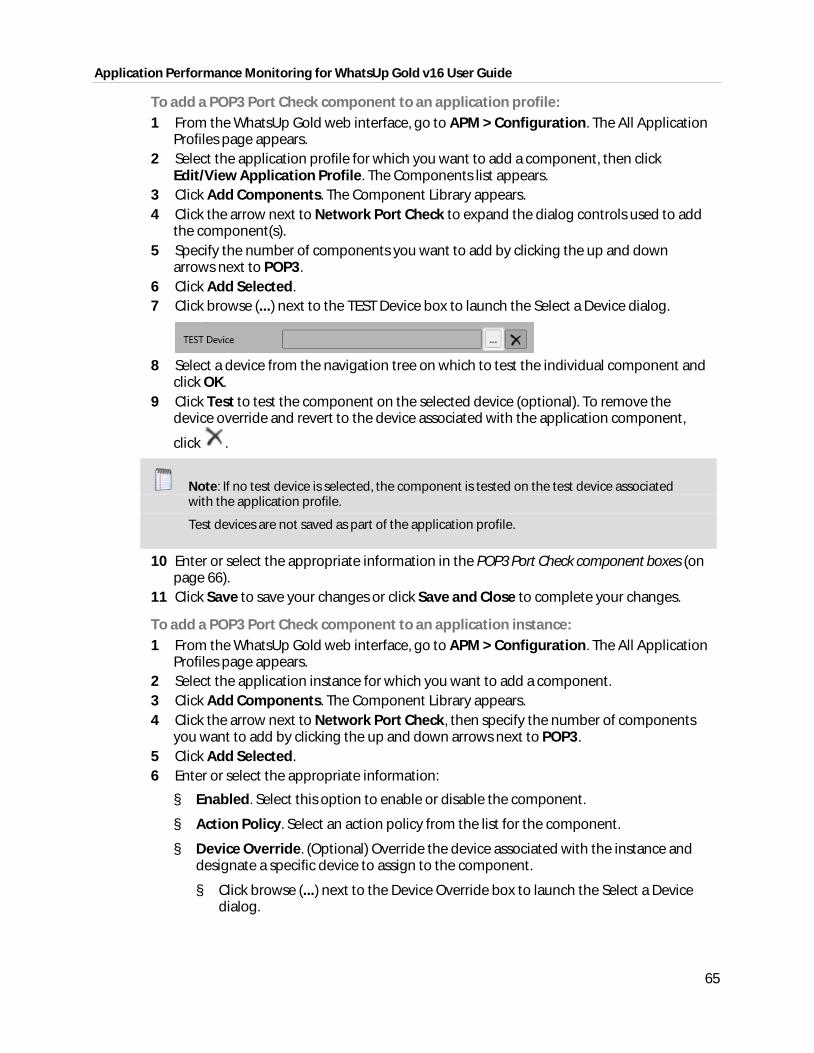
Application Performance Monitoring for WhatsUp Gold v16 User Guide
65
To add a POP3 Port Check component to an application profile: 1 From the WhatsUp Gold web interface, go to APM > Configuration. The All Application
Profiles page appears. 2 Select the application profile for which you want to add a component, then click
Edit/View Application Profile. The Components list appears. 3 Click Add Components. The Component Library appears. 4 Click the arrow next to Network Port Check to expand the dialog controls used to add
the component(s). 5 Specify the number of components you want to add by clicking the up and down
arrows next to POP3. 6 Click Add Selected. 7 Click browse (...) next to the TEST Device box to launch the Select a Device dialog.
8 Select a device from the navigation tree on which to test the individual component and
click OK. 9 Click Test to test the component on the selected device (optional). To remove the
device override and revert to the device associated with the application component,
click .
Note: If no test device is selected, the component is tested on the test device associated with the application profile.
Test devices are not saved as part of the application profile.
10 Enter or select the appropriate information in the POP3 Port Check component boxes (on page 66).
11 Click Save to save your changes or click Save and Close to complete your changes.
To add a POP3 Port Check component to an application instance: 1 From the WhatsUp Gold web interface, go to APM > Configuration. The All Application
Profiles page appears. 2 Select the application instance for which you want to add a component. 3 Click Add Components. The Component Library appears. 4 Click the arrow next to Network Port Check, then specify the number of components
you want to add by clicking the up and down arrows next to POP3. 5 Click Add Selected. 6 Enter or select the appropriate information:
§ Enabled. Select this option to enable or disable the component.
§ Action Policy. Select an action policy from the list for the component.
§ Device Override. (Optional) Override the device associated with the instance and designate a specific device to assign to the component.
§ Click browse (...) next to the Device Override box to launch the Select a Device dialog.
Application Performance Monitoring for WhatsUp Gold v16 User Guide
66
Important: If the device you want to use is configured with a WhatsUp Gold down dependency, make sure that you use a cloned device for this device selection in the Application Performance Monitoring plug-in. For more information, see the Dependencies overview.
§ Select a device from the navigation tree on which to test the individual component and click OK.
§ Click Test to test the component on the selected device.
Note: Click to remove the device override and revert to the device associated with the application instance.
7 Enter or select the appropriate information in the POP3 Port Check component boxes (on page 66).
8 Click Save to save your changes or click Save and Close to complete your changes.
POP3 Port Check component fields You may configure the following boxes for the POP3 Port Check component:
§ Name. Enter a unique name for the component.
§ Description. (Optional) Enter additional information about the component.
§ Critical. Click to select this check box if the component is critical.
Note: Components specified as critical cause the application to go into a down state when the component is out of threshold. Non-critical components cause the application to go into a warning state. For more information on application states, see Working with application states (on page 132).
§ Polling frequency. Select a time (in minutes or hours) you want APM to wait between polls.
§ Protocol. Select TCP, UDP, or SSL from the list. The network type for the FTP (File Transfer Protocol) service is TCP; the network type for the RADIUS (Remote Authentication and Dial-In User Service) service is UDP. The HTTPS monitor uses the SSL type.
§ Port number. Enter the port number that you want to monitor.
§ Polling timeout. Enter the length of time APM attempts to connect to the selected device. When the time you enter is exceeded without connecting, a timeout occurs and APM stops trying to connect to the device. This is considered a failed connection.
§ Script to Run. Enter your script using as many Send, Expect, SimpleExpect, and Flow Control keywords as you want. For more information, see Script Syntax.
§ Expect. (Optional) Click to open the Rules Expression Editor (on page Error! Bookmark not defined.) and test a string of text for particular patterns.
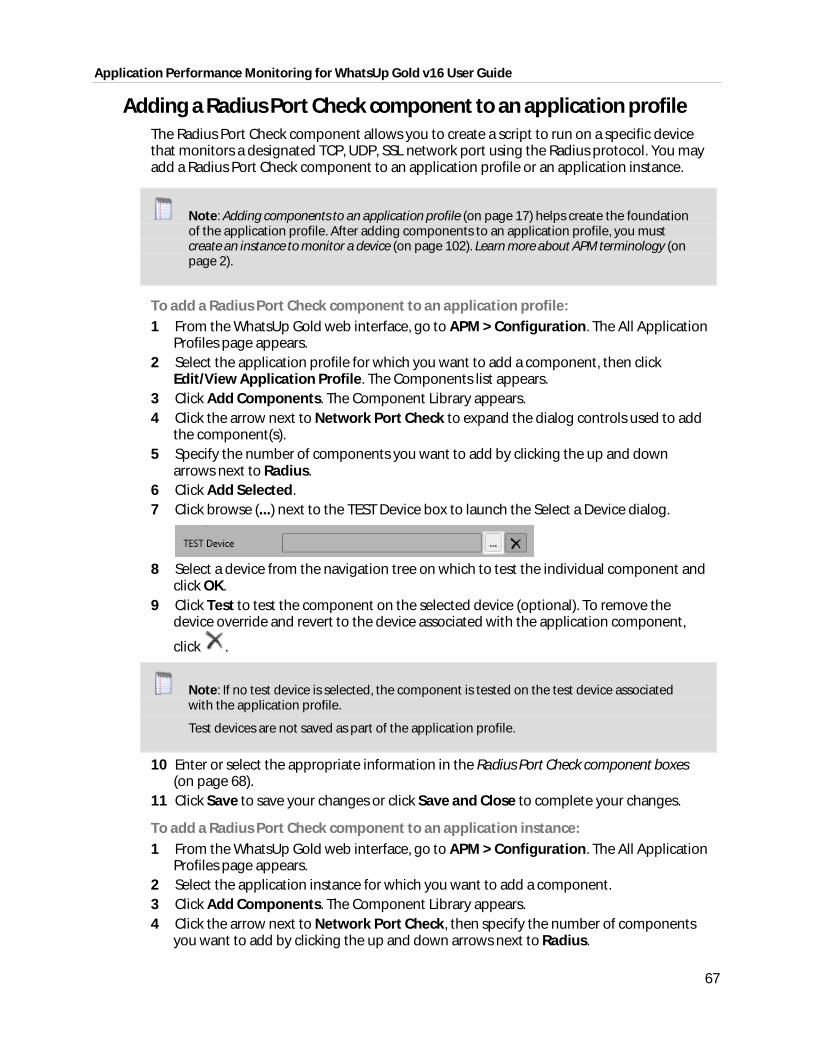
Application Performance Monitoring for WhatsUp Gold v16 User Guide
67
Adding a Radius Port Check component to an application profile The Radius Port Check component allows you to create a script to run on a specific device that monitors a designated TCP, UDP, SSL network port using the Radius protocol. You may add a Radius Port Check component to an application profile or an application instance.
Note: Adding components to an application profile (on page 17) helps create the foundation of the application profile. After adding components to an application profile, you must create an instance to monitor a device (on page 102). Learn more about APM terminology (on page 2).
To add a Radius Port Check component to an application profile: 1 From the WhatsUp Gold web interface, go to APM > Configuration. The All Application
Profiles page appears. 2 Select the application profile for which you want to add a component, then click
Edit/View Application Profile. The Components list appears. 3 Click Add Components. The Component Library appears. 4 Click the arrow next to Network Port Check to expand the dialog controls used to add
the component(s). 5 Specify the number of components you want to add by clicking the up and down
arrows next to Radius. 6 Click Add Selected. 7 Click browse (...) next to the TEST Device box to launch the Select a Device dialog.
8 Select a device from the navigation tree on which to test the individual component and
click OK. 9 Click Test to test the component on the selected device (optional). To remove the
device override and revert to the device associated with the application component,
click .
Note: If no test device is selected, the component is tested on the test device associated with the application profile.
Test devices are not saved as part of the application profile.
10 Enter or select the appropriate information in the Radius Port Check component boxes (on page 68).
11 Click Save to save your changes or click Save and Close to complete your changes.
To add a Radius Port Check component to an application instance: 1 From the WhatsUp Gold web interface, go to APM > Configuration. The All Application
Profiles page appears. 2 Select the application instance for which you want to add a component. 3 Click Add Components. The Component Library appears. 4 Click the arrow next to Network Port Check, then specify the number of components
you want to add by clicking the up and down arrows next to Radius.
Application Performance Monitoring for WhatsUp Gold v16 User Guide
68
5 Click Add Selected. 6 Enter or select the appropriate information:
§ Enabled. Select this option to enable or disable the component.
§ Action Policy. Select an action policy from the list for the component.
§ Device Override. (Optional) Override the device associated with the instance and designate a specific device to assign to the component.
§ Click browse (...) next to the Device Override box to launch the Select a Device dialog.
Important: If the device you want to use is configured with a WhatsUp Gold down dependency, make sure that you use a cloned device for this device selection in the Application Performance Monitoring plug-in. For more information, see the Dependencies overview.
§ Select a device from the navigation tree on which to test the individual component and click OK.
§ Click Test to test the component on the selected device.
Note: Click to remove the device override and revert to the device associated with the application instance.
7 Enter or select the appropriate information in the Radius Port Check component boxes (on page 68).
8 Click Save to save your changes or click Save and Close to complete your changes.
Radius Port Check component fields You may configure the following boxes for the Radius Port Check component:
§ Name. Enter a unique name for the component.
§ Description. (Optional) Enter additional information about the component.
§ Critical. Click to select this check box if the component is critical.
Note: Components specified as critical cause the application to go into a down state when the component is out of threshold. Non-critical components cause the application to go into a warning state. For more information on application states, see Working with application states (on page 132).
§ Polling frequency. Select a time (in minutes or hours) you want APM to wait between polls.
§ Protocol. Select TCP, UDP, or SSL from the list. The network type for the FTP (File Transfer Protocol) service is TCP; the network type for the RADIUS (Remote Authentication and Dial-In User Service) service is UDP. The HTTPS monitor uses the SSL type.
§ Port number. Enter the port number that you want to monitor.
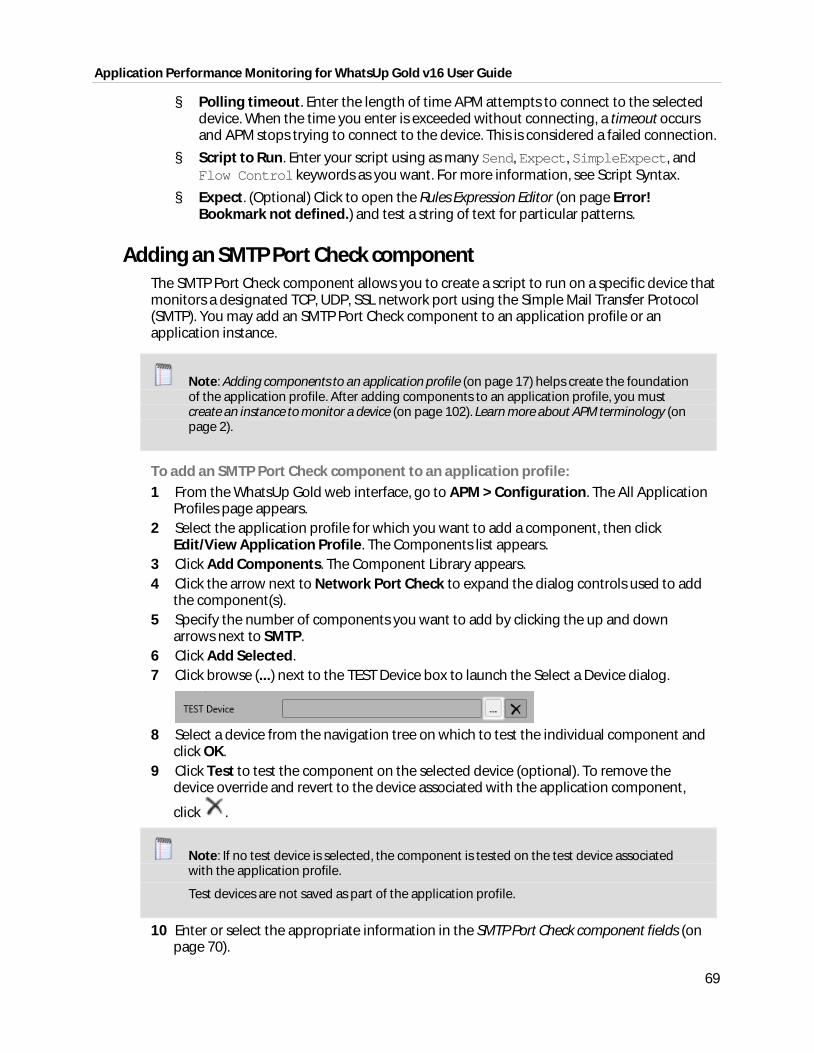
Application Performance Monitoring for WhatsUp Gold v16 User Guide
69
§ Polling timeout. Enter the length of time APM attempts to connect to the selected device. When the time you enter is exceeded without connecting, a timeout occurs and APM stops trying to connect to the device. This is considered a failed connection.
§ Script to Run. Enter your script using as many Send, Expect, SimpleExpect, and Flow Control keywords as you want. For more information, see Script Syntax.
§ Expect. (Optional) Click to open the Rules Expression Editor (on page Error! Bookmark not defined.) and test a string of text for particular patterns.
Adding an SMTP Port Check component The SMTP Port Check component allows you to create a script to run on a specific device that monitors a designated TCP, UDP, SSL network port using the Simple Mail Transfer Protocol (SMTP). You may add an SMTP Port Check component to an application profile or an application instance.
Note: Adding components to an application profile (on page 17) helps create the foundation of the application profile. After adding components to an application profile, you must create an instance to monitor a device (on page 102). Learn more about APM terminology (on page 2).
To add an SMTP Port Check component to an application profile: 1 From the WhatsUp Gold web interface, go to APM > Configuration. The All Application
Profiles page appears. 2 Select the application profile for which you want to add a component, then click
Edit/View Application Profile. The Components list appears. 3 Click Add Components. The Component Library appears. 4 Click the arrow next to Network Port Check to expand the dialog controls used to add
the component(s). 5 Specify the number of components you want to add by clicking the up and down
arrows next to SMTP. 6 Click Add Selected. 7 Click browse (...) next to the TEST Device box to launch the Select a Device dialog.
8 Select a device from the navigation tree on which to test the individual component and
click OK. 9 Click Test to test the component on the selected device (optional). To remove the
device override and revert to the device associated with the application component,
click .
Note: If no test device is selected, the component is tested on the test device associated with the application profile.
Test devices are not saved as part of the application profile.
10 Enter or select the appropriate information in the SMTP Port Check component fields (on page 70).
Application Performance Monitoring for WhatsUp Gold v16 User Guide
70
11 Click Save to save your changes or click Save and Close to complete your changes.
To add an SMTP Port Check component to an application instance: 1 From the WhatsUp Gold web interface, go to APM > Configuration. The All Application
Profiles page appears. 2 Select the application instance for which you want to add a component. 3 Click Add Components. The Component Library appears. 4 Click the arrow next to Network Port Check, then specify the number of components
you want to add by clicking the up and down arrows next to SMTP. 5 Click Add Selected. 6 Enter or select the appropriate information:
§ Enabled. Select this option to enable or disable the component.
§ Action Policy. Select an action policy from the list for the component.
§ Device Override. (Optional) Override the device associated with the instance and designate a specific device to assign to the component.
§ Click browse (...) next to the Device Override box to launch the Select a Device dialog.
Important: If the device you want to use is configured with a WhatsUp Gold down dependency, make sure that you use a cloned device for this device selection in the Application Performance Monitoring plug-in. For more information, see the Dependencies overview.
§ Select a device from the navigation tree on which to test the individual component and click OK.
§ Click Test to test the component on the selected device.
Note: Click to remove the device override and revert to the device associated with the application instance.
7 Enter or select the appropriate information in the SMTP Port Check component fields (on page 70).
8 Click Save to save your changes or click Save and Close to complete your changes.
SMTP Port Check component fields You may configure the following boxes for the SMTP Port Check component:
§ Name. Enter a unique name for the component.
§ Description. (Optional) Enter additional information about the component.
§ Critical. Click to select this check box if the component is critical.
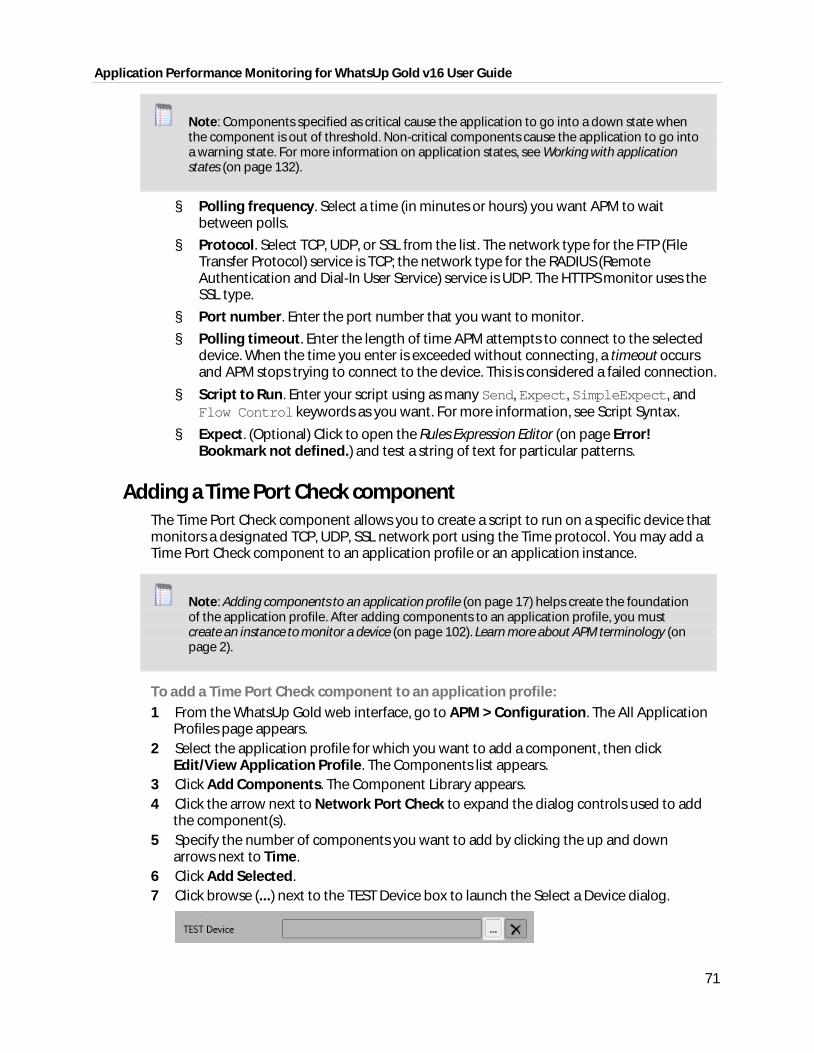
Application Performance Monitoring for WhatsUp Gold v16 User Guide
71
Note: Components specified as critical cause the application to go into a down state when the component is out of threshold. Non-critical components cause the application to go into a warning state. For more information on application states, see Working with application states (on page 132).
§ Polling frequency. Select a time (in minutes or hours) you want APM to wait between polls.
§ Protocol. Select TCP, UDP, or SSL from the list. The network type for the FTP (File Transfer Protocol) service is TCP; the network type for the RADIUS (Remote Authentication and Dial-In User Service) service is UDP. The HTTPS monitor uses the SSL type.
§ Port number. Enter the port number that you want to monitor.
§ Polling timeout. Enter the length of time APM attempts to connect to the selected device. When the time you enter is exceeded without connecting, a timeout occurs and APM stops trying to connect to the device. This is considered a failed connection.
§ Script to Run. Enter your script using as many Send, Expect, SimpleExpect, and Flow Control keywords as you want. For more information, see Script Syntax.
§ Expect. (Optional) Click to open the Rules Expression Editor (on page Error! Bookmark not defined.) and test a string of text for particular patterns.
Adding a Time Port Check component The Time Port Check component allows you to create a script to run on a specific device that monitors a designated TCP, UDP, SSL network port using the Time protocol. You may add a Time Port Check component to an application profile or an application instance.
Note: Adding components to an application profile (on page 17) helps create the foundation of the application profile. After adding components to an application profile, you must create an instance to monitor a device (on page 102). Learn more about APM terminology (on page 2).
To add a Time Port Check component to an application profile: 1 From the WhatsUp Gold web interface, go to APM > Configuration. The All Application
Profiles page appears. 2 Select the application profile for which you want to add a component, then click
Edit/View Application Profile. The Components list appears. 3 Click Add Components. The Component Library appears. 4 Click the arrow next to Network Port Check to expand the dialog controls used to add
the component(s). 5 Specify the number of components you want to add by clicking the up and down
arrows next to Time. 6 Click Add Selected. 7 Click browse (...) next to the TEST Device box to launch the Select a Device dialog.
Application Performance Monitoring for WhatsUp Gold v16 User Guide
72
8 Select a device from the navigation tree on which to test the individual component and click OK.
9 Click Test to test the component on the selected device (optional). To remove the device override and revert to the device associated with the application component,
click .
Note: If no test device is selected, the component is tested on the test device associated with the application profile.
Test devices are not saved as part of the application profile.
10 Enter or select the appropriate information in the Time Port Check component boxes (on page 73).
11 Click Save to save your changes or click Save and Close to complete your changes.
To add a Time Port Check component to an application instance: 1 From the WhatsUp Gold web interface, go to APM > Configuration. The All Application
Profiles page appears. 2 Select the application instance for which you want to add a component. 3 Click Add Components. The Component Library appears. 4 Click the arrow next to Network Port Check, then specify the number of components
you want to add by clicking the up and down arrows next to Time. 5 Click Add Selected. 6 Enter or select the appropriate information:
§ Enabled. Select this option to enable or disable the component.
§ Action Policy. Select an action policy from the list for the component.
§ Device Override. (Optional) Override the device associated with the instance and designate a specific device to assign to the component.
§ Click browse (...) next to the Device Override box to launch the Select a Device dialog.
Important: If the device you want to use is configured with a WhatsUp Gold down dependency, make sure that you use a cloned device for this device selection in the Application Performance Monitoring plug-in. For more information, see the Dependencies overview.
§ Select a device from the navigation tree on which to test the individual component and click OK.
§ Click Test to test the component on the selected device.
Note: Click to remove the device override and revert to the device associated with the application instance.
7 Enter or select the appropriate information in the Time Port Check component boxes (on page 73).
8 Click Save to save your changes or click Save and Close to complete your changes.
Application Performance Monitoring for WhatsUp Gold v16 User Guide
73
Time Port Check component fields You may configure the following boxes for the Time Port Check component:
§ Name. Enter a unique name for the component.
§ Description. (Optional) Enter additional information about the component.
§ Critical. Click to select this check box if the component is critical.
Note: Components specified as critical cause the application to go into a down state when the component is out of threshold. Non-critical components cause the application to go into a warning state. For more information on application states, see Working with application states (on page 132).
§ Polling frequency. Select a time (in minutes or hours) you want APM to wait between polls.
§ Protocol. Select TCP, UDP, or SSL from the list. The network type for the FTP (File Transfer Protocol) service is TCP; the network type for the RADIUS (Remote Authentication and Dial-In User Service) service is UDP. The HTTPS monitor uses the SSL type.
§ Port number. Enter the port number that you want to monitor.
§ Polling timeout. Enter the length of time APM attempts to connect to the selected device. When the time you enter is exceeded without connecting, a timeout occurs and APM stops trying to connect to the device. This is considered a failed connection.
§ Script to Run. Enter your script using as many Send, Expect, SimpleExpect, and Flow Control keywords as you want. For more information, see Script Syntax.
§ Expect. (Optional) Click to open the Rules Expression Editor (on page Error! Bookmark not defined.) and test a string of text for particular patterns.
Adding an SNMP Process Check component The SNMP Process Check component allows you to monitor a process on a specific device using the Simple Network Management Protocol (SNMP). You may add an SNMP Process Check component to an application profile or an application instance.
Note: Adding components to an application profile (on page 17) helps create the foundation of the application profile. After adding components to an application profile, you must create an instance to monitor a device (on page 102). Learn more about APM terminology (on page 2).
To add an SNMP Process Check component to an application profile: 1 From the WhatsUp Gold web interface, go to APM > Configuration. The All Application
Profiles page appears. 2 Select the application profile for which you want to add a component, then click
Edit/View Application Profile. The Components list appears. 3 Click Add Components. The Component Library appears.
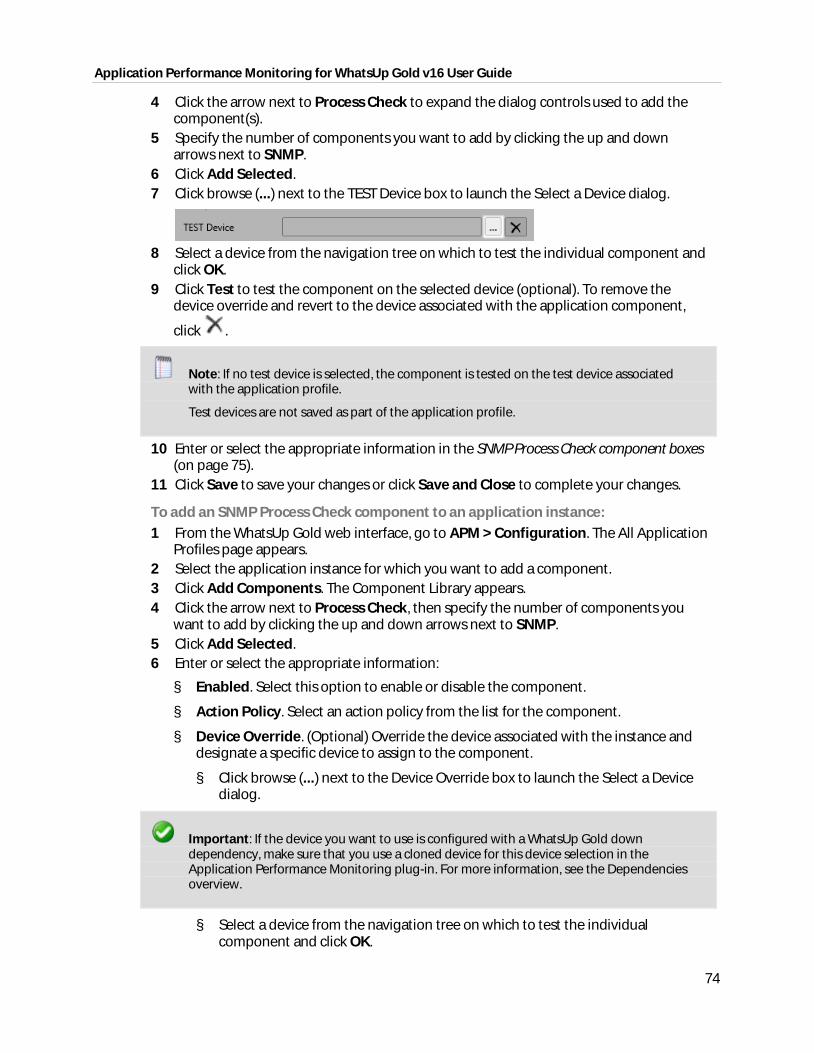
Application Performance Monitoring for WhatsUp Gold v16 User Guide
74
4 Click the arrow next to Process Check to expand the dialog controls used to add the component(s).
5 Specify the number of components you want to add by clicking the up and down arrows next to SNMP.
6 Click Add Selected. 7 Click browse (...) next to the TEST Device box to launch the Select a Device dialog.
8 Select a device from the navigation tree on which to test the individual component and
click OK. 9 Click Test to test the component on the selected device (optional). To remove the
device override and revert to the device associated with the application component,
click .
Note: If no test device is selected, the component is tested on the test device associated with the application profile.
Test devices are not saved as part of the application profile.
10 Enter or select the appropriate information in the SNMP Process Check component boxes (on page 75).
11 Click Save to save your changes or click Save and Close to complete your changes.
To add an SNMP Process Check component to an application instance: 1 From the WhatsUp Gold web interface, go to APM > Configuration. The All Application
Profiles page appears. 2 Select the application instance for which you want to add a component. 3 Click Add Components. The Component Library appears. 4 Click the arrow next to Process Check, then specify the number of components you
want to add by clicking the up and down arrows next to SNMP. 5 Click Add Selected. 6 Enter or select the appropriate information:
§ Enabled. Select this option to enable or disable the component.
§ Action Policy. Select an action policy from the list for the component.
§ Device Override. (Optional) Override the device associated with the instance and designate a specific device to assign to the component.
§ Click browse (...) next to the Device Override box to launch the Select a Device dialog.
Important: If the device you want to use is configured with a WhatsUp Gold down dependency, make sure that you use a cloned device for this device selection in the Application Performance Monitoring plug-in. For more information, see the Dependencies overview.
§ Select a device from the navigation tree on which to test the individual component and click OK.
Application Performance Monitoring for WhatsUp Gold v16 User Guide
75
§ Click Test to test the component on the selected device.
Note: Click to remove the device override and revert to the device associated with the application instance.
7 Enter or select the appropriate information in the SNMP Process Check component boxes (on page 75).
8 Click Save to save your changes or click Save and Close to complete your changes.
SNMP Process Check component fields You may configure the following boxes for the SNMP Process Check component:
§ Name. Enter a unique name for the component.
§ Description. (Optional) Enter additional information about the component.
§ Critical. Click to select this check box if the component is critical.
Note: Components specified as critical cause the application to go into a down state when the component is out of threshold. Non-critical components cause the application to go into a warning state. For more information on application states, see Working with application states (on page 132).
§ Polling frequency. Select a time (in minutes or hours) you want APM to wait between polls.
§ Process Name. Click browse (...) open the device browser and select the specific device and process you would like to monitor.
§ Down if not running. Select this option to put the application in a down state if the process is not running.
§ Polling timeout. Enter the length of time APM attempts to connect to the selected device. When the time you enter is exceeded without connecting, a timeout occurs and APM stops trying to connect to the device. This is considered a failed connection.
§ Poller retries. Enter the number of times APM attempts to send the command before the device is considered down.
Adding a WMI Process Check component The WMI Process Check component allows you to monitor a process on a specific device using Windows Management Instrumentation (WMI). You can add a WMI Process Check component to an application profile or an application instance.
Note: Adding components to an application profile (on page 17) helps create the foundation of the application profile. After adding components to an application profile, you must create an instance to monitor a device (on page 102). Learn more about APM terminology (on page 2).
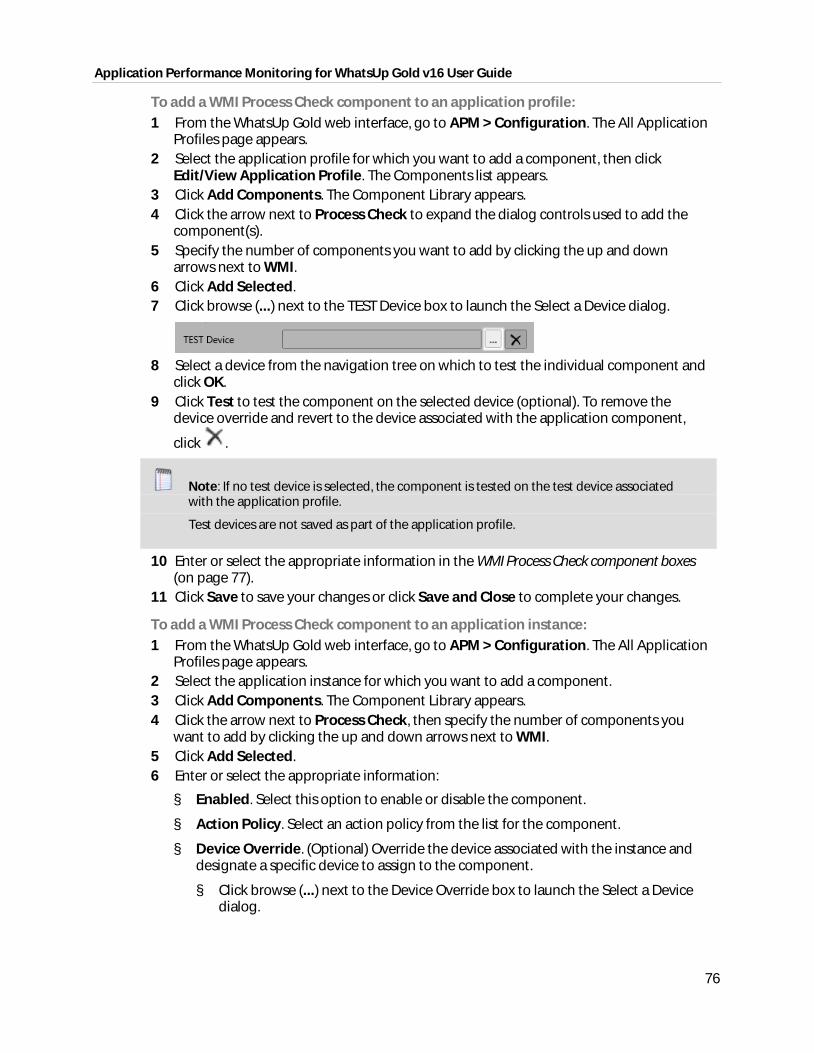
Application Performance Monitoring for WhatsUp Gold v16 User Guide
76
To add a WMI Process Check component to an application profile: 1 From the WhatsUp Gold web interface, go to APM > Configuration. The All Application
Profiles page appears. 2 Select the application profile for which you want to add a component, then click
Edit/View Application Profile. The Components list appears. 3 Click Add Components. The Component Library appears. 4 Click the arrow next to Process Check to expand the dialog controls used to add the
component(s). 5 Specify the number of components you want to add by clicking the up and down
arrows next to WMI. 6 Click Add Selected. 7 Click browse (...) next to the TEST Device box to launch the Select a Device dialog.
8 Select a device from the navigation tree on which to test the individual component and
click OK. 9 Click Test to test the component on the selected device (optional). To remove the
device override and revert to the device associated with the application component,
click .
Note: If no test device is selected, the component is tested on the test device associated with the application profile.
Test devices are not saved as part of the application profile.
10 Enter or select the appropriate information in the WMI Process Check component boxes (on page 77).
11 Click Save to save your changes or click Save and Close to complete your changes.
To add a WMI Process Check component to an application instance: 1 From the WhatsUp Gold web interface, go to APM > Configuration. The All Application
Profiles page appears. 2 Select the application instance for which you want to add a component. 3 Click Add Components. The Component Library appears. 4 Click the arrow next to Process Check, then specify the number of components you
want to add by clicking the up and down arrows next to WMI. 5 Click Add Selected. 6 Enter or select the appropriate information:
§ Enabled. Select this option to enable or disable the component.
§ Action Policy. Select an action policy from the list for the component.
§ Device Override. (Optional) Override the device associated with the instance and designate a specific device to assign to the component.
§ Click browse (...) next to the Device Override box to launch the Select a Device dialog.
Application Performance Monitoring for WhatsUp Gold v16 User Guide
77
Important: If the device you want to use is configured with a WhatsUp Gold down dependency, make sure that you use a cloned device for this device selection in the Application Performance Monitoring plug-in. For more information, see the Dependencies overview.
§ Select a device from the navigation tree on which to test the individual component and click OK.
§ Click Test to test the component on the selected device.
Note: Click to remove the device override and revert to the device associated with the application instance.
7 Enter or select the appropriate information in the WMI Process Check component boxes (on page 77).
8 Click Save to save your changes or click Save and Close to complete your changes.
WMI Process Check component fields You may configure the following boxes for the WMI Process Check component:
§ Name. Enter a unique name for the component.
§ Description. (Optional) Enter additional information about the component.
§ Critical. Click to select this check box if the component is critical.
Note: Components specified as critical cause the application to go into a down state when the component is out of threshold. Non-critical components cause the application to go into a warning state. For more information on application states, see Working with application states (on page 132).
§ Polling frequency. Select a time (in minutes or hours) you want APM to wait between polls.
§ Process Name. Click browse (...) open the device browser and select the specific device and process you would like to monitor.
§ Down if not running. Select this option to put the application in a down state if the process is not running.
Adding a PowerShell Execution Check component Windows PowerShell is a scripting language and command-line shell that system administrators can use to manage Windows operating systems. For more information on PowerShell, please visit the Microsoft web site (http://www.whatsupgold.com/MSPowerShell). The PowerShell Execution component allows you to run a PowerShell script and analyze the output. You may add a PowerShell Execution component to an application profile or an application instance.
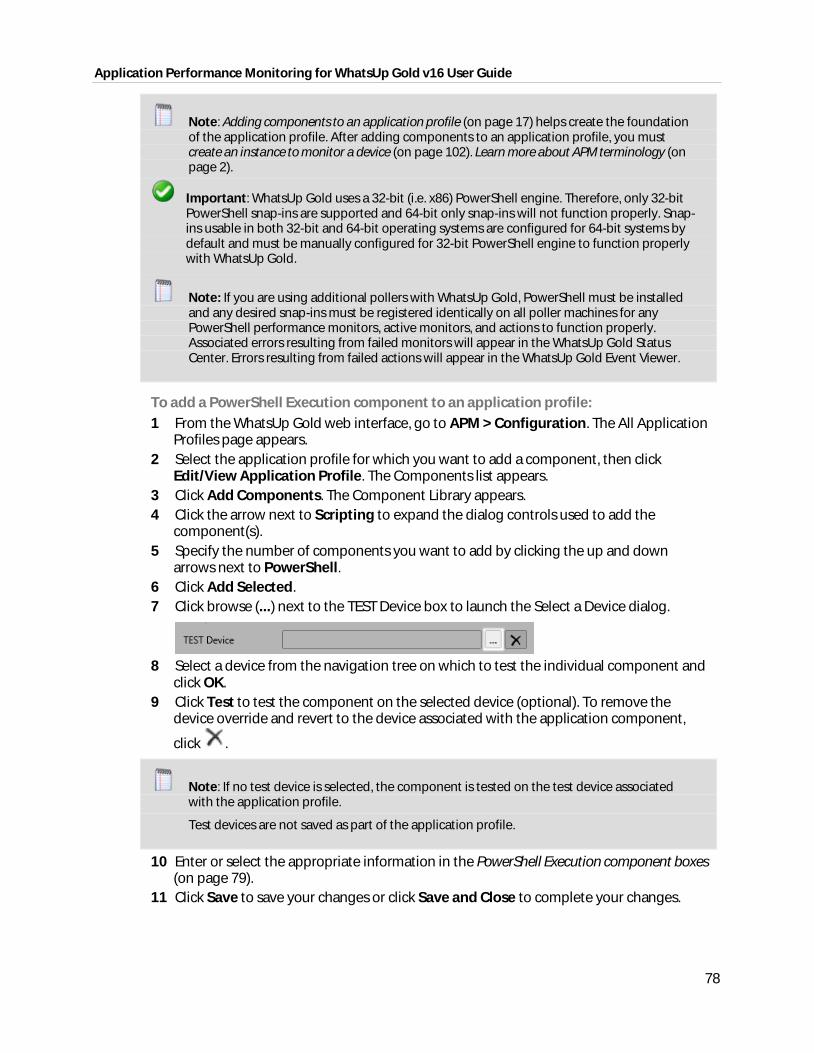
Application Performance Monitoring for WhatsUp Gold v16 User Guide
78
Note: Adding components to an application profile (on page 17) helps create the foundation of the application profile. After adding components to an application profile, you must create an instance to monitor a device (on page 102). Learn more about APM terminology (on page 2).
Important: WhatsUp Gold uses a 32-bit (i.e. x86) PowerShell engine. Therefore, only 32-bit PowerShell snap-ins are supported and 64-bit only snap-ins will not function properly. Snap-ins usable in both 32-bit and 64-bit operating systems are configured for 64-bit systems by default and must be manually configured for 32-bit PowerShell engine to function properly with WhatsUp Gold.
Note: If you are using additional pollers with WhatsUp Gold, PowerShell must be installed and any desired snap-ins must be registered identically on all poller machines for any PowerShell performance monitors, active monitors, and actions to function properly. Associated errors resulting from failed monitors will appear in the WhatsUp Gold Status Center. Errors resulting from failed actions will appear in the WhatsUp Gold Event Viewer.
To add a PowerShell Execution component to an application profile: 1 From the WhatsUp Gold web interface, go to APM > Configuration. The All Application
Profiles page appears. 2 Select the application profile for which you want to add a component, then click
Edit/View Application Profile. The Components list appears. 3 Click Add Components. The Component Library appears. 4 Click the arrow next to Scripting to expand the dialog controls used to add the
component(s). 5 Specify the number of components you want to add by clicking the up and down
arrows next to PowerShell. 6 Click Add Selected. 7 Click browse (...) next to the TEST Device box to launch the Select a Device dialog.
8 Select a device from the navigation tree on which to test the individual component and
click OK. 9 Click Test to test the component on the selected device (optional). To remove the
device override and revert to the device associated with the application component,
click .
Note: If no test device is selected, the component is tested on the test device associated with the application profile.
Test devices are not saved as part of the application profile.
10 Enter or select the appropriate information in the PowerShell Execution component boxes (on page 79).
11 Click Save to save your changes or click Save and Close to complete your changes.
Application Performance Monitoring for WhatsUp Gold v16 User Guide
79
To add a PowerShell Execution component to an application instance: 1 From the WhatsUp Gold web interface, go to APM > Configuration. The All Application
Profiles page appears. 2 Select the application instance for which you want to add a component. 3 Click Add Components. The Component Library appears. 4 Click the arrow next to Scripting, then specify the number of components you want to
add by clicking the up and down arrows next to PowerShell. 5 Click Add Selected. 6 Enter or select the appropriate information:
§ Enabled. Select this option to enable or disable the component.
§ Action Policy. Select an action policy from the list for the component.
§ Device Override. (Optional) Override the device associated with the instance and designate a specific device to assign to the component.
§ Click browse (...) next to the Device Override box to launch the Select a Device dialog.
Important: If the device you want to use is configured with a WhatsUp Gold down dependency, make sure that you use a cloned device for this device selection in the Application Performance Monitoring plug-in. For more information, see the Dependencies overview.
§ Select a device from the navigation tree on which to test the individual component and click OK.
§ Click Test to test the component on the selected device.
Note: Click to remove the device override and revert to the device associated with the application instance.
7 Enter or select the appropriate information in the PowerShell Execution component boxes (on page 79).
8 Click Save to save your changes or click Save and Close to complete your changes.
PowerShell Execution component fields You may configure the following boxes for the PowerShell Execution component:
§ Name. Enter a unique name for the component.
§ Description. (Optional) Enter additional information about the component.
§ Critical. Click to select this check box if the component is critical.
Note: Components specified as critical cause the application to go into a down state when the component is out of threshold. Non-critical components cause the application to go into a warning state. For more information on application states, see Working with application states (on page 132).
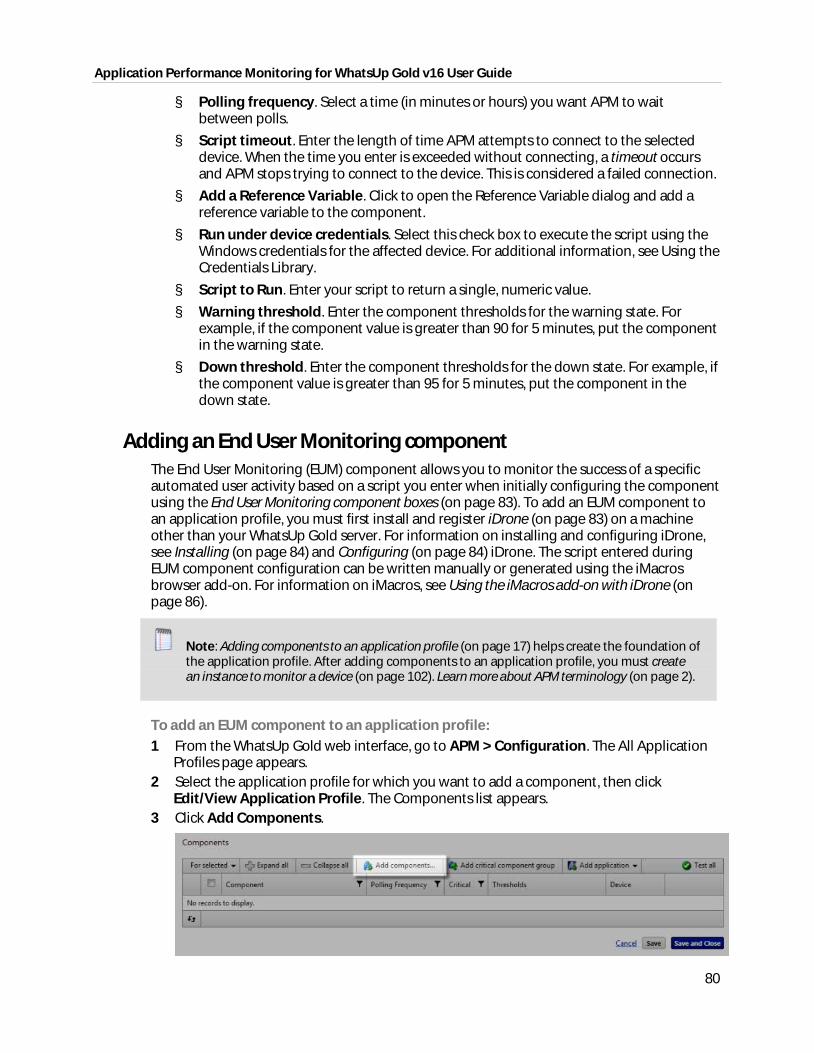
Application Performance Monitoring for WhatsUp Gold v16 User Guide
80
§ Polling frequency. Select a time (in minutes or hours) you want APM to wait between polls.
§ Script timeout. Enter the length of time APM attempts to connect to the selected device. When the time you enter is exceeded without connecting, a timeout occurs and APM stops trying to connect to the device. This is considered a failed connection.
§ Add a Reference Variable. Click to open the Reference Variable dialog and add a reference variable to the component.
§ Run under device credentials. Select this check box to execute the script using the Windows credentials for the affected device. For additional information, see Using the Credentials Library.
§ Script to Run. Enter your script to return a single, numeric value.
§ Warning threshold. Enter the component thresholds for the warning state. For example, if the component value is greater than 90 for 5 minutes, put the component in the warning state.
§ Down threshold. Enter the component thresholds for the down state. For example, if the component value is greater than 95 for 5 minutes, put the component in the down state.
Adding an End User Monitoring component The End User Monitoring (EUM) component allows you to monitor the success of a specific automated user activity based on a script you enter when initially configuring the component using the End User Monitoring component boxes (on page 83). To add an EUM component to an application profile, you must first install and register iDrone (on page 83) on a machine other than your WhatsUp Gold server. For information on installing and configuring iDrone, see Installing (on page 84) and Configuring (on page 84) iDrone. The script entered during EUM component configuration can be written manually or generated using the iMacros browser add-on. For information on iMacros, see Using the iMacros add-on with iDrone (on page 86).
Note: Adding components to an application profile (on page 17) helps create the foundation of the application profile. After adding components to an application profile, you must create an instance to monitor a device (on page 102). Learn more about APM terminology (on page 2).
To add an EUM component to an application profile: 1 From the WhatsUp Gold web interface, go to APM > Configuration. The All Application
Profiles page appears. 2 Select the application profile for which you want to add a component, then click
Edit/View Application Profile. The Components list appears. 3 Click Add Components.
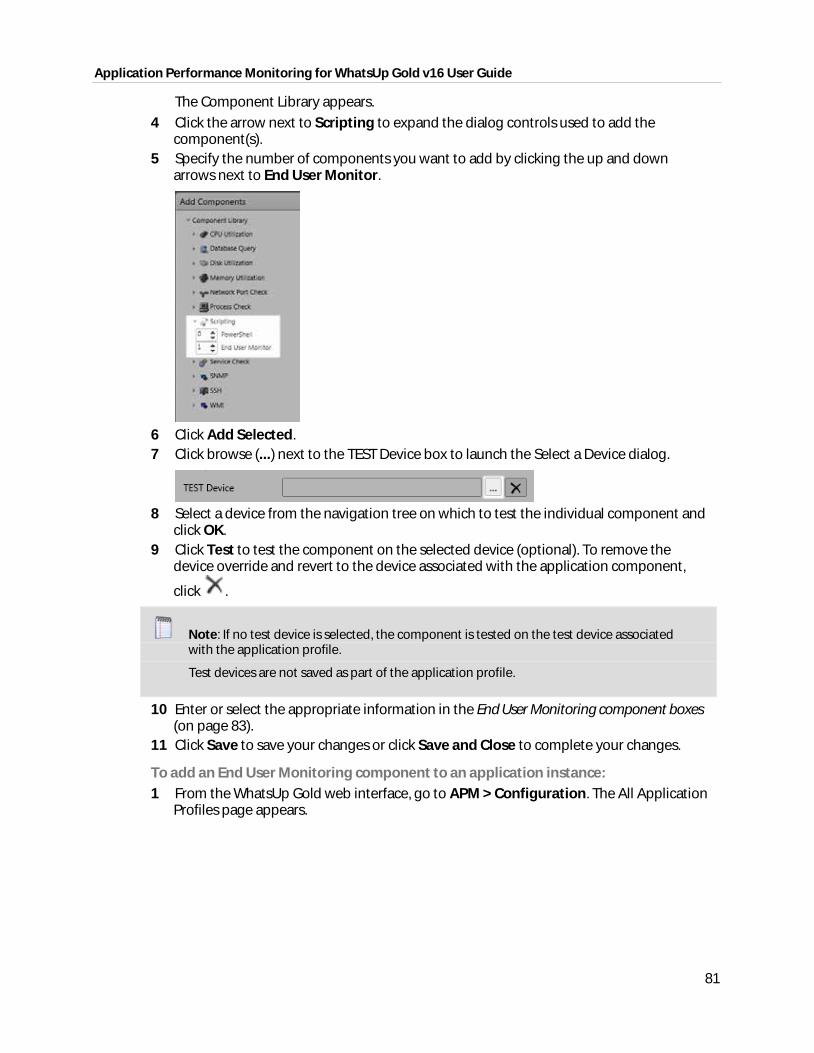
Application Performance Monitoring for WhatsUp Gold v16 User Guide
81
The Component Library appears.
4 Click the arrow next to Scripting to expand the dialog controls used to add the component(s).
5 Specify the number of components you want to add by clicking the up and down arrows next to End User Monitor.
6 Click Add Selected. 7 Click browse (...) next to the TEST Device box to launch the Select a Device dialog.
8 Select a device from the navigation tree on which to test the individual component and
click OK. 9 Click Test to test the component on the selected device (optional). To remove the
device override and revert to the device associated with the application component,
click .
Note: If no test device is selected, the component is tested on the test device associated with the application profile.
Test devices are not saved as part of the application profile.
10 Enter or select the appropriate information in the End User Monitoring component boxes (on page 83).
11 Click Save to save your changes or click Save and Close to complete your changes.
To add an End User Monitoring component to an application instance: 1 From the WhatsUp Gold web interface, go to APM > Configuration. The All Application
Profiles page appears.
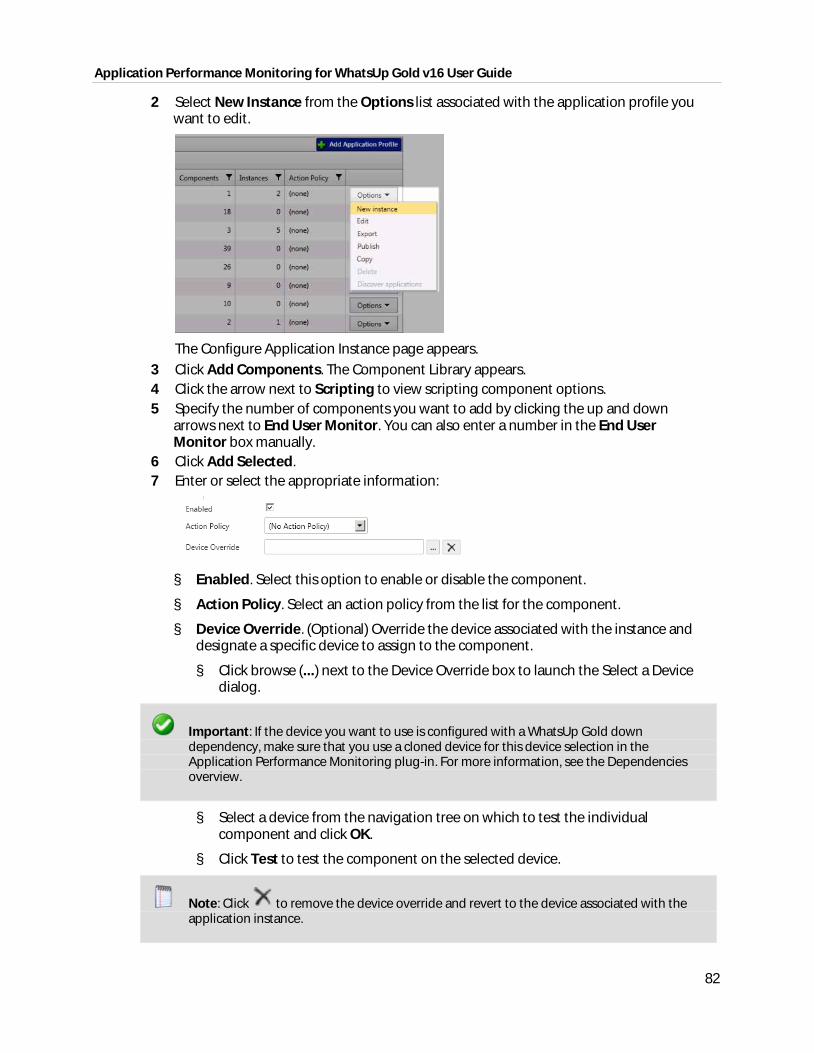
Application Performance Monitoring for WhatsUp Gold v16 User Guide
82
2 Select New Instance from the Options list associated with the application profile you want to edit.
The Configure Application Instance page appears. 3 Click Add Components. The Component Library appears. 4 Click the arrow next to Scripting to view scripting component options. 5 Specify the number of components you want to add by clicking the up and down
arrows next to End User Monitor. You can also enter a number in the End User Monitor box manually.
6 Click Add Selected. 7 Enter or select the appropriate information:
§ Enabled. Select this option to enable or disable the component.
§ Action Policy. Select an action policy from the list for the component.
§ Device Override. (Optional) Override the device associated with the instance and designate a specific device to assign to the component.
§ Click browse (...) next to the Device Override box to launch the Select a Device dialog.
Important: If the device you want to use is configured with a WhatsUp Gold down dependency, make sure that you use a cloned device for this device selection in the Application Performance Monitoring plug-in. For more information, see the Dependencies overview.
§ Select a device from the navigation tree on which to test the individual component and click OK.
§ Click Test to test the component on the selected device.
Note: Click to remove the device override and revert to the device associated with the application instance.
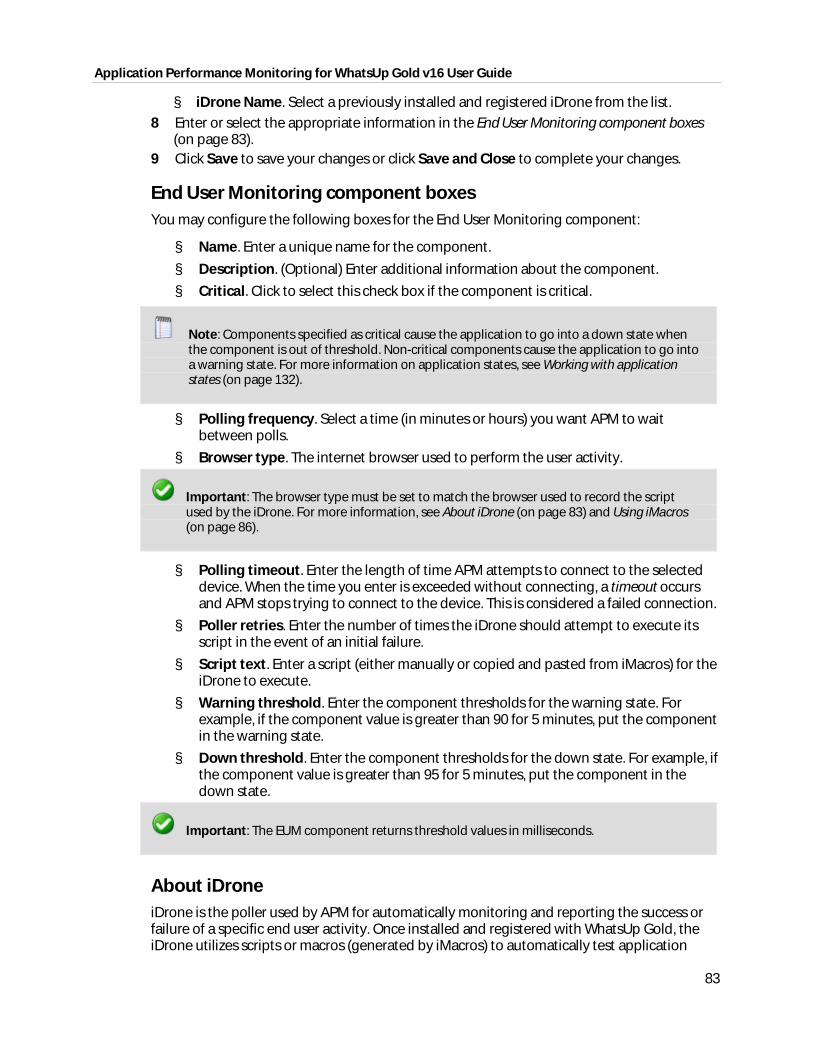
Application Performance Monitoring for WhatsUp Gold v16 User Guide
83
§ iDrone Name. Select a previously installed and registered iDrone from the list. 8 Enter or select the appropriate information in the End User Monitoring component boxes
(on page 83). 9 Click Save to save your changes or click Save and Close to complete your changes.
End User Monitoring component boxes You may configure the following boxes for the End User Monitoring component:
§ Name. Enter a unique name for the component.
§ Description. (Optional) Enter additional information about the component.
§ Critical. Click to select this check box if the component is critical.
Note: Components specified as critical cause the application to go into a down state when the component is out of threshold. Non-critical components cause the application to go into a warning state. For more information on application states, see Working with application states (on page 132).
§ Polling frequency. Select a time (in minutes or hours) you want APM to wait between polls.
§ Browser type. The internet browser used to perform the user activity.
Important: The browser type must be set to match the browser used to record the script used by the iDrone. For more information, see About iDrone (on page 83) and Using iMacros (on page 86).
§ Polling timeout. Enter the length of time APM attempts to connect to the selected device. When the time you enter is exceeded without connecting, a timeout occurs and APM stops trying to connect to the device. This is considered a failed connection.
§ Poller retries. Enter the number of times the iDrone should attempt to execute its script in the event of an initial failure.
§ Script text. Enter a script (either manually or copied and pasted from iMacros) for the iDrone to execute.
§ Warning threshold. Enter the component thresholds for the warning state. For example, if the component value is greater than 90 for 5 minutes, put the component in the warning state.
§ Down threshold. Enter the component thresholds for the down state. For example, if the component value is greater than 95 for 5 minutes, put the component in the down state.
Important: The EUM component returns threshold values in milliseconds.
About iDrone iDrone is the poller used by APM for automatically monitoring and reporting the success or failure of a specific end user activity. Once installed and registered with WhatsUp Gold, the iDrone utilizes scripts or macros (generated by iMacros) to automatically test application
Application Performance Monitoring for WhatsUp Gold v16 User Guide
84
performance without user interaction. When adding an End User Monitoring component (on page 80) to an application profile in APM, you must select an active iDrone for use with the component prior to saving changes to the application profile. An End User Monitoring component cannot be created without an iDrone.
Note: If you use the APM plug-in End User Monitoring (EUM) component to automatically test application performance, you must install the iDrone poller on a machine other than the WhatsUp Gold server. Then, in order for iDrone to communicate with the WhatsUp Gold APM plug-in, make sure that .NET Framework 3.5 is installed on the WhatsUp Gold system.
Installing iDrone The WhatsUp Gold iDrone installation file can be downloaded here (http://www.whatsupgold.com/WUGidrone). The file must be installed on a dedicated virtual machine with no other third-party software installed on the system.
Note: If you use the APM plug-in End User Monitoring (EUM) component to automatically test application performance, you must install the iDrone poller on a machine other than the WhatsUp Gold server. Then, in order for iDrone to communicate with the WhatsUp Gold APM plug-in, make sure that .NET Framework 3.5 is installed on the WhatsUp Gold system.
To install iDrone: 1 Double-click the executable file. If the Open File - Security Warning dialog appears, click
Run. The AlertFox iDrone Setup Wizard launches. 2 Click Next. The Set Destination Location dialog appears. 3 Click Browse and navigate to or enter the location where you want to install iDrone. 4 Click Next. The Ready To Install dialog appears. 5 Click Install. After installation is complete, a dialog indicating it is necessary to restart
your computer to complete the setup appears. 6 Select the applicable radio button indicating your preference. 7 Click Finish. If you indicated you would like to restart your computer now, your machine
automatically shut down and restart.
Configuring iDrone The iDrone Configuration dialog is launched following iDrone installation. The dialog is organized in three sections:
§ Settings. iDrone is named and associated with an existing WhatsUp Gold installation.
§ Registration. iDrone is registered establishing communication with WhatsUp Gold.
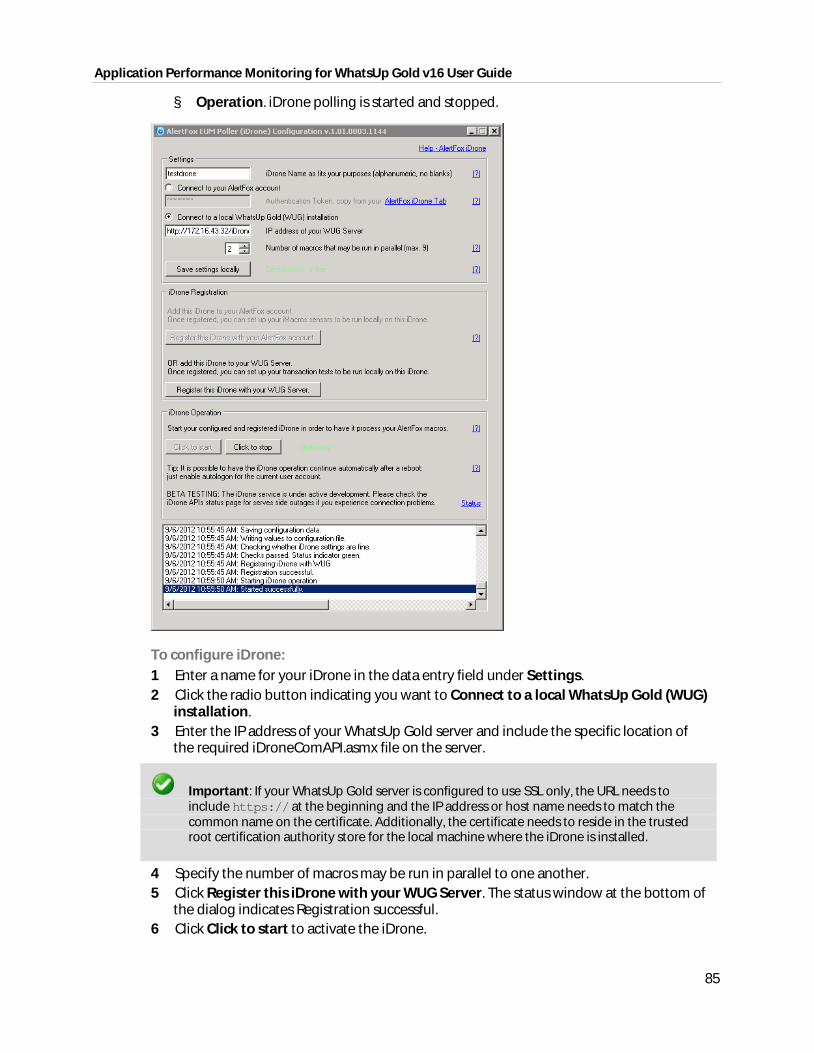
Application Performance Monitoring for WhatsUp Gold v16 User Guide
85
§ Operation. iDrone polling is started and stopped.
To configure iDrone: 1 Enter a name for your iDrone in the data entry field under Settings. 2 Click the radio button indicating you want to Connect to a local WhatsUp Gold (WUG)
installation. 3 Enter the IP address of your WhatsUp Gold server and include the specific location of
the required iDroneComAPI.asmx file on the server.
Important: If your WhatsUp Gold server is configured to use SSL only, the URL needs to include https:// at the beginning and the IP address or host name needs to match the common name on the certificate. Additionally, the certificate needs to reside in the trusted root certification authority store for the local machine where the iDrone is installed.
4 Specify the number of macros may be run in parallel to one another. 5 Click Register this iDrone with your WUG Server. The status window at the bottom of
the dialog indicates Registration successful. 6 Click Click to start to activate the iDrone.
Application Performance Monitoring for WhatsUp Gold v16 User Guide
86
Using the iMacros add-on with iDrone iMacros is a browser add-on that allows you to record browser activity in order to create a macro for use with iDrone. If iMacros is not automatically installed and launched during the iDrone installation process, it can be downloaded here (http://www.whatsupgold.com/WUGidrone). After downloading, access iMacros by clicking
the icon located next to the address window or in the toolbar of your browser.
To record a macro: 1 Navigate to the website on which you want to generate a macro. 2 Select the Rec tab in the iMacros sidebar. 3 Click Record. 4 After you have completed the actions you want to use to generate the macro, click Stop.
The macro you just recorded appears in the navigation tree in the iMacros sidebar with a filename of #Current.iim.
To save a macro:
1 Select #Current.iim or any other macro displayed you want to save with a different filename.
2 Select the Rec tab in the iMacros sidebar. 3 Click Save. A Save File dialog appears. 4 Enter a new name for the file in the Name box. You can also use this dialog to modify
the location of the macro file if desired. 5 Click OK.
To edit a macro: 1 Select the desired macro from the navigation tree. 2 Click the Edit tab. 3 Click Edit Macro. An iMacros Editor dialog appears. 4 Modify the script as needed. 5 Click Save & Close.
Adding an SNMP Service Check component The SNMP Service Check component allows you to use SNMP credentials to monitor a service on a specific device. You may add an SNMP Service Check component to an application profile or an application instance.
Note: Adding components to an application profile (on page 17) helps create the foundation of the application profile. After adding components to an application profile, you must create an instance to monitor a device (on page 102). Learn more about APM terminology (on page 2).
To add an SNMP Service Check component to an application profile: 1 From the WhatsUp Gold web interface, go to APM > Configuration. The All Application
Profiles page appears.
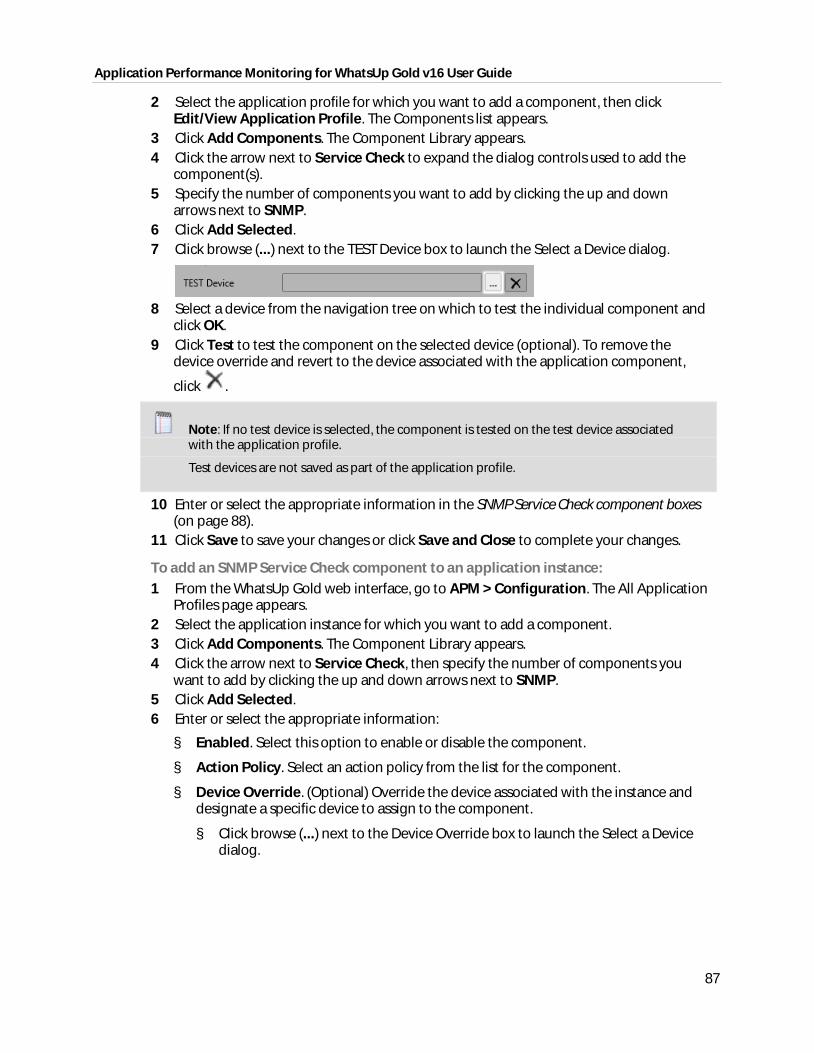
Application Performance Monitoring for WhatsUp Gold v16 User Guide
87
2 Select the application profile for which you want to add a component, then click Edit/View Application Profile. The Components list appears.
3 Click Add Components. The Component Library appears. 4 Click the arrow next to Service Check to expand the dialog controls used to add the
component(s). 5 Specify the number of components you want to add by clicking the up and down
arrows next to SNMP. 6 Click Add Selected. 7 Click browse (...) next to the TEST Device box to launch the Select a Device dialog.
8 Select a device from the navigation tree on which to test the individual component and
click OK. 9 Click Test to test the component on the selected device (optional). To remove the
device override and revert to the device associated with the application component,
click .
Note: If no test device is selected, the component is tested on the test device associated with the application profile.
Test devices are not saved as part of the application profile.
10 Enter or select the appropriate information in the SNMP Service Check component boxes (on page 88).
11 Click Save to save your changes or click Save and Close to complete your changes.
To add an SNMP Service Check component to an application instance: 1 From the WhatsUp Gold web interface, go to APM > Configuration. The All Application
Profiles page appears. 2 Select the application instance for which you want to add a component. 3 Click Add Components. The Component Library appears. 4 Click the arrow next to Service Check, then specify the number of components you
want to add by clicking the up and down arrows next to SNMP. 5 Click Add Selected. 6 Enter or select the appropriate information:
§ Enabled. Select this option to enable or disable the component.
§ Action Policy. Select an action policy from the list for the component.
§ Device Override. (Optional) Override the device associated with the instance and designate a specific device to assign to the component.
§ Click browse (...) next to the Device Override box to launch the Select a Device dialog.
Application Performance Monitoring for WhatsUp Gold v16 User Guide
88
Important: If the device you want to use is configured with a WhatsUp Gold down dependency, make sure that you use a cloned device for this device selection in the Application Performance Monitoring plug-in. For more information, see the Dependencies overview.
§ Select a device from the navigation tree on which to test the individual component and click OK.
§ Click Test to test the component on the selected device.
Note: Click to remove the device override and revert to the device associated with the application instance.
7 Enter or select the appropriate information in the SNMP Service Check component boxes (on page 88).
8 Click Save to save your changes or click Save and Close to complete your changes.
SNMP Service Check component fields You may configure the following boxes for the SNMP Service Check component:
§ Name. Enter a unique name for the component.
§ Description. (Optional) Enter additional information about the component.
§ Critical. Click to select this check box if the component is critical.
Note: Components specified as critical cause the application to go into a down state when the component is out of threshold. Non-critical components cause the application to go into a warning state. For more information on application states, see Working with application states (on page 132).
§ Polling frequency. Select a time (in minutes or hours) you want APM to wait between polls.
§ Service Name. Click browse (...) to bring up the device browser and select the specific device and service you want to monitor.
§ Restart on failure. Select this option to have the monitor attempt to restart the service when it enters a down state.
§ Polling timeout. Enter the length of time APM attempts to connect to the selected device. When the time you enter is exceeded without connecting, a timeout occurs and APM stops trying to connect to the device. This is considered a failed connection.
§ Poller retries. Enter the number of times APM attempts to send the command before the device is considered down.
Adding a WMI Service Check component The WMI Service Check component allows you to use WMI credentials to monitor a service on a specific device. You may add a WMI Service Check component to an application profile or an application instance.
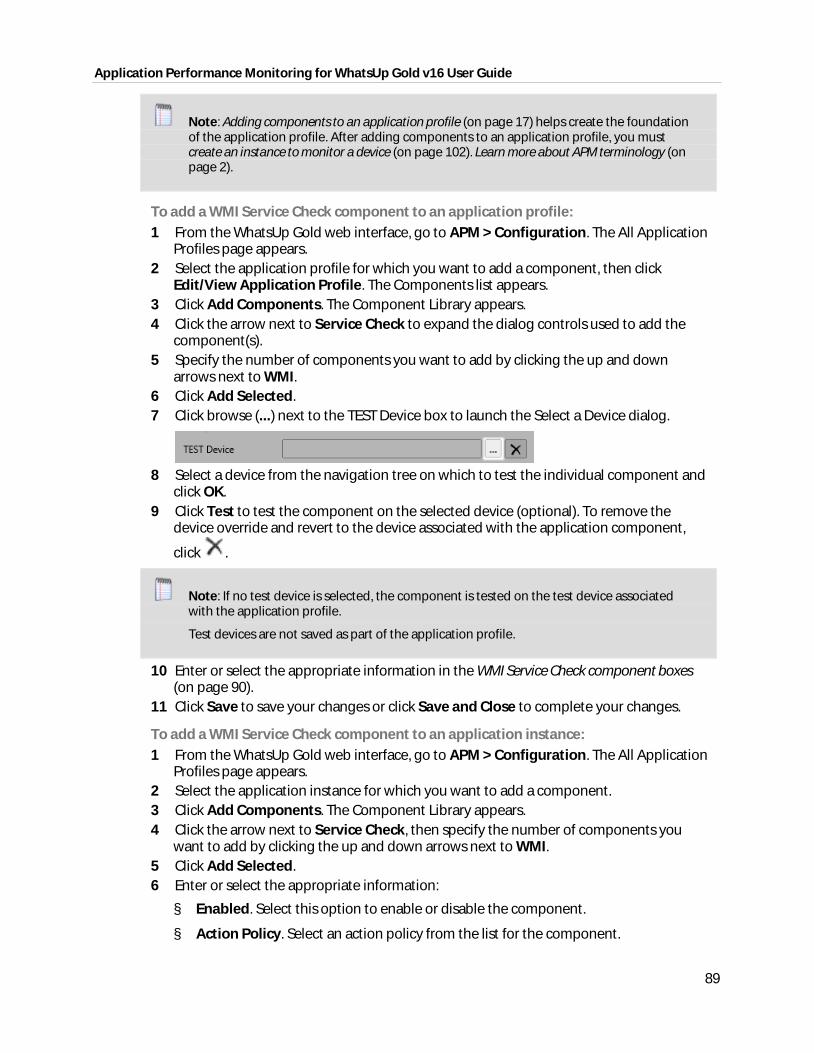
Application Performance Monitoring for WhatsUp Gold v16 User Guide
89
Note: Adding components to an application profile (on page 17) helps create the foundation of the application profile. After adding components to an application profile, you must create an instance to monitor a device (on page 102). Learn more about APM terminology (on page 2).
To add a WMI Service Check component to an application profile: 1 From the WhatsUp Gold web interface, go to APM > Configuration. The All Application
Profiles page appears. 2 Select the application profile for which you want to add a component, then click
Edit/View Application Profile. The Components list appears. 3 Click Add Components. The Component Library appears. 4 Click the arrow next to Service Check to expand the dialog controls used to add the
component(s). 5 Specify the number of components you want to add by clicking the up and down
arrows next to WMI. 6 Click Add Selected. 7 Click browse (...) next to the TEST Device box to launch the Select a Device dialog.
8 Select a device from the navigation tree on which to test the individual component and
click OK. 9 Click Test to test the component on the selected device (optional). To remove the
device override and revert to the device associated with the application component,
click .
Note: If no test device is selected, the component is tested on the test device associated with the application profile.
Test devices are not saved as part of the application profile.
10 Enter or select the appropriate information in the WMI Service Check component boxes (on page 90).
11 Click Save to save your changes or click Save and Close to complete your changes.
To add a WMI Service Check component to an application instance: 1 From the WhatsUp Gold web interface, go to APM > Configuration. The All Application
Profiles page appears. 2 Select the application instance for which you want to add a component. 3 Click Add Components. The Component Library appears. 4 Click the arrow next to Service Check, then specify the number of components you
want to add by clicking the up and down arrows next to WMI. 5 Click Add Selected. 6 Enter or select the appropriate information:
§ Enabled. Select this option to enable or disable the component.
§ Action Policy. Select an action policy from the list for the component.
Application Performance Monitoring for WhatsUp Gold v16 User Guide
90
§ Device Override. (Optional) Override the device associated with the instance and designate a specific device to assign to the component.
§ Click browse (...) next to the Device Override box to launch the Select a Device dialog.
Important: If the device you want to use is configured with a WhatsUp Gold down dependency, make sure that you use a cloned device for this device selection in the Application Performance Monitoring plug-in. For more information, see the Dependencies overview.
§ Select a device from the navigation tree on which to test the individual component and click OK.
§ Click Test to test the component on the selected device.
Note: Click to remove the device override and revert to the device associated with the application instance.
7 Enter or select the appropriate information in the WMI Service Check component boxes (on page 90).
8 Click Save to save your changes or click Save and Close to complete your changes.
WMI Service Check component fields You may configure the following boxes for the WMI Service Check component:
§ Name. Enter a unique name for the component.
§ Description. (Optional) Enter additional information about the component.
§ Critical. Click to select this check box if the component is critical.
Note: Components specified as critical cause the application to go into a down state when the component is out of threshold. Non-critical components cause the application to go into a warning state. For more information on application states, see Working with application states (on page 132).
§ Polling frequency. Select a time (in minutes or hours) you want APM to wait between polls.
§ Service Name. Click browse (...) to bring up the device browser and select the specific device and service you want to monitor.
§ Restart on failure. Select this option to have the monitor attempt to restart the service when it enters a down state.
Adding an SNMP Check component The SNMP Check component allows you to use SNMP credentials to monitor a specific application instance running on a device. You may add an SNMP Check component to an application profile or an application instance.
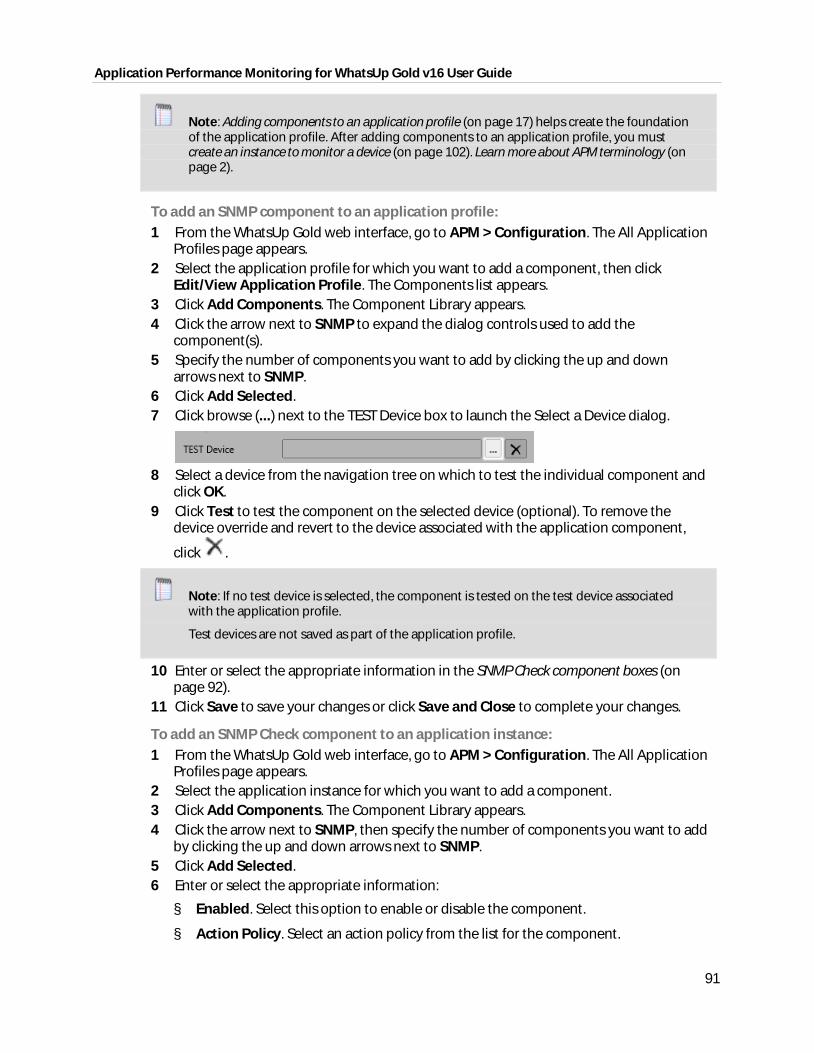
Application Performance Monitoring for WhatsUp Gold v16 User Guide
91
Note: Adding components to an application profile (on page 17) helps create the foundation of the application profile. After adding components to an application profile, you must create an instance to monitor a device (on page 102). Learn more about APM terminology (on page 2).
To add an SNMP component to an application profile: 1 From the WhatsUp Gold web interface, go to APM > Configuration. The All Application
Profiles page appears. 2 Select the application profile for which you want to add a component, then click
Edit/View Application Profile. The Components list appears. 3 Click Add Components. The Component Library appears. 4 Click the arrow next to SNMP to expand the dialog controls used to add the
component(s). 5 Specify the number of components you want to add by clicking the up and down
arrows next to SNMP. 6 Click Add Selected. 7 Click browse (...) next to the TEST Device box to launch the Select a Device dialog.
8 Select a device from the navigation tree on which to test the individual component and
click OK. 9 Click Test to test the component on the selected device (optional). To remove the
device override and revert to the device associated with the application component,
click .
Note: If no test device is selected, the component is tested on the test device associated with the application profile.
Test devices are not saved as part of the application profile.
10 Enter or select the appropriate information in the SNMP Check component boxes (on page 92).
11 Click Save to save your changes or click Save and Close to complete your changes.
To add an SNMP Check component to an application instance: 1 From the WhatsUp Gold web interface, go to APM > Configuration. The All Application
Profiles page appears. 2 Select the application instance for which you want to add a component. 3 Click Add Components. The Component Library appears. 4 Click the arrow next to SNMP, then specify the number of components you want to add
by clicking the up and down arrows next to SNMP. 5 Click Add Selected. 6 Enter or select the appropriate information:
§ Enabled. Select this option to enable or disable the component.
§ Action Policy. Select an action policy from the list for the component.
Application Performance Monitoring for WhatsUp Gold v16 User Guide
92
§ Device Override. (Optional) Override the device associated with the instance and designate a specific device to assign to the component.
§ Click browse (...) next to the Device Override box to launch the Select a Device dialog.
Important: If the device you want to use is configured with a WhatsUp Gold down dependency, make sure that you use a cloned device for this device selection in the Application Performance Monitoring plug-in. For more information, see the Dependencies overview.
§ Select a device from the navigation tree on which to test the individual component and click OK.
§ Click Test to test the component on the selected device.
Note: Click to remove the device override and revert to the device associated with the application instance.
7 Enter or select the appropriate information in the SNMP Check component boxes (on page 92).
8 Click Save to save your changes or click Save and Close to complete your changes.
SNMP Check component fields You may configure the following boxes for the SNMP Check component:
§ Name. Enter a unique name for the component.
§ Description. (Optional) Enter additional information about the component.
§ Critical. Click to select this check box if the component is critical.
Note: Components specified as critical cause the application to go into a down state when the component is out of threshold. Non-critical components cause the application to go into a warning state. For more information on application states, see Working with application states (on page 132).
§ Polling frequency. Select a time (in minutes or hours) you want APM to wait between polls.
§ Performance Counter. The performance counter you would like to monitor.
§ Instance. Click browse (...) to access the SNMP MIB browser and select the specific device, performance counter, and application instance you want to monitor.
§ Use raw value. Select this check box to gauge the current polled value instead of tracking the rate of change over time.
§ Polling timeout. Enter the length of time APM attempts to connect to the selected device. When the time you enter is exceeded without connecting, a timeout occurs and APM stops trying to connect to the device. This is considered a failed connection.
§ Poller retries. Enter the number of times APM attempts to send the command before the device is considered down.
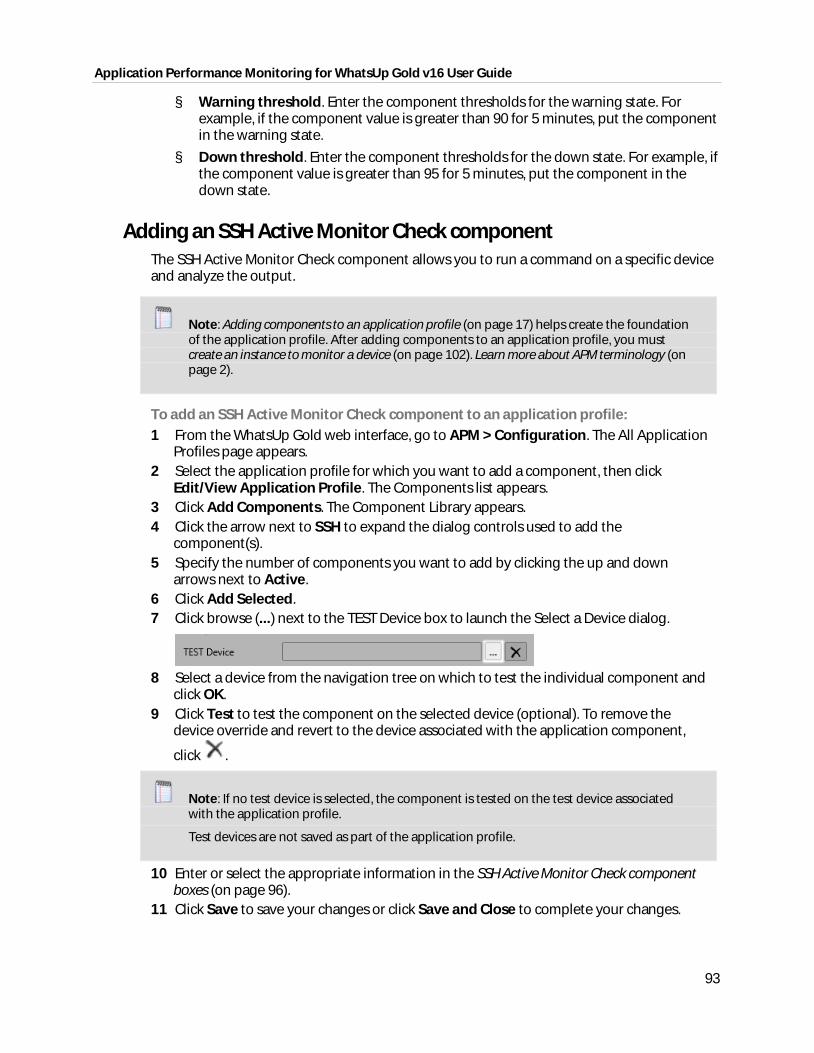
Application Performance Monitoring for WhatsUp Gold v16 User Guide
93
§ Warning threshold. Enter the component thresholds for the warning state. For example, if the component value is greater than 90 for 5 minutes, put the component in the warning state.
§ Down threshold. Enter the component thresholds for the down state. For example, if the component value is greater than 95 for 5 minutes, put the component in the down state.
Adding an SSH Active Monitor Check component The SSH Active Monitor Check component allows you to run a command on a specific device and analyze the output.
Note: Adding components to an application profile (on page 17) helps create the foundation of the application profile. After adding components to an application profile, you must create an instance to monitor a device (on page 102). Learn more about APM terminology (on page 2).
To add an SSH Active Monitor Check component to an application profile: 1 From the WhatsUp Gold web interface, go to APM > Configuration. The All Application
Profiles page appears. 2 Select the application profile for which you want to add a component, then click
Edit/View Application Profile. The Components list appears. 3 Click Add Components. The Component Library appears. 4 Click the arrow next to SSH to expand the dialog controls used to add the
component(s). 5 Specify the number of components you want to add by clicking the up and down
arrows next to Active. 6 Click Add Selected. 7 Click browse (...) next to the TEST Device box to launch the Select a Device dialog.
8 Select a device from the navigation tree on which to test the individual component and
click OK. 9 Click Test to test the component on the selected device (optional). To remove the
device override and revert to the device associated with the application component,
click .
Note: If no test device is selected, the component is tested on the test device associated with the application profile.
Test devices are not saved as part of the application profile.
10 Enter or select the appropriate information in the SSH Active Monitor Check component boxes (on page 96).
11 Click Save to save your changes or click Save and Close to complete your changes.
Application Performance Monitoring for WhatsUp Gold v16 User Guide
94
To add an SSH Active Monitor Check component to an application instance: 1 From the WhatsUp Gold web interface, go to APM > Configuration. The All Application
Profiles page appears. 2 Select the application instance for which you want to add a component. 3 Click Add Components. The Component Library appears. 4 Click the arrow next to SSH, then specify the number of components you want to add
by clicking the up and down arrows next to Active. 5 Click Add Selected. 6 Enter or select the appropriate information:
§ Enabled. Select this option to enable or disable the component.
§ Action Policy. Select an action policy from the list for the component.
§ Device Override. (Optional) Override the device associated with the instance and designate a specific device to assign to the component.
§ Click browse (...) next to the Device Override box to launch the Select a Device dialog.
Important: If the device you want to use is configured with a WhatsUp Gold down dependency, make sure that you use a cloned device for this device selection in the Application Performance Monitoring plug-in. For more information, see the Dependencies overview.
§ Select a device from the navigation tree on which to test the individual component and click OK.
§ Click Test to test the component on the selected device.
Note: Click to remove the device override and revert to the device associated with the application instance.
7 Enter or select the appropriate information in the SSH Active Monitor Check component boxes (on page 96).
8 Click Save to save your changes or click Save and Close to complete your changes.
Adding an SSH Performance Monitor Check component The SSH Performance Monitor Check component allows you to run a command on a specific device and analyze the output. You may add an SSH Performance Monitor Check component to an application profile or an application instance.
Note: Adding components to an application profile (on page 17) helps create the foundation of the application profile. After adding components to an application profile, you must create an instance to monitor a device (on page 102). Learn more about APM terminology (on page 2).
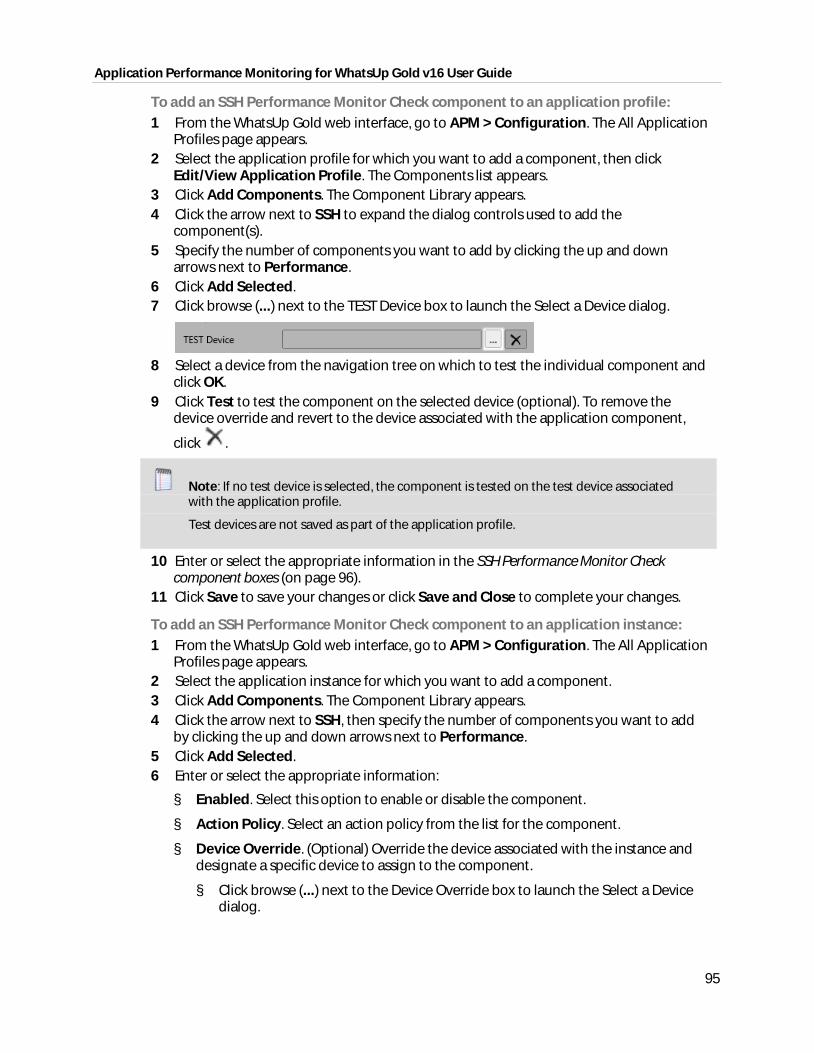
Application Performance Monitoring for WhatsUp Gold v16 User Guide
95
To add an SSH Performance Monitor Check component to an application profile: 1 From the WhatsUp Gold web interface, go to APM > Configuration. The All Application
Profiles page appears. 2 Select the application profile for which you want to add a component, then click
Edit/View Application Profile. The Components list appears. 3 Click Add Components. The Component Library appears. 4 Click the arrow next to SSH to expand the dialog controls used to add the
component(s). 5 Specify the number of components you want to add by clicking the up and down
arrows next to Performance. 6 Click Add Selected. 7 Click browse (...) next to the TEST Device box to launch the Select a Device dialog.
8 Select a device from the navigation tree on which to test the individual component and
click OK. 9 Click Test to test the component on the selected device (optional). To remove the
device override and revert to the device associated with the application component,
click .
Note: If no test device is selected, the component is tested on the test device associated with the application profile.
Test devices are not saved as part of the application profile.
10 Enter or select the appropriate information in the SSH Performance Monitor Check component boxes (on page 96).
11 Click Save to save your changes or click Save and Close to complete your changes.
To add an SSH Performance Monitor Check component to an application instance: 1 From the WhatsUp Gold web interface, go to APM > Configuration. The All Application
Profiles page appears. 2 Select the application instance for which you want to add a component. 3 Click Add Components. The Component Library appears. 4 Click the arrow next to SSH, then specify the number of components you want to add
by clicking the up and down arrows next to Performance. 5 Click Add Selected. 6 Enter or select the appropriate information:
§ Enabled. Select this option to enable or disable the component.
§ Action Policy. Select an action policy from the list for the component.
§ Device Override. (Optional) Override the device associated with the instance and designate a specific device to assign to the component.
§ Click browse (...) next to the Device Override box to launch the Select a Device dialog.
Application Performance Monitoring for WhatsUp Gold v16 User Guide
96
Important: If the device you want to use is configured with a WhatsUp Gold down dependency, make sure that you use a cloned device for this device selection in the Application Performance Monitoring plug-in. For more information, see the Dependencies overview.
§ Select a device from the navigation tree on which to test the individual component and click OK.
§ Click Test to test the component on the selected device.
Note: Click to remove the device override and revert to the device associated with the application instance.
7 Enter or select the appropriate information in the SSH Performance Monitor Check component boxes (on page 96).
8 Click Save to save your changes or click Save and Close to complete your changes.
SSH Performance Monitor Check component fields You may configure the following boxes for the SSH Performance Monitor Check component:
§ Name. Enter a unique name for the component.
§ Description. (Optional) Enter additional information about the component.
§ Critical. Click to select this check box if the component is critical.
Note: Components specified as critical cause the application to go into a down state when the component is out of threshold. Non-critical components cause the application to go into a warning state. For more information on application states, see Working with application states (on page 132).
§ Polling frequency. Select a time (in minutes or hours) you want APM to wait between polls.
§ Command to run. Enter the command to execute on the device. This command can be anything that a device can interpret and run; for example, a basic UNIX command or Perl script.
§ SSH Credential. Select the appropriate SSH credential that APM will use to connect to the remote device.
§ Warning threshold. Enter the component thresholds for the warning state. For example, if the component value is greater than 90 for 5 minutes, put the component in the warning state.
§ Down threshold. Enter the component thresholds for the down state. For example, if the component value is greater than 95 for 5 minutes, put the component in the down state.
SSH Active Monitor Check component fields You may configure the following boxes for the SSH Active Monitor Check component:
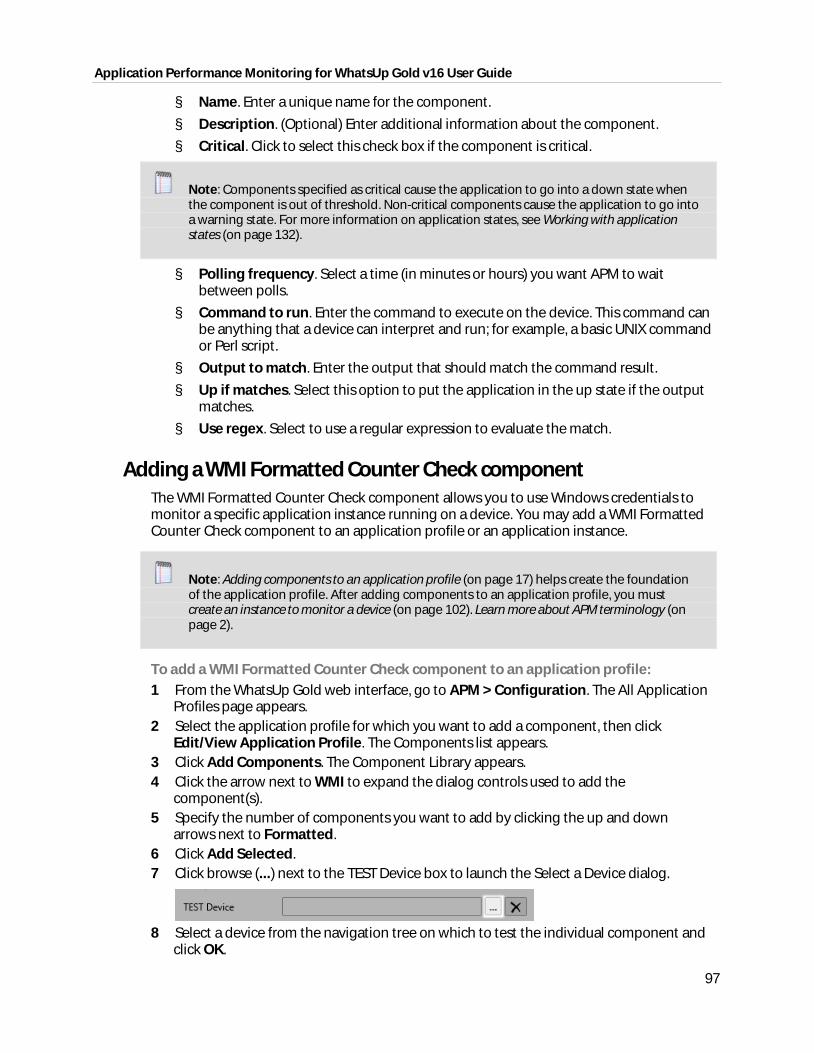
Application Performance Monitoring for WhatsUp Gold v16 User Guide
97
§ Name. Enter a unique name for the component.
§ Description. (Optional) Enter additional information about the component.
§ Critical. Click to select this check box if the component is critical.
Note: Components specified as critical cause the application to go into a down state when the component is out of threshold. Non-critical components cause the application to go into a warning state. For more information on application states, see Working with application states (on page 132).
§ Polling frequency. Select a time (in minutes or hours) you want APM to wait between polls.
§ Command to run. Enter the command to execute on the device. This command can be anything that a device can interpret and run; for example, a basic UNIX command or Perl script.
§ Output to match. Enter the output that should match the command result.
§ Up if matches. Select this option to put the application in the up state if the output matches.
§ Use regex. Select to use a regular expression to evaluate the match.
Adding a WMI Formatted Counter Check component The WMI Formatted Counter Check component allows you to use Windows credentials to monitor a specific application instance running on a device. You may add a WMI Formatted Counter Check component to an application profile or an application instance.
Note: Adding components to an application profile (on page 17) helps create the foundation of the application profile. After adding components to an application profile, you must create an instance to monitor a device (on page 102). Learn more about APM terminology (on page 2).
To add a WMI Formatted Counter Check component to an application profile: 1 From the WhatsUp Gold web interface, go to APM > Configuration. The All Application
Profiles page appears. 2 Select the application profile for which you want to add a component, then click
Edit/View Application Profile. The Components list appears. 3 Click Add Components. The Component Library appears. 4 Click the arrow next to WMI to expand the dialog controls used to add the
component(s). 5 Specify the number of components you want to add by clicking the up and down
arrows next to Formatted. 6 Click Add Selected. 7 Click browse (...) next to the TEST Device box to launch the Select a Device dialog.
8 Select a device from the navigation tree on which to test the individual component and
click OK.
Application Performance Monitoring for WhatsUp Gold v16 User Guide
98
9 Click Test to test the component on the selected device (optional). To remove the device override and revert to the device associated with the application component,
click .
Note: If no test device is selected, the component is tested on the test device associated with the application profile.
Test devices are not saved as part of the application profile.
10 Enter or select the appropriate information in the WMI Formatted Counter Check component boxes (on page 99).
11 Click Save to save your changes or click Save and Close to complete your changes.
To add a WMI Formatted Counter Check component to an application instance: 1 From the WhatsUp Gold web interface, go to APM > Configuration. The All Application
Profiles page appears. 2 Select the application instance for which you want to add a component. 3 Click Add Components. The Component Library appears. 4 Click the arrow next to WMI, then specify the number of components you want to add
by clicking the up and down arrows next to Formatted. 5 Click Add Selected. 6 Enter or select the appropriate information:
§ Enabled. Select this option to enable or disable the component.
§ Action Policy. Select an action policy from the list for the component.
§ Device Override. (Optional) Override the device associated with the instance and designate a specific device to assign to the component.
§ Click browse (...) next to the Device Override box to launch the Select a Device dialog.
Important: If the device you want to use is configured with a WhatsUp Gold down dependency, make sure that you use a cloned device for this device selection in the Application Performance Monitoring plug-in. For more information, see the Dependencies overview.
§ Select a device from the navigation tree on which to test the individual component and click OK.
§ Click Test to test the component on the selected device.
Note: Click to remove the device override and revert to the device associated with the application instance.
7 Enter or select the appropriate information in the WMI Formatted Counter Check component boxes (on page 99).
8 Click Save to save your changes or click Save and Close to complete your changes.
Application Performance Monitoring for WhatsUp Gold v16 User Guide
99
WMI Formatted Counter Check component fields You may configure the following boxes for the WMI Formatted Counter Check component:
§ Name. Enter a unique name for the component.
§ Description. (Optional) Enter additional information about the component.
§ Critical. Click to select this check box if the component is critical.
Note: Components specified as critical cause the application to go into a down state when the component is out of threshold. Non-critical components cause the application to go into a warning state. For more information on application states, see Working with application states (on page 132).
§ Polling frequency. Select a time (in minutes or hours) you want APM to wait between polls.
§ Performance Counter. The performance counter you would like to monitor.
§ Instance. Click browse (...) to access the SNMP MIB browser and select the specific device, performance counter, and application instance you want to monitor.
§ Polling timeout. Enter the length of time APM attempts to connect to the selected device. When the time you enter is exceeded without connecting, a timeout occurs and APM stops trying to connect to the device. This is considered a failed connection.
§ Warning threshold. Enter the component thresholds for the warning state. For example, if the component value is greater than 90 for 5 minutes, put the component in the warning state.
§ Down threshold. Enter the component thresholds for the down state. For example, if the component value is greater than 95 for 5 minutes, put the component in the down state.
Adding a WMI Raw Counter Check component The WMI Raw Counter Check component allows you to use Windows credentials to monitor a specific application instance running on a device. You may add a WMI Raw Counter Check component to an application profile or an application instance.
Note: Adding components to an application profile (on page 17) helps create the foundation of the application profile. After adding components to an application profile, you must create an instance to monitor a device (on page 102). Learn more about APM terminology (on page 2).
To add a WMI Raw Counter Check component to an application profile: 1 From the WhatsUp Gold web interface, go to APM > Configuration. The All Application
Profiles page appears. 2 Select the application profile for which you want to add a component, then click
Edit/View Application Profile. The Components list appears. 3 Click Add Components. The Component Library appears. 4 Click the arrow next to WMI to expand the dialog controls used to add the
component(s).
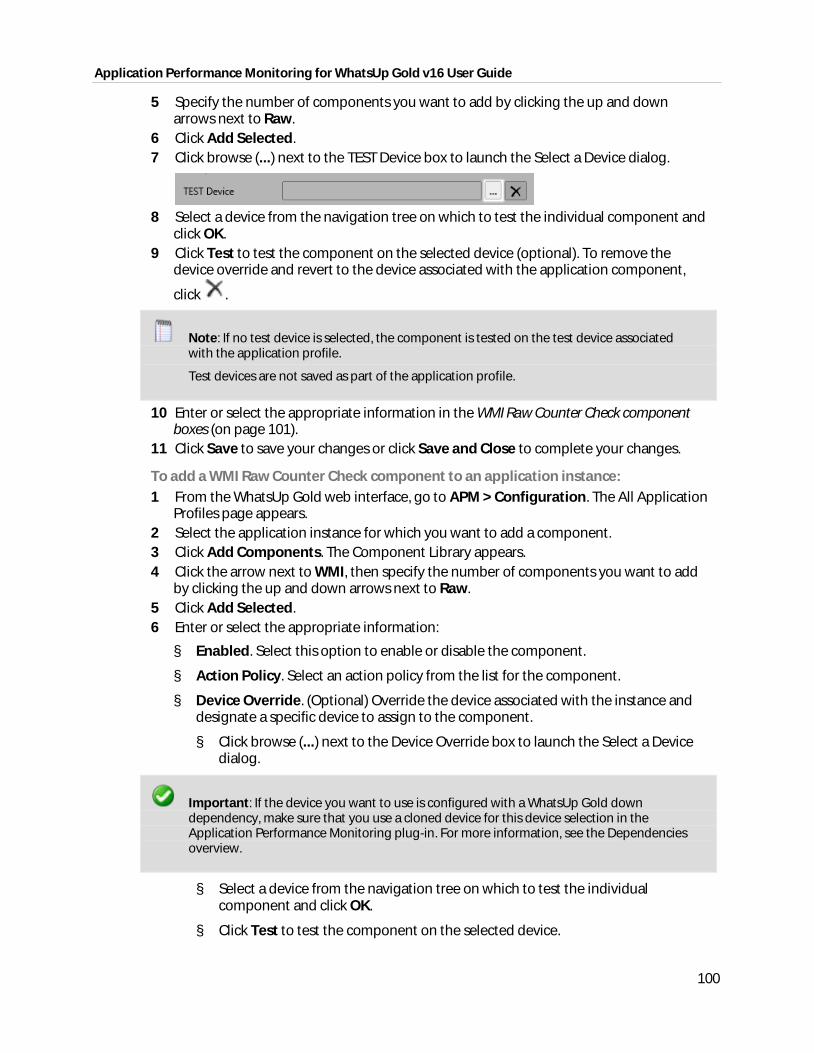
Application Performance Monitoring for WhatsUp Gold v16 User Guide
100
5 Specify the number of components you want to add by clicking the up and down arrows next to Raw.
6 Click Add Selected. 7 Click browse (...) next to the TEST Device box to launch the Select a Device dialog.
8 Select a device from the navigation tree on which to test the individual component and
click OK. 9 Click Test to test the component on the selected device (optional). To remove the
device override and revert to the device associated with the application component,
click .
Note: If no test device is selected, the component is tested on the test device associated with the application profile.
Test devices are not saved as part of the application profile.
10 Enter or select the appropriate information in the WMI Raw Counter Check component boxes (on page 101).
11 Click Save to save your changes or click Save and Close to complete your changes.
To add a WMI Raw Counter Check component to an application instance: 1 From the WhatsUp Gold web interface, go to APM > Configuration. The All Application
Profiles page appears. 2 Select the application instance for which you want to add a component. 3 Click Add Components. The Component Library appears. 4 Click the arrow next to WMI, then specify the number of components you want to add
by clicking the up and down arrows next to Raw. 5 Click Add Selected. 6 Enter or select the appropriate information:
§ Enabled. Select this option to enable or disable the component.
§ Action Policy. Select an action policy from the list for the component.
§ Device Override. (Optional) Override the device associated with the instance and designate a specific device to assign to the component.
§ Click browse (...) next to the Device Override box to launch the Select a Device dialog.
Important: If the device you want to use is configured with a WhatsUp Gold down dependency, make sure that you use a cloned device for this device selection in the Application Performance Monitoring plug-in. For more information, see the Dependencies overview.
§ Select a device from the navigation tree on which to test the individual component and click OK.
§ Click Test to test the component on the selected device.
Application Performance Monitoring for WhatsUp Gold v16 User Guide
101
Note: Click to remove the device override and revert to the device associated with the application instance.
7 Enter or select the appropriate information in the WMI Raw Counter Check component boxes (on page 101).
8 Click Save to save your changes or click Save and Close to complete your changes.
WMI Raw Counter Check component fields You may configure the following boxes for the WMI Raw Counter Check component:
§ Name. Enter a unique name for the component.
§ Description. (Optional) Enter additional information about the component.
§ Critical. Click to select this check box if the component is critical.
Note: Components specified as critical cause the application to go into a down state when the component is out of threshold. Non-critical components cause the application to go into a warning state. For more information on application states, see Working with application states (on page 132).
§ Polling frequency. Select a time (in minutes or hours) you want APM to wait between polls.
§ Performance Counter. The performance counter you would like to monitor.
§ Instance. Click browse (...) to access the SNMP MIB browser and select the specific device, performance counter, and application instance you want to monitor.
§ Polling timeout. Enter the length of time APM attempts to connect to the selected device. When the time you enter is exceeded without connecting, a timeout occurs and APM stops trying to connect to the device. This is considered a failed connection.
§ Warning threshold. Enter the component thresholds for the warning state. For example, if the component value is greater than 90 for 5 minutes, put the component in the warning state.
§ Down threshold. Enter the component thresholds for the down state. For example, if the component value is greater than 95 for 5 minutes, put the component in the down state.
Working with application instances
Application Performance Monitoring (APM) allows you to create an instance or multiple instances (on page 102) to monitor your applications. Each instance is created from an application profile (on page 15) and inherits the components associated with that profile. Inherited components (on page 103) are linked to the application profile. This means that any changes to the application profile result in the associated application instance(s) being changed as well.
For example, if you create an application instance called "My Device". This application instance is created using an application profile containing the following components:
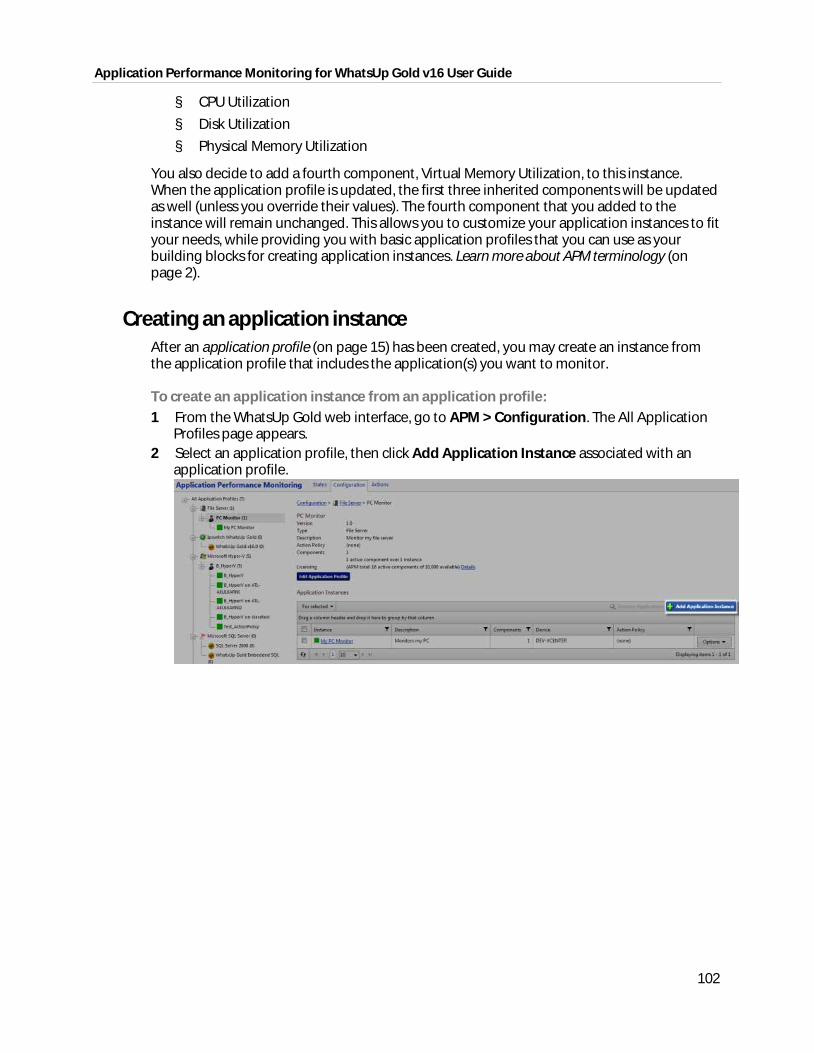
Application Performance Monitoring for WhatsUp Gold v16 User Guide
102
§ CPU Utilization
§ Disk Utilization
§ Physical Memory Utilization
You also decide to add a fourth component, Virtual Memory Utilization, to this instance. When the application profile is updated, the first three inherited components will be updated as well (unless you override their values). The fourth component that you added to the instance will remain unchanged. This allows you to customize your application instances to fit your needs, while providing you with basic application profiles that you can use as your building blocks for creating application instances. Learn more about APM terminology (on page 2).
Creating an application instance After an application profile (on page 15) has been created, you may create an instance from the application profile that includes the application(s) you want to monitor.
To create an application instance from an application profile: 1 From the WhatsUp Gold web interface, go to APM > Configuration. The All Application
Profiles page appears. 2 Select an application profile, then click Add Application Instance associated with an
application profile.
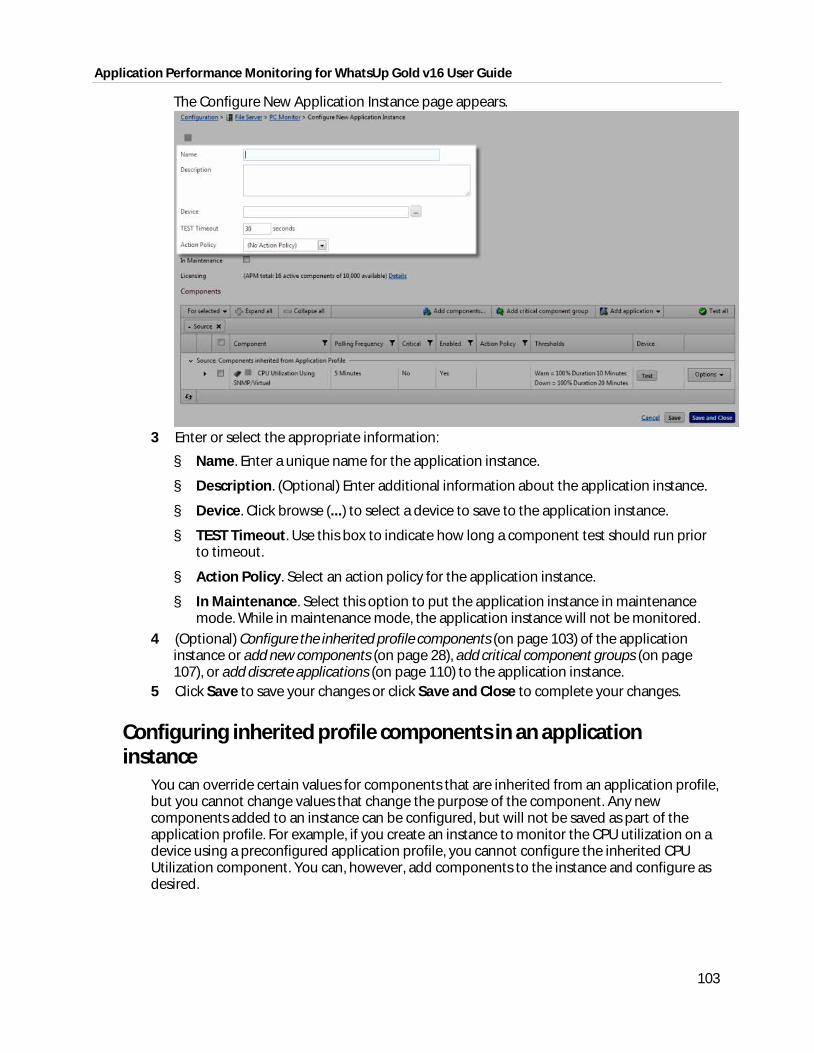
Application Performance Monitoring for WhatsUp Gold v16 User Guide
103
The Configure New Application Instance page appears.
3 Enter or select the appropriate information:
§ Name. Enter a unique name for the application instance.
§ Description. (Optional) Enter additional information about the application instance.
§ Device. Click browse (...) to select a device to save to the application instance.
§ TEST Timeout. Use this box to indicate how long a component test should run prior to timeout.
§ Action Policy. Select an action policy for the application instance.
§ In Maintenance. Select this option to put the application instance in maintenance mode. While in maintenance mode, the application instance will not be monitored.
4 (Optional) Configure the inherited profile components (on page 103) of the application instance or add new components (on page 28), add critical component groups (on page 107), or add discrete applications (on page 110) to the application instance.
5 Click Save to save your changes or click Save and Close to complete your changes.
Configuring inherited profile components in an application instance
You can override certain values for components that are inherited from an application profile, but you cannot change values that change the purpose of the component. Any new components added to an instance can be configured, but will not be saved as part of the application profile. For example, if you create an instance to monitor the CPU utilization on a device using a preconfigured application profile, you cannot configure the inherited CPU Utilization component. You can, however, add components to the instance and configure as desired.
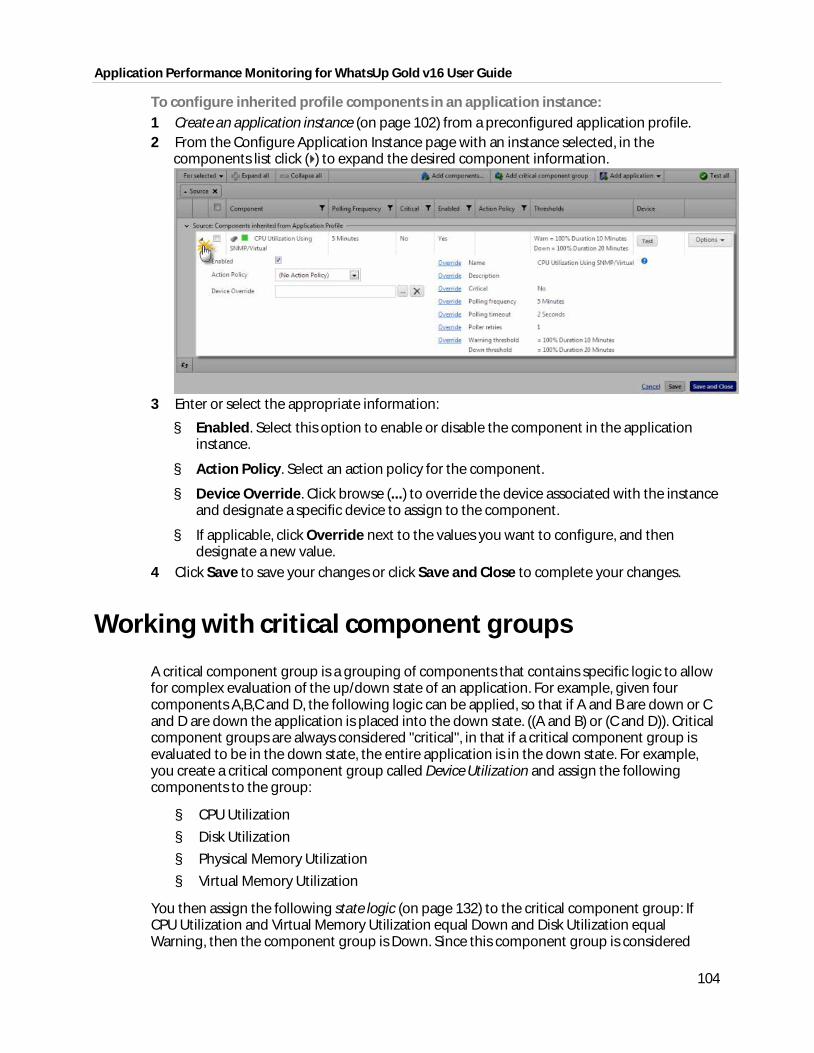
Application Performance Monitoring for WhatsUp Gold v16 User Guide
104
To configure inherited profile components in an application instance: 1 Create an application instance (on page 102) from a preconfigured application profile. 2 From the Configure Application Instance page with an instance selected, in the
components list click ( ) to expand the desired component information.
3 Enter or select the appropriate information:
§ Enabled. Select this option to enable or disable the component in the application instance.
§ Action Policy. Select an action policy for the component.
§ Device Override. Click browse (...) to override the device associated with the instance and designate a specific device to assign to the component.
§ If applicable, click Override next to the values you want to configure, and then designate a new value.
4 Click Save to save your changes or click Save and Close to complete your changes.
Working with critical component groups
A critical component group is a grouping of components that contains specific logic to allow for complex evaluation of the up/down state of an application. For example, given four components A,B,C and D, the following logic can be applied, so that if A and B are down or C and D are down the application is placed into the down state. ((A and B) or (C and D)). Critical component groups are always considered "critical", in that if a critical component group is evaluated to be in the down state, the entire application is in the down state. For example, you create a critical component group called Device Utilization and assign the following components to the group:
§ CPU Utilization
§ Disk Utilization
§ Physical Memory Utilization
§ Virtual Memory Utilization
You then assign the following state logic (on page 132) to the critical component group: If CPU Utilization and Virtual Memory Utilization equal Down and Disk Utilization equal Warning, then the component group is Down. Since this component group is considered
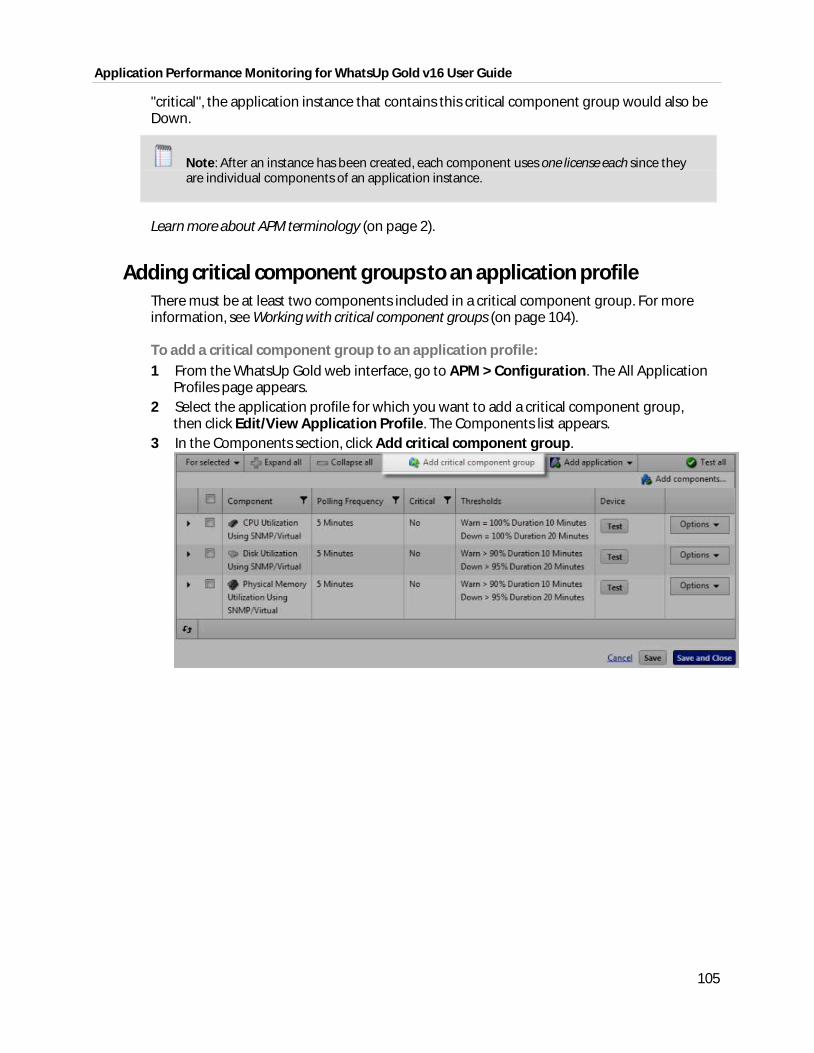
Application Performance Monitoring for WhatsUp Gold v16 User Guide
105
"critical", the application instance that contains this critical component group would also be Down.
Note: After an instance has been created, each component uses one license each since they are individual components of an application instance.
Learn more about APM terminology (on page 2).
Adding critical component groups to an application profile There must be at least two components included in a critical component group. For more information, see Working with critical component groups (on page 104).
To add a critical component group to an application profile: 1 From the WhatsUp Gold web interface, go to APM > Configuration. The All Application
Profiles page appears. 2 Select the application profile for which you want to add a critical component group,
then click Edit/View Application Profile. The Components list appears. 3 In the Components section, click Add critical component group.
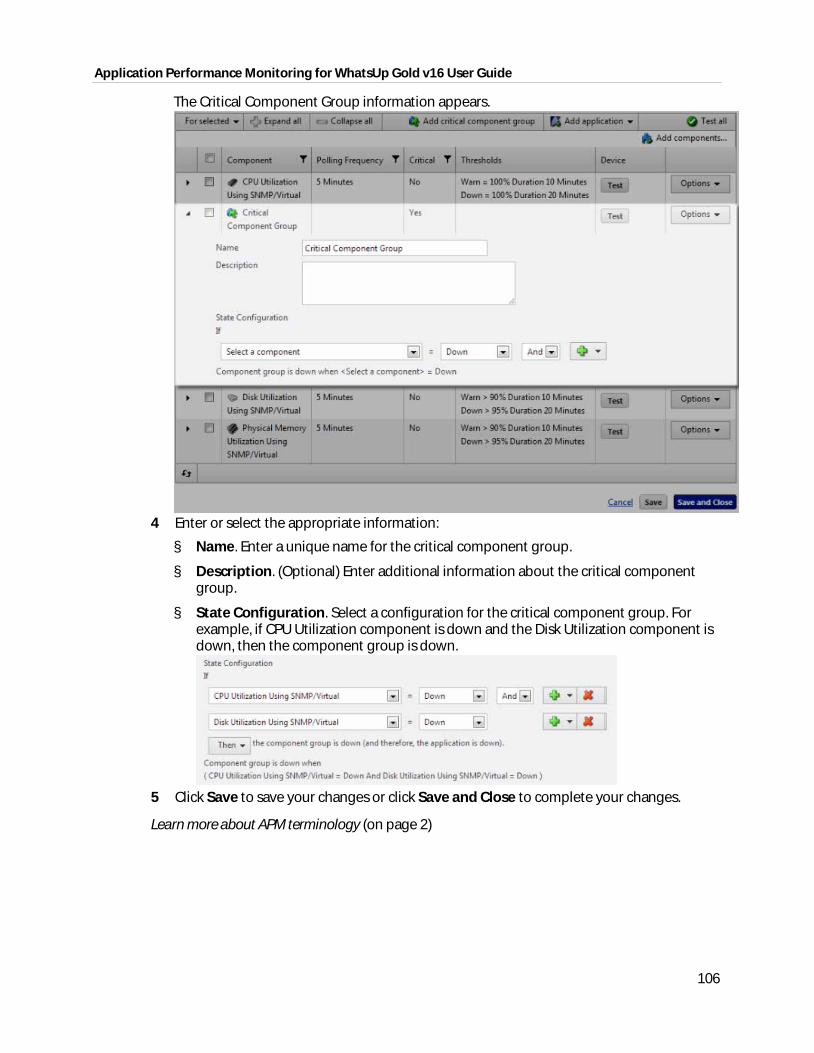
Application Performance Monitoring for WhatsUp Gold v16 User Guide
106
The Critical Component Group information appears.
4 Enter or select the appropriate information:
§ Name. Enter a unique name for the critical component group.
§ Description. (Optional) Enter additional information about the critical component group.
§ State Configuration. Select a configuration for the critical component group. For example, if CPU Utilization component is down and the Disk Utilization component is down, then the component group is down.
5 Click Save to save your changes or click Save and Close to complete your changes.
Learn more about APM terminology (on page 2)
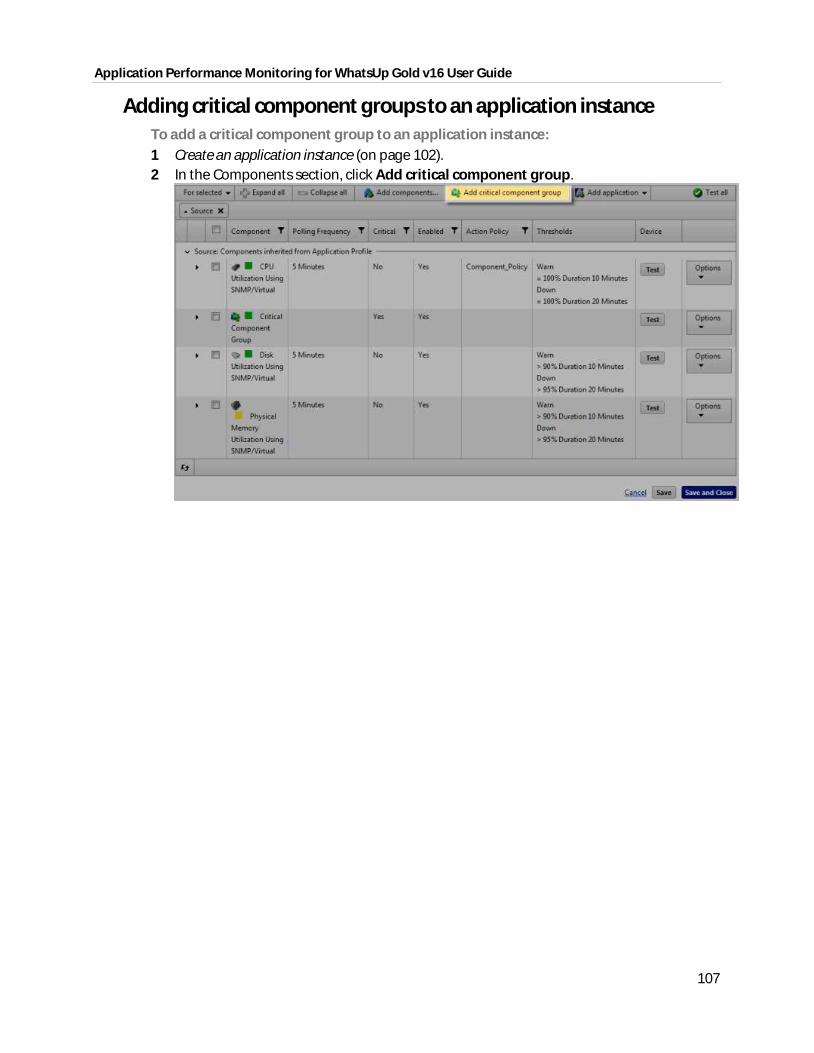
Application Performance Monitoring for WhatsUp Gold v16 User Guide
107
Adding critical component groups to an application instance To add a critical component group to an application instance: 1 Create an application instance (on page 102). 2 In the Components section, click Add critical component group.
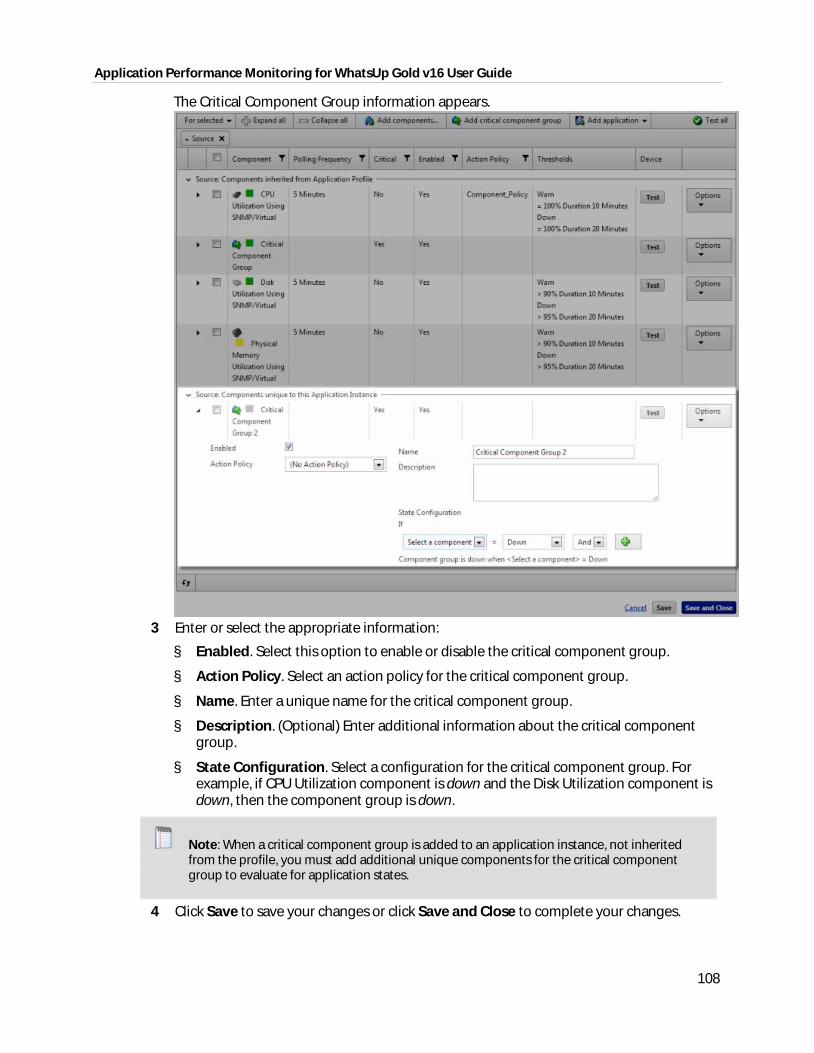
Application Performance Monitoring for WhatsUp Gold v16 User Guide
108
The Critical Component Group information appears.
3 Enter or select the appropriate information:
§ Enabled. Select this option to enable or disable the critical component group.
§ Action Policy. Select an action policy for the critical component group.
§ Name. Enter a unique name for the critical component group.
§ Description. (Optional) Enter additional information about the critical component group.
§ State Configuration. Select a configuration for the critical component group. For example, if CPU Utilization component is down and the Disk Utilization component is down, then the component group is down.
Note: When a critical component group is added to an application instance, not inherited from the profile, you must add additional unique components for the critical component group to evaluate for application states.
4 Click Save to save your changes or click Save and Close to complete your changes.
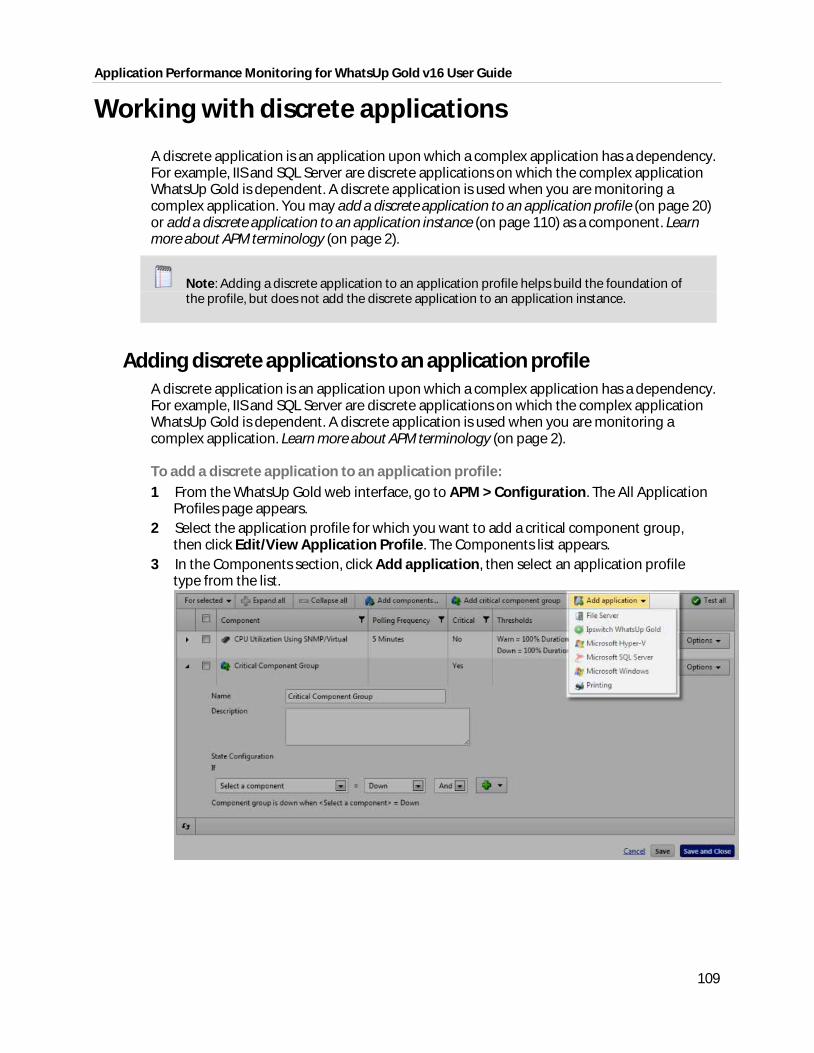
Application Performance Monitoring for WhatsUp Gold v16 User Guide
109
Working with discrete applications
A discrete application is an application upon which a complex application has a dependency. For example, IIS and SQL Server are discrete applications on which the complex application WhatsUp Gold is dependent. A discrete application is used when you are monitoring a complex application. You may add a discrete application to an application profile (on page 20) or add a discrete application to an application instance (on page 110) as a component. Learn more about APM terminology (on page 2).
Note: Adding a discrete application to an application profile helps build the foundation of the profile, but does not add the discrete application to an application instance.
Adding discrete applications to an application profile A discrete application is an application upon which a complex application has a dependency. For example, IIS and SQL Server are discrete applications on which the complex application WhatsUp Gold is dependent. A discrete application is used when you are monitoring a complex application. Learn more about APM terminology (on page 2).
To add a discrete application to an application profile: 1 From the WhatsUp Gold web interface, go to APM > Configuration. The All Application
Profiles page appears. 2 Select the application profile for which you want to add a critical component group,
then click Edit/View Application Profile. The Components list appears. 3 In the Components section, click Add application, then select an application profile
type from the list.
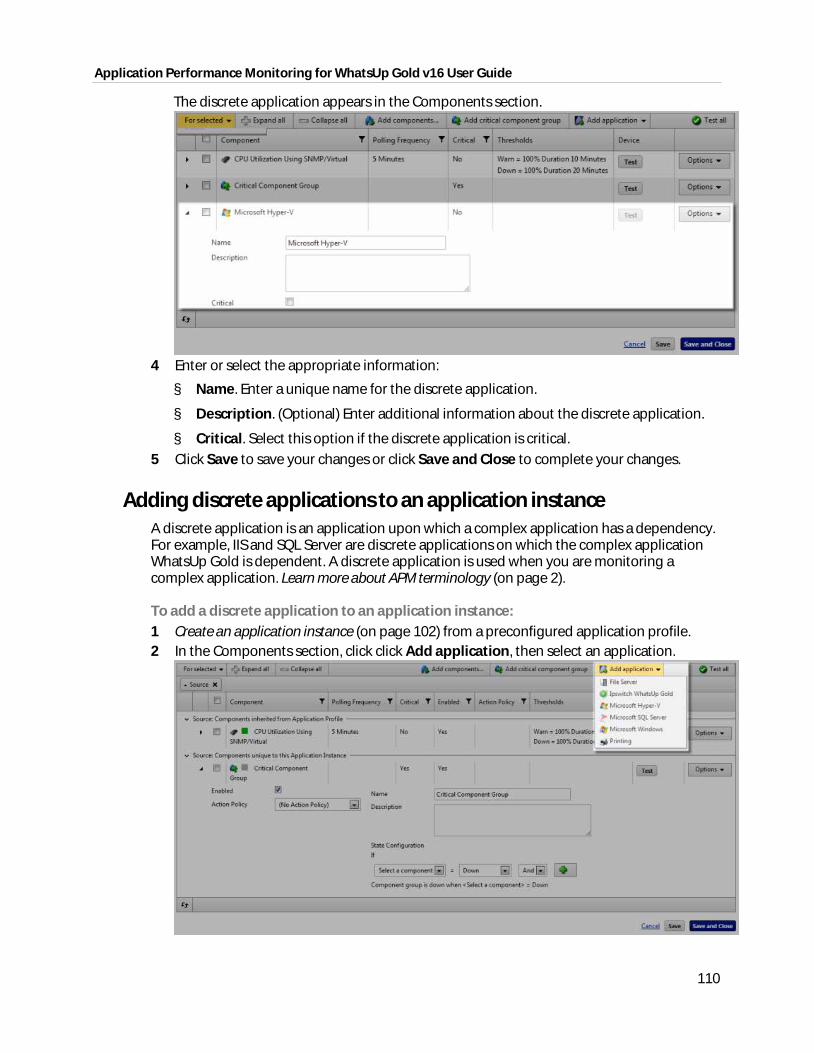
Application Performance Monitoring for WhatsUp Gold v16 User Guide
110
The discrete application appears in the Components section.
4 Enter or select the appropriate information:
§ Name. Enter a unique name for the discrete application.
§ Description. (Optional) Enter additional information about the discrete application.
§ Critical. Select this option if the discrete application is critical. 5 Click Save to save your changes or click Save and Close to complete your changes.
Adding discrete applications to an application instance A discrete application is an application upon which a complex application has a dependency. For example, IIS and SQL Server are discrete applications on which the complex application WhatsUp Gold is dependent. A discrete application is used when you are monitoring a complex application. Learn more about APM terminology (on page 2).
To add a discrete application to an application instance: 1 Create an application instance (on page 102) from a preconfigured application profile. 2 In the Components section, click click Add application, then select an application.
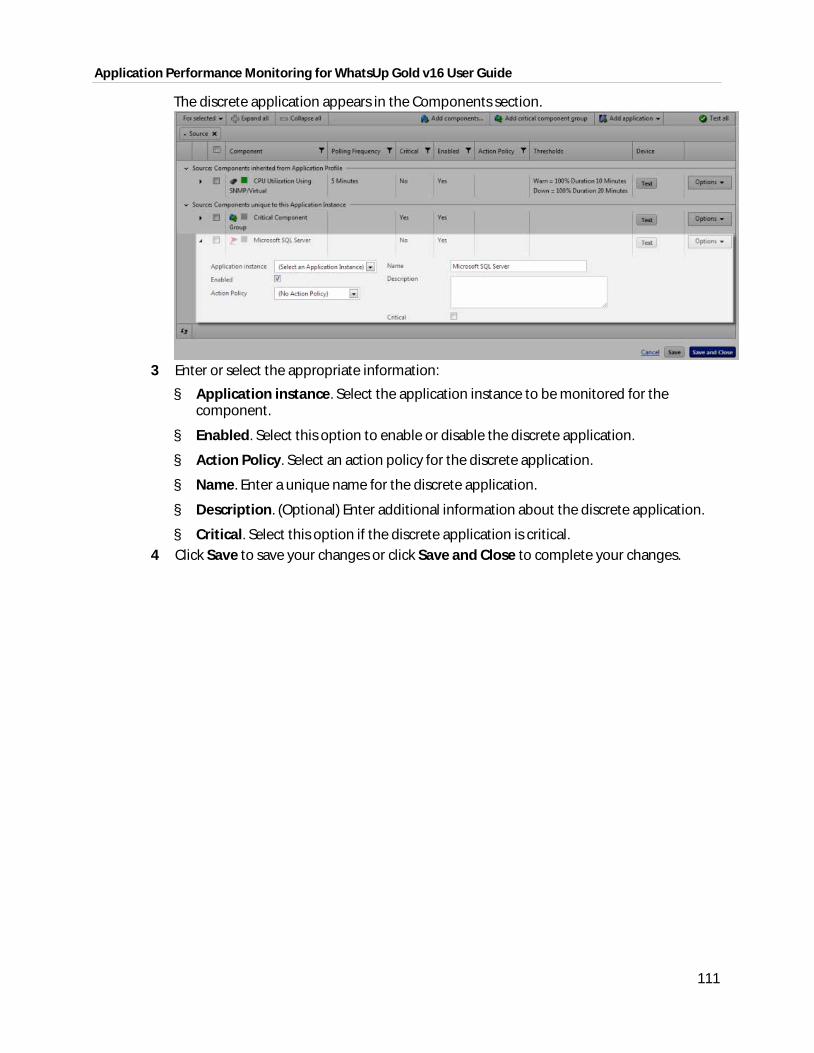
Application Performance Monitoring for WhatsUp Gold v16 User Guide
111
The discrete application appears in the Components section.
3 Enter or select the appropriate information:
§ Application instance. Select the application instance to be monitored for the component.
§ Enabled. Select this option to enable or disable the discrete application.
§ Action Policy. Select an action policy for the discrete application.
§ Name. Enter a unique name for the discrete application.
§ Description. (Optional) Enter additional information about the discrete application.
§ Critical. Select this option if the discrete application is critical. 4 Click Save to save your changes or click Save and Close to complete your changes.
112
CHAPTER 4
APM actions
In This Chapter
Working with action policies in APM ......................................................... 112
Creating an action policy in APM ................................................................ 113
Managing Action Policies .............................................................................. 116
Assigning an action policy to an APM instance or component ....... 116
Working with actions in APM ....................................................................... 118
Working with blackout policies in APM .................................................... 130
Working with application states ................................................................. 132
Working with action policies in APM
Application Performance Monitoring (APM) allows you to configure action policies that can be applied to application instances and components that you are monitoring with APM.
An action policy determines actions to take when an application instance or component transitions from one state to another. The transition to states are up, down, warning, and maintenance. You must create one or more actions before creating an action policy. You may also apply a blackout policy to the action policy. The blackout policy determines when to apply the action policy and when it should be ignored due to routine activities, such as maintenance periods.
Important: All applications and systems monitored with Application Performance Monitoring must have their system clocks synced so that Action Policies and Actions work correctly according to the settings and scheduled actions.
To access the action policies feature in the WhatsUp Gold web interface, go to APM > Actions Management > Action Policies.
Use the APM Action Policies page to configure new or existing policies.
§ Click Add Action Policy to configure a new action policy.
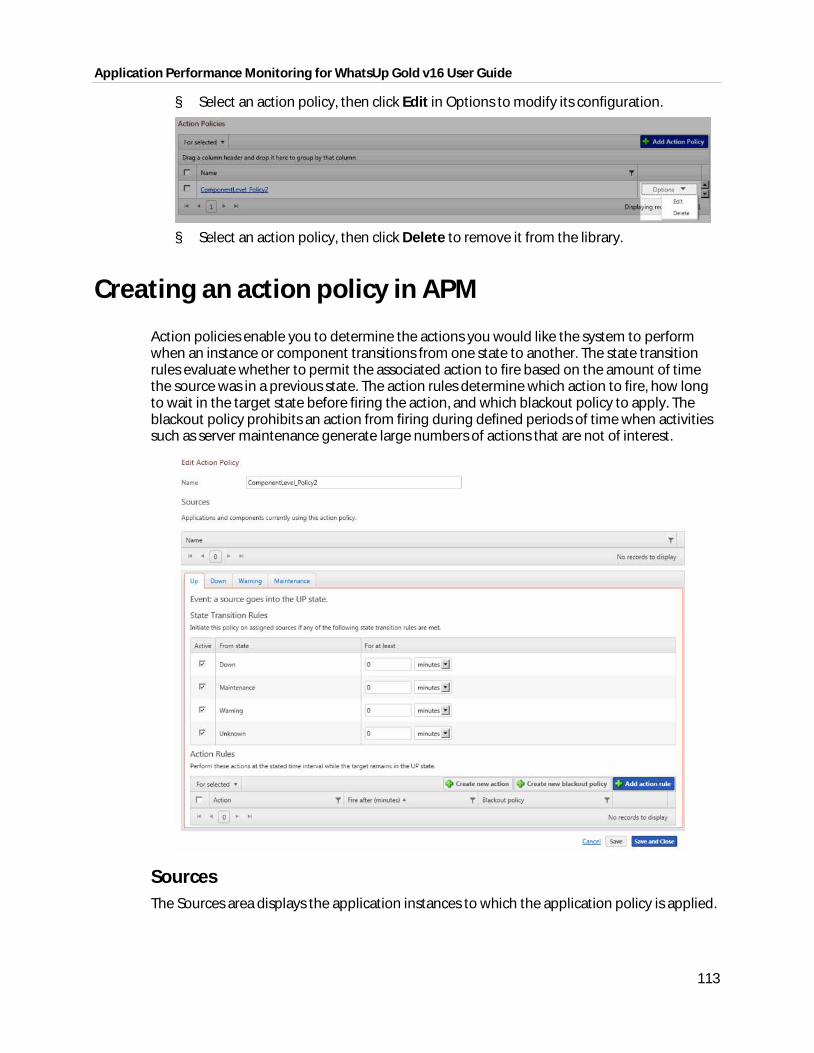
Application Performance Monitoring for WhatsUp Gold v16 User Guide
113
§ Select an action policy, then click Edit in Options to modify its configuration.
§ Select an action policy, then click Delete to remove it from the library.
Creating an action policy in APM
Action policies enable you to determine the actions you would like the system to perform when an instance or component transitions from one state to another. The state transition rules evaluate whether to permit the associated action to fire based on the amount of time the source was in a previous state. The action rules determine which action to fire, how long to wait in the target state before firing the action, and which blackout policy to apply. The blackout policy prohibits an action from firing during defined periods of time when activities such as server maintenance generate large numbers of actions that are not of interest.
Sources The Sources area displays the application instances to which the application policy is applied.
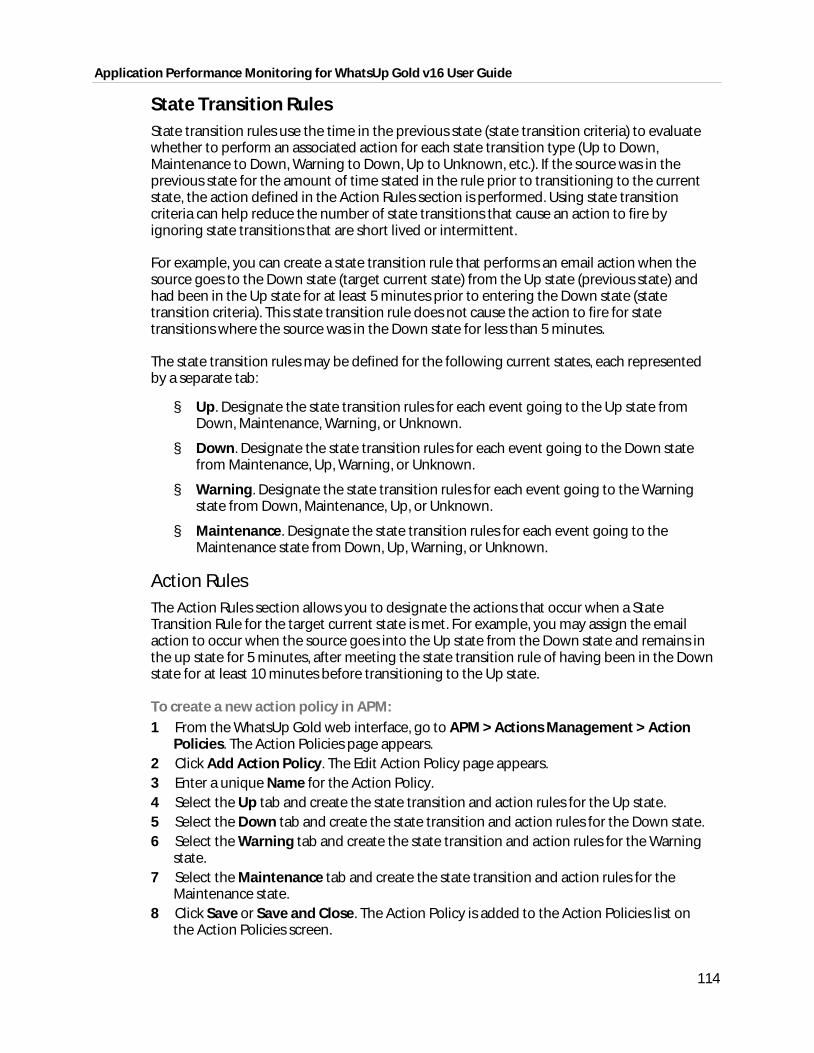
Application Performance Monitoring for WhatsUp Gold v16 User Guide
114
State Transition Rules State transition rules use the time in the previous state (state transition criteria) to evaluate whether to perform an associated action for each state transition type (Up to Down, Maintenance to Down, Warning to Down, Up to Unknown, etc.). If the source was in the previous state for the amount of time stated in the rule prior to transitioning to the current state, the action defined in the Action Rules section is performed. Using state transition criteria can help reduce the number of state transitions that cause an action to fire by ignoring state transitions that are short lived or intermittent.
For example, you can create a state transition rule that performs an email action when the source goes to the Down state (target current state) from the Up state (previous state) and had been in the Up state for at least 5 minutes prior to entering the Down state (state transition criteria). This state transition rule does not cause the action to fire for state transitions where the source was in the Down state for less than 5 minutes.
The state transition rules may be defined for the following current states, each represented by a separate tab:
§ Up. Designate the state transition rules for each event going to the Up state from Down, Maintenance, Warning, or Unknown.
§ Down. Designate the state transition rules for each event going to the Down state from Maintenance, Up, Warning, or Unknown.
§ Warning. Designate the state transition rules for each event going to the Warning state from Down, Maintenance, Up, or Unknown.
§ Maintenance. Designate the state transition rules for each event going to the Maintenance state from Down, Up, Warning, or Unknown.
Action Rules The Action Rules section allows you to designate the actions that occur when a State Transition Rule for the target current state is met. For example, you may assign the email action to occur when the source goes into the Up state from the Down state and remains in the up state for 5 minutes, after meeting the state transition rule of having been in the Down state for at least 10 minutes before transitioning to the Up state.
To create a new action policy in APM: 1 From the WhatsUp Gold web interface, go to APM > Actions Management > Action
Policies. The Action Policies page appears. 2 Click Add Action Policy. The Edit Action Policy page appears. 3 Enter a unique Name for the Action Policy. 4 Select the Up tab and create the state transition and action rules for the Up state. 5 Select the Down tab and create the state transition and action rules for the Down state. 6 Select the Warning tab and create the state transition and action rules for the Warning
state. 7 Select the Maintenance tab and create the state transition and action rules for the
Maintenance state. 8 Click Save or Save and Close. The Action Policy is added to the Action Policies list on
the Action Policies screen.
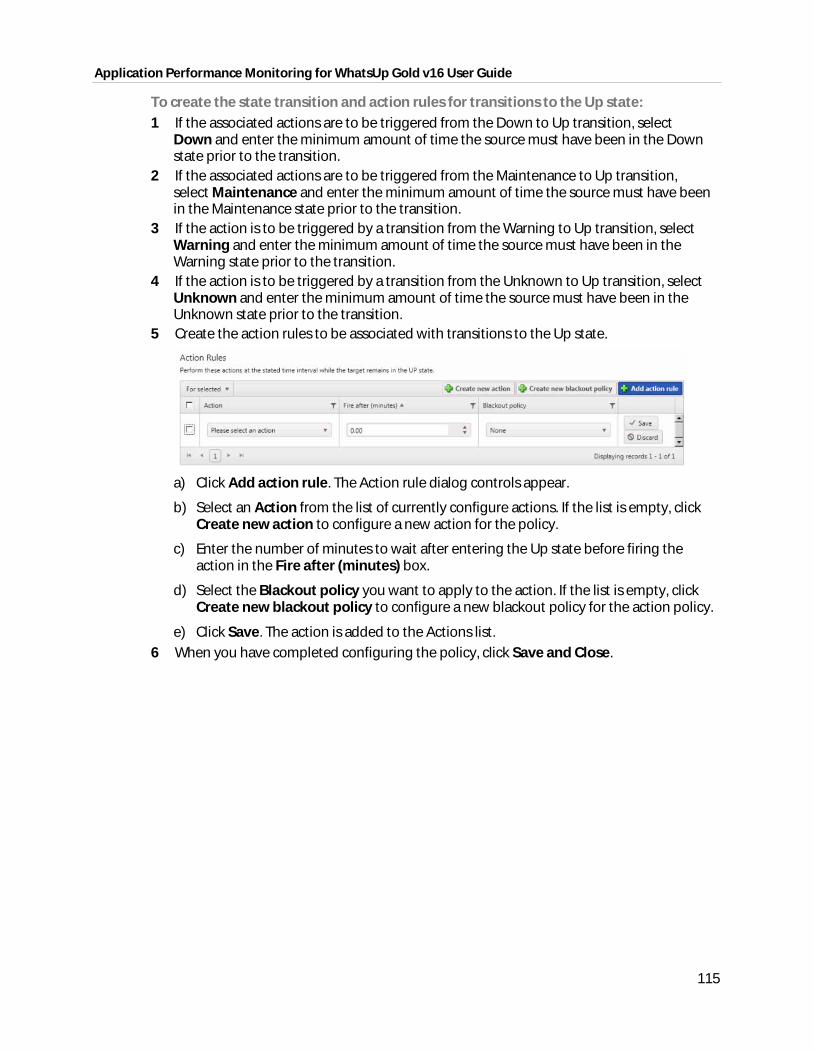
Application Performance Monitoring for WhatsUp Gold v16 User Guide
115
To create the state transition and action rules for transitions to the Up state: 1 If the associated actions are to be triggered from the Down to Up transition, select
Down and enter the minimum amount of time the source must have been in the Down state prior to the transition.
2 If the associated actions are to be triggered from the Maintenance to Up transition, select Maintenance and enter the minimum amount of time the source must have been in the Maintenance state prior to the transition.
3 If the action is to be triggered by a transition from the Warning to Up transition, select Warning and enter the minimum amount of time the source must have been in the Warning state prior to the transition.
4 If the action is to be triggered by a transition from the Unknown to Up transition, select Unknown and enter the minimum amount of time the source must have been in the Unknown state prior to the transition.
5 Create the action rules to be associated with transitions to the Up state.
a) Click Add action rule. The Action rule dialog controls appear.
b) Select an Action from the list of currently configure actions. If the list is empty, click Create new action to configure a new action for the policy.
c) Enter the number of minutes to wait after entering the Up state before firing the action in the Fire after (minutes) box.
d) Select the Blackout policy you want to apply to the action. If the list is empty, click Create new blackout policy to configure a new blackout policy for the action policy.
e) Click Save. The action is added to the Actions list. 6 When you have completed configuring the policy, click Save and Close.
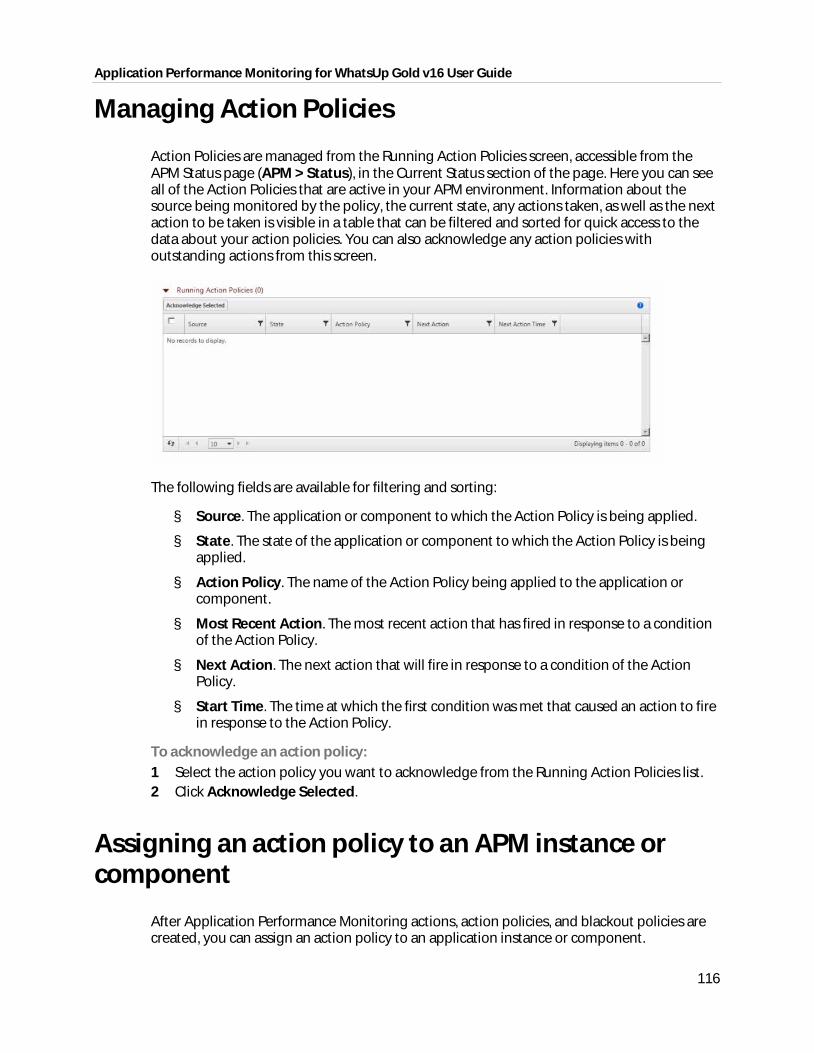
Application Performance Monitoring for WhatsUp Gold v16 User Guide
116
Managing Action Policies
Action Policies are managed from the Running Action Policies screen, accessible from the APM Status page (APM > Status), in the Current Status section of the page. Here you can see all of the Action Policies that are active in your APM environment. Information about the source being monitored by the policy, the current state, any actions taken, as well as the next action to be taken is visible in a table that can be filtered and sorted for quick access to the data about your action policies. You can also acknowledge any action policies with outstanding actions from this screen.
The following fields are available for filtering and sorting:
§ Source. The application or component to which the Action Policy is being applied.
§ State. The state of the application or component to which the Action Policy is being applied.
§ Action Policy. The name of the Action Policy being applied to the application or component.
§ Most Recent Action. The most recent action that has fired in response to a condition of the Action Policy.
§ Next Action. The next action that will fire in response to a condition of the Action Policy.
§ Start Time. The time at which the first condition was met that caused an action to fire in response to the Action Policy.
To acknowledge an action policy: 1 Select the action policy you want to acknowledge from the Running Action Policies list. 2 Click Acknowledge Selected.
Assigning an action policy to an APM instance or component
After Application Performance Monitoring actions, action policies, and blackout policies are created, you can assign an action policy to an application instance or component.
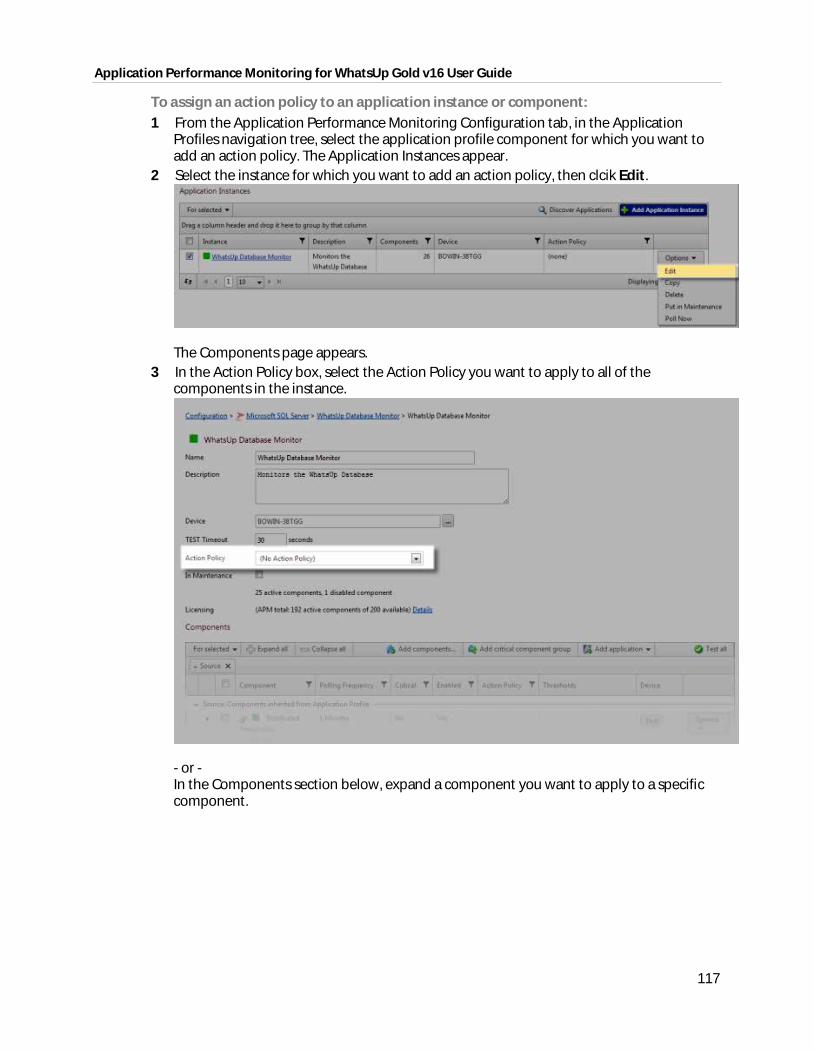
Application Performance Monitoring for WhatsUp Gold v16 User Guide
117
To assign an action policy to an application instance or component: 1 From the Application Performance Monitoring Configuration tab, in the Application
Profiles navigation tree, select the application profile component for which you want to add an action policy. The Application Instances appear.
2 Select the instance for which you want to add an action policy, then clcik Edit.
The Components page appears.
3 In the Action Policy box, select the Action Policy you want to apply to all of the components in the instance.
- or - In the Components section below, expand a component you want to apply to a specific component.
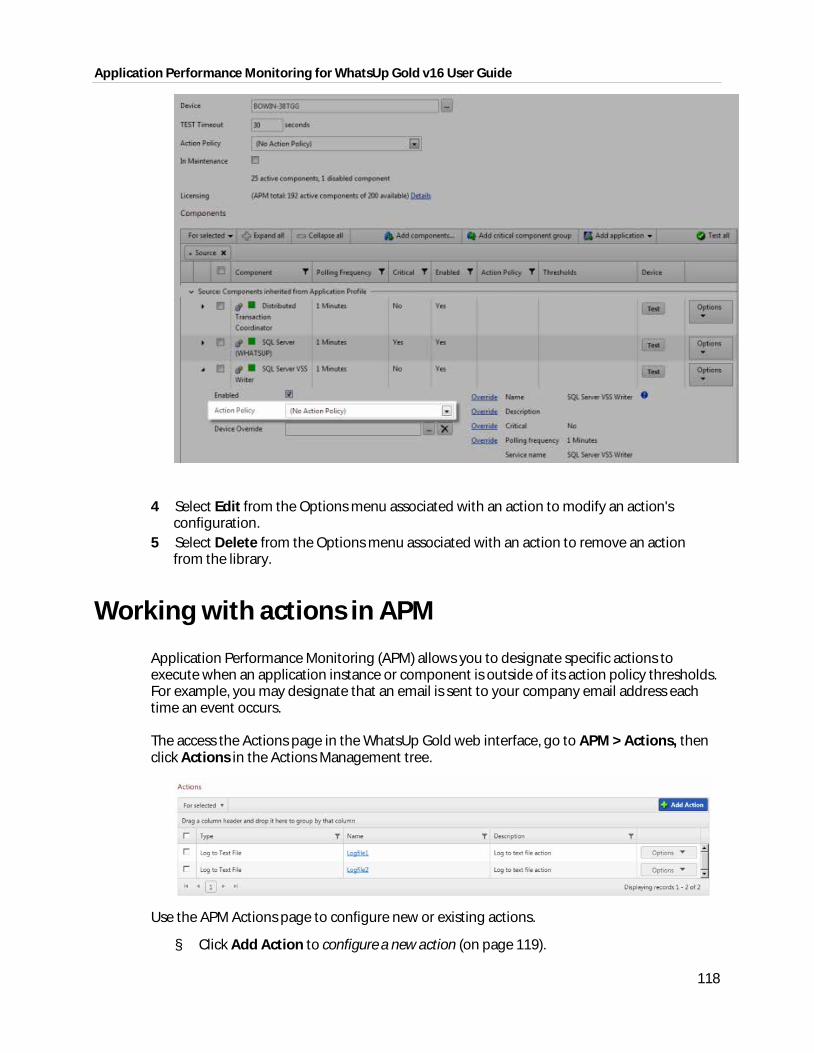
Application Performance Monitoring for WhatsUp Gold v16 User Guide
118
4 Select Edit from the Options menu associated with an action to modify an action's configuration.
5 Select Delete from the Options menu associated with an action to remove an action from the library.
Working with actions in APM
Application Performance Monitoring (APM) allows you to designate specific actions to execute when an application instance or component is outside of its action policy thresholds. For example, you may designate that an email is sent to your company email address each time an event occurs.
The access the Actions page in the WhatsUp Gold web interface, go to APM > Actions, then click Actions in the Actions Management tree.
Use the APM Actions page to configure new or existing actions.
§ Click Add Action to configure a new action (on page 119).
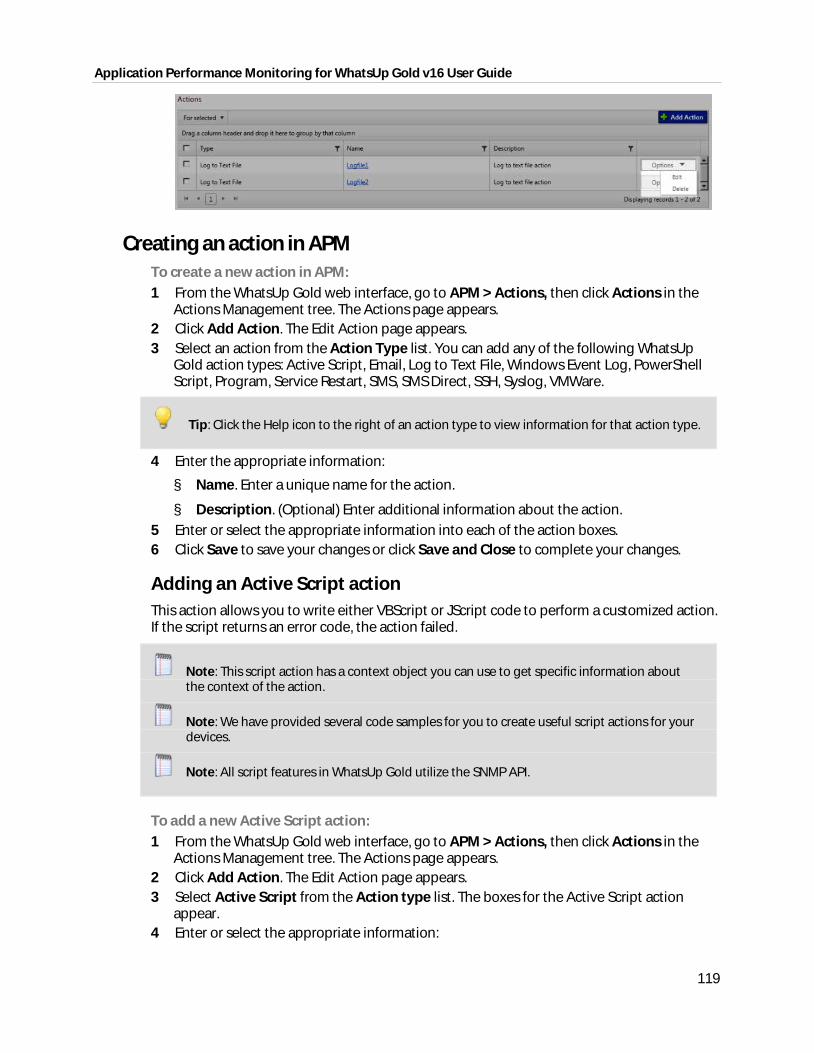
Application Performance Monitoring for WhatsUp Gold v16 User Guide
119
Creating an action in APM To create a new action in APM: 1 From the WhatsUp Gold web interface, go to APM > Actions, then click Actions in the
Actions Management tree. The Actions page appears. 2 Click Add Action. The Edit Action page appears. 3 Select an action from the Action Type list. You can add any of the following WhatsUp
Gold action types: Active Script, Email, Log to Text File, Windows Event Log, PowerShell Script, Program, Service Restart, SMS, SMS Direct, SSH, Syslog, VMWare.
Tip: Click the Help icon to the right of an action type to view information for that action type.
4 Enter the appropriate information:
§ Name. Enter a unique name for the action.
§ Description. (Optional) Enter additional information about the action. 5 Enter or select the appropriate information into each of the action boxes. 6 Click Save to save your changes or click Save and Close to complete your changes.
Adding an Active Script action This action allows you to write either VBScript or JScript code to perform a customized action. If the script returns an error code, the action failed.
Note: This script action has a context object you can use to get specific information about the context of the action.
Note: We have provided several code samples for you to create useful script actions for your devices.
Note: All script features in WhatsUp Gold utilize the SNMP API.
To add a new Active Script action: 1 From the WhatsUp Gold web interface, go to APM > Actions, then click Actions in the
Actions Management tree. The Actions page appears. 2 Click Add Action. The Edit Action page appears. 3 Select Active Script from the Action type list. The boxes for the Active Script action
appear. 4 Enter or select the appropriate information:
Application Performance Monitoring for WhatsUp Gold v16 User Guide
120
§ Name. Enter a unique name for the action. This name displays in the Action Library.
§ Description. (Optional) Enter additional information about the action. This description displays next to the action in the Action Library.
§ Timeout (seconds). Enter the length of time WhatsUp Gold attempts to connect to the selected device. When the time you enter is exceeded without connecting, a timeout occurs and WhatsUp Gold stops trying to connect to the SMTP server. This is considered a failed connection.
Note: Though the maximum timeout is 60 seconds, you are discouraged from using a timeout longer than the default of 10 seconds. You are encouraged to use the shortest timeout possible.
§ Script type. Select the scripting language that you want to use to write this active script (either VBScript or JScript).
§ Script text. Enter your action code here.
Note: We do not recommend that you use percent variables in script text, because they may resolve to text containing special characters (' ' (quotes), " " (double-quotes), % (percent), new line characters, and the like) that may break your script.
5 Click Save. The action is added to the Actions list.
Adding an E-mail action The E-mail action sends an SMTP mail message to a specific e-mail account. An E-mail action can also be used as an e-mail notification in the WhatsUp Gold Alert Center. While you can configure this action on both the console and web interface, you can only configure the Alert Center notification message on the web.
To add an E-mail action: 1 From the WhatsUp Gold web interface, go to APM > Actions, then click Actions in the
Actions Management tree. The Actions page appears. 2 Click Add Action. The Edit Action page appears. 3 Select E-mail from the Action type list. The boxes for the E-mail action appear. 4 Enter or select the appropriate information:
§ Name. Enter a unique name for the action. This name displays in the Action Library.
§ Description. (Optional) Enter additional information about the action. This description displays next to the action in the Action Library.
5 Complete the information on the Configuration tab. This tab contains options pertaining to the action e-mail destination.
§ SMTP Server. Enter the IP address or Host (DNS) name of your e-mail server (SMTP mail host).
§ Port. Enter the port number on which the SMTP server is listening.
§ Timeout (sec). Enter the length of time WhatsUp Gold attempts to connect to the selected device. When the time you enter is exceeded without connecting, a timeout
Application Performance Monitoring for WhatsUp Gold v16 User Guide
121
occurs and WhatsUp Gold stops trying to connect to the SMTP server. This is considered a failed connection.
§ Mail To. Enter the email addresses to which you want to send the alert. Email addresses must be fully qualified. You can enter multiple addresses, separated by commas (but no spaces). The address should not contain brackets, braces, quotes, or parentheses.
§ Mail From. Enter the email address you want to appear in the From field of the e-mail that is sent by the Email action.
§ SMTP server requires authentication. Check this option if your SMTP server uses authentication. This enables the Username and Password boxes.
The Email action supports three authentication types:
§ CRAM-MD5
§ login
§ plain
The authentication type is not configurable. It is negotiated with the SMTP server automatically.
§ Username. Enter the username for SMTP authentication.
§ Password. Enter the password of the username for authentication.
§ Use an encrypted connection (SSL/TLS). Check this option if your SMTP server requires the data to be encrypted over a TLS connection (formerly known as SSL).
6 Complete the information on the Mail Content tab. This tab contains options pertaining to the action email message content.
§ Subject. Enter a text message or edit the default message. You can use percent variable codes to display specific information in the subject.
§ Message body. Enter a text message or edit the default message. You can use percent variable codes to display specific information in the message body.
Tip: (MR - 3/9/13 Not yet possible in APM email actions) You can add a link to either or both the Device Status and Mobile Device Status reports by clicking the appropriate button.
7 Click Save. The E-mail action is added to the Actions list.
Adding a Log-to-Text File action The Log to Text action logs custom messages to specified text files.
To add a new Log to Text File action: 1 From the WhatsUp Gold web interface, go to APM > Actions, then click Actions in the
Actions Management tree. The Actions page appears. 2 Click Add Action. The Edit Action page appears. 3 Select Log to Text File from the Action type list. The boxes for the Log To Text File
action appear. 4 Enter or select the appropriate information:
Application Performance Monitoring for WhatsUp Gold v16 User Guide
122
§ Name. Enter a unique name for the action. This name displays in the Action Library.
§ Description. (Optional) Enter additional information about the action. This description displays next to the action in the Action Library.
§ Log file. Enter the full path to the location where the log file will bee written.
§ Log file write mode. Select Append to have log messages appended to the Log file. Select Overwrite to have log messages overwrite existing log messages.
§ Log Message. Enter the message that will be written to the log file. This message supports percent variables. The default log message is:
%Device.ActiveMonitorDownNames is %Device.State on %Device.Type: %Device.HostName (%Device.Address).
Details:
Monitors that are down include: %Device.ActiveMonitorDownNames
Monitors that are up include: %Device.ActiveMonitorUpNames
Notes on this device (from device property page):
%Device.Notes
----------------------------------------
This message was logged on %System.Date at %System.Time
Ipswitch WhatsUp Gold
5 Click Save. The Log to Text File action is added to the actions list.
Adding a Windows Event Log action The Windows Event Log action allows you to configure log messages to post to the Windows Event Viewer.
To add a Windows Event Log action: 1 From the WhatsUp Gold web interface, go to APM > Actions, then click Actions in the
Actions Management tree. The Actions page appears. 2 Click Add Action. The Edit Action page appears. 3 Select Windows Event Log from the Action type list. The boxes for the Windows Event
Log action appear. 4 Enter or select the appropriate information:
§ Name. Enter a unique name for the action. This name displays in the Action Library.
§ Description. (Optional) Enter additional information about the action. This description displays next to the action in the Action Library.
§ Source. The origin of messages logged to the Windows Event Viewer. The default source is the Ipswitch WhatsUp Log Action.
§ Event ID. Enter an event ID for the messages that are logged to the Windows Event Viewer. The default event ID is 1000, the WhatsUp engine event ID.
§ Level. Select a level for messages logged to the Windows Event Viewer. You can select Error, Warning, or Information. The default level is Error.
Application Performance Monitoring for WhatsUp Gold v16 User Guide
123
§ Log Message. Enter a log message that displays in the Windows Event Viewer. This message supports percent variables. The default log message is: %Device.ActiveMonitorDownNames is %Device.State on %Device.Type: %Device.HostName (%Device.Address).
Details:
Monitors that are down include: %Device.ActiveMonitorDownNames
Monitors that are up include: %Device.ActiveMonitorUpNames
Notes on this device (from device property page):
%Device.Notes
----------------------------------------
This message was logged on %System.Date at %System.Time
Ipswitch WhatsUp Gold
5 Click Save. The Windows Event Log action is added to the Actions list.
Adding a PowerShell Script action The PowerShell action delivers a robust and flexible environment to the experienced user for developing custom actions through direct access to script component libraries, including the .NET Framework. For more information, see PowerShell action script examples.
Important: WhatsUp Gold uses a 32-bit (i.e. x86) PowerShell engine. Therefore, only 32-bit PowerShell snap-ins are supported and 64-bit only snap-ins will not function properly. Snap-ins usable in both 32-bit and 64-bit operating systems are configured for 64-bit systems by default and must be manually configured for 32-bit PowerShell engine to function properly with WhatsUp Gold.
If you are using additional pollers with WhatsUp Gold, PowerShell must be installed and any desired snap-ins must be registered identically on all poller machines for any PowerShell performance monitors, active monitors, and actions to function properly. Associated errors resulting from failed monitors will appear in the WhatsUp Gold Status Center. Errors resulting from failed actions will appear in the WhatsUp Gold Event Viewer.
To add a new PowerShell script action: 1 From the WhatsUp Gold web interface, go to APM > Actions, then click Actions in the
Actions Management tree. The Actions page appears. 2 Click Add Action. The Edit Action page appears. 3 Select PowerShell Script from the Action type list. The boxes for the PowerShell Script
action appear. 4 Enter or select the appropriate information:
§ Name. Enter a unique name for the action. This name displays in the Action Library.
§ Description. (Optional) Enter additional information about the action. This description displays next to the action in the Action Library.
§ Timeout (seconds). Enter the length of time WhatsUp Gold attempts to connect to the selected device. When the time you enter is exceeded without connecting, a
Application Performance Monitoring for WhatsUp Gold v16 User Guide
124
timeout occurs and WhatsUp Gold stops trying to connect to the device. This is considered a failed connection.
Note: You are highly discouraged from using a timeout longer than 10 seconds. Please use the shortest timeout possible.
§ Use device credentials. Select this check box to execute the script using the Windows credentials for the affected device. For additional information, see Using the Credentials Library.
§ Script Text. Enter your action code. 5 Click Save. The PowerShell Script action is added to the actions list.
Adding a Program action Program actions can be defined to launch an external application when a state change occurs.
To add a new Program action: 1 From the WhatsUp Gold web interface, go to APM > Actions, then click Actions in the
Actions Management tree. The Actions page appears. 2 Click Add Action. The Edit Action page appears. 3 Select Program from the Action type list. The boxes for the Program action appear. 4 Enter or select the appropriate information:
§ Name. Enter a unique name for the action. This name displays in the Action Library.
§ Description. (Optional) Enter additional information about the action. This description displays next to the action in the Action Library.
§ Program file name. Enter the file path where the working files for the application are stored.
§ Working path. Enter the file path where the working files for the application are stored. The working path is located on the server where WhatsUp Gold is running.
§ Program arguments. Enter any percent variables you want to pass to the specified program.
5 Click Save. The Program action is added to the actions list.
Adding a Service Restart action To add a Service Restart action: 1 From the WhatsUp Gold web interface, go to APM > Actions, then click Actions in the
Actions Management tree. The Actions page appears. 2 Click Add Action. The Edit Action page appears. 3 Select Service Restart from the Action type list. The boxes for the Service Restart
action appear. 4 Enter or select the appropriate information:
§ Name. Enter a unique name for the action. This name displays in the Action Library.
Application Performance Monitoring for WhatsUp Gold v16 User Guide
125
§ Description. (Optional) Enter additional information about the action. This description displays next to the action in the Action Library.
§ Service. Click browse (...) to select the desired service associated with your host.
§ Command. Select either Start or Stop, depending on whether you want the associated alert to start or stop the service you have selected.
5 Click Save or Save and Close. The Service Restart action is added to the actions list.
Adding an SMS action The SMS Action sends a Short Message Service (SMS) notification to a pager or cell phone using an email gateway or dial-up modem. An SMS Action can also be used as an SMS notification in the WhatsUp Gold Alert Center.
To add a new SMS action: 1 From the WhatsUp Gold web interface, go to APM > Actions, then click Actions in the
Actions Management tree. The Actions page appears. 2 Click Add Action. The Edit Action page appears. 3 Select SMS from the Action type list. The boxes for the SMS action appear. 4 Enter or select the appropriate information:
§ Name. Enter a unique name for the action. This name displays in the Action Library.
§ Description. (Optional) Enter additional information about the action. This description displays next to the action in the Action Library.
§ Country. Select the country for the SMS provider.
§ Provider. Select the desired provider. If the provider list is incomplete and/or incorrect, you can click browse (...) to add, edit, or delete providers in this list.
§ Mode. Either Email or Dialup, depending on how the provider was created in the system.
§ Email to. If the connection setting is Email, enter the email address of the SMS device.
§ Phone Number. If the connection setting is Dialup, enter the phone number to call with the message. You can enter multiple phone numbers, separated by a comma. There is a 2,000 character limit in this field. Also, non-numeric characters such as "-" and "." are ignored.
§ Message. Enter a text message plus any desired percent variable codes. Keep in mind that if you use percent variables, this will greatly increase the character count.
Note: If the message exceeds 140 characters, the message will be broken into up to 3 parts and will be sent as separate messages ("1 of 3", "1 of 2", etc.).
§ Tip: Click Mobile Device Status to insert a link to the device status in the message. 5 Click Save. The SMS action appears in the Actions list.
Adding an SMS Direct action SMS Direct messages are similar to SMS messages, except a phone line is not required. Instead, messages are sent directly to a cell phone, or other texting capable device, via a GSM
Application Performance Monitoring for WhatsUp Gold v16 User Guide
126
modem. If the receiving phone is not active or is out of range when a SMS message is sent, messages are received when the phone is turned on. SMS messages are listed in the WhatsUp Gold Action log.
You need the following items to use the SMS Direct Action:
§ GSM modem to connect to the WhatsUp machine
§ SIM card for the GSM modem
§ Cell service/signal in the room in which the WhatsUp machine and GSM modem reside
To add a new SMS Direct action: 1 From the WhatsUp Gold web interface, go to APM > Actions, then click Actions in the
Actions Management tree. The Actions page appears. 2 Click Add Action. The Edit Action page appears. 3 Select SMS Direct from the Action type list. The boxes for the SMS Direct action appear. 4 Enter or select the appropriate information:
§ Name. Enter a unique name for the action. This name displays in the Action Library.
§ Description. (Optional) Enter additional information about the action. This description displays next to the action in the Action Library.
§ Phone number. Enter the cell phone number(s) of the intended SMS message recipients.
Note: All non-numeric characters such as "-" and ".", are ignored.
Note: There is a 2,000 character limit in this box.
§ COM Port. Select the COM port you want to use with this notification.
Note: The list displays all ports associated with the GSM modem, including virtual and hard-wired, serial ports. You must select the port that is assigned to the modem in the Windows Device Manager.
§ Message. Enter a text message, plus any desired percent variable codes. Using percent variables greatly increases character count.
Note: If the message exceeds 140 characters, the message may be broken into up to three parts and is sent as separate messages ("1 of 3", "1 of 2", etc.), each message containing up to 140 characters, for a total of up to 420 characters. Spaces are included in the character count.
5 Click Save. The SMS Direct action appears in the Actions list.
Adding an SSH action The SSH action connects to remote devices via SSH to execute commands or scripts.
Application Performance Monitoring for WhatsUp Gold v16 User Guide
127
To add a new SSH action: 1 From the WhatsUp Gold web interface, go to APM > Actions, then click Actions in the
Actions Management tree. The Actions page appears. 2 Click Add Action. The Edit Action page appears. 3 Select SSH from the Action type list. The boxes for the SSH action appear. 4 Enter or select the appropriate information:
§ Name. Enter a unique name for the action. This name displays in the Action Library.
§ Description. (Optional) Enter additional information about the action. This description displays next to the action in the Action Library.
§ IP address. Enter the IP address of the device to which you want to connect using SSH.
Note: You can enter %Device.Address into the IP Address field; however, an SSH action that does not specify a specific IP address in this field is not available in the Recurring Actions wizard.
§ Command to run. Enter the command to be run and executed on the remote device. This command can be anything that the device can interpret and run; for example, a Unix shell command or a perl script.
Note: If you create a script to run on the remote device, the script must be developed, tested, and/or debugged on the remote machine. WhatsUp Gold does not support manipulation of the remote script.
§ SSH credential. Select the appropriate SSH credential that WhatsUp Gold uses to connect to the remote device. If you select Use the device SSH credential, WhatsUp Gold uses the SSH credential assigned to the device for which the IP address is listed above. If the appropriate SSH credential is not listed, or the device has no SSH credentials assigned, browse (...) to the WhatsUp Gold Credentials Library to configure a set of credentials.
5 Click Save. The SSH action is added to the Actions list.
Adding a Syslog action When a device does not respond to polling, you can send a Syslog message to a host that is running a Syslog server.
To add a new Syslog action: 1 From the WhatsUp Gold web interface, go to APM > Actions, then click Actions in the
Actions Management tree. The Actions page appears. 2 Click Add Action. The Edit Action page appears. 3 Select Syslog from the Action type list. The boxes for the Syslog action appear. 4 Enter or select the appropriate information:
§ Name. Enter a unique name for the action. This name displays in the Action Library.
§ Description. (Optional) Enter additional information about the action. This description displays next to the action in the Action Library.
Application Performance Monitoring for WhatsUp Gold v16 User Guide
128
§ Syslog Server. Enter the IP address or hostname of the machine that is running the Syslog server.
§ Port. Enter the UDP port that the Syslog listener is listening on. The default port is 514.
§ Message. Enter a text message to send to the Syslog server. This message may include notification variables. The Syslog message box limits input to 511 characters. If notification variables are used, then the message that actually gets sent is limited to 1023 bytes, in order to comply with the Syslog protocol. Non-visible ASCII characters such as tabs and line feeds are replaced by space characters.
5 Click Save. The Syslog action is added to the Actions list.
Adding a VMware action VMWare actions perform operations such as starting, stopping, or taking a snapshot of virtual machines running on a VMware host or being managed by a VMware vCenter server.
To add a new VMware action: 1 From the WhatsUp Gold web interface, go to APM > Actions, then click Actions in the
Actions Management tree. The Actions page appears. 2 Click Add Action. The Edit Action page appears. 3 Select VMware from the Action type list. The boxes for the VMware action appear. 4 Enter or select the appropriate information:
§ Name. Enter a unique name for the action. This name displays in the Action Library.
§ Description. (Optional) Enter additional information about the action. This description displays next to the action in the Action Library.
§ VMware server IP address. Enter the IP address of the VMware host or vCenter server managing the virtual machine.
§ VMware credentials. Select the VMware credentials from the Credentials Library for the VMware host or vCenter server managing the virtual machine. Click browse (...) to manage credentials in the credentials library.
§ VMware name. Select the Virtual machine VMware name for the virtual machine on which you want the action performed. You can enter the VMware name, or select from the list of virtual machines associated with the VMware host or vCenter server. Click browse (...) to access the list of virtual machines associated with the VMware host.
§ Operation. Select the operation you want the action to perform from the list.
The following operations can be performed on a virtual machine:
§ Power On. Powers up the virtual machine and boots the guest operating system if the guest operating system is installed.
§ Power Off. Powers down the virtual machine. The virtual machine does not attempt to gracefully shut down the guest operating system.
§ Reset. Powers down the virtual machine and restarts it.
§ Shutdown. Shuts down the guest operating system. If the guest operating system automatically powers off its host, then the virtual machine also powers off.
§ Suspend. Pauses the virtual machine activity; all transactions are frozen.

Application Performance Monitoring for WhatsUp Gold v16 User Guide
129
§ Restart. Shuts down and restarts the guest operating system; does not power off the virtual machine.
§ Take snapshot. Saves the current state of the virtual machine to the virtual disk of the guest system.
5 Click Save. The VMware action is added to the Actions list.
Percent variables for APM actions The following percent variables are available for use with Application Performance Monitoring (APM) actions:
Name Description
%System.Time Returns the system time.
%System.Date Returns the system date.
%System.InstallDir Returns the install directory of the WhatsUp Gold instance.
%Application.ApplicationInstance.ApplicationID Returns the ID of the application instance.
%Application.ApplicationInstance.ApplicationName Returns the application name associated with the application instance.
%Application.ApplicationInstance.Description Returns the description given to the application instance.
%Application.ApplicationInstance.CurrentState Returns the current state of the application instance.
%Application.ApplicationInstance.PreviousState Returns the previous state of the application instance.
%Application.ApplicationInstance.MasterDeviceID Returns the ID of the master device associated with the application instance.
%Application.ApplicationInstance.MasterDeviceDisplayName Returns the display name of the master device associated with the application instance.
%Application.TriggeringComponent.Name Returns the name of the component that triggered the associated action.
%Application.TriggeringComponent.PollTime Returns the time of the last poll of the component that triggered the action.
%Application.TriggeringComponent.Type Returns the type of the component that triggered the action.
%Application.TriggeringComponent.CurrentState Returns the current state of the component that triggered the action.
%Application.TriggeringComponent.PreviousState Returns the previous state of the component that triggered the action.
%Application.TriggeringComponent.DeviceID Returns the ID of the device associated with the component that triggered the action.
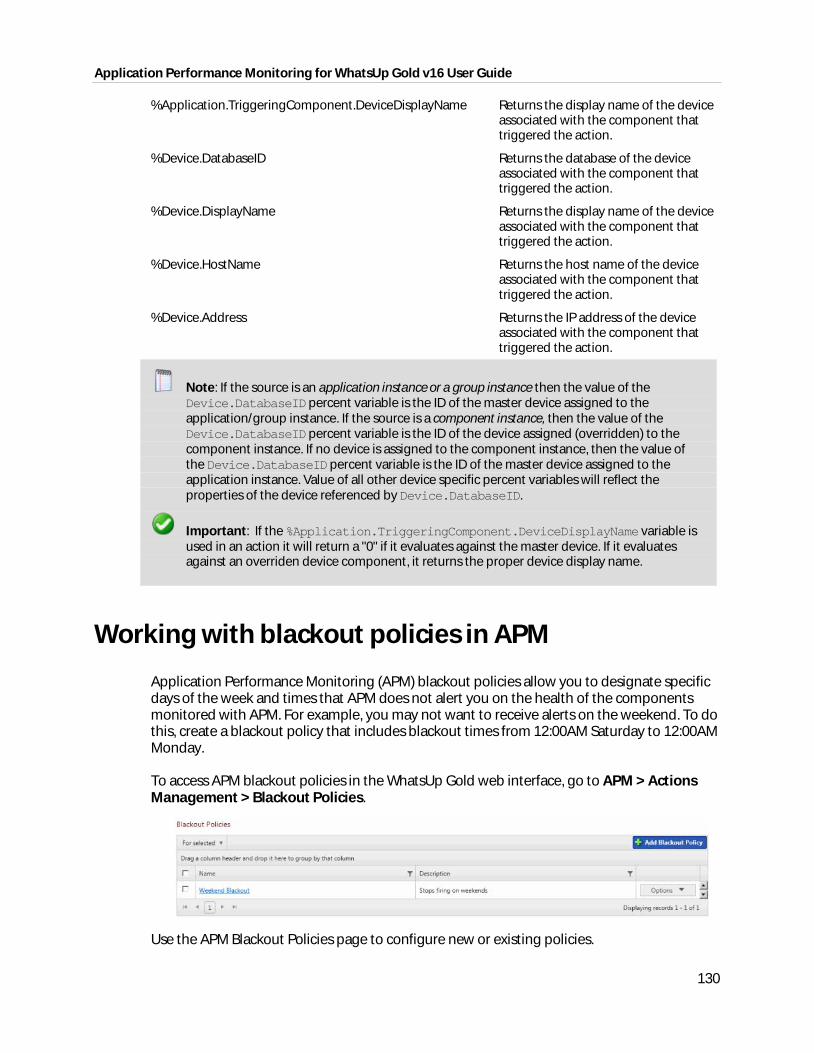
Application Performance Monitoring for WhatsUp Gold v16 User Guide
130
%Application.TriggeringComponent.DeviceDisplayName Returns the display name of the device associated with the component that triggered the action.
%Device.DatabaseID Returns the database of the device associated with the component that triggered the action.
%Device.DisplayName Returns the display name of the device associated with the component that triggered the action.
%Device.HostName Returns the host name of the device associated with the component that triggered the action.
%Device.Address Returns the IP address of the device associated with the component that triggered the action.
Note: If the source is an application instance or a group instance then the value of the Device.DatabaseID percent variable is the ID of the master device assigned to the application/group instance. If the source is a component instance, then the value of the Device.DatabaseID percent variable is the ID of the device assigned (overridden) to the component instance. If no device is assigned to the component instance, then the value of the Device.DatabaseID percent variable is the ID of the master device assigned to the application instance. Value of all other device specific percent variables will reflect the properties of the device referenced by Device.DatabaseID.
Important: If the %Application.TriggeringComponent.DeviceDisplayName variable is used in an action it will return a "0" if it evaluates against the master device. If it evaluates against an overriden device component, it returns the proper device display name.
Working with blackout policies in APM
Application Performance Monitoring (APM) blackout policies allow you to designate specific days of the week and times that APM does not alert you on the health of the components monitored with APM. For example, you may not want to receive alerts on the weekend. To do this, create a blackout policy that includes blackout times from 12:00AM Saturday to 12:00AM Monday.
To access APM blackout policies in the WhatsUp Gold web interface, go to APM > Actions Management > Blackout Policies.
Use the APM Blackout Policies page to configure new or existing policies.
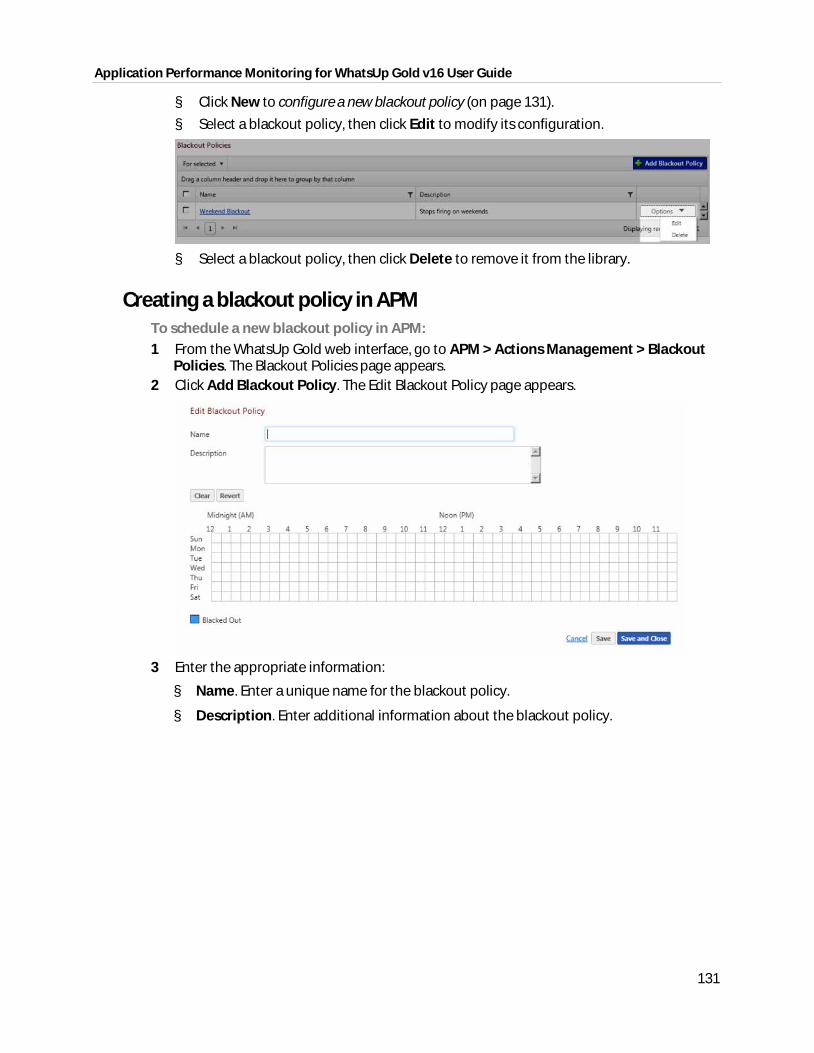
Application Performance Monitoring for WhatsUp Gold v16 User Guide
131
§ Click New to configure a new blackout policy (on page 131).
§ Select a blackout policy, then click Edit to modify its configuration.
§ Select a blackout policy, then click Delete to remove it from the library.
Creating a blackout policy in APM To schedule a new blackout policy in APM: 1 From the WhatsUp Gold web interface, go to APM > Actions Management > Blackout
Policies. The Blackout Policies page appears. 2 Click Add Blackout Policy. The Edit Blackout Policy page appears.
3 Enter the appropriate information:
§ Name. Enter a unique name for the blackout policy.
§ Description. Enter additional information about the blackout policy.
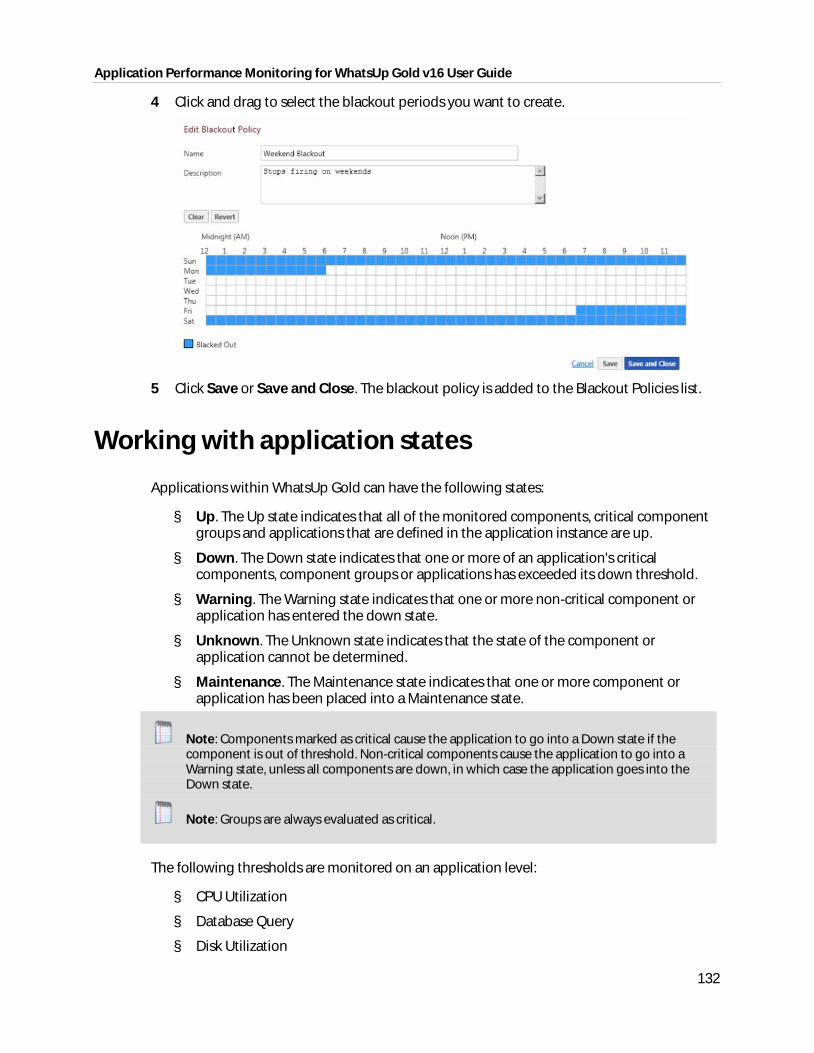
Application Performance Monitoring for WhatsUp Gold v16 User Guide
132
4 Click and drag to select the blackout periods you want to create.
5 Click Save or Save and Close. The blackout policy is added to the Blackout Policies list.
Working with application states
Applications within WhatsUp Gold can have the following states:
§ Up. The Up state indicates that all of the monitored components, critical component groups and applications that are defined in the application instance are up.
§ Down. The Down state indicates that one or more of an application's critical components, component groups or applications has exceeded its down threshold.
§ Warning. The Warning state indicates that one or more non-critical component or application has entered the down state.
§ Unknown. The Unknown state indicates that the state of the component or application cannot be determined.
§ Maintenance. The Maintenance state indicates that one or more component or application has been placed into a Maintenance state.
Note: Components marked as critical cause the application to go into a Down state if the component is out of threshold. Non-critical components cause the application to go into a Warning state, unless all components are down, in which case the application goes into the Down state.
Note: Groups are always evaluated as critical.
The following thresholds are monitored on an application level:
§ CPU Utilization
§ Database Query
§ Disk Utilization
Application Performance Monitoring for WhatsUp Gold v16 User Guide
133
§ Memory Utilization
§ Network Port Check
§ Process Check
§ Script Execution
§ SNMP
§ SSH Command
§ Windows Service Check
§ WMI
APM Actions Log The APM Actions log provides information about the actions that are executed in response to the state change of a source. You can set the time range for the actions you want to see in the Action Log. You can group and filter the log, as well as export the log to a comma separated list. The Action log provides the following fields:
§ Action. The name of the triggered action.
§ Action Policy. The name of the action policy that triggered the action.
§ Source. The instance or component whose state change triggered the action.
§ Indicator. A visual indication of the state.
§ State. The state to which the source transitioned when the action occured.
§ Activity.
§ Details. Details about the action.
§ Log Date. The date and time at which the action occurred.
To set the date and time range: 1 Set the Start date.
a) Select the calendar icon. The calendar appears.
b) Choose the start date. The date appears in the Start Date box. 2 Set the Start time.
a) Select the watch icon. The time list appears.
b) Select the start time. The time appears in the Start Date box. 3 Set the End date.
a) Select the calendar icon. The calendar appears.
b) Choose the end date. The date appears in the End Date box. 4 Set the End time.
a) Select the watch icon. The time list appears.
b) Select the end time. The time appears in the End Date box. 5 Click Apply. The actions for the selected time range are loaded into the Action Log.
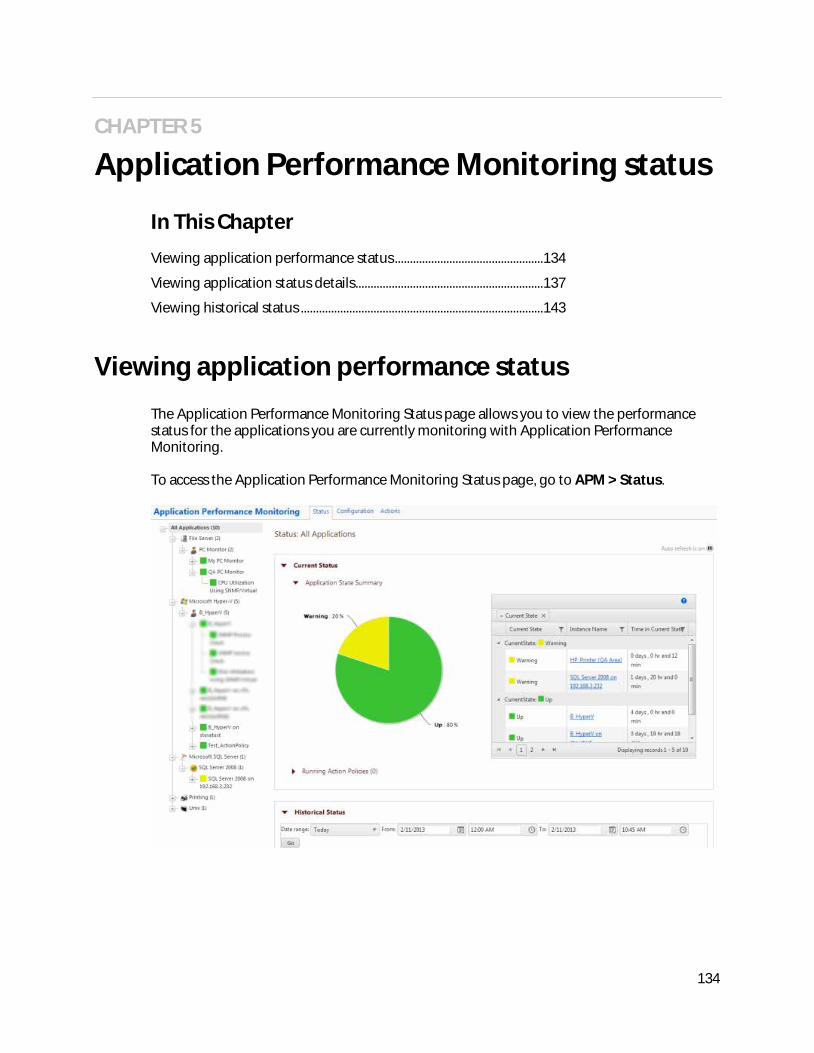
134
CHAPTER 5
Application Performance Monitoring status
In This Chapter
Viewing application performance status ................................................. 134
Viewing application status details .............................................................. 137
Viewing historical status ................................................................................ 143
Viewing application performance status
The Application Performance Monitoring Status page allows you to view the performance status for the applications you are currently monitoring with Application Performance Monitoring.
To access the Application Performance Monitoring Status page, go to APM > Status.
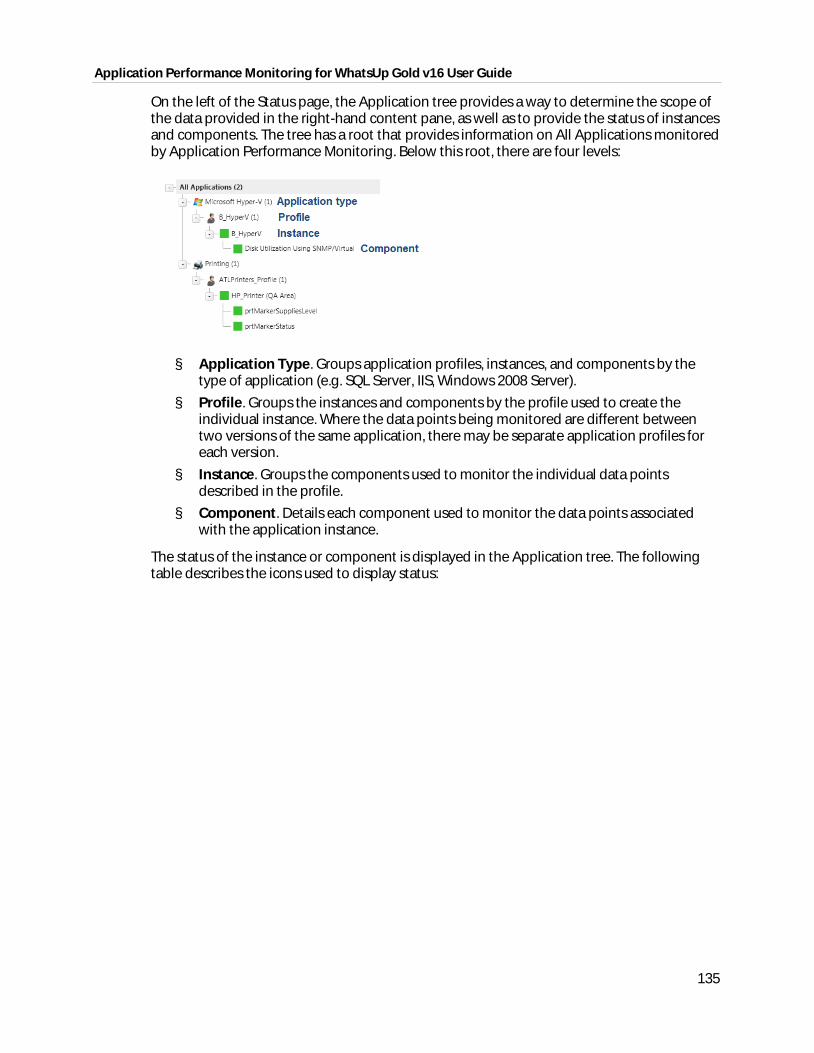
Application Performance Monitoring for WhatsUp Gold v16 User Guide
135
On the left of the Status page, the Application tree provides a way to determine the scope of the data provided in the right-hand content pane, as well as to provide the status of instances and components. The tree has a root that provides information on All Applications monitored by Application Performance Monitoring. Below this root, there are four levels:
§ Application Type. Groups application profiles, instances, and components by the type of application (e.g. SQL Server, IIS, Windows 2008 Server).
§ Profile. Groups the instances and components by the profile used to create the individual instance. Where the data points being monitored are different between two versions of the same application, there may be separate application profiles for each version.
§ Instance. Groups the components used to monitor the individual data points described in the profile.
§ Component. Details each component used to monitor the data points associated with the application instance.
The status of the instance or component is displayed in the Application tree. The following table describes the icons used to display status:
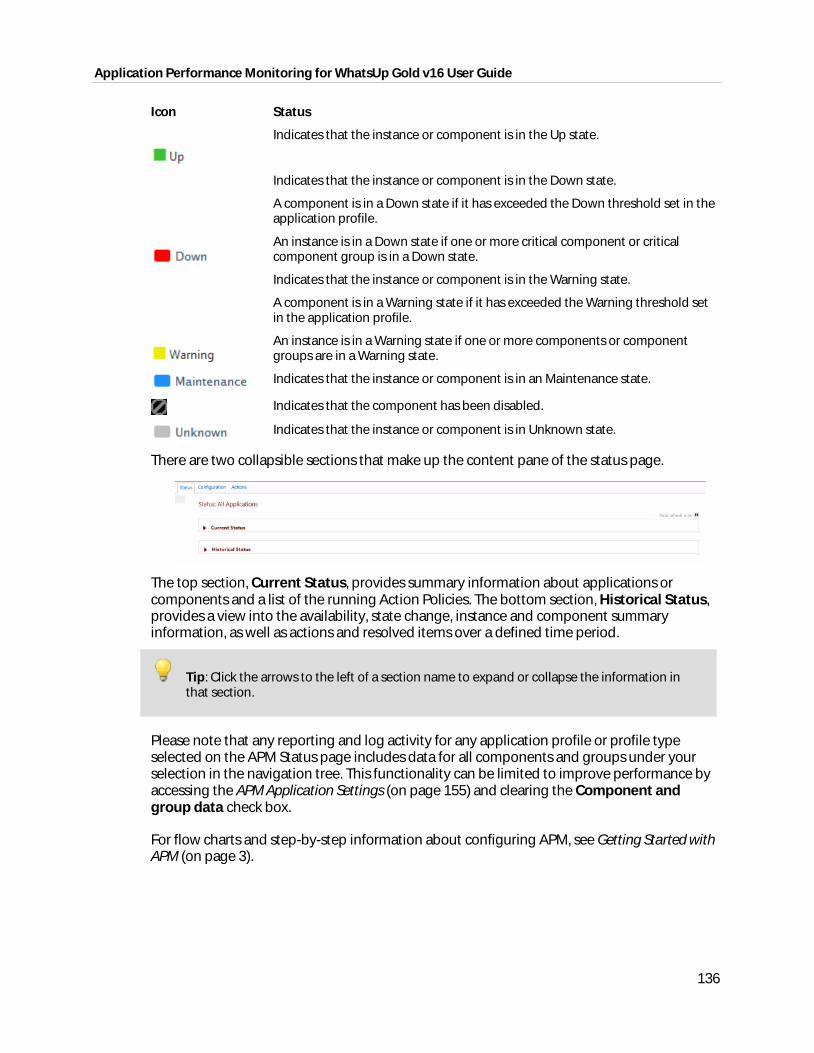
Application Performance Monitoring for WhatsUp Gold v16 User Guide
136
Icon Status
Indicates that the instance or component is in the Up state.
Indicates that the instance or component is in the Down state.
A component is in a Down state if it has exceeded the Down threshold set in the application profile.
An instance is in a Down state if one or more critical component or critical component group is in a Down state.
Indicates that the instance or component is in the Warning state.
A component is in a Warning state if it has exceeded the Warning threshold set in the application profile.
An instance is in a Warning state if one or more components or component groups are in a Warning state.
Indicates that the instance or component is in an Maintenance state.
Indicates that the component has been disabled.
Indicates that the instance or component is in Unknown state.
There are two collapsible sections that make up the content pane of the status page.
The top section, Current Status, provides summary information about applications or components and a list of the running Action Policies. The bottom section, Historical Status, provides a view into the availability, state change, instance and component summary information, as well as actions and resolved items over a defined time period.
Tip: Click the arrows to the left of a section name to expand or collapse the information in that section.
Please note that any reporting and log activity for any application profile or profile type selected on the APM Status page includes data for all components and groups under your selection in the navigation tree. This functionality can be limited to improve performance by accessing the APM Application Settings (on page 155) and clearing the Component and group data check box.
For flow charts and step-by-step information about configuring APM, see Getting Started with APM (on page 3).
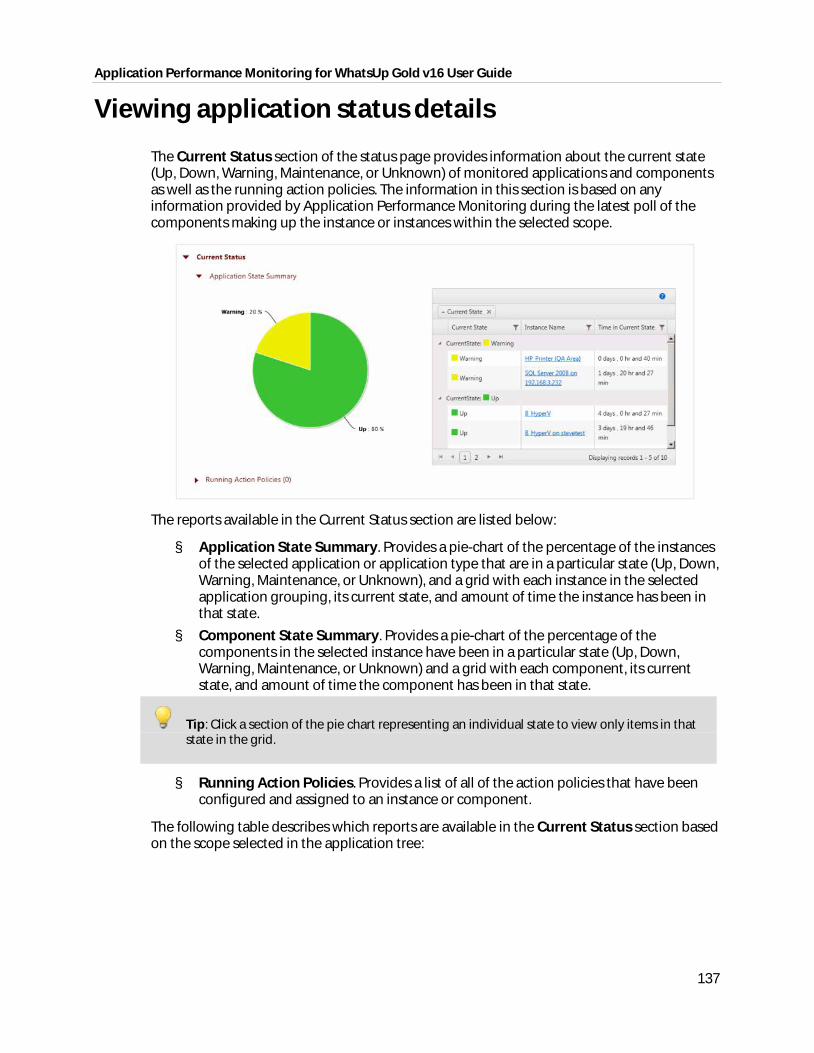
Application Performance Monitoring for WhatsUp Gold v16 User Guide
137
Viewing application status details
The Current Status section of the status page provides information about the current state (Up, Down, Warning, Maintenance, or Unknown) of monitored applications and components as well as the running action policies. The information in this section is based on any information provided by Application Performance Monitoring during the latest poll of the components making up the instance or instances within the selected scope.
The reports available in the Current Status section are listed below:
§ Application State Summary. Provides a pie-chart of the percentage of the instances of the selected application or application type that are in a particular state (Up, Down, Warning, Maintenance, or Unknown), and a grid with each instance in the selected application grouping, its current state, and amount of time the instance has been in that state.
§ Component State Summary. Provides a pie-chart of the percentage of the components in the selected instance have been in a particular state (Up, Down, Warning, Maintenance, or Unknown) and a grid with each component, its current state, and amount of time the component has been in that state.
Tip: Click a section of the pie chart representing an individual state to view only items in that state in the grid.
§ Running Action Policies. Provides a list of all of the action policies that have been configured and assigned to an instance or component.
The following table describes which reports are available in the Current Status section based on the scope selected in the application tree:
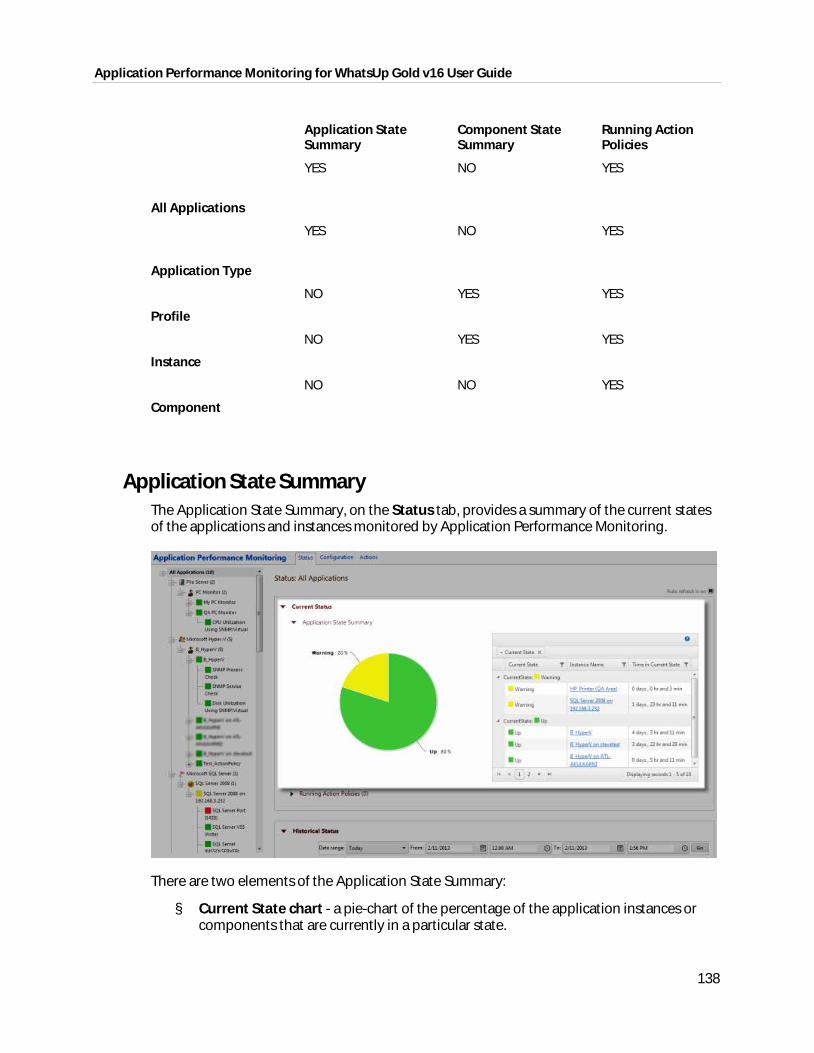
Application Performance Monitoring for WhatsUp Gold v16 User Guide
138
Application State Summary
Component State Summary
Running Action Policies
All Applications
YES NO YES
Application Type
YES NO YES
Profile
NO YES YES
Instance
NO YES YES
Component
NO NO YES
Application State Summary The Application State Summary, on the Status tab, provides a summary of the current states of the applications and instances monitored by Application Performance Monitoring.
There are two elements of the Application State Summary:
§ Current State chart - a pie-chart of the percentage of the application instances or components that are currently in a particular state.
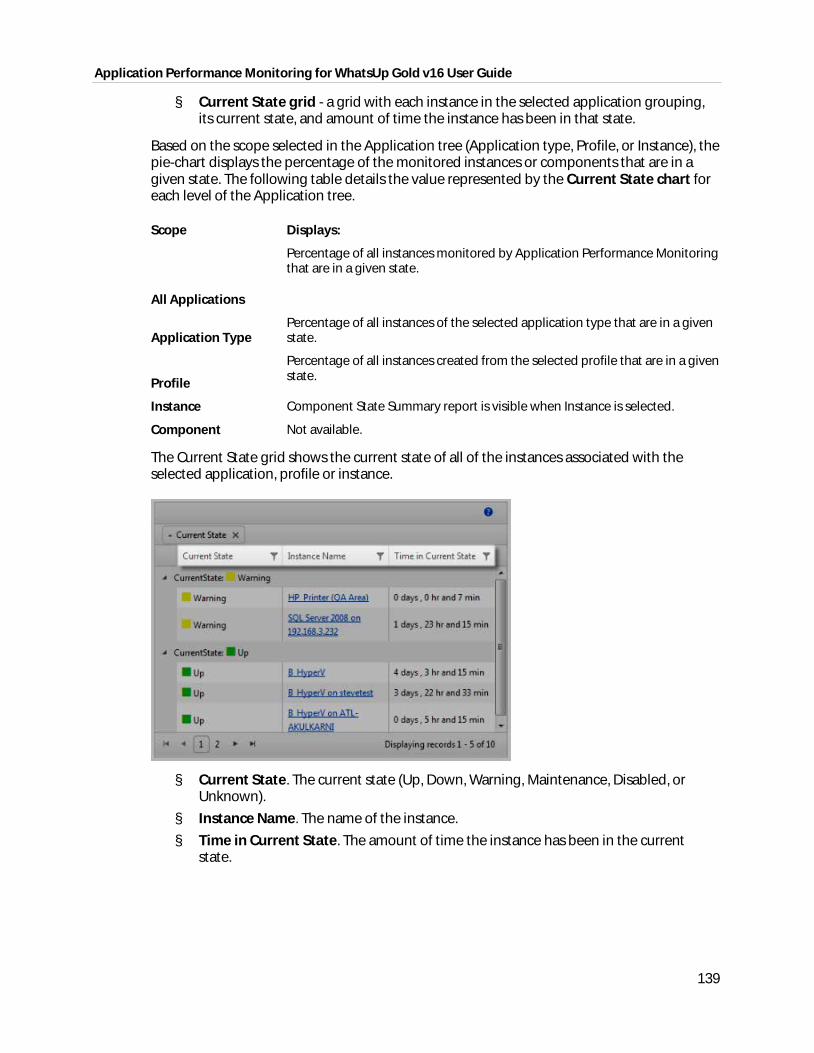
Application Performance Monitoring for WhatsUp Gold v16 User Guide
139
§ Current State grid - a grid with each instance in the selected application grouping, its current state, and amount of time the instance has been in that state.
Based on the scope selected in the Application tree (Application type, Profile, or Instance), the pie-chart displays the percentage of the monitored instances or components that are in a given state. The following table details the value represented by the Current State chart for each level of the Application tree.
Scope Displays:
All Applications
Percentage of all instances monitored by Application Performance Monitoring that are in a given state.
Application Type Percentage of all instances of the selected application type that are in a given state.
Profile
Percentage of all instances created from the selected profile that are in a given state.
Instance Component State Summary report is visible when Instance is selected.
Component Not available.
The Current State grid shows the current state of all of the instances associated with the selected application, profile or instance.
§ Current State. The current state (Up, Down, Warning, Maintenance, Disabled, or Unknown).
§ Instance Name. The name of the instance.
§ Time in Current State. The amount of time the instance has been in the current state.
Application Performance Monitoring for WhatsUp Gold v16 User Guide
140
Scope Displays:
All Applications Current state of all instances monitored by Application Performance Monitoring.
Application Type Current state of all of the instances of the selected application type.
Profile
Current state of all instances created from the selected profile.
Instance
Component State Summary report is generated when Instance is selected.
Component Not available.
Grouping and filtering data You can group the report by any column. To group the output by a column, drag a column header to the grid header. You can group by more than one criteria by dragging more than one column header to the grid header. The grid is ordered by all of the groupings appearing in the grid header, from left to right. To remove a grouping, close the grouping you want to remove. Click on the filter icon to create a filter on data displayed in the column.
Component State Summary The Component State Summary, on the Status tab, provides a summary of the current states of the components monitored by Application Performance Monitoring, based on the component selected in the Application Tree.
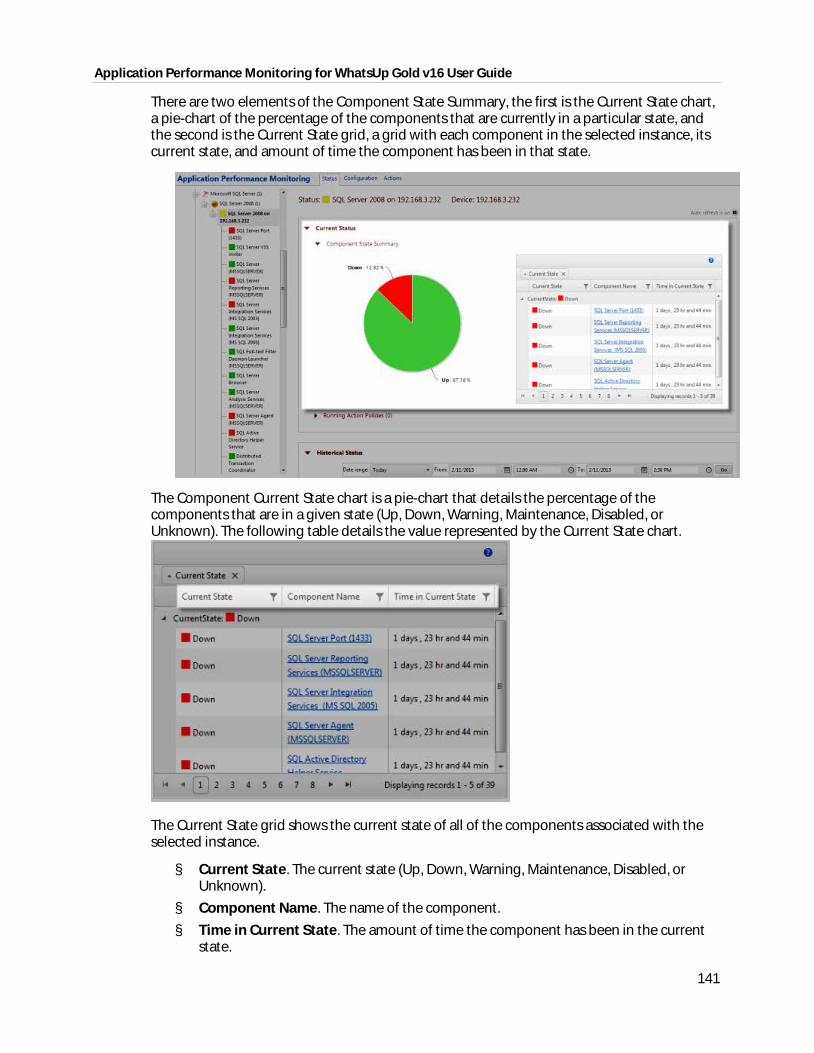
Application Performance Monitoring for WhatsUp Gold v16 User Guide
141
There are two elements of the Component State Summary, the first is the Current State chart, a pie-chart of the percentage of the components that are currently in a particular state, and the second is the Current State grid, a grid with each component in the selected instance, its current state, and amount of time the component has been in that state.
The Component Current State chart is a pie-chart that details the percentage of the components that are in a given state (Up, Down, Warning, Maintenance, Disabled, or Unknown). The following table details the value represented by the Current State chart.
The Current State grid shows the current state of all of the components associated with the selected instance.
§ Current State. The current state (Up, Down, Warning, Maintenance, Disabled, or Unknown).
§ Component Name. The name of the component.
§ Time in Current State. The amount of time the component has been in the current state.
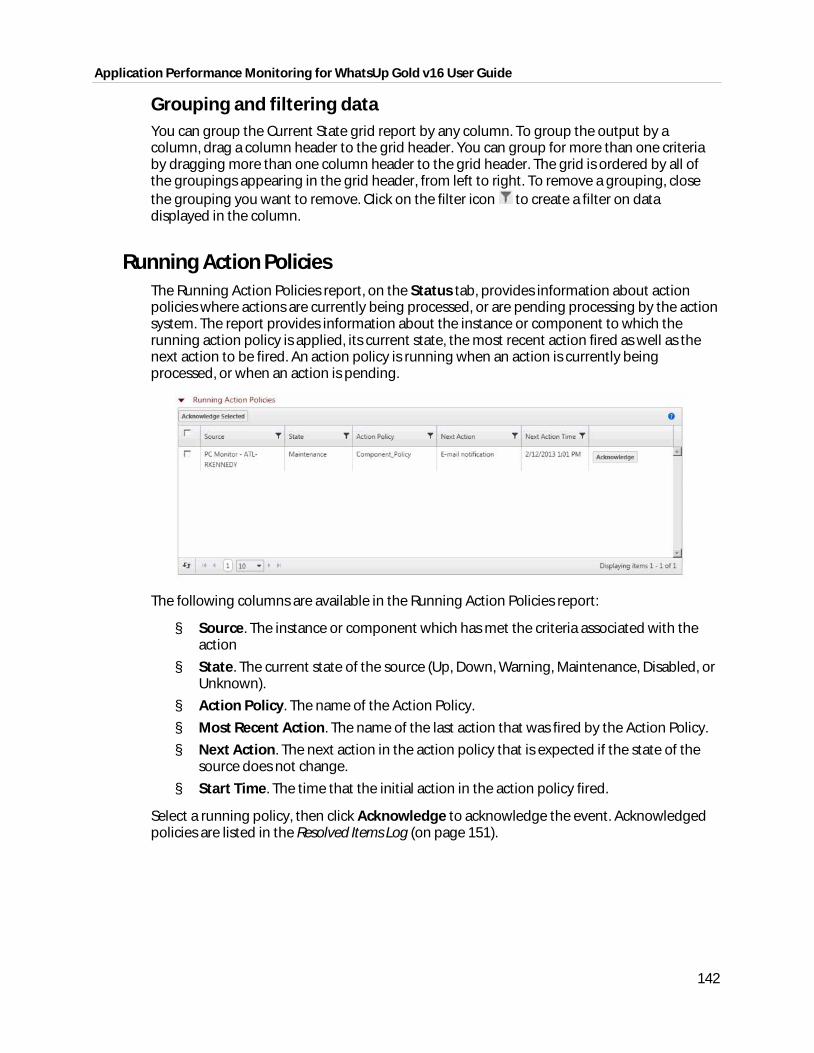
Application Performance Monitoring for WhatsUp Gold v16 User Guide
142
Grouping and filtering data You can group the Current State grid report by any column. To group the output by a column, drag a column header to the grid header. You can group for more than one criteria by dragging more than one column header to the grid header. The grid is ordered by all of the groupings appearing in the grid header, from left to right. To remove a grouping, close the grouping you want to remove. Click on the filter icon to create a filter on data displayed in the column.
Running Action Policies The Running Action Policies report, on the Status tab, provides information about action policies where actions are currently being processed, or are pending processing by the action system. The report provides information about the instance or component to which the running action policy is applied, its current state, the most recent action fired as well as the next action to be fired. An action policy is running when an action is currently being processed, or when an action is pending.
The following columns are available in the Running Action Policies report:
§ Source. The instance or component which has met the criteria associated with the action
§ State. The current state of the source (Up, Down, Warning, Maintenance, Disabled, or Unknown).
§ Action Policy. The name of the Action Policy.
§ Most Recent Action. The name of the last action that was fired by the Action Policy.
§ Next Action. The next action in the action policy that is expected if the state of the source does not change.
§ Start Time. The time that the initial action in the action policy fired.
Select a running policy, then click Acknowledge to acknowledge the event. Acknowledged policies are listed in the Resolved Items Log (on page 151).
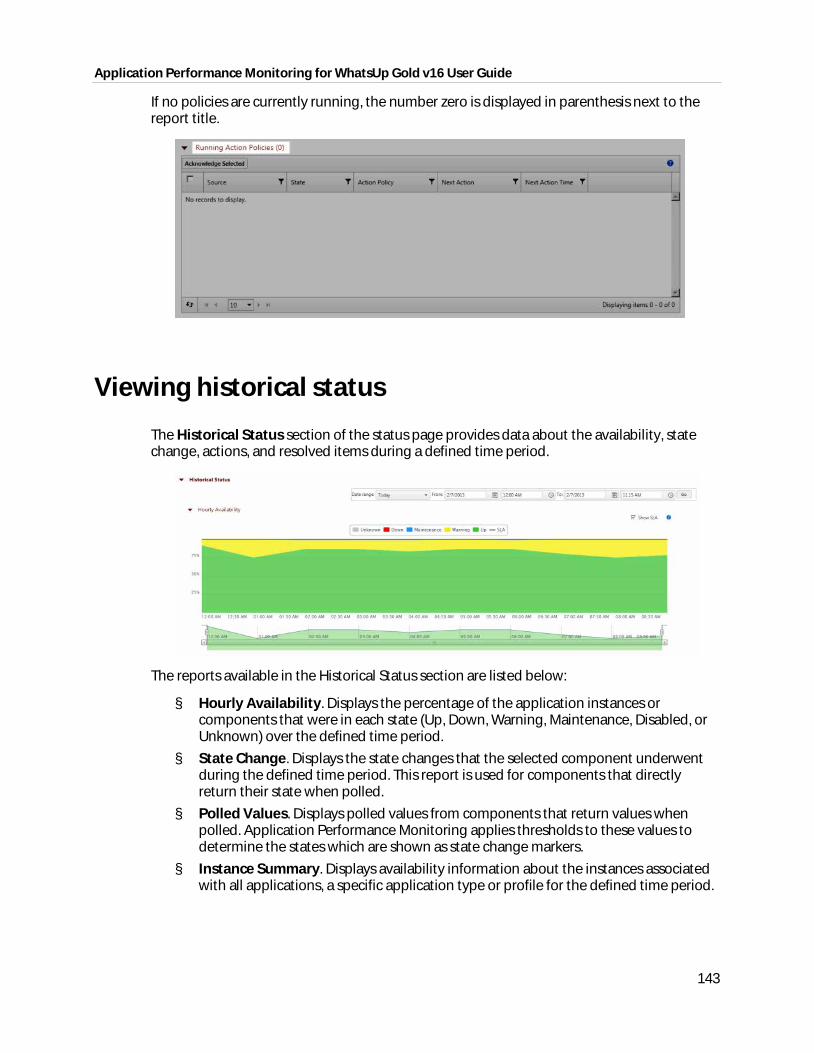
Application Performance Monitoring for WhatsUp Gold v16 User Guide
143
If no policies are currently running, the number zero is displayed in parenthesis next to the report title.
Viewing historical status
The Historical Status section of the status page provides data about the availability, state change, actions, and resolved items during a defined time period.
The reports available in the Historical Status section are listed below:
§ Hourly Availability. Displays the percentage of the application instances or components that were in each state (Up, Down, Warning, Maintenance, Disabled, or Unknown) over the defined time period.
§ State Change. Displays the state changes that the selected component underwent during the defined time period. This report is used for components that directly return their state when polled.
§ Polled Values. Displays polled values from components that return values when polled. Application Performance Monitoring applies thresholds to these values to determine the states which are shown as state change markers.
§ Instance Summary. Displays availability information about the instances associated with all applications, a specific application type or profile for the defined time period.
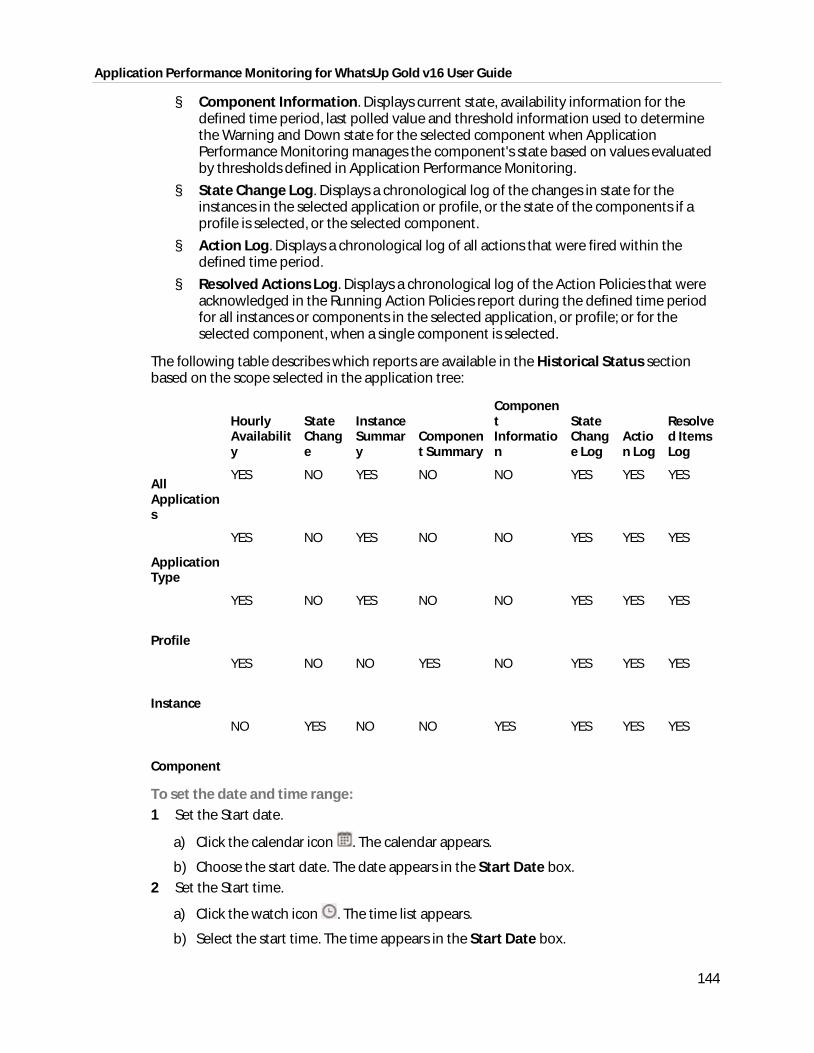
Application Performance Monitoring for WhatsUp Gold v16 User Guide
144
§ Component Information. Displays current state, availability information for the defined time period, last polled value and threshold information used to determine the Warning and Down state for the selected component when Application Performance Monitoring manages the component's state based on values evaluated by thresholds defined in Application Performance Monitoring.
§ State Change Log. Displays a chronological log of the changes in state for the instances in the selected application or profile, or the state of the components if a profile is selected, or the selected component.
§ Action Log. Displays a chronological log of all actions that were fired within the defined time period.
§ Resolved Actions Log. Displays a chronological log of the Action Policies that were acknowledged in the Running Action Policies report during the defined time period for all instances or components in the selected application, or profile; or for the selected component, when a single component is selected.
The following table describes which reports are available in the Historical Status section based on the scope selected in the application tree:
Hourly Availability
State Change
Instance Summary
Component Summary
Component Information
State Change Log
Action Log
Resolved Items Log
All Applications
YES NO YES NO NO YES YES YES
Application Type
YES NO YES NO NO YES YES YES
Profile
YES NO YES NO NO YES YES YES
Instance
YES NO NO YES NO YES YES YES
Component
NO YES NO NO YES YES YES YES
To set the date and time range: 1 Set the Start date.
a) Click the calendar icon . The calendar appears.
b) Choose the start date. The date appears in the Start Date box. 2 Set the Start time.
a) Click the watch icon . The time list appears.
b) Select the start time. The time appears in the Start Date box.
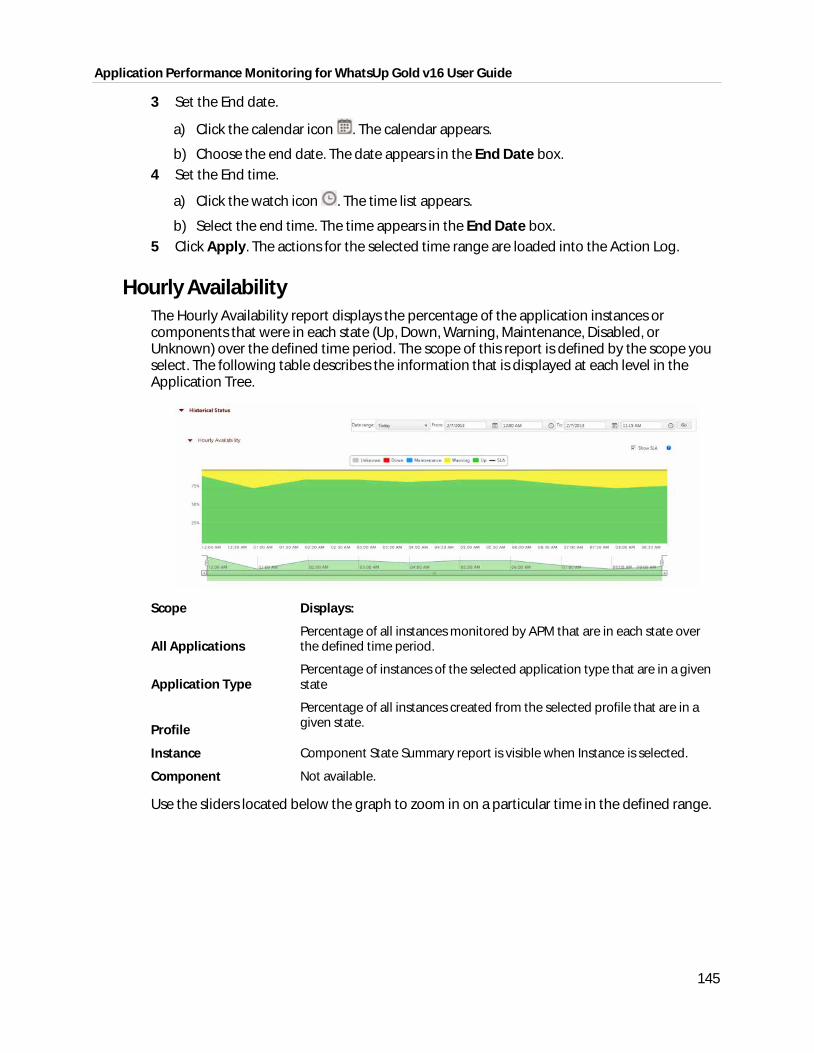
Application Performance Monitoring for WhatsUp Gold v16 User Guide
145
3 Set the End date.
a) Click the calendar icon . The calendar appears.
b) Choose the end date. The date appears in the End Date box. 4 Set the End time.
a) Click the watch icon . The time list appears.
b) Select the end time. The time appears in the End Date box. 5 Click Apply. The actions for the selected time range are loaded into the Action Log.
Hourly Availability The Hourly Availability report displays the percentage of the application instances or components that were in each state (Up, Down, Warning, Maintenance, Disabled, or Unknown) over the defined time period. The scope of this report is defined by the scope you select. The following table describes the information that is displayed at each level in the Application Tree.
Scope Displays:
All Applications Percentage of all instances monitored by APM that are in each state over the defined time period.
Application Type Percentage of instances of the selected application type that are in a given state
Profile
Percentage of all instances created from the selected profile that are in a given state.
Instance Component State Summary report is visible when Instance is selected.
Component Not available.
Use the sliders located below the graph to zoom in on a particular time in the defined range.
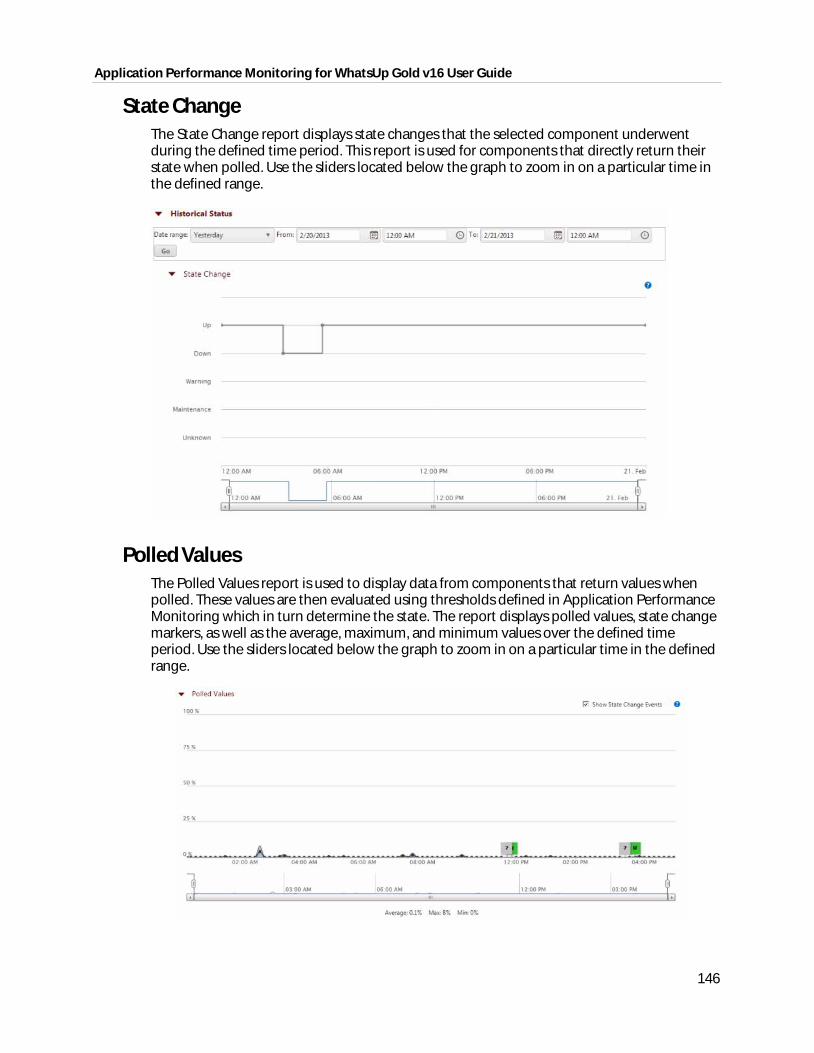
Application Performance Monitoring for WhatsUp Gold v16 User Guide
146
State Change The State Change report displays state changes that the selected component underwent during the defined time period. This report is used for components that directly return their state when polled. Use the sliders located below the graph to zoom in on a particular time in the defined range.
Polled Values The Polled Values report is used to display data from components that return values when polled. These values are then evaluated using thresholds defined in Application Performance Monitoring which in turn determine the state. The report displays polled values, state change markers, as well as the average, maximum, and minimum values over the defined time period. Use the sliders located below the graph to zoom in on a particular time in the defined range.
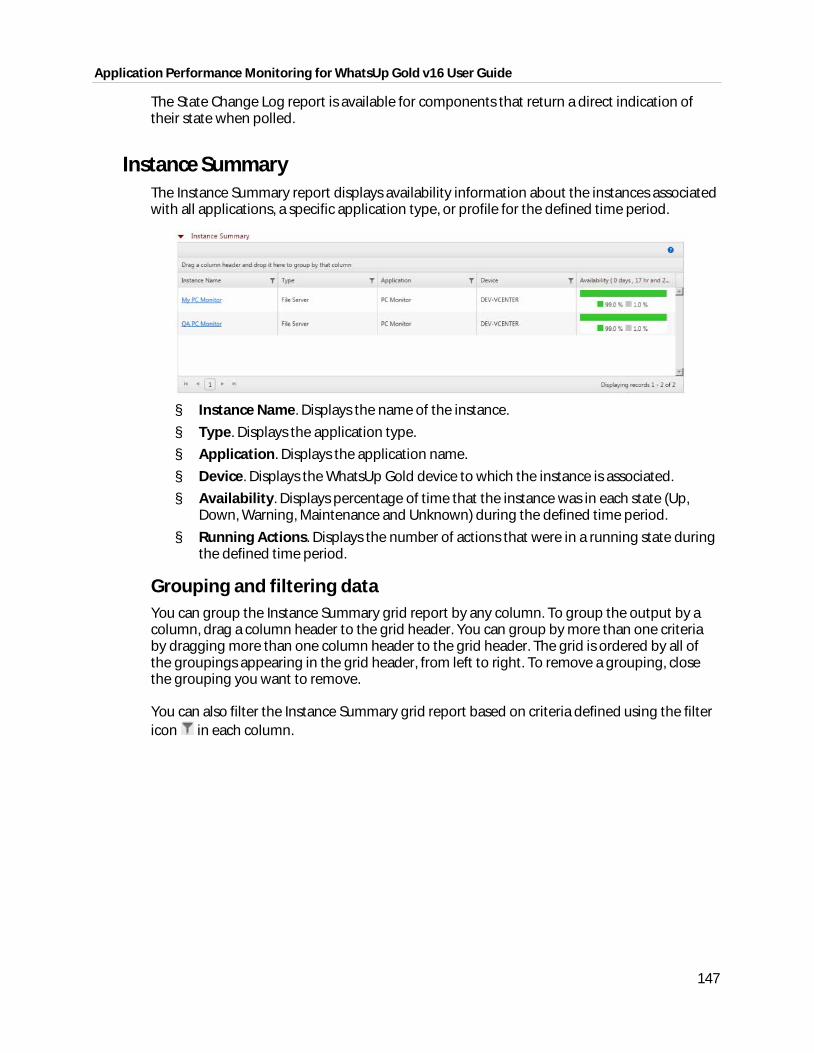
Application Performance Monitoring for WhatsUp Gold v16 User Guide
147
The State Change Log report is available for components that return a direct indication of their state when polled.
Instance Summary The Instance Summary report displays availability information about the instances associated with all applications, a specific application type, or profile for the defined time period.
§ Instance Name. Displays the name of the instance.
§ Type. Displays the application type.
§ Application. Displays the application name.
§ Device. Displays the WhatsUp Gold device to which the instance is associated.
§ Availability. Displays percentage of time that the instance was in each state (Up, Down, Warning, Maintenance and Unknown) during the defined time period.
§ Running Actions. Displays the number of actions that were in a running state during the defined time period.
Grouping and filtering data You can group the Instance Summary grid report by any column. To group the output by a column, drag a column header to the grid header. You can group by more than one criteria by dragging more than one column header to the grid header. The grid is ordered by all of the groupings appearing in the grid header, from left to right. To remove a grouping, close the grouping you want to remove.
You can also filter the Instance Summary grid report based on criteria defined using the filter icon in each column.
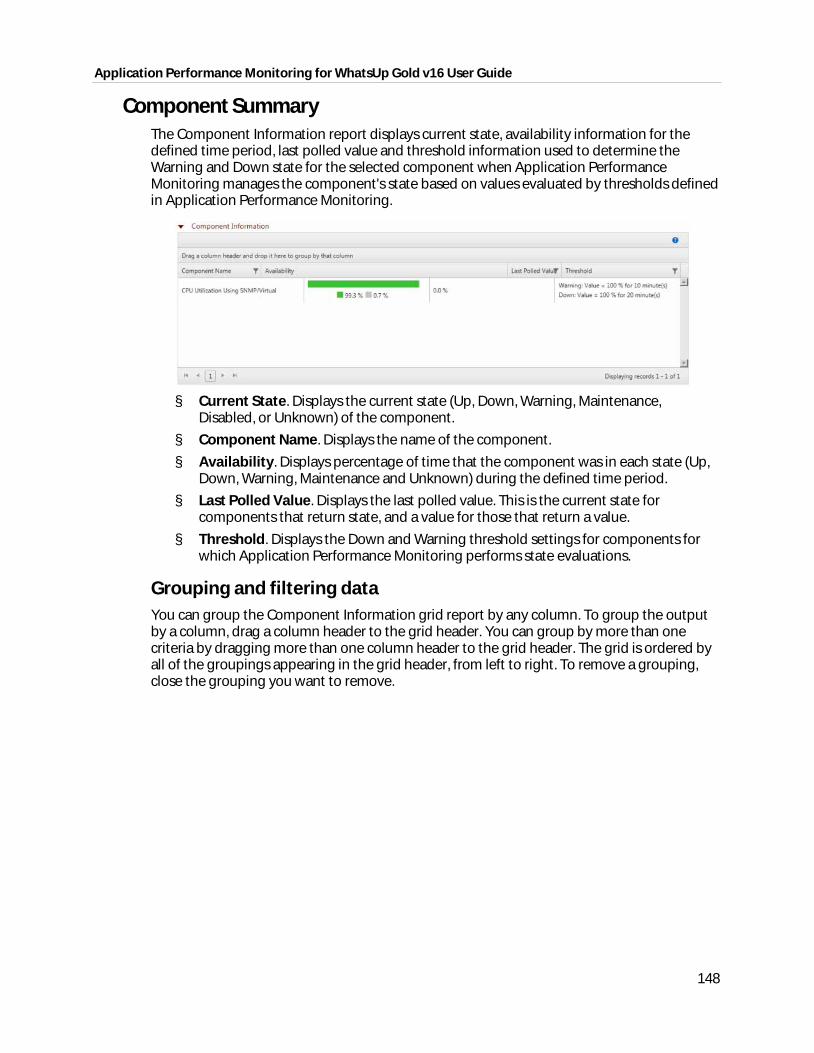
Application Performance Monitoring for WhatsUp Gold v16 User Guide
148
Component Summary The Component Information report displays current state, availability information for the defined time period, last polled value and threshold information used to determine the Warning and Down state for the selected component when Application Performance Monitoring manages the component's state based on values evaluated by thresholds defined in Application Performance Monitoring.
§ Current State. Displays the current state (Up, Down, Warning, Maintenance,
Disabled, or Unknown) of the component.
§ Component Name. Displays the name of the component.
§ Availability. Displays percentage of time that the component was in each state (Up, Down, Warning, Maintenance and Unknown) during the defined time period.
§ Last Polled Value. Displays the last polled value. This is the current state for components that return state, and a value for those that return a value.
§ Threshold. Displays the Down and Warning threshold settings for components for which Application Performance Monitoring performs state evaluations.
Grouping and filtering data You can group the Component Information grid report by any column. To group the output by a column, drag a column header to the grid header. You can group by more than one criteria by dragging more than one column header to the grid header. The grid is ordered by all of the groupings appearing in the grid header, from left to right. To remove a grouping, close the grouping you want to remove.
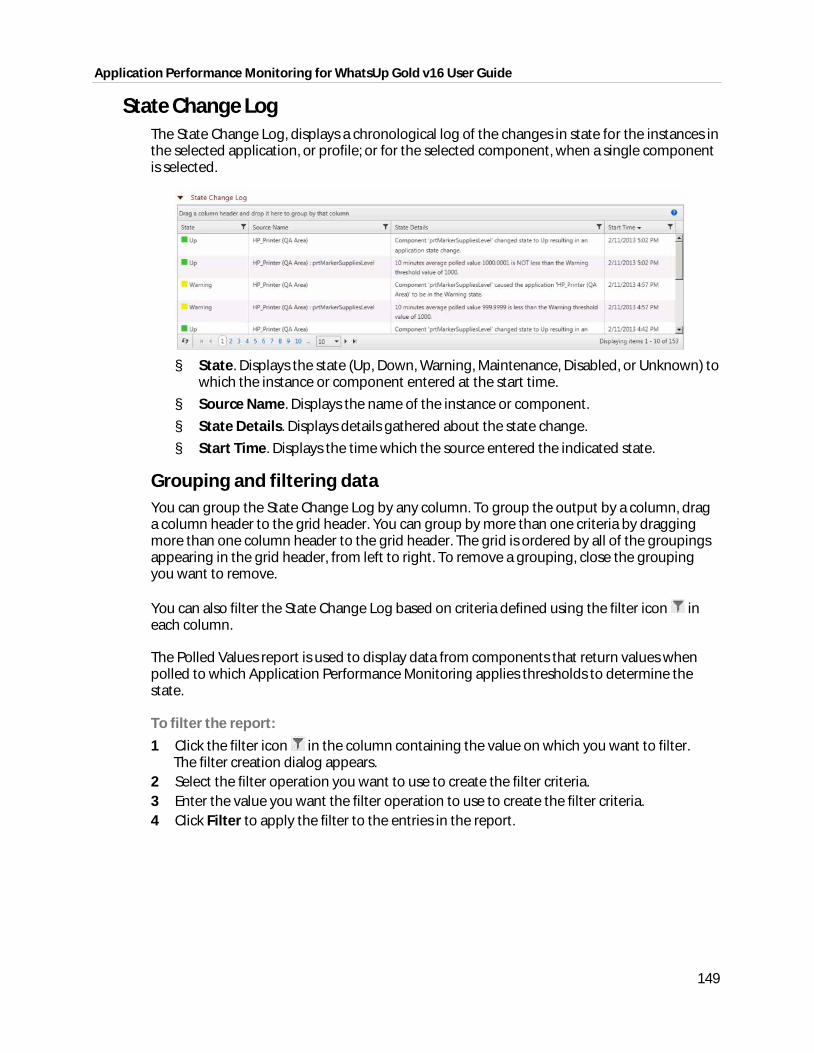
Application Performance Monitoring for WhatsUp Gold v16 User Guide
149
State Change Log The State Change Log, displays a chronological log of the changes in state for the instances in the selected application, or profile; or for the selected component, when a single component is selected.
§ State. Displays the state (Up, Down, Warning, Maintenance, Disabled, or Unknown) to
which the instance or component entered at the start time.
§ Source Name. Displays the name of the instance or component.
§ State Details. Displays details gathered about the state change.
§ Start Time. Displays the time which the source entered the indicated state.
Grouping and filtering data You can group the State Change Log by any column. To group the output by a column, drag a column header to the grid header. You can group by more than one criteria by dragging more than one column header to the grid header. The grid is ordered by all of the groupings appearing in the grid header, from left to right. To remove a grouping, close the grouping you want to remove.
You can also filter the State Change Log based on criteria defined using the filter icon in each column.
The Polled Values report is used to display data from components that return values when polled to which Application Performance Monitoring applies thresholds to determine the state.
To filter the report:
1 Click the filter icon in the column containing the value on which you want to filter. The filter creation dialog appears.
2 Select the filter operation you want to use to create the filter criteria. 3 Enter the value you want the filter operation to use to create the filter criteria. 4 Click Filter to apply the filter to the entries in the report.
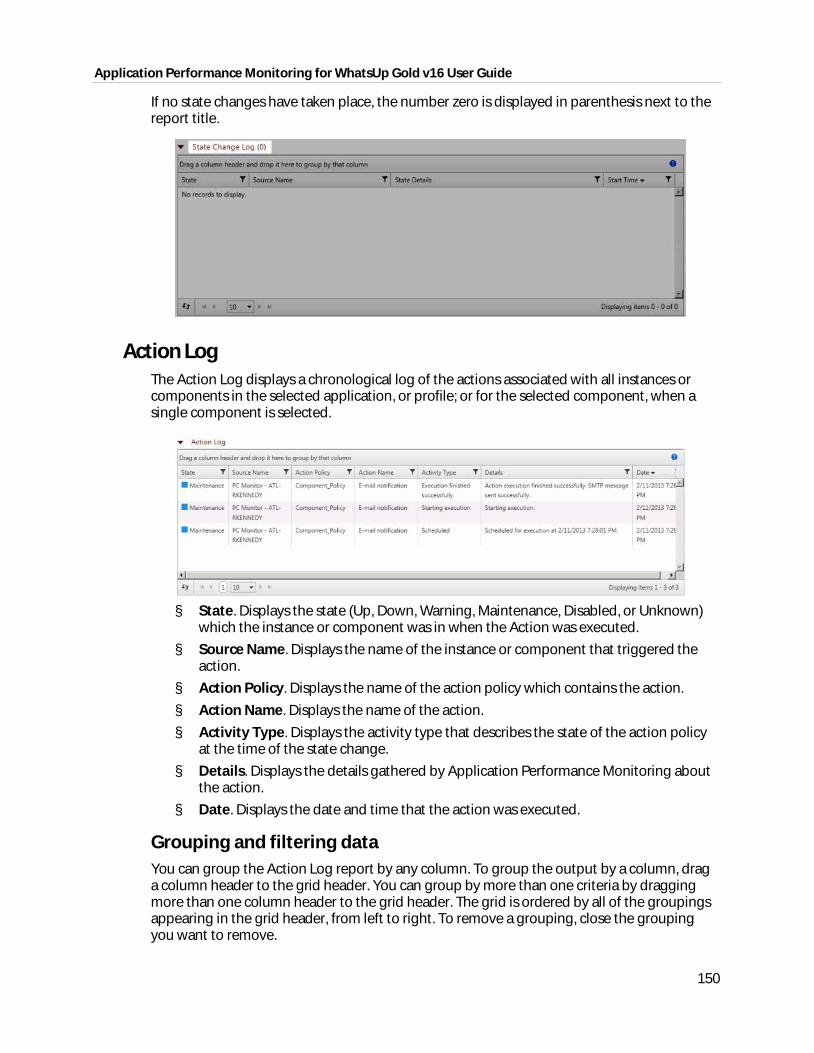
Application Performance Monitoring for WhatsUp Gold v16 User Guide
150
If no state changes have taken place, the number zero is displayed in parenthesis next to the report title.
Action Log The Action Log displays a chronological log of the actions associated with all instances or components in the selected application, or profile; or for the selected component, when a single component is selected.
§ State. Displays the state (Up, Down, Warning, Maintenance, Disabled, or Unknown)
which the instance or component was in when the Action was executed.
§ Source Name. Displays the name of the instance or component that triggered the action.
§ Action Policy. Displays the name of the action policy which contains the action.
§ Action Name. Displays the name of the action.
§ Activity Type. Displays the activity type that describes the state of the action policy at the time of the state change.
§ Details. Displays the details gathered by Application Performance Monitoring about the action.
§ Date. Displays the date and time that the action was executed.
Grouping and filtering data You can group the Action Log report by any column. To group the output by a column, drag a column header to the grid header. You can group by more than one criteria by dragging more than one column header to the grid header. The grid is ordered by all of the groupings appearing in the grid header, from left to right. To remove a grouping, close the grouping you want to remove.
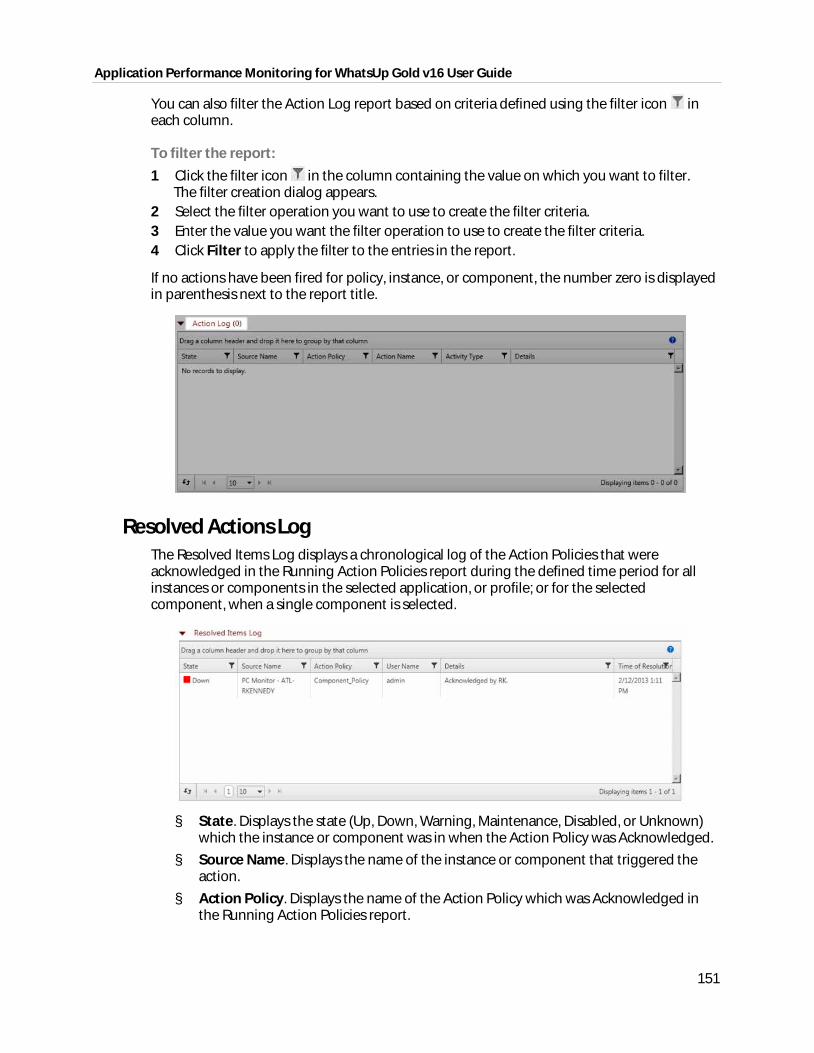
Application Performance Monitoring for WhatsUp Gold v16 User Guide
151
You can also filter the Action Log report based on criteria defined using the filter icon in each column.
To filter the report:
1 Click the filter icon in the column containing the value on which you want to filter. The filter creation dialog appears.
2 Select the filter operation you want to use to create the filter criteria. 3 Enter the value you want the filter operation to use to create the filter criteria. 4 Click Filter to apply the filter to the entries in the report.
If no actions have been fired for policy, instance, or component, the number zero is displayed in parenthesis next to the report title.
Resolved Actions Log The Resolved Items Log displays a chronological log of the Action Policies that were acknowledged in the Running Action Policies report during the defined time period for all instances or components in the selected application, or profile; or for the selected component, when a single component is selected.
§ State. Displays the state (Up, Down, Warning, Maintenance, Disabled, or Unknown)
which the instance or component was in when the Action Policy was Acknowledged.
§ Source Name. Displays the name of the instance or component that triggered the action.
§ Action Policy. Displays the name of the Action Policy which was Acknowledged in the Running Action Policies report.
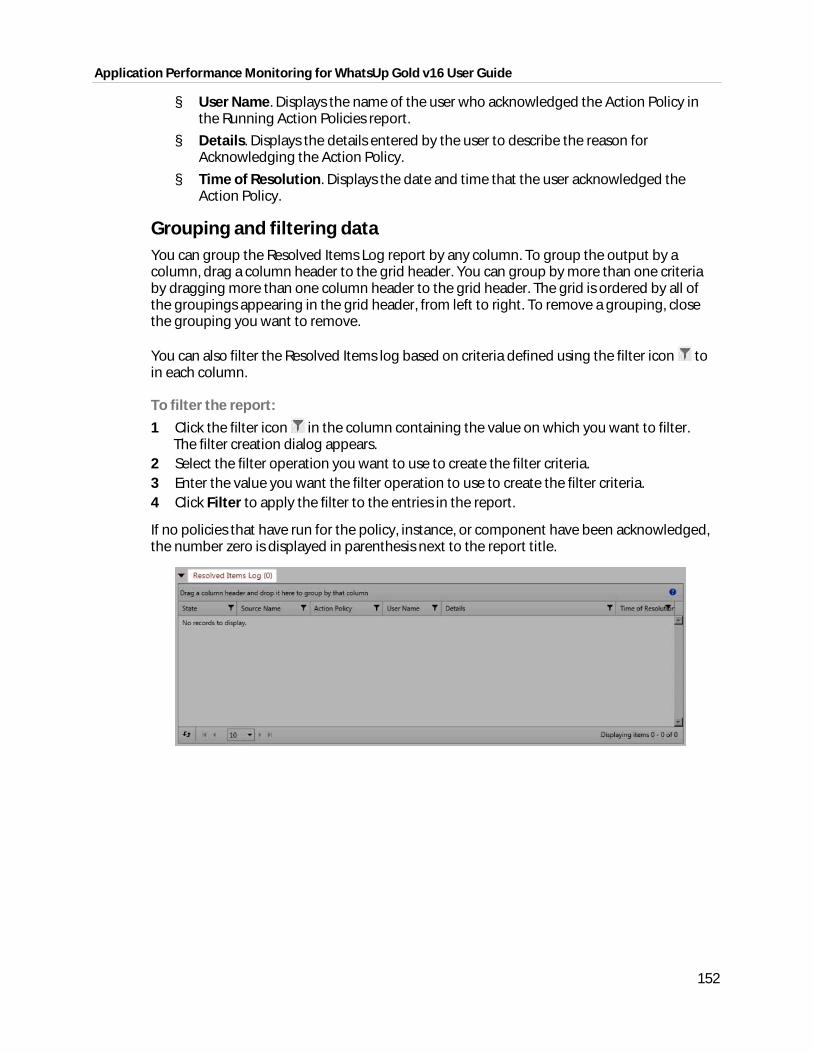
Application Performance Monitoring for WhatsUp Gold v16 User Guide
152
§ User Name. Displays the name of the user who acknowledged the Action Policy in the Running Action Policies report.
§ Details. Displays the details entered by the user to describe the reason for Acknowledging the Action Policy.
§ Time of Resolution. Displays the date and time that the user acknowledged the Action Policy.
Grouping and filtering data You can group the Resolved Items Log report by any column. To group the output by a column, drag a column header to the grid header. You can group by more than one criteria by dragging more than one column header to the grid header. The grid is ordered by all of the groupings appearing in the grid header, from left to right. To remove a grouping, close the grouping you want to remove.
You can also filter the Resolved Items log based on criteria defined using the filter icon to in each column.
To filter the report:
1 Click the filter icon in the column containing the value on which you want to filter. The filter creation dialog appears.
2 Select the filter operation you want to use to create the filter criteria. 3 Enter the value you want the filter operation to use to create the filter criteria. 4 Click Filter to apply the filter to the entries in the report.
If no policies that have run for the policy, instance, or component have been acknowledged, the number zero is displayed in parenthesis next to the report title.
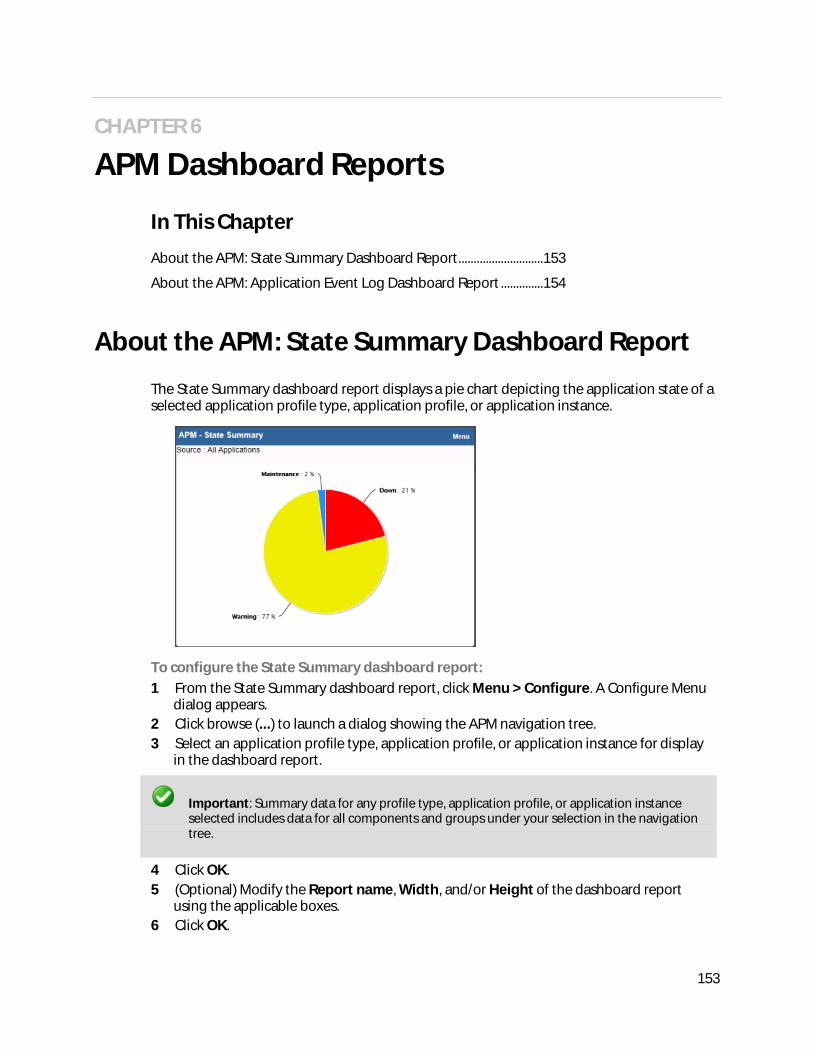
153
CHAPTER 6
APM Dashboard Reports
In This Chapter
About the APM: State Summary Dashboard Report ............................ 153
About the APM: Application Event Log Dashboard Report .............. 154
About the APM: State Summary Dashboard Report
The State Summary dashboard report displays a pie chart depicting the application state of a selected application profile type, application profile, or application instance.
To configure the State Summary dashboard report: 1 From the State Summary dashboard report, click Menu > Configure. A Configure Menu
dialog appears. 2 Click browse (...) to launch a dialog showing the APM navigation tree. 3 Select an application profile type, application profile, or application instance for display
in the dashboard report.
Important: Summary data for any profile type, application profile, or application instance selected includes data for all components and groups under your selection in the navigation tree.
4 Click OK. 5 (Optional) Modify the Report name, Width, and/or Height of the dashboard report
using the applicable boxes. 6 Click OK.
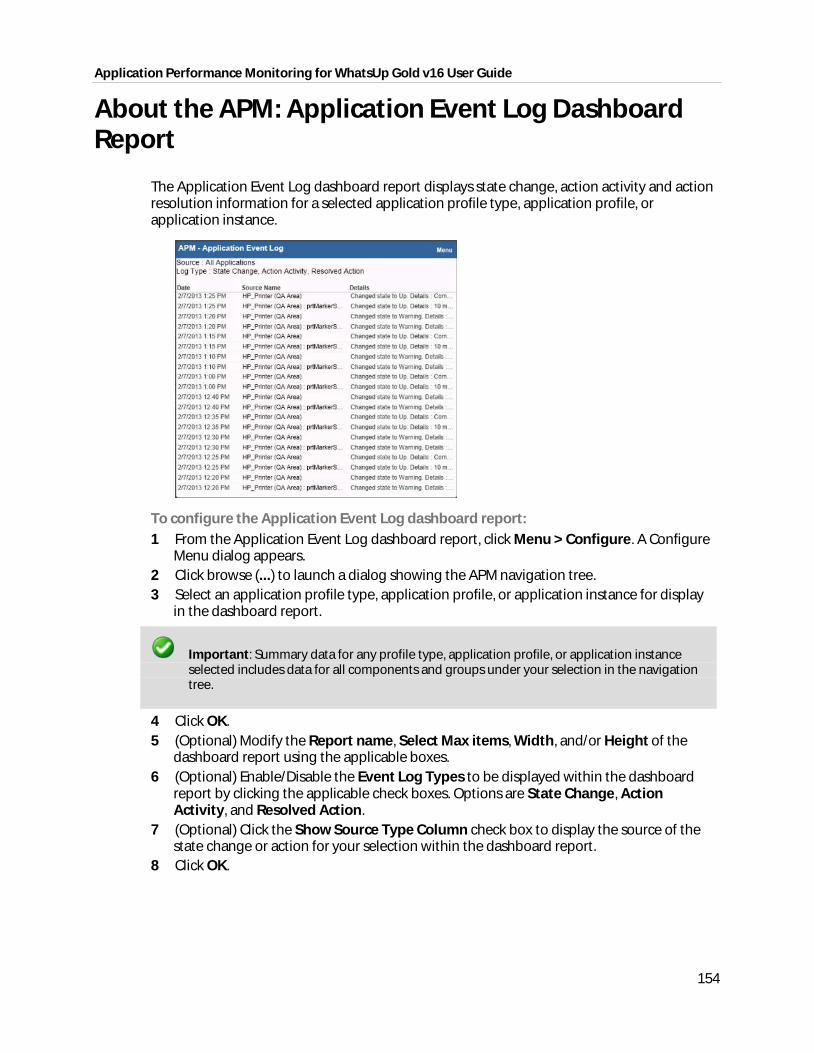
Application Performance Monitoring for WhatsUp Gold v16 User Guide
154
About the APM: Application Event Log Dashboard Report
The Application Event Log dashboard report displays state change, action activity and action resolution information for a selected application profile type, application profile, or application instance.
To configure the Application Event Log dashboard report: 1 From the Application Event Log dashboard report, click Menu > Configure. A Configure
Menu dialog appears. 2 Click browse (...) to launch a dialog showing the APM navigation tree. 3 Select an application profile type, application profile, or application instance for display
in the dashboard report.
Important: Summary data for any profile type, application profile, or application instance selected includes data for all components and groups under your selection in the navigation tree.
4 Click OK. 5 (Optional) Modify the Report name, Select Max items, Width, and/or Height of the
dashboard report using the applicable boxes. 6 (Optional) Enable/Disable the Event Log Types to be displayed within the dashboard
report by clicking the applicable check boxes. Options are State Change, Action Activity, and Resolved Action.
7 (Optional) Click the Show Source Type Column check box to display the source of the state change or action for your selection within the dashboard report.
8 Click OK.
155
CHAPTER 7
Application Performance Monitoring Application Settings
In This Chapter
Configuring APM application settings ...................................................... 155
Configuring APM application settings
The Application Performance Monitoring Application Settings page allows you to configure application states and set APM-specific data retention schedules.
To access Application Performance Monitoring Application Settings:
1 Click the Application Settings icon in the upper-right corner of the page and click Application Settings. The Application Settings interface appears.
2 Click Application Performance Management under Application Settings.
You can configure APM to report certain application states as either Up or Down. These states are:
§ Warning
§ Maintenance
§ Unknown
The default setting for all three is Up.
To modify how SLA-related reports are displayed: 1 Determine one or more reporting states you want to change. 2 Select Up or Down from the list to the right of each state. 3 Click Save. Applications in the applicable state are now reported as either Up or Down
depending on your selection.
You can also configure APM to retain multiple data types for a specific duration. These data types are:
§ Hourly
§ Raw
§ Action log
§ Resolved Items log
§ State change log
Application Performance Monitoring for WhatsUp Gold v16 User Guide
156
The default setting for all three is 90 days.
To modify data retention schedules: 1 Determine one or more data types for which you want to change the duration of
retention. 2 Enter the number of days in the data entry boxes to the right of each applicable data
type. 3 Click Save.
Important: If the APM Application Settings Component and group data check box is selected, reporting and log activity for any application profile or profile type selected on the APM Status tab includes data for all components and groups under your selection in the navigation tree. Deselecting this check box increases performance of the APM Status page.
157
CHAPTER 8
Finding more information and updates
In This Chapter
For more information and updates............................................................ 157
Copyright notice ............................................................................................... 158
For more information and updates
The following are information resources for Application Performance Monitoring. This information may be periodically updated and available on the WhatsUp Gold website.
§ Release Notes. The release notes provide an overview of changes, known issues, and bug fixes for the current release. The release notes are available on the WhatsUp Gold web site (http://www.whatsupgold.com/WUG161releasenotes).
§ Application Help. The console help contains dialog assistance, general configuration information, how-to's that explain how to use Application Performance Monitoring's features. The Table of Contents is organized by functional area, and can be accessed
by clicking the Application Settings icon in the upper-right corner of the page and clicking Help, and by clicking Help in Application Performance Monitoring dialogs.
§ WUGSpace community. WUGspace is an WhatsUp Gold IT community centered around valuable technical content for network engineers, IT managers, Architects, and System Administrators. Visit the community for additional product information and help, learn from other users, submit product ideas, and more. Visit the WhatsUp Gold forum on the WUGspace community site (http://www.whatsupgold.com/wugspace).
§ Additional WhatsUp Gold resources. For a list of current and previous guides and help available for WhatsUp Gold products, see the WhatsUp Gold web site (http://www.whatsupgold.com/support/guides.aspx).
§ Licensing Information. Licensing and support information is available on the WhatsUp Customer Portal (http://www.whatsupgold.com/wugCustPortal). The web portal provides enhanced web-based capabilities to view and manage Ipswitch product licenses.
§ Technical Support. Use the WhatsUp Gold Support Site for a variety of WhatsUp Gold product help resources. From here you can view product documentation, search Knowledge Base articles, access the community site for help from other users, and get other Technical Support information. The Support Site is available on the WhatsUp Gold web site (http://www.whatsupgold.com/support/index.aspx).

Application Performance Monitoring for WhatsUp Gold v16 User Guide
158
Copyright notice
©1991-2013 Ipswitch, Inc. All rights reserved.
This document, as well as the software described in it, is furnished under license and may be used or copied only in accordance with the terms of such license. Except as permitted by such license, no part of this publication may be reproduced, photocopied, stored on a retrieval system, or transmitted, in any form or by any means, electronic, mechanical, recording, or otherwise, without the expressed prior written consent of Ipswitch, Inc.
The content of this document is furnished for informational use only, is subject to change without notice, and should not be construed as a commitment by Ipswitch, Inc. While every effort has been made to assure the accuracy of the information contained herein, Ipswitch, Inc. assumes no responsibility for errors or omissions. Ipswitch, Inc., also assumes no liability for damages resulting from the use of the information contained in this document.
IMail, the IMail logo, WhatsUp, the WhatsUp Gold logo, WS_FTP, the WS_FTP logos, Ipswitch, and the Ipswitch logo are trademarks of Ipswitch, Inc. Portions of Telerik Extensions for ASP.NET MVC ©2002-2012 by Telerik Corporation. All rights reserved. Other products and their brands or company names, are or may be trademarks or registered trademarks, and are the property of their respective companies.
This document was published on Thursday, February 28, 2013 at 08:27.


![WhatsUp Gold v16 - Ipswitch · WhatsUp Gold v16.3 Database Migration ... See Executing SQL statements against the WhatsUp Gold database ... EXECUTE [sys]. [sp ...](https://static.fdocuments.net/doc/165x107/5b31f8547f8b9adf6c8bb1ed/whatsup-gold-v16-ipswitch-whatsup-gold-v163-database-migration-see-executing.jpg)