Application of Ultrasonic Guided Waves for … 2005 NASA/TM-2005-213520 ARL-TR-3384 Application of...
32
January 2005 NASA/TM-2005-213520 ARL-TR-3384 Application of Ultrasonic Guided Waves for Evaluating Aging Wire Insulation Robert F. Anastasi U.S. Army Research Laboratory Vehicle Technology Directorate Langley Research Center, Hampton, Virginia Eric I. Madaras Langley Research Center, Hampton, Virginia https://ntrs.nasa.gov/search.jsp?R=20050061204 2018-07-07T03:27:23+00:00Z
Transcript of Application of Ultrasonic Guided Waves for … 2005 NASA/TM-2005-213520 ARL-TR-3384 Application of...

January 2005
NASA/TM-2005-213520
ARL-TR-3384
Application of Ultrasonic Guided Waves for
Evaluating Aging Wire Insulation
Robert F. Anastasi
U.S. Army Research Laboratory
Vehicle Technology Directorate
Langley Research Center, Hampton, Virginia
Eric I. Madaras
Langley Research Center, Hampton, Virginia
https://ntrs.nasa.gov/search.jsp?R=20050061204 2018-07-07T03:27:23+00:00Z

The NASA STI Program Office . . . in Profile
Since its founding, NASA has been dedicated to the
advancement of aeronautics and space science. The
NASA Scientific and Technical Information (STI)
Program Office plays a key part in helping NASA
maintain this important role.
The NASA STI Program Office is operated by
Langley Research Center, the lead center for NASA’s
scientific and technical information. The NASA STI
Program Office provides access to the NASA STI
Database, the largest collection of aeronautical and
space science STI in the world. The Program Office is
also NASA’s institutional mechanism for
disseminating the results of its research and
development activities. These results are published by
NASA in the NASA STI Report Series, which
includes the following report types:
• TECHNICAL PUBLICATION. Reports of
completed research or a major significant phase
of research that present the results of NASA
programs and include extensive data or
theoretical analysis. Includes compilations of
significant scientific and technical data and
information deemed to be of continuing
reference value. NASA counterpart of peer-
reviewed formal professional papers, but having
less stringent limitations on manuscript length
and extent of graphic presentations.
• TECHNICAL MEMORANDUM. Scientific
and technical findings that are preliminary or of
specialized interest, e.g., quick release reports,
working papers, and bibliographies that contain
minimal annotation. Does not contain extensive
analysis.
• CONTRACTOR REPORT. Scientific and
technical findings by NASA-sponsored
contractors and grantees.
• CONFERENCE PUBLICATION. Collected
papers from scientific and technical
conferences, symposia, seminars, or other
meetings sponsored or co-sponsored by NASA.
• SPECIAL PUBLICATION. Scientific,
technical, or historical information from NASA
programs, projects, and missions, often
concerned with subjects having substantial
public interest.
• TECHNICAL TRANSLATION. English-
language translations of foreign scientific and
technical material pertinent to NASA’s mission.
Specialized services that complement the STI
Program Office’s diverse offerings include creating
custom thesauri, building customized databases,
organizing and publishing research results ... even
providing videos.
For more information about the NASA STI Program
Office, see the following:
• Access the NASA STI Program Home Page at
http://www.sti.nasa.gov
• E-mail your question via the Internet to
• Fax your question to the NASA STI Help Desk
at (301) 621-0134
• Phone the NASA STI Help Desk at
(301) 621-0390
• Write to:
NASA STI Help Desk
NASA Center for AeroSpace Information
7121 Standard Drive
Hanover, MD 21076-1320
National Aeronautics and
Space Administration
Langley Research Center
Hampton, Virginia 23681-2199
January 2005
NASA/TM-2005-213520
ARL-TR-3384
Application of Ultrasonic Guided Waves for
Evaluating Aging Wire Insulation
Robert F. Anastasi
U.S. Army Research Laboratory
Vehicle Technology Directorate
Langley Research Center, Hampton, Virginia
Eric I. Madaras
Langley Research Center, Hampton, Virginia

Available from:
NASA Center for AeroSpace Information (CASI) National Technical Information Service (NTIS)
7121 Standard Drive 5285 Port Royal Road
Hanover, MD 21076-1320 Springfield, VA 22161-2171
(301) 621-0390 (703) 605-6000
The use of trademarks or names of manufacturers in the report is for accurate reporting and does not
constitute an official endorsement, either expressed or implied, of such products or manufacturers by the
National Aeronautics and Space Administration or the U.S. Army.
1
ABSTRACT
Aging wiring has become a critical issue to the aerospace and aircraft industries due to
Shuttle and aircraft incidents. The problem is that over time the insulation on wire
becomes brittle and cracks. This exposes the underlying conductive wire to the potential
for short circuits and fire. The development of methods to quantify and monitor aging
wire insulation is highly warranted. Popular methods of monitoring aging wire problems
focuses on applying electrical sensing techniques that are sensitive to the conductor's
condition, but not very sensitive to the wire insulation's condition. Measurement of wire
insulation stiffness and ultrasonic properties by ultrasonic guided waves is being
examined. Initial laboratory tests were performed on a simple model consisting of a solid
cylinder and then a solid cylinder with a polymer coating. Experimental measurements
showed that the lowest order extensional mode could be sensitive to stiffness changes in
the wire insulation. To test this theory conventional wire samples (typically found in
aircraft) were heat-damaged in an oven, in a range of heating conditions. The samples
were 12, 16, and 20 gauge and the heat damage introduced material changes in the wire
insulation that made the originally flexible insulation brittle and darker in color.
Extensional mode phase velocity increased for the samples that were exposed to heat for
longer duration. The flexural mode was also examined as a means of measuring the
insulation condition, but proved to be limited in application. Tensile tests were conducted
on wire samples to measure stiffness changes. The trend of the tensile tests compared
well to extensional mode measurements. Although the heat-damage conditions may be
more extreme than environmental aging, indications are that this method has the potential
to detect and quantify degradation in wire insulation.
2
INTRODUCTION
Electrical wiring is critical to the operation of most modern-day equipment. Wiring is
subjected to heat, cold, moisture, stress, and vibrations, which can eventually cause the
wire insulation and even the wire conductor to age and possibly fail. In most cases these
environmental and operational conditions are modest and the wire conductor remains
intact. Over time or when conditions are extreme, wire insulation may become brittle and
crack or be damaged in such a manner to expose the wire conductor and become a
potential source for instrumentation failure, short circuits, smoke, and fire. Generally,
wire inspections are done visually and often after-the-fact in response to an instrument or
system failure, the visual inspection may find cracks and burns, but offers little
quantitative information about the condition of the wire insulation.
In attempts to measure the wire and wire insulation condition some efforts have been
made to adapting electrical sensing systems such as Time Domain Reflectometry,
Standing Wave Reflectometry, Frequency Domain Reflectometry, and resistance tests
(Furse and Haupt, 2001). Other efforts are investigating the application of dielectric
sensors, chemical sensors, thermographic methods, indentation methods (hardness
testers), and reported on here, ultrasonic methods. All of these methods may have unique
characteristics that could play a role in evaluating aging wire.
The ultrasonic method concept is to generate an ultrasonic guided wave that will travel
down an insulated wire. Part of the wave will travel in the wire and part in the wire
insulation. Assuming the wire condition remains constant, then the condition of the wire
insulation and its stiffness will affect the overall wave speed and amplitude of the guided
wave. Thus, a measurement of wave speed will, in part, be an indication of material
stiffness or wire insulation condition. For experimental purposes, the insulated wire may
be considered a cylindrical wave-guide or a clad rod, where the wire conductor is the core
and the wire insulation is the cladding. A number of researchers have examined acoustic
guided wave propagation in a cylindrical geometry (Meeker and Meitzler, 1964),
(Thurston, 1978), (McNiven, et al., 1963), (Abramson, 1957), and (Rose, 1999) and for
detailed analysis the reader is referred to these papers. In general the analysis focuses on
deriving the nature of the elastic wave propagation. The core and cladding materials are
assumed to be homogeneous, isotropic, and elastic and bonded at their interface. A
solution for the displacements in the two materials is obtained, based on the linear elastic
theory and the frequency equation is obtained from which dispersion curves are
generated. In general many acoustic wave modes will propagate in an isotropic cylinder.
The characteristics of the wave mode are a function of material property, geometry,
frequency, propagation order, and circumferential order. Modes with circumferential
order of zero are axisymmetric modes and are referred to as extensional modes. The first
branch of the extensional mode is designated by the symbol L(0,1), while higher
branches are designated as L(0,2), L(0,3), etc. Modes of circumferential order one are
antisymmetric, ordinarily called flexural modes. The first branch is designated by the
symbol F(1,1) and higher branches are designated as F(1,2), F(1,3) etc. (Thurston, 1978).
The extensional mode extends to zero frequency where the limiting phase velocity is
called the bar velocity. In the low frequency regime, the range where the extensional

3
mode phase velocity is relatively constant, this mode is nearly nondispersive. As
frequency increases, the phase velocity drops to a value slightly below the Rayleigh wave
velocity and then approaches the Rayleigh wave velocity at higher frequencies (Thurston,
1978). The flexural mode is highly dispersive in the low frequency regime. It approaches
zero as the frequency approaches zero, and it approaches the Rayleigh wave velocity with
increasing frequency. Some applications of ultrasonic guided waves include material
testing or characterization of wire (Madaras, et al., 1992 and 1995) or fibers, and for use
as ultrasonic delay lines.
In this report, the use of ultrasonic guided waves, both extensional and flexural modes, is
examined for their use in detecting degradation in electrical wire insulation. Two
ultrasonic transducers are used in a pitch-catch configuration to generate and receive
ultrasonic guided waves. Tests were conducted on a wire model and then on wire samples
that had been heated in an oven to cause insulation degradation. After ultrasonic testing,
several heat-degraded wire samples were stressed in a small tabletop load frame to
estimate their Young’s modulus. Modulus values were then compared to ultrasonically
measured values. Finally, an ultrasonic measurement tool was designed to simplify the
ultrasonic measurement procedure. Such a tool could be used to assess insulation
degradation and perform NDE on local areas of wire insulation.
SAMPLES
To gain an understanding of the ultrasonic modes generated in cylindrical geometry, the
initial samples were rods of solid aluminum and rods of solid brass. These rods were
then coated with heat shrink tubing to model a typical wire with insulation. Material
properties and geometry of the brass rod and heat shrink tubing used in calculations are
shown in Table I. The longitudinal velocity of the heat shrink tubing was measured using
ultrasonic pulse echo methods and the density was measured through volume and mass
measurements of a small sample. Other values were estimated using these measurements
and tabulated textbook values for thermoplastic material (Gangal and Grot, 1989).
TABLE I. Some material properties and geometry of materials used in wire model.
Material Brass Heat Shrink Tubing
Young’s Modulus (GPa) 108.94 0.72
Density (kg/m3) 8500 958
Poission’s Ratio 0.35 0.46
Long. Velocity (m/s) 4535 1868
Shear Velocity (m/s) 2178 510
Rayleigh Velocity (m/s) 2036 484
Radius (mm) 1.59 2.175

4
TABLE II. Specification of aircraft wires used in experiments.
Wire Type Gauge Conductor Insulation
ID (mm)
Insulation
OD (mm)MIL-W-81381/7
Polyimide (Kapton™)
20 Stranded Silver
Coated Copper
0.942 1.286
MIL-W-81381/21
Polyimide (Kapton™)
16 Stranded Tin
Coated Copper
1.326 1.628
MIL-W-81381/12
Polyimide (Kapton™)
12 Stranded Nickel
Coated Copper
2.086 2.496
MIL-W-22759/34
E-EFTE (Tefzel™)
20 Stranded Tin
Coated Copper
0.942 1.452
MIL-W-22759/34
E-EFTE (Tefzel™)
16 Stranded Tin
Coated Copper
1.326 1.906
MIL-W-22759/34
E-EFTE (Tefzel™)
12 Stranded Tin
Coated Copper
2.086 2.798
MIL-W-22759/87
Polyimide and FEP
(Oasis™)
20 Stranded Nickel
Coated Copper
0.942 1.346
MIL-W-22759/87
Polyimide and FEP
(Oasis™)
16 Stranded Nickel
Coated Copper
1.326 1.742
MIL-W-22759/87
Polyimide and FEP
(Oasis™)
12 Stranded Nickel
Coated Copper
2.086 2.578
Electrical wire samples were 12-, 16-, and 20-gauge aviation class wires with military
specification. Three wire insulation types were used in testing: a MIL-W-81381 wire that
has a polyimide (Kapton®) insulation, a MIL-W-22759/34 wire that has an ethylene-
tetrafluoroethylene (Tefzel®) insulation, and a MIL-W-22759/87 wire that has a
combination of polyimide and fluoroethylene polymer (PTFE) insulation. Some
specifications for these wire types are given in Table II.
A set of wire samples was heated in an oven to mimic aging. It was assumed that heating
would degrade the insulation and eventually cause it to become brittle. This process may
not accurately model thermal aging, but was used to generate a set of samples with
mechanical property variations. Using “aged” as a sample descriptor may be somewhat
misleading, thus the term “heat-damaged” is used.
This first heat-damaged set consisted of a baseline and two heating conditions for each
wire type and wire gauge. These heating conditions, a short and long oven exposure time,
are shown as a function of wire type in Table III. The heating duration and temperature
were arbitrarily chosen to quickly induce heat damage in the wire insulation as indicated
by a physical appearance or color change. It should be noted that the maximum
continuous service temperature of Teflon® Film is 205°C (DuPont, 2003). Thus, the
induced heat damage may include additional physical changes, such as geometrical
variations, and changes in chemical and electrical characteristics. An example of one heat
aged set is shown in Figure 1. This figure shows baseline and heat-damaged

5
MIL-W-22759/34 wire samples. The insulation on the baseline samples was smooth,
flexible, and off-white in color. For the short exposure samples the insulation remained
smooth and flexible, but its color changed to gray, and the insulation for the long
exposure samples became brittle, cracked, and black in color. The appearance of the other
wire sets was similar to the one shown. The insulation on the MIL-W-81381 baseline
samples was smooth, flexible, and yellowish in color. For the short exposure samples the
insulation remained flexible and darkened slightly, and for the long exposure samples the
insulation became brittle and cracked. The insulation on the MIL-W-22759/87 baseline
samples was smooth, flexible, and white. For the short exposure samples the insulation
remained smooth and flexible, but darkened slightly. For the long exposure samples the
insulation cracked and lost its original glossy shine, but remained white.
TABLE III. Oven exposure time and temperature.
Wire Type Baseline Short ExposureTime (hours) / Temp. (°C)
Long ExposureTime (hours) / Temp. (°C)
MIL-W-22759/34 No heat
damage
1 349 1 399
MIL-W-81381 No heat
damage
1 399 49 399
MIL-W-22759/87 No heat
damage
1 399 50 399
FIGURE 1. A close-up of the 16-gauge insulated wire (MIL-W-22759/34) that was heat-
damaged. Top: Baseline, Middle: Short Exposure, Bottom: Long Exposure.
6
A second set of wire samples was heated in an oven at lower temperature and in smaller
incremental steps to examine the heat-damage effect in more detail. Polyimide (MIL-W-
81381) wire samples of each gauge were heated in an oven at 370°C for up to 200 hours.
Samples of various gauges of MIL-W-22759/34 and MIL-W-22759/87 wire were heated
in an oven at 270°C for up to 200 hours. The first samples were removed from the oven
when the set temperature was reached. This group of wires did not remain or dwell at the
set temperature; they only experienced the effects of heating up to the set temperature and
then cooling down. This was different than the baseline that was not exposed to any
heating conditions. Other wire samples of each gauge were removed from the oven, after
dwelling at temperature, about every 3 hours up to 15 hours and then about every
20 hours.
EXPERIMENTS
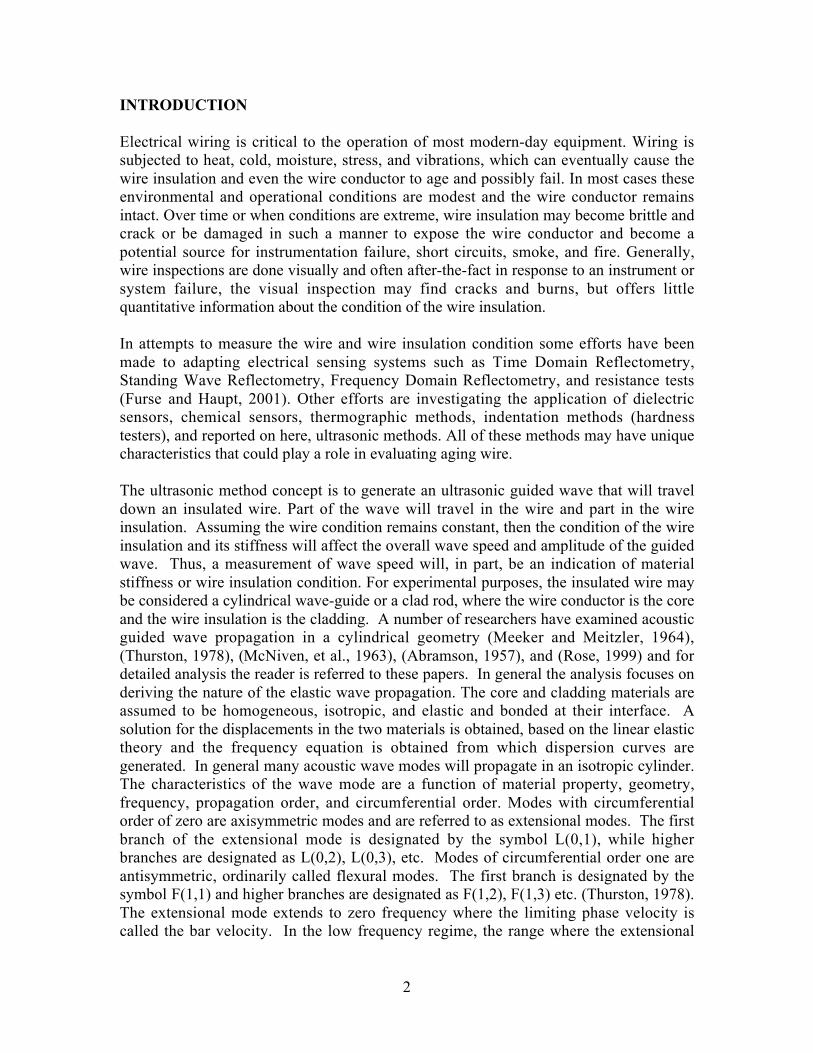
The experimental system is schematically shown in Figure 2. This system consists of
two piezoelectric transducers, ultrasonic pulse generator, a system of ultrasonic pre-amps,
and a digital oscilloscope. The piezoelectric transducers have a bandwidth specified to be
50 kHz to 1.5 MHz. The signal from the ultrasonic receiver is first fed through an
ultrasonic pre-amp with a 20-kHz to 2-MHz bandwidth and a 40- or 60-dB gain and then
through another amplifier with a maximum gain of 42-dB and a bandwidth set at 10 kHz
to 300 kHz. The output of the amplifier was recorded by an 8-bit/500-MHz digitizing
oscilloscope. The signal was averaged 1000 times to improve signal to noise and then
Thin Rod
Receiver
Piezoelectric
Transducerdiameter
Piezoelectric
Transducer
separation
distance
Pre-Amplifier
Oscilloscope
Ultrasonic Pulser
or
Waveform Generator
FIGURE 2. Schematic of experimental setup.

7
recorded for later analysis. The transducers were mechanically attached to the rod or
wire as shown in Figure 3. The clamp face opposite the transducer had a groove
machined in it, to hold the wire along the center of the transducer surface. The
transmitting transducer was driven with an impulse excitation from a commercial
ultrasonic pulser. During measurements, a wire sample, nominally 60 cm (24 inches)
long was held horizontally. One end of the wire was held fixed and the other end was
clamped to a metal rod weighing about 0.45 kg (1 pound). The resulting small tensile
load held the wire straight and stationary while the transducer position along the wire was
varied.
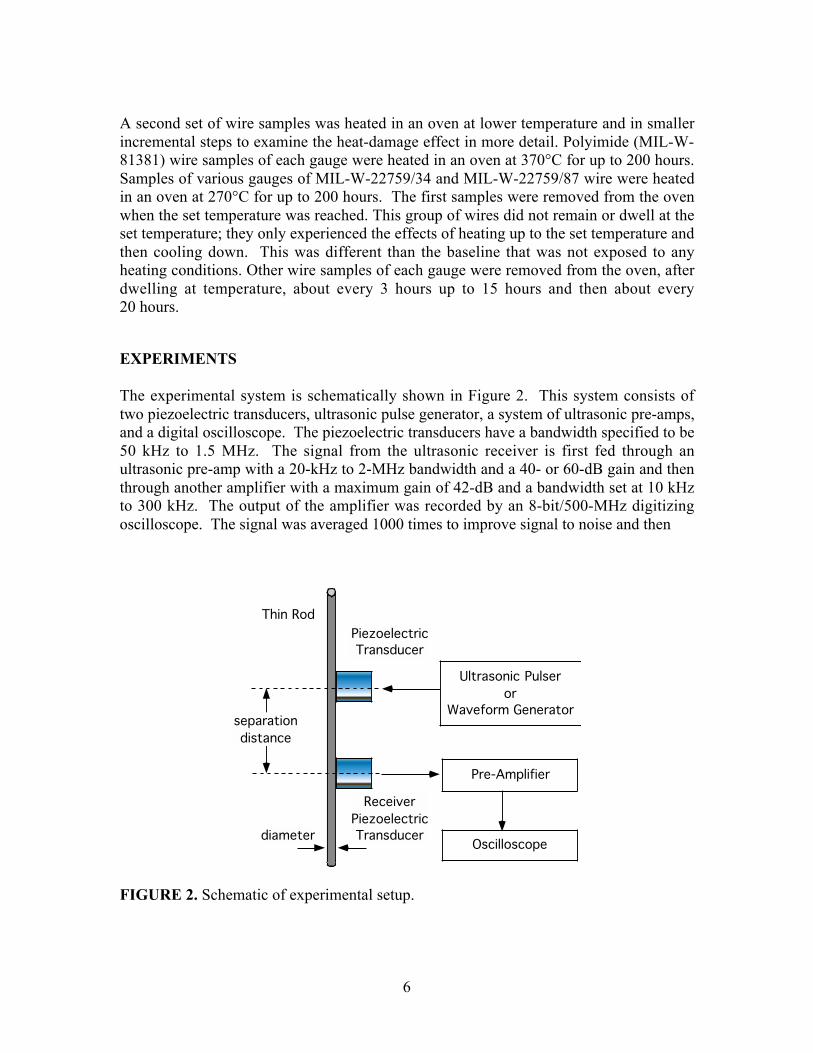
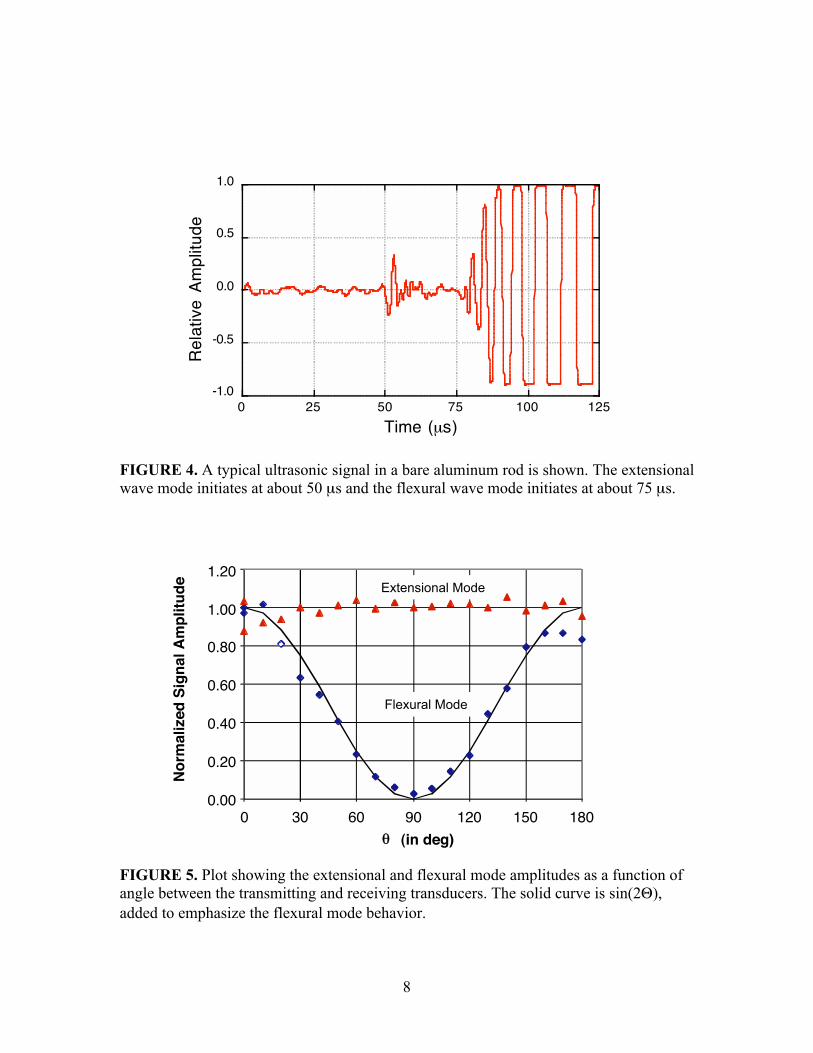
A typical ultrasonic signal in the bare aluminum rod is shown in Figure 4. The smaller
amplitude wave at about 50 µs is the first extensional wave mode and the larger
amplitude wave initiating at about 75 µs is the first flexural wave mode. The amplitude
difference between the extensional and flexural wave modes is consistent with the
geometry of the ultrasonic generation. Since the transmitting receiver is located on the
side of the rod, a larger amplitude bending force is applied to the rod and thus it was
assumed a larger amplitude flexural mode would be generated. This assumption was
checked by examining the signal as a function of rotational angle between the
transmitting and receiving transducers. The transmitting transducer was held stationary
while the receiving transducer rotated around the aluminum rod in increments of 10°. A
plot of the resulting extensional and flexural mode amplitudes is shown in Figure 5. The
extensional mode amplitude is constant and the flexural mode amplitude follows a
cosine-squared shape with a minimum at 90°. This is consistent with the assumption and
the geometry of the loading.
FIGURE 3. Ultrasonic transducers clipped to insulated wire.
8
-1.0
-0.5
0.0
0.5
1.0
0 25 50 75 100 125
Rel
ativ
e A
mpl
itude
Time (µs)
FIGURE 4. A typical ultrasonic signal in a bare aluminum rod is shown. The extensional
wave mode initiates at about 50 µs and the flexural wave mode initiates at about 75 µs.
FIGURE 5. Plot showing the extensional and flexural mode amplitudes as a function of
angle between the transmitting and receiving transducers. The solid curve is sin(2 ),
added to emphasize the flexural mode behavior.
0.00
0.20
0.40
0.60
0.80
1.00
1.20
0 30 60 90 120 150 180
(in deg)
No
rmal
ized
Sig
nal
Am
plit
ud
e Axisymmetric Mode
Flexural Mode
Extensional Mode
Flexural Mode
9
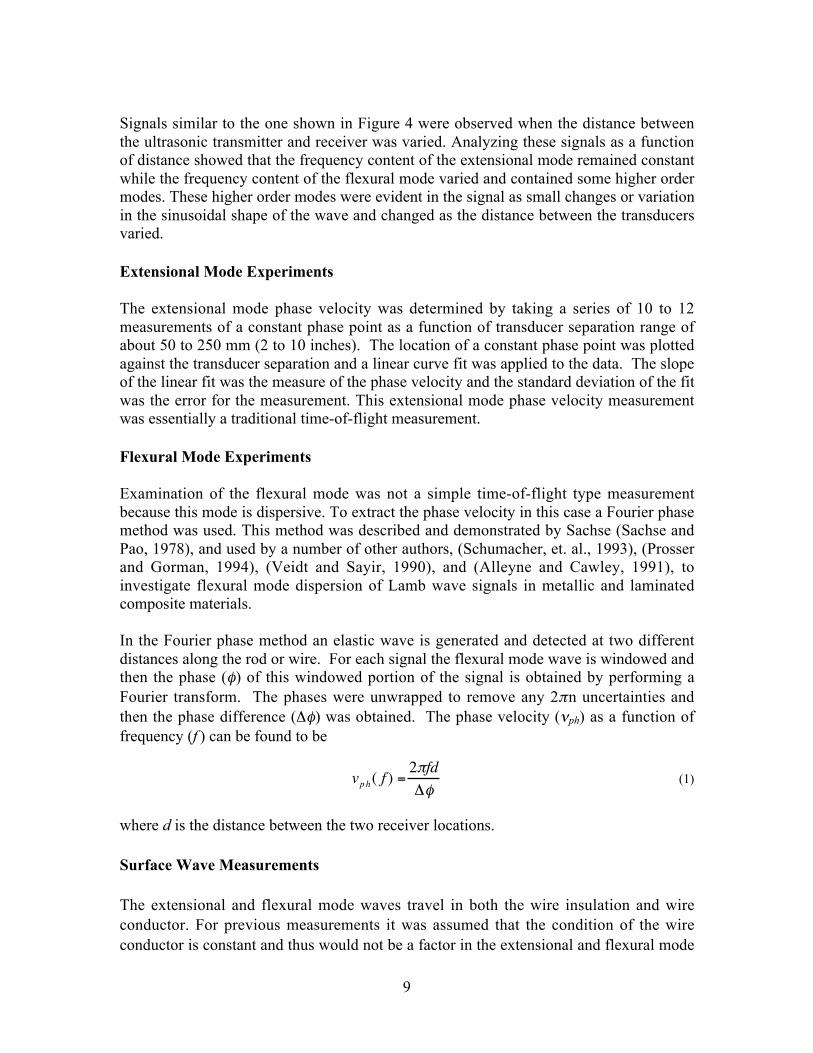
Signals similar to the one shown in Figure 4 were observed when the distance between
the ultrasonic transmitter and receiver was varied. Analyzing these signals as a function
of distance showed that the frequency content of the extensional mode remained constant
while the frequency content of the flexural mode varied and contained some higher order
modes. These higher order modes were evident in the signal as small changes or variation
in the sinusoidal shape of the wave and changed as the distance between the transducers
varied.
Extensional Mode Experiments
The extensional mode phase velocity was determined by taking a series of 10 to 12
measurements of a constant phase point as a function of transducer separation range of
about 50 to 250 mm (2 to 10 inches). The location of a constant phase point was plotted
against the transducer separation and a linear curve fit was applied to the data. The slope
of the linear fit was the measure of the phase velocity and the standard deviation of the fit
was the error for the measurement. This extensional mode phase velocity measurement
was essentially a traditional time-of-flight measurement.
Flexural Mode Experiments
Examination of the flexural mode was not a simple time-of-flight type measurement
because this mode is dispersive. To extract the phase velocity in this case a Fourier phase
method was used. This method was described and demonstrated by Sachse (Sachse and
Pao, 1978), and used by a number of other authors, (Schumacher, et. al., 1993), (Prosser
and Gorman, 1994), (Veidt and Sayir, 1990), and (Alleyne and Cawley, 1991), to
investigate flexural mode dispersion of Lamb wave signals in metallic and laminated
composite materials.
In the Fourier phase method an elastic wave is generated and detected at two different
distances along the rod or wire. For each signal the flexural mode wave is windowed and
then the phase ( ) of this windowed portion of the signal is obtained by performing a
Fourier transform. The phases were unwrapped to remove any 2 n uncertainties and
then the phase difference ( ) was obtained. The phase velocity ( ph) as a function of
frequency (f ) can be found to be
vph( f ) =2 fd
(1)
where d is the distance between the two receiver locations.
Surface Wave Measurements
The extensional and flexural mode waves travel in both the wire insulation and wire
conductor. For previous measurements it was assumed that the condition of the wire
conductor is constant and thus would not be a factor in the extensional and flexural mode

10
measurements. If this assumption were wrong it would be beneficial to have a method to
interrogate only the insulation. One possible method, examined here, is the application of
Surface or Rayleigh waves. These waves propagate along the free surface of a semi-
infinite elastic material, are nondispersive, and their displacement amplitude decays
exponentially with distance from the free surface. Extensional and flexural modes at low
frequencies have phase velocities that are very different. As frequency increases the
phase velocity of these modes approaches the Rayleigh wave velocity and the distinct
extensional and flexural modes merge. Efforts were made to identify this point by
observing the extensional and flexural modes as a function of frequency and then use the
wave mode at this frequency to infer the condition of the wire insulation.
Young’s Modulus Measurements
Young’s modulus was measured using a small computer controlled, electromechanically
actuated table top load frame with a 450-kg (1000-pound) load cell. For displacement
measurements an extensometer with a 2.54-cm (1.0-inch) gauge length was used. The
general testing procedure involved applying a tensile load to a wire sample until the first
detectable signs of yielding, where yielding was defined as a change of slope in the linear
stress-strain curve. The typical load at this point was 9 to 45 kg (20 to 100 pounds)
depending on wire gauge. This measurement was repeated after moving the extensometer
to a new location in the central test region of each wire and away from the load frame
grips. At each location, four measurements were taken around the wire’s diameter using
this procedure and the results averaged. For each measurement, efforts were made to
avoid placing the extensometer at locations on the wire where evidence of bending
existed. It was noted that residual stress in areas of bending was high and could cause the
measurements to be inconsistent. When these results differed by greater than 20 percent,
that group of measurements was ignored. This Young’s modulus measurement represents
a combined modulus from both the wire core and the insulation.
Other Measurements
Two other measurements were conducted using ultrasonic guided waves. One
measurement examined the variation in the ultrasonic signal due to insulation damage.
This was accomplished by using the clip-on transducers described above, generating an
ultrasonic signal in the wire, and recording this signal before and after making a cut in the
wire insulation. The second item examined was the use of a non-contact low-power laser
diode as a method of generating ultrasound. This method was previously demonstrated
(Madaras and Anastasi, 1999) and (Anastasi and Madaras, 1999) and was shown capable
of generating ultrasound in aluminum and composite materials. The low-power and non-
contact nature of this method makes it potentially attractive in some applications.
11
RESULTS
Extensional Mode Results
Initial measurements and dispersion curve calculations were carried out on a simple
model of an insulated wire to identify the extensional and flexural wave modes. This
model consisted of a solid aluminum rod with a polymer (heat shrink tubing) coating.
The aluminum rod simulated the wire and the polymer coating simulated the wire
insulation. It was assumed that there was a uniform bond at the interface of the aluminum
and polymer coating. The calculations were performed using a commercially available
software package that generated dispersion curves for plate and cylindrical geometry
materials (Pavlakovic and Lowe, 2001).
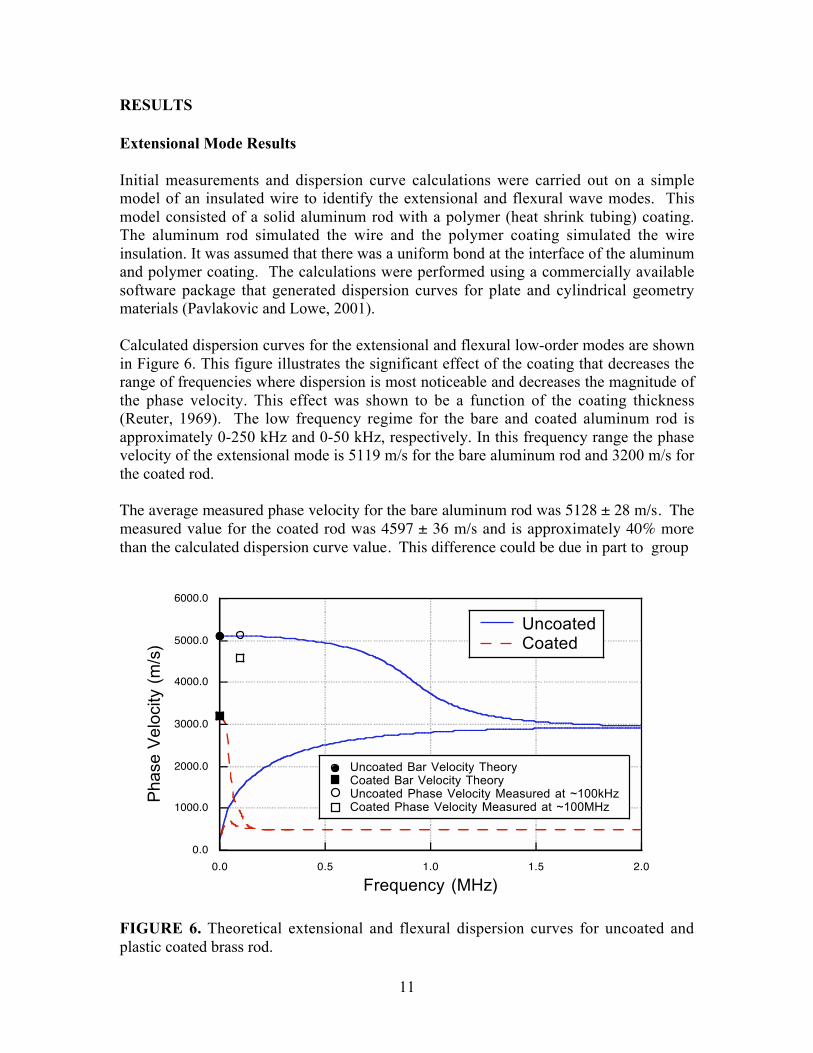
Calculated dispersion curves for the extensional and flexural low-order modes are shown
in Figure 6. This figure illustrates the significant effect of the coating that decreases the
range of frequencies where dispersion is most noticeable and decreases the magnitude of
the phase velocity. This effect was shown to be a function of the coating thickness
(Reuter, 1969). The low frequency regime for the bare and coated aluminum rod is
approximately 0-250 kHz and 0-50 kHz, respectively. In this frequency range the phase
velocity of the extensional mode is 5119 m/s for the bare aluminum rod and 3200 m/s for
the coated rod.
The average measured phase velocity for the bare aluminum rod was 5128 ± 28 m/s. Themeasured value for the coated rod was 4597 ± 36 m/s and is approximately 40% morethan the calculated dispersion curve value. This difference could be due in part to group
0.0
1000.0
2000.0
3000.0
4000.0
5000.0
6000.0
0.0 0.5 1.0 1.5 2.0
Ph
ase
Ve
locity (
m/s
)
Frequency (MHz)
Uncoated Bar Velocity TheoryCoated Bar Velocity TheoryUncoated Phase Velocity Measured at ~100kHzCoated Phase Velocity Measured at ~100MHz
UncoatedCoated
FIGURE 6. Theoretical extensional and flexural dispersion curves for uncoated and
plastic coated brass rod.

12
velocity effects and to boundary conditions used in the numerical model. In the model aperfect coupling between the rod and plastic was assumed, but in the physical situation aweaker coupling may exist. More importantly, the result also indicates that some of theultrasonic energy is traveling in the insulation and may be sensitive to insulator stiffnessvariations.
To test this theory measurements were conducted on the first set of heat-damaged wires.
The phase velocity in these samples was measured following the same procedures
described earlier and the results are shown in Figures 7, 8, and 9. These figures show a
bar chart of phase velocity for each wire gauge and each heat-damage condition. In each
gauge family the baseline samples showed the lowest phase velocity with phase velocity
increasing for increasing heat damage. The 12-gauge wire in Figure 7 does not follow
this trend and could be in part due to the poor condition of the wire; it was very brittle
and some pieces of the insulation had detached from the wire. The phase velocity error
varied from wire to wire, but in general was +/- 29 m/s or on the order of 1% of the
measured values. Overall, this result shows that the extensional phase velocity
measurement is able to distinguish between the baseline and heat-damage conditions.
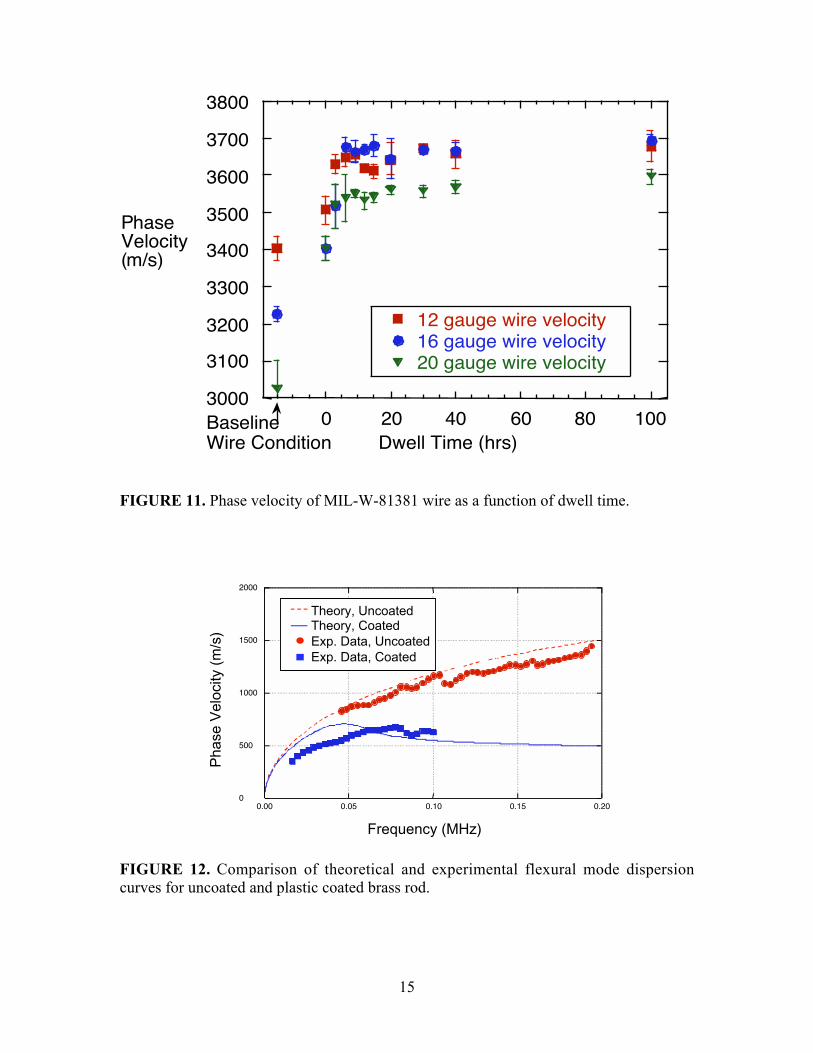
To examine the effect of heat damage in more detail, measurements were made on the
second set of wire samples. Results for the MIL-W-22759/34 wire samples in Figure 10
show the individual data points with an average phase velocity error for the 12-gauge and
20-gauge wire sets. The data for each gauge show a rapidly increasing phase velocity at
small dwell times and a slower increasing phase velocity at longer dwell times. Results
for the MIL-W-81381 wire set are shown in Figure 11 and show a similar behavior to the
previous wire set. It appears as if the condition of the insulation is approaching a limiting
phase velocity value. In general the phase velocity increases as a function of heat damage
and is consistent with earlier results.
FIGURE 7. Ultrasonic wave velocity in heat-damaged MIL-W-22759/34 wire.

13
FIGURE 8. Ultrasonic wave velocity in heat-damaged MIL-W-81381 wire.
FIGURE 9. Ultrasonic wave velocity in heat-damaged MIL-W-22759/87 wire.

14
Flexural Mode Results
To validate the Fourier method, experimental measurements were taken on an uncoated
and coated brass rod and the flexural mode dispersion curves were obtained using the
Fourier phase method. The results shown in Figure 12 are compared with calculated
flexural mode dispersion curves. The calculations were performed using a commercially
available software package that calculates dispersion curves in plate and cylindrical
geometry. The experimental measurements follow the trend of the calculated curves and
validate the Fourier method procedures. The difference between the calculated and
experimental curves may be due to differences between actual and textbook material
property values and between actual boundary conditions and the assumed perfect
coupling of the core and cladding.
Next, measurements were performed on electrical wire samples. The samples were mil-
spec MIL-W-22759/34 16-gauge wires. This electrical wire was examined in a baseline
condition and in a heat-damaged condition. For numerical calculations the electrical wire
FIGURE 10. Phase velocity of MIL-W-22759/34 wire as a function of dwell time.
2500
3000
3500
4000
4500
0 20 40 60 80 100
12 gauge wire velocity20 gauge wire velocity
BaselineWire Condition
PhaseVelocity(m/s)
Dwell Time (hrs at 270oC)
15
3000
3100
3200
3300
3400
3500
3600
3700
3800
0 20 40 60 80 100
12 gauge wire velocity16 gauge wire velocity20 gauge wire velocity
Dwell Time (hrs)BaselineWire Condition
PhaseVelocity(m/s)
FIGURE 11. Phase velocity of MIL-W-81381 wire as a function of dwell time.
0
500
1000
1500
2000
0.00 0.05 0.10 0.15 0.20
Frequency (MHz)
Phase V
elo
city (
m/s
)
Theory, UncoatedTheory, Coated
Exp. Data, Uncoated
Exp. Data, Coated
FIGURE 12. Comparison of theoretical and experimental flexural mode dispersion
curves for uncoated and plastic coated brass rod.

16
TABLE IV. Material Properties and Radius used in numerical model of electrical wire.
Material Copper Teflon©
Young’s Modulus (GPa) 122.70 1.864
Density (kg/m3) 8900 2200
Poission’s Ratio 0.35 0.40
Long. Velocity (m/s) 4700 1350
Shear Velocity (m/s) 2260 550
Radius (mm) 0.66 0.95
was modeled with a core of solid copper and a cladding of Teflon©. Properties, typical
textbook values, and radius used in the calculations are shown in Table IV. Experimental
and calculated flexural mode dispersion curves for the baseline and heat-damaged
electrical wire are shown in Figure 13. For the heat-damaged sample a Young’s Modulus
value of 4.0 GPa was used. This value was chosen to make the calculated curve follow
the experimental data and illustrate stiffening of the wire insulation. Although the
experimental curves do not follow the calculations exactly the result does show a
difference that may be associated with material stiffness. The difference between
experimental and calculations may in part be due to the boundary condition between the
cladding and core and that the model used a solid core while the actual wire core
consisted of a bundle of small diameter wire strands.
Frequency (MHz)
Phase V
elo
city (
m/s
)
0
200
400
600
800
1000
1200
0.00 0.05 0.10 0.15 0.20
Theory, Baseline Theory, Oven Aged
Exp. Baseline
Exp. Oven Aged
FIGURE. 13. Theoretical and experimental flexural mode dispersion curves for baseline
and oven aged electrical wire.

17
In general, the phase spectrum method was easy to apply, but isolating and obtaining a
clean flexural mode in wire samples was more difficult than in the solid wire rod. This
difficulty could in part be due to the propagation of higher wave modes, boundary
conditions, and the fact that the wire core was not solid but was made of stranded, coated
wires.
Young’s Modulus Results
Tensile tests were performed on a baseline set of MIL-W-81381 wires. A picture of a
wire in the testing machine is shown in Figure 14. This set consisted of six 12-gauge
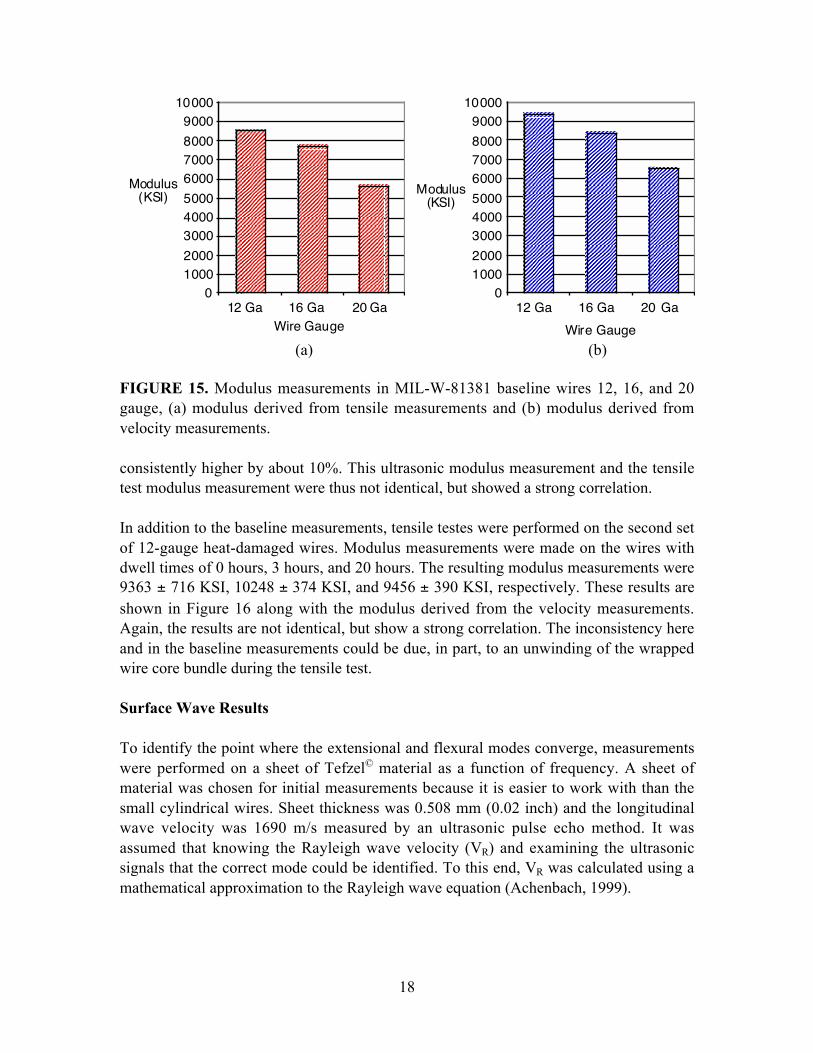
wires, six 16-gauge wires, and six 20-gauge wires. The modulus measurement results,
shown in the bar chart of Figure 15(a), were 8767 ± 292 KSI, 7714 ± 505, and 5636 ±
486 for the 12-, 16-, and 20-gauge wires, respectively. Figure 15(b) shows the modulus
calculation result based on the extensional mode phase velocity measurements. It was
anticipated that the modulus derived from the extensional mode phase velocity would be
similar to the tensile test values. However, the ultrasonic modulus measurements were
FIGURE 14. Wire in tensile testing machine with extensometer attached.
18
010002000
300040005000
600070008000
900010000
12 Ga 16 Ga 20 Ga
Wire Gauge
Modulus(KSI)
010002000
300040005000
600070008000
900010000
12 Ga 16 Ga 20 GaWire Gauge
Modulus(KSI)
(a) (b)
FIGURE 15. Modulus measurements in MIL-W-81381 baseline wires 12, 16, and 20
gauge, (a) modulus derived from tensile measurements and (b) modulus derived from
velocity measurements.
consistently higher by about 10%. This ultrasonic modulus measurement and the tensile
test modulus measurement were thus not identical, but showed a strong correlation.
In addition to the baseline measurements, tensile testes were performed on the second set
of 12-gauge heat-damaged wires. Modulus measurements were made on the wires with
dwell times of 0 hours, 3 hours, and 20 hours. The resulting modulus measurements were
9363 ± 716 KSI, 10248 ± 374 KSI, and 9456 ± 390 KSI, respectively. These results are
shown in Figure 16 along with the modulus derived from the velocity measurements.
Again, the results are not identical, but show a strong correlation. The inconsistency here
and in the baseline measurements could be due, in part, to an unwinding of the wrapped
wire core bundle during the tensile test.
Surface Wave Results
To identify the point where the extensional and flexural modes converge, measurements
were performed on a sheet of Tefzel© material as a function of frequency. A sheet of
material was chosen for initial measurements because it is easier to work with than the
small cylindrical wires. Sheet thickness was 0.508 mm (0.02 inch) and the longitudinal
wave velocity was 1690 m/s measured by an ultrasonic pulse echo method. It was
assumed that knowing the Rayleigh wave velocity (VR) and examining the ultrasonic
signals that the correct mode could be identified. To this end, VR was calculated using a
mathematical approximation to the Rayleigh wave equation (Achenbach, 1999).

19
FIGURE 16. Modulus measurements: velocity derived modulus in heat-damaged MIL-
W-81381 12-gauge wire.
vR = 0.862 + 1.14
1 + vT (2)
In this calculation a Poission’s ratio ( ) value of 0.40 and a shear wave (vT) velocity of
670 m/s were used. The Rayleigh wave velocity of 630 m/s was obtained in this
calculation.
Ultrasonic signals were generated and examined as a function of transducer separation.
The signals appeared similar to the extensional and flexural modes in the wire
experiments. Signals were inspected at the Rayleigh wave mode arrival time, but distinct
variations in the signal at this time were not observed. This measurement was repeated
using transducers with center frequencies of 0.5 MHz, 1.0 MHz, and 2.25 MHz; the same
results were obtained. The reason this mode was not observed could be in part due to
attenuation of ultrasonic signal in plastic type material and that the Rayleigh wave mode
may be of very small amplitude when compared to the lower frequency extensional and
flexural modes.
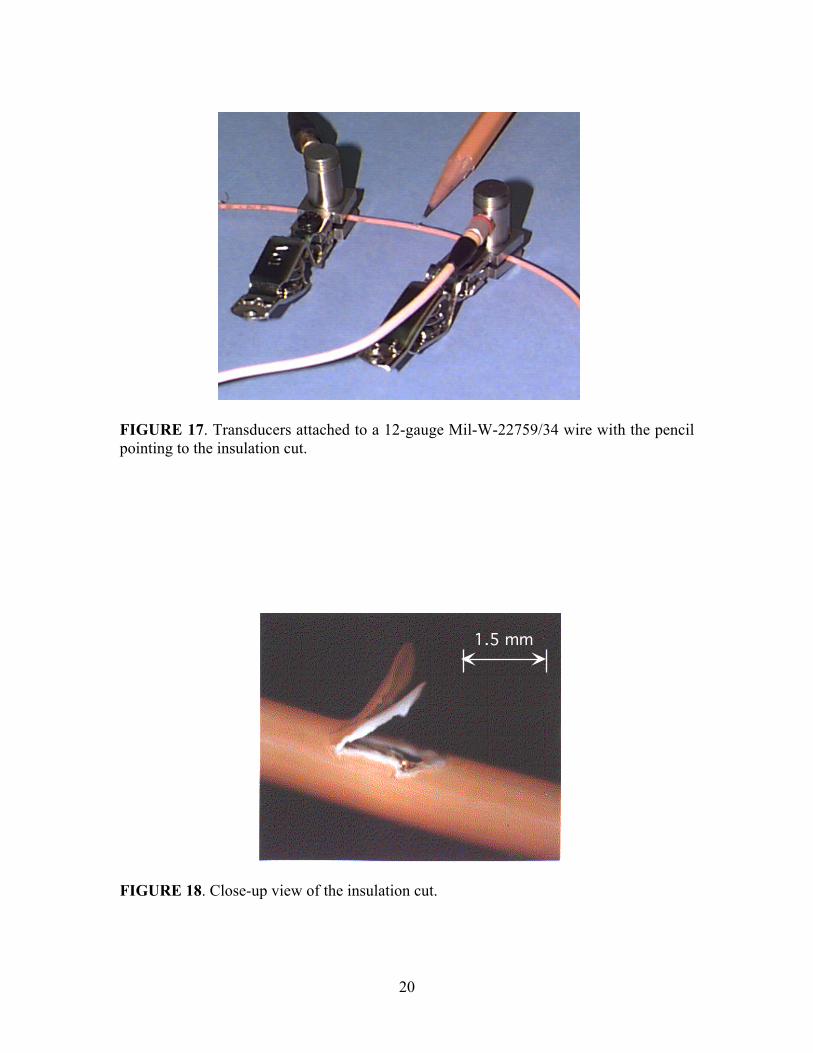
Other Measurement Results
A baseline 12-gauge wire sample MIL-W-22759/34 was used in this measurement. The
transducers were attached to the wire and an ultrasonic guide wave was generated and
recorded before and after making a small cut in the wire insulation. Figure 17 shows the
0
2000
4000
6000
8000
10000
12000
14000
Baseline 0 hrs. 3 hrs. 20 hrs.
Dwell Time at 370oC
Mod
ulus
(K
SI)
Velocity Derived ModulusMeasured Modulus
20
FIGURE 17. Transducers attached to a 12-gauge Mil-W-22759/34 wire with the pencil
pointing to the insulation cut.
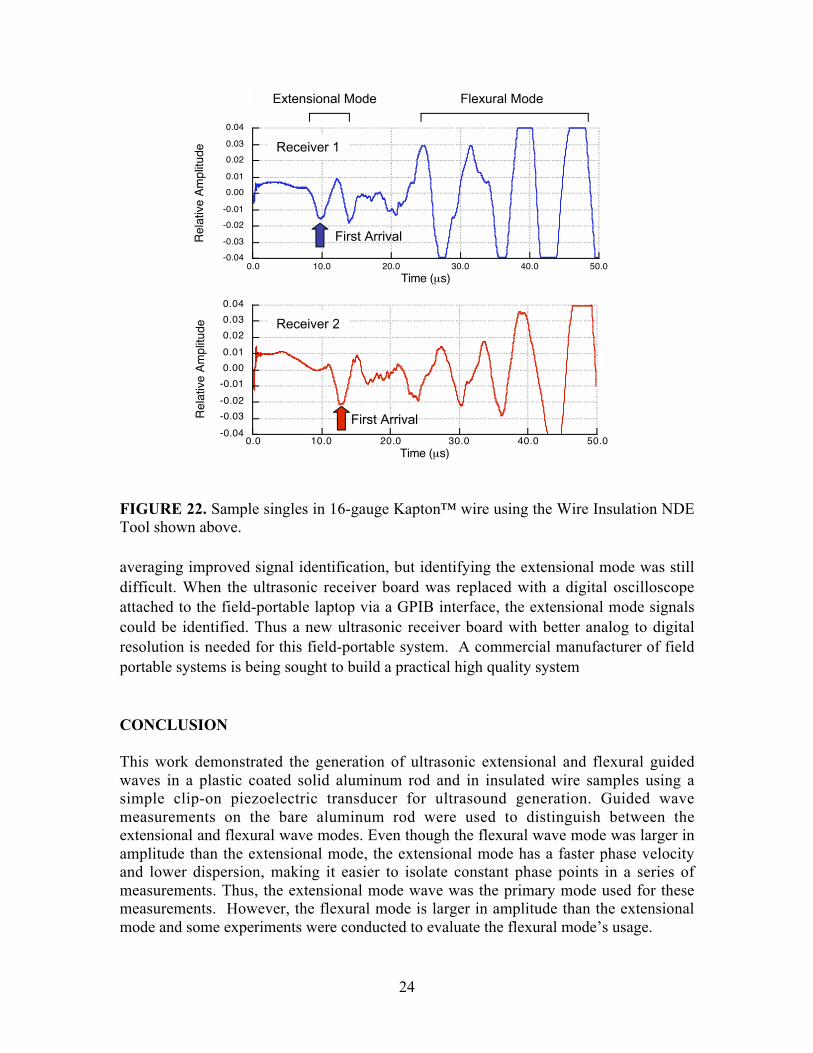
FIGURE 18. Close-up view of the insulation cut.
1.5 mm

21
FIGURE 19. Signals and spectrum before and after damage are shown.
transducers attached to the wire and Figure 18 shows a close-up of the cut. A 100-kHz,
5-cycle Gaussian enveloped sine wave was used to drive the transmitting transducer. The
output signals before and after damage and their spectra are shown in Figure 19. The
signal before damage shows the modulated sine wave and the signal after damage shows
the same signal that is slightly elongated. The spectrum of these signals shows a slight
center frequency shift. These changes could in part be due to the cut and geometry
change.
As in previous laser-diode ultrasound generation experiments a 150-mW modulated
laser-diode was used as a transmitter to generate ultrasound. A conventional piezoelectric
transducer was used as a receiver. A conventional ultrasonic signal was recovered by
signal correlation. The laser-diode beam incident on the wire insulation was 2 mm in
diameter and had a power density of 17.83 mW/mm2. A frequency generator modulated
the laser-diode drive current, and thus the beam intensity, by using a frequency swept
pattern from 1 kHz to 100 kHz. The insulation became damaged (slightly blackened)
when the power density reached 20 mW/mm2, so these experiments stayed below this
limit. Two wire samples were examined: a 12-gauge baseline sample and a 12-gauge
sample that was heat-damaged at 349°C for 1 hour. A typical ultrasonic signal
1.0
-1.0
-0.5
0.0
0.5
200.00.0 20.0 40.0 60.0 80.0 100.0 120.0 140.0 160.0 180.0
time (µs)
1.0
-1.0
-0.5
0.0
0.5
200.00.0 20.0 40.0 60.0 80.0 100.0 120.0 140.0 160.0 180.0
time (µs)
Frequency (kHz)
1.0
0.0
0.2
0.4
0.6
0.8
200.00.0 20.0 40.0 60.0 80.0 100.0 120.0 140.0 160.0 180.0
before after
(a) Before Damage
(b) After Damage
(c) Spectrum Before and After

22
Time (µs)
Rel
ativ
e A
mpl
itude Flexural
Mode
4500 50 100 150 200 250 300 350 400
1.0
-1.0
-0.5
0.0
0.5
FIGURE 20. Laser-diode generated ultrasonic signal.
recovered from correlating the drive and received signals is shown in Figure 20. The first
flexural mode, the larger amplitude signal, can be seen initiating at about 120 µs.
A fairly large amplitude signal can be seen at the beginning of the waveform and could
be due in part to both signal processing and the electronics. The extensional mode that
was shown to be generated with contact transducers in previous measurements could not
be resolved. It is possible that the thermal generation mechanism lacked the energy to
generate this mode.
The phase velocity of this flexural mode was measured by taking a series of
measurements of a constant phase point as a function of generation point and receiver
separation. The laser diode was translated in millimeter increments and the piezoelectric
ultrasonic receiver was held in a fixed position. The location of a constant phase point in
time was plotted against the translation stage displacement and a linear curve fit was
applied. The slope of the linear fit was our measure of the flexural phase velocity. The
baseline flexural phase velocity was 529 m/s while the heat-damaged sample had a phase
velocity of 548 m/s. This measurement is consistent with previous measurements near
40 KHz that showed an increase in phase velocity for the heat-damaged samples.
The flexural mode phase velocity measured with the laser is much slower than the
extensional mode phase velocity measured with the transducers. This is consistent with
dispersion curve relations for cylindrical rods. These relations show that the flexural
mode phase velocity approaches zero as frequency approaches zero while the extensional
mode phase approaches the bar velocity as the frequency approaches zero.
Wire NDE Tool
The general procedure used to measure the extensional phase velocity was to record
multiple ultrasonic signals as a function of transducer spacing and then calculate the
extensional phase velocity from the signal arrival time and transducer separation. This

23
FIGURE 21. Wire Insulation NDE Tool clamped onto a 16-gauge wire.
procedure is adequate for laboratory based measurements, but would be impractical to
perform on aircraft wires in small spaces. A more practical procedure is to use two
measurements at two different distances from the transmitting transducer in a fixed tool.
A compact arrangement is to locate the transmitter between two outer receivers. The
different distances between the transmitter and two receivers divided by the difference
between the separate signal arrival-times can be used to give the velocity. This
arrangement eliminates the need to move the receiver or transmitter transducer multiple
times to obtain various measurements from which the wave velocity is calculated. The
disadvantage in this approach might be reduced accuracy, but the advantage is a simpler
measurement procedure.
To facilitate this procedure a wire NDE tool was manufactured and is shown in
Figure 21. A 16-gauge wire is shown attached in the tool in Figure 21. The tool consists
of the transmitting transducer located between two receivers on a spring-loaded platform
with a handgrip. The spacing between the transmitter and first receiver is 2.50 cm (0.98
inch) and the distance between the transmitter and second receiver is 3.50 cm (1.38
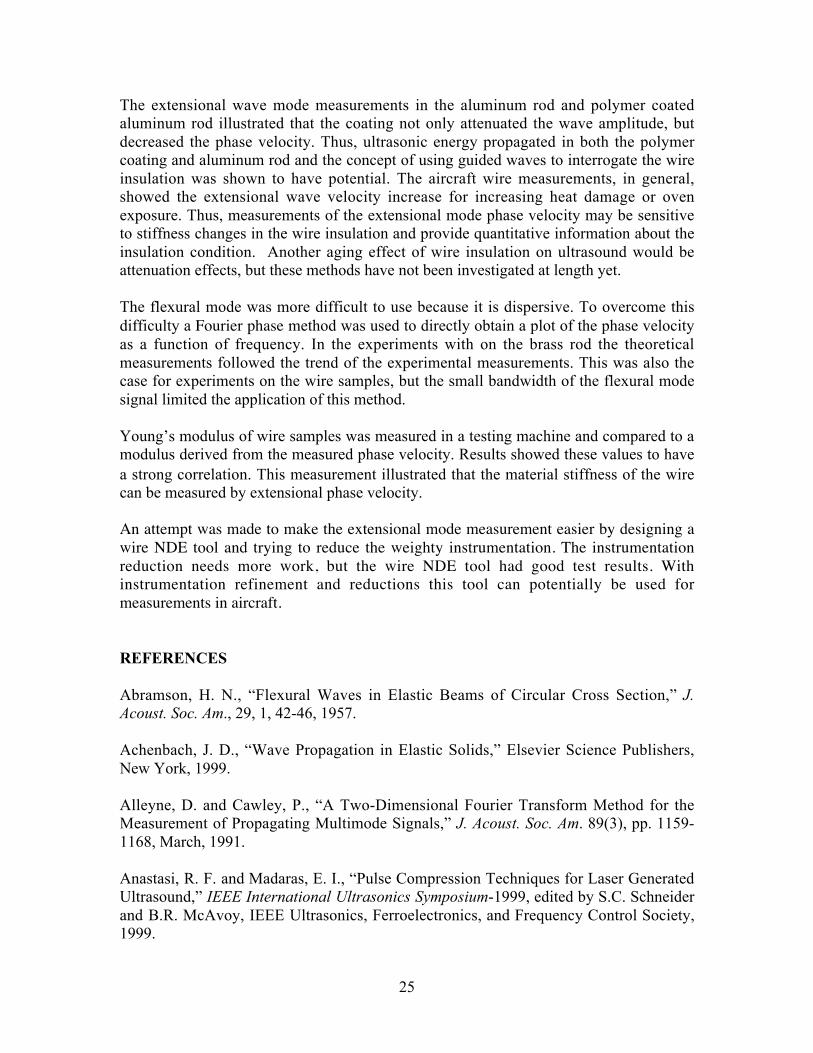
inches). Sample signals in a 16-gauge Kapton™ wire that were obtained with this tool are
shown in Figure 22. The calculated phase velocity was 3269 m/s.
The laboratory-based instrumentation described previously was used with the wire NDEtool. This instrumentation is bulky and not suited for field type measurements. An initialattempt to reduce this bulk of instrumentation involved using smaller instrumentation in
the form a field-portable laptop computer, an ultrasonic generator board, and an
ultrasonic receiver board. Control and data acquisition software was written for these
boards that included a graphical user interface that allowed the user to control the
ultrasonic pulse energy and locate the extensional mode arrival from each ultrasonic
receiver, and calculated the phase velocity based on the wire tool transducer separation.
Tests were first conducted with this system on a solid wire rod and measurement results
compared well to theoretical values. When tests were conducted on a sample wire it was
generally difficult to isolate the extensional modes and calculate the velocity. Signal
24
FIGURE 22. Sample singles in 16-gauge Kapton™ wire using the Wire Insulation NDE
Tool shown above.
averaging improved signal identification, but identifying the extensional mode was still
difficult. When the ultrasonic receiver board was replaced with a digital oscilloscope
attached to the field-portable laptop via a GPIB interface, the extensional mode signals
could be identified. Thus a new ultrasonic receiver board with better analog to digital
resolution is needed for this field-portable system. A commercial manufacturer of field
portable systems is being sought to build a practical high quality system
CONCLUSION
This work demonstrated the generation of ultrasonic extensional and flexural guided
waves in a plastic coated solid aluminum rod and in insulated wire samples using a
simple clip-on piezoelectric transducer for ultrasound generation. Guided wave
measurements on the bare aluminum rod were used to distinguish between the
extensional and flexural wave modes. Even though the flexural wave mode was larger in
amplitude than the extensional mode, the extensional mode has a faster phase velocity
and lower dispersion, making it easier to isolate constant phase points in a series of
measurements. Thus, the extensional mode wave was the primary mode used for these
measurements. However, the flexural mode is larger in amplitude than the extensional
mode and some experiments were conducted to evaluate the flexural mode’s usage.
-0.04
-0.03
-0.02
-0.01
0.00
0.01
0.02
0.03
0.04
0.0 10.0 20.0 30.0 40.0 50.0
Rel
ativ
e A
mpl
itude
Time (µs)
-0.04
-0.03
-0.02
-0.01
0.00
0.01
0.02
0.03
0.04
0.0 10.0 20.0 30.0 40.0 50.0
Rel
ativ
e A
mpl
itude
Time (µs)
Axisymmetric Mode Flexural Mode
Receiver 1
Receiver 2
First Arrival
First Arrival
Extensional Mode Flexural Mode
25
The extensional wave mode measurements in the aluminum rod and polymer coated
aluminum rod illustrated that the coating not only attenuated the wave amplitude, but
decreased the phase velocity. Thus, ultrasonic energy propagated in both the polymer
coating and aluminum rod and the concept of using guided waves to interrogate the wire
insulation was shown to have potential. The aircraft wire measurements, in general,
showed the extensional wave velocity increase for increasing heat damage or oven
exposure. Thus, measurements of the extensional mode phase velocity may be sensitive
to stiffness changes in the wire insulation and provide quantitative information about the
insulation condition. Another aging effect of wire insulation on ultrasound would be
attenuation effects, but these methods have not been investigated at length yet.
The flexural mode was more difficult to use because it is dispersive. To overcome this
difficulty a Fourier phase method was used to directly obtain a plot of the phase velocity
as a function of frequency. In the experiments with on the brass rod the theoretical
measurements followed the trend of the experimental measurements. This was also the
case for experiments on the wire samples, but the small bandwidth of the flexural mode
signal limited the application of this method.
Young’s modulus of wire samples was measured in a testing machine and compared to a
modulus derived from the measured phase velocity. Results showed these values to have
a strong correlation. This measurement illustrated that the material stiffness of the wire
can be measured by extensional phase velocity.
An attempt was made to make the extensional mode measurement easier by designing awire NDE tool and trying to reduce the weighty instrumentation. The instrumentationreduction needs more work, but the wire NDE tool had good test results. Withinstrumentation refinement and reductions this tool can potentially be used formeasurements in aircraft.
REFERENCES
Abramson, H. N., “Flexural Waves in Elastic Beams of Circular Cross Section,” J.
Acoust. Soc. Am., 29, 1, 42-46, 1957.
Achenbach, J. D., “Wave Propagation in Elastic Solids,” Elsevier Science Publishers,
New York, 1999.
Alleyne, D. and Cawley, P., “A Two-Dimensional Fourier Transform Method for the
Measurement of Propagating Multimode Signals,” J. Acoust. Soc. Am. 89(3), pp. 1159-
1168, March, 1991.
Anastasi, R. F. and Madaras, E. I., “Pulse Compression Techniques for Laser Generated
Ultrasound,” IEEE International Ultrasonics Symposium-1999, edited by S.C. Schneider
and B.R. McAvoy, IEEE Ultrasonics, Ferroelectronics, and Frequency Control Society,
1999.

26
DuPont Teflon® and Tefzel® Films, www.dupont.com/teflon/films/H-55007-2part2.html
- accessed September 15, 2003.
Furse, C., and Haupt, R., “Down to the wire [aircraft wiring],” IEEE Spectrum, v. 38, no.
2, pp. 34-39, 2001.
Gangal, S. V. and Grot, W., Tetrafluoroetheylene Polymers, Encyclopedia of Polymer
Science and Engineering, 16, 577-648, 1989.
Madaras, E. I., Kohl, T., and Rogers, W. P., “Material Property Characterization and
Pulse Propagation in Thin Drawn Wire Waveguides,” IEEE Ultrasonics Symposium,
pp. 957-962, 1992.
Madaras, E. I., Kohl, T. W., and Rogers, W. P., “Measurement and Modeling of
Dispersive Pulse Propagation in Drawn Wire Waveguides,” J. Acoust. Soc. Am., 97, 1,
252-261, 1995.
Madaras, E. I., and Anastasi, R. F., “Pseudo-Random Modulation of a Laser Diode for
Generation Ultrasonic Longitudinal Waves,” 26th Annual Review of Progress in
Qualitative Nondestructive Evaluation, Montreal, Quebec, Canada, July 1999.
McNiven, H. D., Sackman, J. L., and Shah, A. H., “Dispersion of Axially Symmetric
Waves in Composite, Elastic Rods,” J. Acoust. Soc. Am., 35, 10, 1602-1609, 1963.
Meeker, T. R., and Meitzler, A. H., “Guided Wave Propagation in Elongated Cylinders
and Plates,” in Physical Acoustics - Principles and Methods, edited by W.P. Mason,
Academic Press, NY, Vol. 1, Part A, pp. 111-167, 1964.
Pavlakovic, B., and Lowe, M., “Disperse,” CD-ROM. Imperial College, London, UK,
2001.
Prosser, W. H. and Gorman, M. R., “Plate Mode Velocities in Graphite/Epoxy Plates,” J.
Acoust. Soc. Am. 96, pp. 902-907, August 1994.
Reuter, Jr., R. C., “Dispersion of Flexural Waves in Circular Bimaterial Cylinders-
Theoretical Treatment,” J. Acoust. Soc. Am., Vol. 46, No. 3, pp. 643-648, 1969.
Rose, J. L., “Ultrasonic Waves in Solid Media,” Cambridge University Press, NY, 1999.
Sachse, W., and Pao, Y., “On the determination of Phase and Group Velocities of
Dispersive Waves in Solids,” J. Appl. Phys, 49(8), August 1978.
Schumacher, N. A., Burger, C. P., and Gien, P. H., “A Laser-Based Investigation of
Higher-Order Modes in Transient Lamb Waves,” J. Acoust. Soc. Am., 93(5), pp. 2981-
2984, May 1993.
27
Thurston, R. N., “Elastic Waves in Rods and Clad Rods,” J. Acoust. Soc. Am., 64, 1,
1-37, 1978.
Veidt, M. and Sayir, M., “Experimental Evaluation of Global Composite Laminate
Stiffness by Structural Wave Propagation,” Journal of Composite Materials, Vol. 24,
pp. 688-706, July 1990.
REPORT DOCUMENTATION PAGE Form ApprovedOMB No. 0704-0188
2. REPORT TYPE
Technical Memorandum 4. TITLE AND SUBTITLE
Application of Ultrasonic Guided Waves for Evaulating Aging Wire Insulation
5a. CONTRACT NUMBER
6. AUTHOR(S)
Anastasi, Robert F.; and Madaras, Eric I.
7. PERFORMING ORGANIZATION NAME(S) AND ADDRESS(ES)
NASA Langley Research Center U.S. Army Research Laboratory Hampton, VA 23681-2199 Vehicle Technology Directorate NASA Langley Research Center Hampton, VA 23681-2199
9. SPONSORING/MONITORING AGENCY NAME(S) AND ADDRESS(ES)
National Aeronautics and Space AdministrationWashington, DC 20546-0001and U.S. Army Research LaboratoryAdelphi, MD 20783-1145
8. PERFORMING ORGANIZATION REPORT NUMBER
L-19068
10. SPONSOR/MONITOR'S ACRONYM(S)
NASA
13. SUPPLEMENTARY NOTESAn electronic version can be found at http://ntrs.nasa.gov
12. DISTRIBUTION/AVAILABILITY STATEMENTUnclassified - UnlimitedSubject Category 71Availability: NASA CASI (301) 621-0390
19a. NAME OF RESPONSIBLE PERSON
STI Help Desk (email: [email protected])
14. ABSTRACT
Aging wiring has become a critical issue to the aerospace and aircraft industries due to Shuttle and aircraft incidents. The problem is that over time the insulation on wire becomes brittle and cracks. This exposes the underlying conductive wire to the potential for short circuits and fire. Popular methods of monitoring aging wire problems focuses on applying electrical sensing techniques that are sensitive to the conductor's condition, but not very sensitive to the wire insulation's condition. Measurement of wire insulation stiffness and ultrasonic properties by ultrasonic guided waves is being examined. Experimental measurements showed that the lowest order extensional mode could be sensitive to stiffness changes in the wire insulation. To test this theory conventional wire samples were heat damaged in an oven, in a range of heating conditions. The samples were 12, 16, and 20 gauge and the heat damage introduced material changes in the wire insulation that made the originally flexible insulation brittle and darker in color. Results showed that extensional mode phase velocity increased for the samples that were exposed to heat for longer duration.
15. SUBJECT TERMS
Guided waves; Wire insulation; Cylindrical wave-guide; Ultrasonic
18. NUMBER OF PAGES
32
19b. TELEPHONE NUMBER (Include area code)
(301) 621-0390
a. REPORT
U
c. THIS PAGE
U
b. ABSTRACT
U
17. LIMITATION OF ABSTRACT
UU
Prescribed by ANSI Std. Z39.18Standard Form 298 (Rev. 8-98)
3. DATES COVERED (From - To)
5b. GRANT NUMBER
5c. PROGRAM ELEMENT NUMBER
5d. PROJECT NUMBER
5e. TASK NUMBER
5f. WORK UNIT NUMBER
23-376-70-30-05
11. SPONSOR/MONITOR'S REPORT NUMBER(S)
NASA/TM-2005-213520 ARL-TR-3384
16. SECURITY CLASSIFICATION OF:
The public reporting burden for this collection of information is estimated to average 1 hour per response, including the time for reviewing instructions, searching existing data sources, gathering and maintaining the data needed, and completing and reviewing the collection of information. Send comments regarding this burden estimate or any other aspect of this collection of information, including suggestions for reducing this burden, to Department of Defense, Washington Headquarters Services, Directorate for Information Operations and Reports (0704-0188), 1215 Jefferson Davis Highway, Suite 1204, Arlington, VA 22202-4302. Respondents should be aware that notwithstanding any other provision of law, no person shall be subject to any penalty for failing to comply with a collection of information if it does not display a currently valid OMB control number.PLEASE DO NOT RETURN YOUR FORM TO THE ABOVE ADDRESS.
1. REPORT DATE (DD-MM-YYYY)
01 - 200501-