Application of Ultrasonic C-Scan Techniques for Tracing ...
12
Strojniški vestnik - Journal of Mechanical Engineering 57(2011)3, 192-203 Paper received: 28.05.2009 DOI:10.5545/sv-jme.2010.170 Paper accepted: 08.07.2009 *Corr. Author’s Address: School of Naval Architecture and Marine Engineering, National Technical University of Athens, Heroon Polytechniou 9, GR-157 73 Zografos, Athens, Grece, [email protected] 192 Application of Ultrasonic C-Scan Techniques for Tracing Defects in Laminated Composite Materials Hasiotis, T. – Badogiannis, E. – Tsouvalis, N.G. Theodoros Hasiotis – Efstratios Badogiannis * – Nicolaos Georgios Tsouvalis School of Naval Architecture and Marine Engineering, National Technical University of Athens, Greece In this paper practical ultrasonic C-scan techniques for NDT of laminated composite materials are developed and applied, with an aim to trace specific artificial defects. Two types of materials are examined; an advanced carbon/epoxy system and a typical marine type glass/polyester system. Both were constructed with two manufacturing methods (Hand Lay-Up and Vacuum Infusion). Several artificial defects were embedded into the test plates, varying in shape, magnitude and through thickness position. Test plates were C-scanned using ULTRAPAC II ultrasonic system with ULTRAWIN software and typical examination techniques (layer to layer examination, full width examination, etc.) were used to determine and characterize defects. In addition, appropriate software tuning procedures and examination strategies were applied, which further developed and optimised tthe scanning procedure. These efforts resulted in effective C-scan images, allowing the determination of the position and even the shape of the defects in some cases. Finally, precise determination of specimens’ thickness was achieved. ©2011 Journal of Mechanical Engineering. All rights reserved. Keywords: composites, ultrasonic inspection, c-scan techniques, defects, delamination, flaw detection, wrinkle 0 INTRODUCTION In the last 30 to 40 years fiber composite materials have seen a growing popularity in a wide spectrum of industries. The pleasure boats industry has been extensively using composites for some decades. Areas of higher-technology applications include aircraft and spacecraft structures. With a decreasing material price for the most commonly used fiber and resin types, composite materials have more recently been applied on a larger scale in ships and marine structures in general. It is the need for reducing the weight of the structure, in order to increase the strength-to-weight and stiffness-to-weight ratios, which raises the use of composite materials. Other advantageous properties include good thermal and acoustic insulation, low fatigue and corrosion and easy manufacturing of aero and hydrodynamically optimised shapes [1]. Defects are defined as any deviation from the nominal, ideal or specified geometric and/ or physical make-up of a structure or component and, for the laminated composite materials, most frequently arise during the manufacturing procedure. Manufacturing defects can evolve to damage during the service life of a structure. Delamination is a defect type frequently met in composite materials, described as the separation of a layer or group of layers from their adjacent ones, due to failure of the internal bonding between the layers. Delamination can be either local or covering a wide area. It can occur either during the curing phase of the resin in the manufacturing stage or during the subsequent service life of the laminated part. Delaminations constitute a severe discontinuity because they do not transfer interlaminar shear stresses and, under compressive loads, they can cause rapid and catastrophic buckling failure [1] and [2]. Ultrasonic inspection is considered as the most efficient method used for quality control and materials quality inspection in all major industries. This includes electrical and electronic components manufacturing, production of metallic and composite materials and fabrication of structures such as airframes, piping and pressure vessels, ships, bridges, motor vehicles, machinery and jet engines. In-service ultrasonic inspection for preventive maintenance is also used for detecting any defects and impending failure in various structures like railroad-rolling-stock axles, press columns, earthmoving equipment, mill rolls,
Transcript of Application of Ultrasonic C-Scan Techniques for Tracing ...

Strojniški vestnik - Journal of Mechanical Engineering 57(2011)3, 192-203 Paper received: 28.05.2009DOI:10.5545/sv-jme.2010.170 Paper accepted: 08.07.2009
*Corr. Author’s Address: School of Naval Architecture and Marine Engineering, National Technical University of Athens, Heroon Polytechniou 9, GR-157 73 Zografos, Athens, Grece, [email protected]
Application of Ultrasonic C-Scan Techniques for Tracing Defects in Laminated Composite Materials
Hasiotis, T. – Badogiannis, E. – Tsouvalis, N.G.Theodoros Hasiotis – Efstratios Badogiannis* – Nicolaos Georgios Tsouvalis
School of Naval Architecture and Marine Engineering, National Technical University of Athens, Greece
In this paper practical ultrasonic C-scan techniques for NDT of laminated composite materials are developed and applied, with an aim to trace specific artificial defects. Two types of materials are examined; an advanced carbon/epoxy system and a typical marine type glass/polyester system. Both were constructed with two manufacturing methods (Hand Lay-Up and Vacuum Infusion). Several artificial defects were embedded into the test plates, varying in shape, magnitude and through thickness position. Test plates were C-scanned using ULTRAPAC II ultrasonic system with ULTRAWIN software and typical examination techniques (layer to layer examination, full width examination, etc.) were used to determine and characterize defects. In addition, appropriate software tuning procedures and examination strategies were applied, which further developed and optimised tthe scanning procedure. These efforts resulted in effective C-scan images, allowing the determination of the position and even the shape of the defects in some cases. Finally, precise determination of specimens’ thickness was achieved. ©2011 Journal of Mechanical Engineering. All rights reserved. Keywords: composites, ultrasonic inspection, c-scan techniques, defects, delamination, flaw detection, wrinkle
0 INTRODUCTION
In the last 30 to 40 years fiber composite materials have seen a growing popularity in a wide spectrum of industries. The pleasure boats industry has been extensively using composites for some decades. Areas of higher-technology applications include aircraft and spacecraft structures. With a decreasing material price for the most commonly used fiber and resin types, composite materials have more recently been applied on a larger scale in ships and marine structures in general. It is the need for reducing the weight of the structure, in order to increase the strength-to-weight and stiffness-to-weight ratios, which raises the use of composite materials. Other advantageous properties include good thermal and acoustic insulation, low fatigue and corrosion and easy manufacturing of aero and hydrodynamically optimised shapes [1].
Defects are defined as any deviation from the nominal, ideal or specified geometric and/or physical make-up of a structure or component and, for the laminated composite materials, most frequently arise during the manufacturing procedure. Manufacturing defects can evolve to damage during the service life of a structure.
Delamination is a defect type frequently met in composite materials, described as the separation of a layer or group of layers from their adjacent ones, due to failure of the internal bonding between the layers. Delamination can be either local or covering a wide area. It can occur either during the curing phase of the resin in the manufacturing stage or during the subsequent service life of the laminated part. Delaminations constitute a severe discontinuity because they do not transfer interlaminar shear stresses and, under compressive loads, they can cause rapid and catastrophic buckling failure [1] and [2].
Ultrasonic inspection is considered as the most efficient method used for quality control and materials quality inspection in all major industries. This includes electrical and electronic components manufacturing, production of metallic and composite materials and fabrication of structures such as airframes, piping and pressure vessels, ships, bridges, motor vehicles, machinery and jet engines. In-service ultrasonic inspection for preventive maintenance is also used for detecting any defects and impending failure in various structures like railroad-rolling-stock axles, press columns, earthmoving equipment, mill rolls,

Strojniški vestnik - Journal of Mechanical Engineering 57(2011)3, 192-203
193Application of Ultrasonic C-Scan Techniques for Tracing Defects in Laminated Composite Materials
mining equipment, nuclear systems and other machines.
ASM Handbook [3] presents the pulse-echo method as the most widely used ultrasonic method, which involves the detection of echoes produced when an ultrasonic pulse is reflected from a discontinuity or an interface of a test piece. This method is very often used for flaws location and thickness measurements. C-scan display records echoes from the internal portions of test pieces as a function of the position of each reflecting interface within an area. Flaws are shown on a read-out, superimposed on a plan view of the test piece and both flaw size (flaw area) and position within the plan view can be recorded. Flaw depth is normally not recorded, although a relatively accurate estimate can be made by restricting the range of depths (gates) within the test piece that is covered in a given scan.
In the literature there are many applications of the ultrasonic C-scan technique for the inspection of composite materials, mainly in carbon/epoxy systems, the use of which in advanced structures justifies the cost of such inspections. To name a few of these applications, the technique has been used to characterize artificial delaminations [4], to detect impact damage in carbon/epoxy composite plates [5], to characterize the distribution, size and shape of voids in composite materials [6] and to reveal some special features of the fiber/matrix interface [7].
The clustering procedure was applied in the present study in order to facilitate dimensioning of the detected defects. ASNT Non-destructive Testing Handbook [2] defines clustering as an algorithm and thus, a software supported process, in which a set of data is organized in groups that have strong similarities. The objective of clustering procedures is to find natural groupings of the data under study.
Scarponi and Briotti [8] have also evaluated artificial defects in composite materials by means of ultrasonic inspection. Their inspection was aiming only at locating the depth position of the defects and not their size, whereas they report that difficulties were met in the inspection of GFRP materials. [9] on the other hand, proposed guidelines for the ultrasonic inspection of composite materials, in an effort to estimate the
size of the defects in materials of this type. The same authors concluded also that the sizing of the defects is not efficient, especially in multi layered materials with large thickness.
In this paper ultrasonic inspection of composite specimens is performed in order to locate several artificial defects, made of Upilex polyamide material. Two material types and two manufacturing methods were used in order to investigate their effect on the effectiveness of the inspection method. In parallel, the two different materials would reveal any possible special features of the U/S software calibration that are needed for an effective inspection. The defects are simulating typical composite delaminations and they were embedded into the 14 layers test laminates. Their varying shape and size, as well as their varying location in the thickness direction of the laminate (overlapping between each other in one case), have as a result several delamination types as a result, which in turn constitute different ultrasonic tracking cases. Appropriate tuning of the device software resulted in effective C-scan images, allowing the determination of the position and, in some cases, of the shape and size of the defects, as well as the determination of the specimen thickness.
1 EXPERIMENTAL
1.1 Materials
Two types of materials were investigated, namely a typical marine glass/polyester composite (GFRP) and an advanced carbon/epoxy system (CFRP). In addition, two manufacturing methods were used; the simple and conventional in the marine industry Hand Lay-Up method (HLU) and the more advanced Vacuum Infusion method (VI). The combination of the aforementioned two materials and two manufacturing methods resulted in the preparation of totally four test laminates.
GFRP test laminates were manufactured using the typical polyester resin NORSODYNE G 703 from GRAY VALLEY, exhibiting a viscosity of 3200 mPa.s at 25 °C and a specific weight of 1.17 g/cm3, in association with a woven roving glass reinforcement having a weight of 500 g/m2. CFRP test laminates were manufactured using the cold cured epoxy resin DER 358 from DOW,

Strojniški vestnik - Journal of Mechanical Engineering 57(2011)3, 192-203
194 Hasiotis, T. – Badogiannis, E. – Tsouvalis, N.G.
(on the right in Fig. 1) included all the embedded polyamide artificial defects. In GFRP laminates, the woven roving fiber reinforcements were layered with their warp direction along y-axis, whereas in CFRP laminates, the unidirectional fiber reinforcements were layered with their warp direction along x-axis.
Table 1. Thickness of specimens
Specimen Average uniform thickness [mm]
Thickness at wrinkle [mm]
CFRP-HLU 7.49 7.84CFRP-VI 3.00 3.28GFRP-HLU 8.28 8.86GFRP-VI 5.45 5.84
In total eight separate polyamide artificial defects were embedded in each one of the defected specimens. These defects, designated D1 to D8 (see Fig. 1), had the specific dimensions and were placed at the specific x-y positions shown in Fig. 1. The distances between these defects were chosen so that their presence does not influence the detection of their neighbour ones. More specifically, the detailed characteristics of all these defects are as follows:
exhibiting a viscosity of 600 to 700 mPa.s at 25 °C and a specific weight of 1.14 g/cm3, in association with a 205 g/m2 unidirectional carbon fibers reinforcement from HEXCEL (type G 1059).
The yarns type of this carbon fiber unidirectional reinforcement is 6K HR in warp and EC5 11 in the weft direction, respectively, whereas the corresponding weight distribution is 98 and 2%. The same polyester resin and the same epoxy resin were used to manufacture the corresponding test laminates with both manufacturing methods. All four resulting laminates had 14 layers each. The artificial defects that were embedded in-between the layers of the test laminates were in the form of a very thin (12.7 μm) sheet, made of Upilex polyamide material.
1.2 Geometry of Specimens
The four test laminates had dimensions 300 × 250 mm, as it is shown in Fig. 1. The average uniform thickness of the test laminates are listed in Table 1, measured by conventional methods (calliper and micrometer). Two specimens were cut from each test laminate, each one with dimensions 100 × 150 mm. The first specimen (on the left in Fig. 1) is a reference specimen without any polyamide artificial defects and the second
Fig. 1. Layout of specimens with artificial defects

Strojniški vestnik - Journal of Mechanical Engineering 57(2011)3, 192-203
195Application of Ultrasonic C-Scan Techniques for Tracing Defects in Laminated Composite Materials
• D1: circular shape, radius is 5 mm, embedded between layers No. 4 and 5 (layers numbering starts from the mould side of the test laminate).
• D2: square shape, side is 10 mm, embedded between layers No. 4 and 5.
• D3: circular shape, radius is 10 mm, embedded between layers No. 4 and 5.
• D4: square shape, side is 20 mm, embedded between layers No. 4 and 5.
• D5: circular shape, radius is 10 mm, embedded between layers No. 3 and 4 (solid line in Fig. 1).
• D6: circular shape, radius is 5 mm, embedded between layers No. 7 and 8 (dashed line in Fig. 1).
• D7: circular shape, radius is 5 mm, embedded between layers No. 3 and 4 (solid line in Fig. 1).
• D8: circular shape, radius is 10 mm, embedded between layers No. 7 and 8 (dashed line in Fig. 1).
Defects D1 to D4 were placed at the same position through thickness, at a distance of approximately 30% of the total thickness from the mould surface of the laminate. Their objective was to investigate the capability of the method and the software settings required to detect the shape of the defects (square versus circular) for two different magnitudes (smaller and larger). Moreover, their non-symmetric placement through thickness would enable the investigation of the effectiveness of the method when trying to detect these defects from both sides of the laminate. Unfortunately, the relatively rough free surface of all test laminates (the surface not in contact with the mould) did not enable the performance of ultrasonic inspections from this side, due to the many signal reflections. Thus, all ultrasonic measurements and inspections reported in the following were performed from the smooth side of the specimens that was in contact with the mould.
The objective of defects D5 to D8 was somewhat different. Defects D5 and D6 are placed through thickness in reverse order with respect to defects D7 and D8. The aim here was to investigate the capability of the method to detect and distinguish two overlapping defects of different size. These latter four defects were on purpose not placed at symmetric through thickness
positions, in order to try to detect them from both sides of the laminate.
In addition to the above eight polyamide defects, a ninth one was manufactured (D9), consisting of a wrinkle of the sixth layer from the mould surface, along the full length of the test laminate. The width of this wrinkle varied from 10 to 15 mm. In the GFRP test laminates, this type of defect was manufactured by cutting the sixth layer in two pieces and overlapping them, since it was very difficult to create such a small wrinkle with woven roving glass reinforcement. The objective of defect D9 was to investigate the capability of the method to detect and dimensionalise such types of defects, which are common in typical marine composite structures.
Thickness values are given in Table 1, for both the nominal average uniform thickness of each test laminate, as well as for the increased thickness at the area of the wrinkle. The listed thicknesses are average values from five measurements in the case of the uniform thickness and from two measurements in the case of the thickness at the wrinkle.
1.3 Device and Equipment Set-Up
The ultrasonic inspection of the specimens was made by applying the Pulse – Echo method. A ¼ʺ diameter single crystal pulse-receiver flat transducer of 5 MHz from PANAMETRICS was used and the inspection was made with the specimens immersed in distilled water. The ultrasonic device used is ULTRAPAC II system (automated immersion system), in association with ULTRAWIN software for data acquisition, control and imaging. It is an automated immersion system, equipped with high speed computer-controlled stepped motor drivers. X-Y axis scanning speed exceeds 20 in/s (500 mm/s), with a resolution of 0.0027 in (0.07 mm). The direct vertical axis driver has a maximum speed of 1 in/s (25 mm/s) and a resolution better than 0.001 in (<0.025 mm). ULTRAPAC ΙΙ system uses a heavy duty Plexiglas tank supported by an also heavy duty aluminium framing system. A classic PC controls ULTRAPAC ΙΙ system, which employs a Pulse/Receiver card for the generation and receiving of the ultrasonic waves. A different card is also used for the analog to digital conversion of

Strojniški vestnik - Journal of Mechanical Engineering 57(2011)3, 192-203
196 Hasiotis, T. – Badogiannis, E. – Tsouvalis, N.G.
the incoming signal (A/D). A schematic view of the whole ultrasonics system can be seen in Fig. 2.
The software used (ULTRAWIN) is a data acquisition, control and imaging software, running under Microsoft Windows XP. It has a graphical user interface and is packed with features including real time A/B/C-scan imaging, powerful post processing modes like zoom pan cursors and waveform capture and display on sample location. The experimental system used has additional features to enhance ULTRAPAC’s capabilities, as they are described in [10]. Amongst others, clustering software (CLUSTWIN) and 3-D image software (3-D WIN) was used to conduct this research. Clustering software helps the user to locate certain areas of interest by establishing a specific parameter like cluster or defect size or upper and lower threshold of amplitude signal. In 3-D image software, any standard two dimensional C-scan image can be displayed as a 3-D projection. ULTRAWIN is also equipped with a six axes motion control, with multiple gate settings and a flexible hardware configuration.
Special techniques and tuning procedures were applied for the ultrasonic inspection of the various specimens. As described in [2], it is common practice to set the distance between the transducer and the material (water path) as close as possible to the end of the near field value of the transducer used (which is 33.2 mm in our case), in order to avoid the fluctuation of the acoustic pressure, which takes place into the near field zone. In addition, as [11] suggests, the specimens were placed on a glass plate, which was used as a reflective plane in order to distinguish the backwall echo from any other one.
The four reference specimens without defects were used for the determination of the sound velocity inside all types of materials. For this to be done an initial constant sound velocity was considered (i.e. that of steel) and a U/S dummy thickness measurement was performed at each specimen. [12] suggests that the actual sound velocity could be calculated by comparing this dummy thickness to the actual thickness of each specimen (see Table 1). The sound velocity calculated in this way was equal to 2.9 mm/ms in the case of the CFRP specimens and 2.79 mm/ms in the case of the GFRP ones.
A linear Distance Amplitude Correction (DAC) curve was used in order to increase the ultrasonic signal amplitude, thus facing the signal losses owing to factors like scattering, absorption, etc [13]. The gates were synchronized with the first echo from the specimen and the detection threshold was adjusted to a value above 20% of the Full Screen Height (FSH), thus avoiding the produced noise echoes. Depending on the nature of each defect to be detected, as well as on the area of interest to be inspected (i.e. layer by layer or backwall inspection), a detailed study was done aiming at selecting the most effective detection strategy. Four common strategies were studied; max-peak, max-thres, first-peak and first-thres.
2 RESULTS AND DISCUSSION
In the present study, results are presented only for the CFRP and the GFRP specimens manufactured with the vacuum infusion method.
Fig. 2. Schematic view of the ultrasonics system

Strojniški vestnik - Journal of Mechanical Engineering 57(2011)3, 192-203
197Application of Ultrasonic C-Scan Techniques for Tracing Defects in Laminated Composite Materials
Fig. 3. TOF C-scan of CFRP-VI specimen focused at backwall
Fig. 4. Amplitude C-scan of CFRP-VI specimen focused between the 3rd and the 5th layer

Strojniški vestnik - Journal of Mechanical Engineering 57(2011)3, 192-203
198 Hasiotis, T. – Badogiannis, E. – Tsouvalis, N.G.
2.1 CFRP Specimens
Fig. 3 presents the Time of Flight (TOF) C-scan of the CFRP specimen with defects. The gate was placed at backwall echo and the first-peak strategy was used in order to measure the thickness of the specimen. The thickness variation is presented in Fig. 3 with different colours. The gate width was properly adjusted in order to monitor the maximum thickness value of the wrinkle (see Table 1). Fig. 3 shows that the majority of the specimen thickness is around the average value of 3 mm, however there are areas where thickness is larger, like those around and on the artificial defects and at the wrinkle. The horizontal orthogonal white colour zone indicates that the wrinkle area has thickness greater than 3.28 mm.
B and B’-scans shown in the horizontal (below) and the vertical (on the right side) axis of the image, respectively, present the variation of the TOF parameter (thickness variation) within the thickness range illustrated at the legend on the left side of Fig. 3 (2.99 to 3.28 mm). B-scan displays the thickness variation along the horizontal cross-section of the specimen where the crosshair is placed and, similarly, B’-scan displays the thickness variation along the corresponding vertical cross-section. It is clearly shown that the existence of the artificial defects affect the local thickness of the specimen in the areas where the defects are located. This is recorded by an increase in TOF. It also becomes clear from B and B’-scans that defects D6 and D7 which overlap defects D5 and D8 cause high attenuation of the ultrasonic beam. Evidential of this high attenuation is the existence of white areas (no data points), which are present and clearly shown in the C-scan image. These white areas are also shown in the B and B’-scans as areas with no thickness.
In correspondence with this behaviour, the same pattern is illustrated in the B’-scan for the wrinkle defect. An area of no data points is present, which is indicative of high attenuation. This is due to the construction method of the wrinkle itself, where the 6th layer was folded in order to create the wrinkle. As a result, two additional layers exist at the area of the wrinkle. This fact is the cause for the excessive laminate thickness above the wrinkle which is reported in Table 1 and is almost
9% of the nominal thickness of the specimen. This increased thickness causes an increase in the attenuation at this specific region.
In Fig. 4 the amplitude C-scan of the CFRP specimen with defects is shown. The gate was properly adjusted in order to inspect the area from the top of the 3rd layer to the bottom of the 5th layer. The max-peak strategy has been applied in order to monitor all defects which have initially been placed between the 3rd and the 4th layer that is all defects except D6 and D8. These six defects are clearly shown in Fig. 4. The same figure also clearly shows the direction of the fibers, which is parallel to the short side of the specimen (x-axis of the test laminate, see Fig. 1).
In the sequence, the cluster analysis utility of the software was used, in order to determine the dimensions and the position of each defect and compare these values to the initially defined ones before the construction (Fig. 1). The clustering procedure was applied to isolate the group of data with amplitude greater than 70% of FSH, which correspond to defects. The aim of this analysis is to conclude on whether the applied procedure is able to accurately estimate the defects dimensions, as well as to define if the manufacturing procedures influenced the final position of the defects.
The last two columns of the “Cluster Results” window in Fig. 4 present the monitored data for the co-ordinates of the center of each defect (defects numbering is shown in the figure), where x- and y-axes origin is at the lower left corner of the picture. The comparison of these data to the corresponding initial values shown in Fig. 1 leads to the conclusion that the location of the defects was very accurately identified. Moreover, it is shown that the applied method scanned accurately the shape of each defect. The “Cluster Results” window in Fig. 4 presents also the ultrasonically monitored area of each defect (fourth column). By comparing these values to the original defect areas that can be calculated from Fig. 1, it can be seen that the ultrasonic method significantly overestimates the area of all defects, from 14 to 73%. These differences may be due to the fact that all layers above the artificial defects exhibit a small bending over the defects. As a result, echoes from the areas adjacent to the defects are amplified up to 70% of FSH and they are recognized as defect areas.
Strojniški vestnik - Journal of Mechanical Engineering 57(2011)3, 192-203
199Application of Ultrasonic C-Scan Techniques for Tracing Defects in Laminated Composite Materials
In Fig. 5, a 3-D amplitude C-scan of the CFRP specimen is given, focused from the 3rd down to the 5th layer. The six defects of the specimen D1 to D5 and D7 are clearly shown in this figure. They are coloured in red, since these areas are highly reflective to the acoustic energy.
2.2 GFRP Specimens
For the GFRP specimen, a max-peak strategy was applied and TOF was measured in order to determine the through thickness position of the peaks with maximum amplitude. In general, increased amplitude of peaks implies the existence of defects. On the other hand, increased amplitude areas are also monitored because of the high reflectivity of glass fibers.
Fig. 6 shows the TOF C-scan of the GFRP specimen, focused at the 3rd layer in order to detect defects D5 and D7. Similarly to Fig. 3, the histograms in the horizontal (below) and the vertical (on the right side) axis of the image show the B and B’-scans along the two corresponding axes of the crosshair, presenting the variation of the TOF parameter (thickness variation) within
the thickness range illustrated at the legend on the left side of Fig. 6 (0.95 to 1.34 mm). The echoes coming from the glass fibers result in a more or less uniform colour motive of the inspected surface. In this respect, Fig. 6 clearly shows the general pattern of the glass yarns, constituting the woven roving reinforcement. The orientation of the fibers is clearly shown. The echoes coming from the defects have the same TOF and, therefore, are much more concentrated and correspond to a single colour (red areas in the figure). In order to better define these areas, it has been also taken into account that their size must be considerably larger than the size of the repeated square crossings of the fibers in the warp and fill directions, whose dimension is approximately 4 mm. However, in the B and B΄-scan images it is shown that these red areas are not clearly defined, but they are mixed together with the echoes coming from the glass fibers. Therefore, these areas do not have a specific shape and well defined borders, as it is evident from Fig. 6.
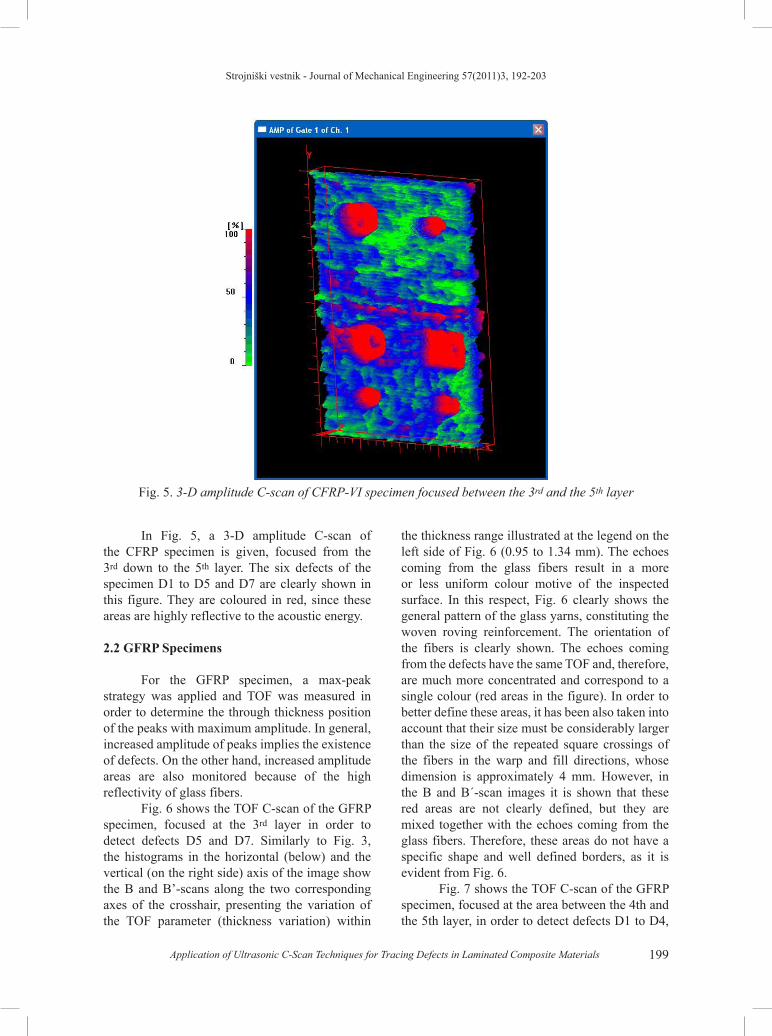
Fig. 7 shows the TOF C-scan of the GFRP specimen, focused at the area between the 4th and the 5th layer, in order to detect defects D1 to D4,
Fig. 5. 3-D amplitude C-scan of CFRP-VI specimen focused between the 3rd and the 5th layer
Strojniški vestnik - Journal of Mechanical Engineering 57(2011)3, 192-203
200 Hasiotis, T. – Badogiannis, E. – Tsouvalis, N.G.
Fig. 6. TOF C-scan of GFRP-VI specimen focused at the 3rd layer
Fig. 7. TOF C-scan of GFRP-VI specimen focused between the 4th and the 5th layer

Strojniški vestnik - Journal of Mechanical Engineering 57(2011)3, 192-203
201Application of Ultrasonic C-Scan Techniques for Tracing Defects in Laminated Composite Materials
together with the corresponding B-scan along the horizontal crosshair. The red coloured areas, which correspond to the two aforementioned defects, are reported to a depth of approximately 1.6 mm, which is very close to the actual through thickness position of these defects. Although the existence of the defects is indicated in Fig. 7, their geometry is once more not clearly defined, as was also the case in Fig. 6. This was due to the high attenuation that the glass fibers demonstrate, masking the reflections from the artificial defects. It is clearly illustrated in Fig. 7 that the reflections coming from the fibers are superimposed to the reflections coming from the defects. Spots of different colour and no data areas can also be observed in the area of the defects. This phenomenon is more severe at the boundaries of the defects.
As far as the wrinkle is concerned, it is also not precisely defined in the GFRP specimen. Intense echoes as well as high attenuation areas generated from the woven roving fabrics mask the echoes from the wrinkle in the GFRP specimen. Moreover, in contrast to the case of the CFRP specimens, it was here impossible to fold the 6th layer in order to construct the wrinkle; it was created by simply cutting the layer in two pieces and overlapping them. As a result, the percentage thickness increase of the wrinkle in the case of the GFRP specimens was smaller than that of the CFRP specimens.
The echoes generated from the woven roving fabrics are more intense at the intersection of the glass yarns in the fill and warp directions. That is why spots of different colour are displayed in GFRP C-scans. The different colour spots correspond to echoes coming from different depths of the material. The green spots mask the blue areas and the blue spots mask the red areas as shown in Figs. 6 and 7.
It must be noted that, in general, the echoes coming from the fibers are more intense compared to the echoes coming from the defects or other areas. This is due to the reported elliptic shape of the glass yarns’ cross section (see Fig. 8). As [7] mention, a convex or a concave shape reflects a big portion of ultrasonic energy.
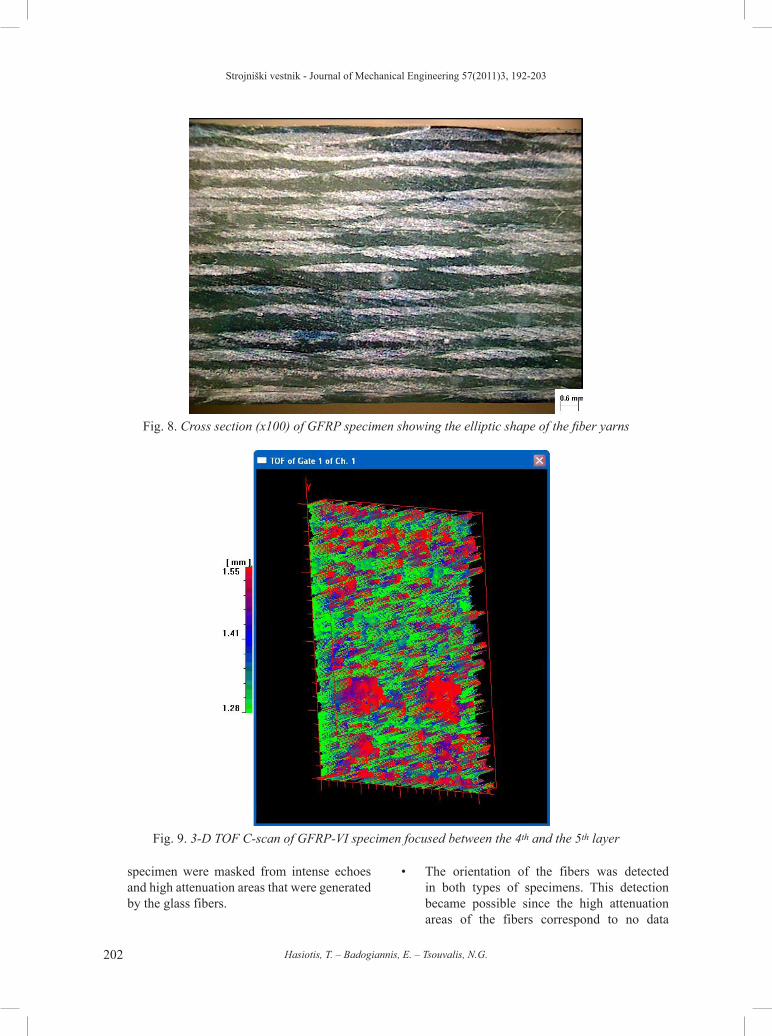
A 3-D TOF C-scan of the GFRP specimen is given in Fig. 9, focused from the 4th down to the 5th layer. Contrary to the CFRP specimen case, the four defects D1 to D4 are not clearly defined
in this figure. Echoes with high amplitude at the same TOF are monitored, but the shape of the resulting area is not geometrically specific. The above results verify the difficulty in detecting the shape and size of defects in glass reinforced composite thick laminates, as it is also reported in the literature [8] and [9].
3 CONCLUSIONS
The present study investigated the efficiency of the ultrasonic inspection method for detecting defects in laminated composite fibrous materials. The study involved two different materials. The artificial defects were of various shapes and sizes and were placed at various through thickness positions. The main conclusions that can be drawn out from this study are the following: • The equipment used and the procedures
applied proved much more efficient in the case of the CFRP specimens than when inspecting the GFRP ones. This happened due to the intense echoes that were reflected by the glass fibers, which were frequently overlapping the echoes coming from the actual defects. This phenomenon did not happen in the case of the carbon fibers.
• The method proved capable of accurately defining the position of the artificial embedded defects in the CFRP specimens. In the case of the GFRP specimens, position detection of these defects was less accurate, however satisfactory.
• The shape of the embedded defects was also accurately monitored in the case of the CFRP specimens. On the contrary, the shape of the defects in the GFRP specimens was not very well defined.
• Regarding the size of the defects, the method significantly overestimated their values in the case of the CFRP specimens for reasons explained in section 2.1, whereas it was not possible to estimate any size at all in the case of the GFRP specimens.
• The wrinkle defect was accurately detected in the case of the CFRP specimens, whereas it was not detected at all in the case of the GFRP ones. The reason for this is the fact that the echoes from the wrinkle of the GFRP
Strojniški vestnik - Journal of Mechanical Engineering 57(2011)3, 192-203
202 Hasiotis, T. – Badogiannis, E. – Tsouvalis, N.G.
Fig. 8. Cross section (x100) of GFRP specimen showing the elliptic shape of the fiber yarns
Fig. 9. 3-D TOF C-scan of GFRP-VI specimen focused between the 4th and the 5th layer
specimen were masked from intense echoes and high attenuation areas that were generated by the glass fibers.
• The orientation of the fibers was detected in both types of specimens. This detection became possible since the high attenuation areas of the fibers correspond to no data

Strojniški vestnik - Journal of Mechanical Engineering 57(2011)3, 192-203
203Application of Ultrasonic C-Scan Techniques for Tracing Defects in Laminated Composite Materials
points (white) areas, which are clearly visible in the c-scan images, taking also into account that these no data points are grouped in lines. The detection was much clearer in the case of the GFRP specimens than in the case of the CFRP ones due to the fact that the attenuation of the glass fibers is much higher than that of the carbon ones and moreover, since the glass woven roving reinforcement presented a much more coarse weaving in comparison to the more dense carbon unidirectional cloth.
• The ultrasonic inspection of the GFRP specimens would probably resulted in a much better representation of the actual situation if another sensor was used, having lower frequency (i.e. 3.5 MHz) and being focused. In this way, the scattering of echoes coming from the glass fibers would be considerably decreased.
Recapitulating, the currently followed procedure and the equipment used led to accurate predictions of the position and shape of the defects embedded in the CFRP specimens, even in the case of overlapping defects. The prediction was less accurate for the size of the defects. In the case of the GFRP specimens, the present method led only to a rough estimation of the position and the shape of the defects.
4 ACKNOWLEDGMENTS
The authors gratefully acknowledge Messrs A. Markoulis and H. Xanthis, technical personnel of Shipbuilding Technology Laboratory, for their valuable contribution in the construction of the test laminates.
5 REFERENCES
[1] Hayman, B., Berggreen, C., Tsouvalis, N.G. (2007). A review of the causes of production defects in marine composite structures and their influence on performance. Proceedings of the 1st International Conference on Marine Structures, Glasgow.
[2] ASNT, Non-destructive testing handbook (1991). Volume 7: Ultrasonic testing, American Society for Non-destructive Testing, 2nd Ed., p. 151, 197, 244.
[3] ASM Handbook (1992). Volume 17: Non-destructive Evaluation and Quality Control. American Society for Metals, 9th Ed., p. 516.
[4] Lloyd, P.A. (1989). Ultrasonic system for imaging delaminations. Composite Materials, Ultrasonics, vol. 27, p. 8-18.
[5] Imielinska, K., Castaings, M., Wojtyra, R., Haras, J., Le Clezio, Hosten, B. (2004). Air-coupled ultrasonic c-scan technique in impact response testing of carbon fibre and hybrid: glass, carbon and kevlar/epoxy composites. Journal of Materials Processing Technology, vol. 157-158, p. 513-522.
[6] Liu, L., Zhang, B.M., Wang, D.F., Wu, Z.J. (2006). Effects of cure cycles on void content and mechanical properties of composite laminates. Composite Structures, vol. 73, p. 303-309.
[7] Chang, J., Zheng, C., Ni, Q.-Q. (2006). The ultrasonic wave propagation in composite materials and its characteristic evaluation, Composite Structures, vol. 75, p. 451-456.
[8] Scarponi, C., Briotti, G. (2000). Ultrasonic technique for the evaluation of delaminations on CFRP, GFRP, KFRP. Composite Materials, Composites: Part B, vol. 31, p. 237-243.
[9] Tittmann, B.R., Crane, R. (2000). Ultrasonic inspection of composites. Kelly, A., Zweben, C. (Eds.), Comprehensive Composite Materials, Elsevier, New York, p. 259-320.
[10] ULTRAWIN Software (2002). User’s Manual, Rev. 2.58.
[11] Roth, D.J. (1997). Using a single transducer ultrasonic imaging method to eliminate the effect of thickness variation, image of ceramic and composite plates. Journal of Non-destructive Evaluation, vol. 16, no. 2, p. 101-119.
[12] Prassianakis, I. (2003). NDT of materials: ultrasonics method. National Technical University of Athens Press, Athens, p. 192. (in Greek)
[13] Pfeiffer, U., Hillger, W. (2006). Spectral distance amplitude control for ultrasonic inspection of composite components. Proceedings of the European Conference of Non-destructive Testing ECNDT 2006, Berlin.