Application of the Generalized Scaling Law to Liquefiable ... · saturated sand layer of 1/100...
12
Application of the Generalized Scaling Law to Liquefiable Model Ground Tetsuo TOBITA, and Susumu IAI Synopsis A series of centrifuge model tests are conducted under the scheme of the modeling of models technique to find issues on the generalized scaling law for dynamic centrifuge tests (Iai et al., 2005). In a series of dynamic tests on a flat, saturated sand layer of 1/100 scale, four different centrifugal accelerations from 5 g to 70 g are employed on the scaled models for which the prototype is uniquely given. The models are exposed to sinusoidal input accelerations with 0.65 Hz and amplitudes of 2.5 m/s 2 and 3.1 m/s 2 in prototype scale. For response during shaking, nearly identical accelerations and excess pore-water pressure buildups are recorded for all the cases in the prototype scale. Discrepancies are found on surface settlements and duration time for dissipation of excess pore-water pressure. The major causes of the discrepancy may be (1) the duration time for the initial consolidation, (2) small value of the shear modulus due to low confining stress in model ground under low centrifugal acceleration, and (3) reduced permeability due to adsorption of viscous fluids on sand particles. 1. Introduction Application of the geotechnical centrifuge modeling to design practice was considered in the past (e.g., Craig, 1984); however, with increasing demands on performance-based design of large structures, physical model testing seems to be facing limitations due to modeling techniques and equipment. This is where the breakthrough for physical modeling can be addressed as to directly apply test results of large prototypes to performance-based design practice. This may be one of the challenging topics for the geotechnical centrifuge community to be linked with industry (Terashi et al., 2004; Gaudin et al., 2010). One of the great advantages of numerical analyses is that response of full-scale structures can be readily simulated, and parametric studies can be conducted just by changing numbers in input files. However, numerical methods are solely validated through results of physical model tests or real-scale behavior of geotechnical structures. Despite the fact that results of numerical analyses are merely an approximation, they have often been used for quantitative evaluation of structural behaviors without comparing results of computation with other numerical or physical models. Use of a geotechnical centrifuge has an advantage in accurately simulating real-scale behavior in a scaled model by applying the same confining stresses to the model ground as prototypes. In the centrifuge model testing, although structural models have to be small and simplified, the prototype behavior is approximated in accordance with scaling laws (e.g., Garnier et al., 2007), and it qualitatively represents prototype behavior. One of the major obstacles for application of physical modeling results to performance-based design practice is that a specific prototype cannot be tested due to restrictions associated with experimental conditions, such as the size of the model container and scaling effects on materials. For 1-g model testing, to overcome these restrictions, the size of the experimental facility has become larger and larger so that real-scale models can be tested [e.g., E-defense (Tokimatsu et al., 2007), U.C. San Diego (Einde et al., 2004)]. However, for geotechnical structures, development of a larger research facility may still have limitations because, even with such a large facility, physical 京都大学防災研究所年報 第 54 号 B 平成 23 年 6 月 Annuals of Disas. Prev. Res. Inst., Kyoto Univ., No. 54 B, 2011 ― 225 ―
Transcript of Application of the Generalized Scaling Law to Liquefiable ... · saturated sand layer of 1/100...

Application of the Generalized Scaling Law to Liquefiable Model Ground
Tetsuo TOBITA, and Susumu IAI
Synopsis
A series of centrifuge model tests are conducted under the scheme of the modeling of models technique to find issues on the generalized scaling law for dynamic centrifuge tests (Iai et al., 2005). In a series of dynamic tests on a flat, saturated sand layer of 1/100 scale, four different centrifugal accelerations from 5 g to 70 g are employed on the scaled models for which the prototype is uniquely given. The models are exposed to sinusoidal input accelerations with 0.65 Hz and amplitudes of 2.5 m/s2 and 3.1 m/s2 in prototype scale. For response during shaking, nearly identical accelerations and excess pore-water pressure buildups are recorded for all the cases in the prototype scale. Discrepancies are found on surface settlements and duration time for dissipation of excess pore-water pressure. The major causes of the discrepancy may be (1) the duration time for the initial consolidation, (2) small value of the shear modulus due to low confining stress in model ground under low centrifugal acceleration, and (3) reduced permeability due to adsorption of viscous fluids on sand particles.
1. Introduction
Application of the geotechnical centrifuge
modeling to design practice was considered in the
past (e.g., Craig, 1984); however, with increasing
demands on performance-based design of large
structures, physical model testing seems to be
facing limitations due to modeling techniques and
equipment. This is where the breakthrough for
physical modeling can be addressed as to directly
apply test results of large prototypes to
performance-based design practice. This may be
one of the challenging topics for the geotechnical
centrifuge community to be linked with industry
(Terashi et al., 2004; Gaudin et al., 2010).
One of the great advantages of numerical
analyses is that response of full-scale structures
can be readily simulated, and parametric studies
can be conducted just by changing numbers in
input files. However, numerical methods are
solely validated through results of physical model
tests or real-scale behavior of geotechnical
structures. Despite the fact that results of
numerical analyses are merely an approximation,
they have often been used for quantitative
evaluation of structural behaviors without
comparing results of computation with other
numerical or physical models.
Use of a geotechnical centrifuge has an
advantage in accurately simulating real-scale
behavior in a scaled model by applying the same
confining stresses to the model ground as
prototypes. In the centrifuge model testing,
although structural models have to be small and
simplified, the prototype behavior is
approximated in accordance with scaling laws
(e.g., Garnier et al., 2007), and it qualitatively
represents prototype behavior. One of the major
obstacles for application of physical modeling
results to performance-based design practice is
that a specific prototype cannot be tested due to
restrictions associated with experimental
conditions, such as the size of the model container
and scaling effects on materials. For 1-g model
testing, to overcome these restrictions, the size of
the experimental facility has become larger and
larger so that real-scale models can be tested [e.g.,
E-defense (Tokimatsu et al., 2007), U.C. San
Diego (Einde et al., 2004)]. However, for
geotechnical structures, development of a larger
research facility may still have limitations
because, even with such a large facility, physical
京都大学防災研究所年報 第 54 号 B 平成 23 年 6 月
Annuals of Disas. Prev. Res. Inst., Kyoto Univ., No. 54 B, 2011
― 225 ―

modeling with foundations and surrounding
ground has to be reduced due to factors inherent
in a large facility, such as the capacity of the
shake table, budget, etc.
Demands for the testing of large prototypes
are increasing under the restrictions mentioned
above. To resolve such demands and restrictions,
Iai et al. (2005) proposed the scaling law by
combining the scaling law for centrifuge testing
with the one for 1-g dynamic-model testing. They
call it the “generalized scaling law” in dynamic
centrifuge modeling. The objective of the present
study is to investigate and point out issues on the
applicability of the scaling law through the
technique of “modeling of models” for dynamic
behavior of flat, saturated sand deposits.
1.1 Brief review of the generalized scaling law
Scaling factors for physical model tests can
be introduced in general forms by choosing a set
of basic physical properties to be independent and
deriving the scaling factors for other properties
via governing equations of the analyzed system.
These primitive forms of scaling factors are listed
in row (4) in Table 1. In the concept of the
generalized scaling law, a model on a shaking
table in a geotechnical centrifuge is considered to
be a small-scale representation of a 1-g
shaking-table test. Figure 1 visualizes this concept
by introducing a virtual 1-g model to which the
prototype is scaled down via a similitude for 1-g
shaking-table tests (Iai, 1989). The virtual 1-g
model is subsequently scaled down by applying a
similitude for centrifuge tests to the actual
physical model. In this way, the geometric scaling
factors applied in 1-g tests (μ) [row (1) of Table 1]
can be multiplied with those for centrifuge tests
(η) [row (2) of Table 1], resulting in much larger
overall scaling factors λ=μη [row (1) of Table 1].
Table 1. Scaling factors (= Prototype/Model) in
physical model tests
Table 2. Generalized scaling factors implemented in the present study
Figure 1. Concept of “modeling of models”
applied to the generalized scaling.
2. Dynamic centrifuge tests on flat loose,
saturated sand deposit
To investigate the applicability of the
generalized scaling relations described above, a
(1)
scaling factor
for 1g test
(2)
scaling factor
for centrifuge
test
(3)
partitioned
scaling factor
(4)
generalized
scaling
factors
Length μ η μη λ
Density 1 1 1 1
Time μ0.75 η μ0.75η (λλε/λg)0.5
Frequency μ‐0.75 1/η μ‐0.75/η (λλε/λg)‐0.5
Acceleration 1 1/η 1/η λg
Velocity μ0.75 1 μ0.75 (λλελg)0.5
Displacement μ1.5 η μ1.5η λλε
Stress μ 1 μ λλg
Strain μ0.5 1 μ0.5 λε
Stiffness μ0.5 1 μ0.5 λλg/λε
Permeability μ0.75 η μ0.75η (λλε/λg)0.5
Pore pressure μ 1 μ λλg
Fluid Pressure μ 1 μ λλg
1 G: 20 10 2 1.43
Centrifuge: 5 10 50 70
Length 100 100 100 100
Density 1.00 1.00 1.00 1.00
Time 47.3 56.2 84.1 91.5
Frequency 0.0211 0.0178 0.0119 0.0109
Acceleration 0.200 0.100 0.0200 0.0143
Velocity 9.46 5.62 1.68 1.31
Displacement 447 316 141 120
Stress 20.0 10.0 2.00 1.43
Strain 4.47 3.16 1.41 1.20
Stiffness 4.47 3.16 1.41 1.20
Permeability 47.3 56.2 84.1 91.5
Pore pressure 20.0 10.0 2.00 1.43
Scaling factor (Prototype/Model)
MODEL VIRTUAL 1G PROTOTYPE
1/100
1/μ1/η μ = 100/η
― 226 ―
series of dynamic tests was conducted following
the principle of “modeling of models.” This
technique was introduced by Schofield (1980) to
assess the behavior of a prototype through
repetition of the test at different scales and
comparison of the results in prototype scale. In
the present study, without changing the actual size
of the physical model but varying the virtual 1-g
dimension, the overall scaling factor (λ=μη) is
kept constant (Fig. 1). Here, it is set to a fixed
value comprising different combinations of the
scaling factors for 1-g model testing, μ, and
centrifuge testing, η. Table 2 lists the applied
geometric scaling factors as well as frequencies
and amplitudes of the input motions employed in
the study. In what follows, units are in prototype
unless otherwise specified.
2.1 Test cases
Test cases are summarized in Table 3. In the
test series referred to Case A, centrifuge tests
under 5, 10, 50, and 70 g were employed with the
target amplitude of the input acceleration of 2.5
m/s2. In the tests referred to Case B, centrifugal
accelerations of 5, 10, and 50 g are carried out
with the target amplitude of the input acceleration
of 3.1 m/s2.
Input waves are sinusoidal, and their
frequency is fixed at 0.65 Hz, and duration is 35 s.
Note, for example, that a case specified by
“50B89” in Table 3 indicates that the centrifuge
test was conducted in 50 g with 8.9 min of
consolidation time in model scale in Case B. Here,
the time for consolidation is the duration time
given to the model to have a normally
consolidated condition under specified centrifugal
acceleration before shaking.
2.2 Test setup and experimental facilities
The tests were conducted in the geotechnical
centrifuge of the Disaster Prevention Research
Institute, Kyoto University, Japan, which has an
arm length of 2.5 m and is equipped with a
shaking table that allows us to expose the models
to dynamic excitation in the tangential direction
of flight. The instrumentation of the model is
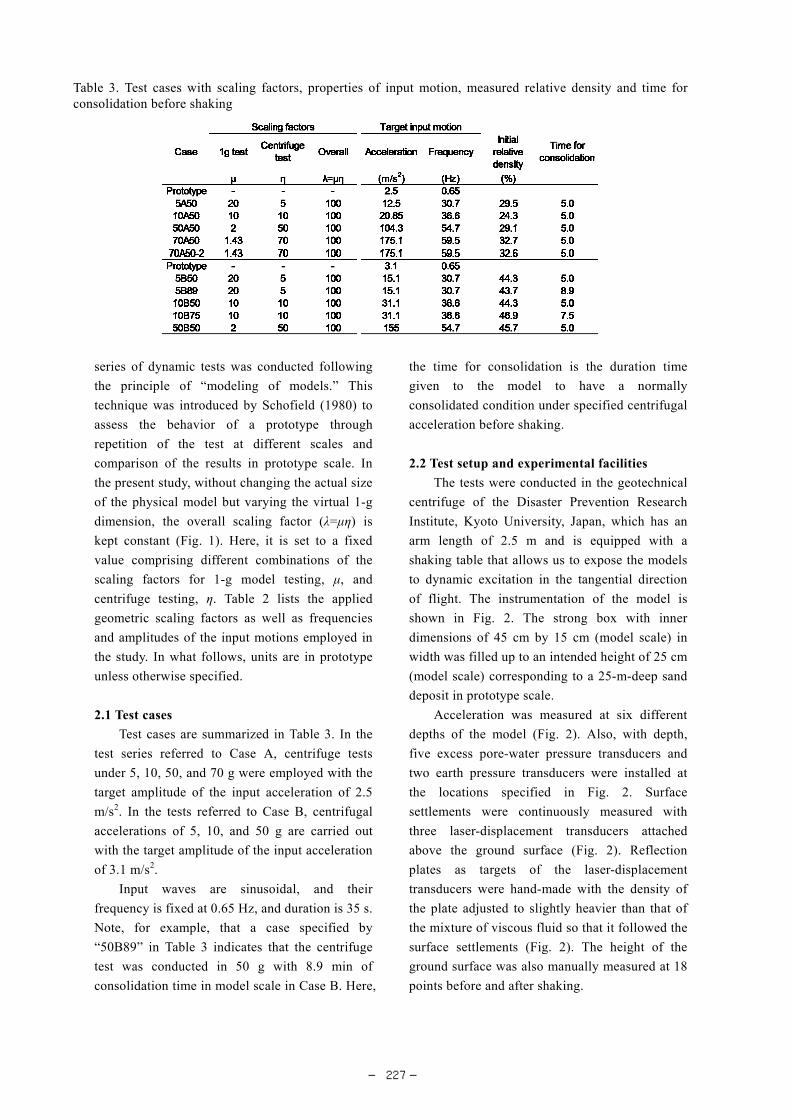
shown in Fig. 2. The strong box with inner
dimensions of 45 cm by 15 cm (model scale) in
width was filled up to an intended height of 25 cm
(model scale) corresponding to a 25-m-deep sand
deposit in prototype scale.
Acceleration was measured at six different
depths of the model (Fig. 2). Also, with depth,
five excess pore-water pressure transducers and
two earth pressure transducers were installed at
the locations specified in Fig. 2. Surface
settlements were continuously measured with
three laser-displacement transducers attached
above the ground surface (Fig. 2). Reflection
plates as targets of the laser-displacement
transducers were hand-made with the density of
the plate adjusted to slightly heavier than that of
the mixture of viscous fluid so that it followed the
surface settlements (Fig. 2). The height of the
ground surface was also manually measured at 18
points before and after shaking.
Table 3. Test cases with scaling factors, properties of input motion, measured relative density and time for consolidation before shaking
― 227 ―
The temperature of the model ground was
monitored by digital thermometers to have the
specific viscosity of the pore fluid [Metolose
(Shin-Etsu Chemical Co., 1997)], which is known
to be highly temperature-dependent.
Figure 2. Test setup. LD: Laser displacement
transducers. AC: Accelerometers. PW: Pore-water
pressure transducers. EP: Earth pressure
transducers. T: Thermometers.
2.3 Material of the model ground
The model ground was prepared with the
method of water pluviation. Dry silica sand No. 7
was sprinkled slowly into high viscous water from
approximately 10 cm (model scale) above water
level. The relative density in the models varied
between 24% and 33% in Case A, and 44% and
47% in Case B. Although the total weight of sand
in the box was kept constant, a slight difference in
achieved height of the model ground caused
variation of the relative density.
According to the scaling factors in Table 1,
the viscosity of the pore fluid has to be scaled
with a factor, μ0.75η, relative to water. This leads
to the use of higher viscous water in all tests than
that of usual centrifuge model tests. To produce
water with the specific viscosity for each test, the
methylcellulose solution (Metolose, SM-100) is
employed. The usability of the Metolose to
produce high viscous water without changing
other significant fluid parameters such as density
or surface tension was tested and verified up to
100 mPa s (Dewoolkar et al., 1999; Stewart et al.,
1998). As the viscosity of the Metolose solution is
highly dependent on the water temperature, it was
measured and adjusted by adding water or denser
solution before pouring it into the strong box.
3. Response of the model ground
3.1 Input and ground acceleration
To fulfill the purpose of the experiments, it
is important to give the identical input motions in
prototype scale for all of the test cases. Following
the scaling relations of acceleration and frequency
shown in Table 2, the input amplitude and time
scale of acceleration for each test in model scale
are determined (Table 3).
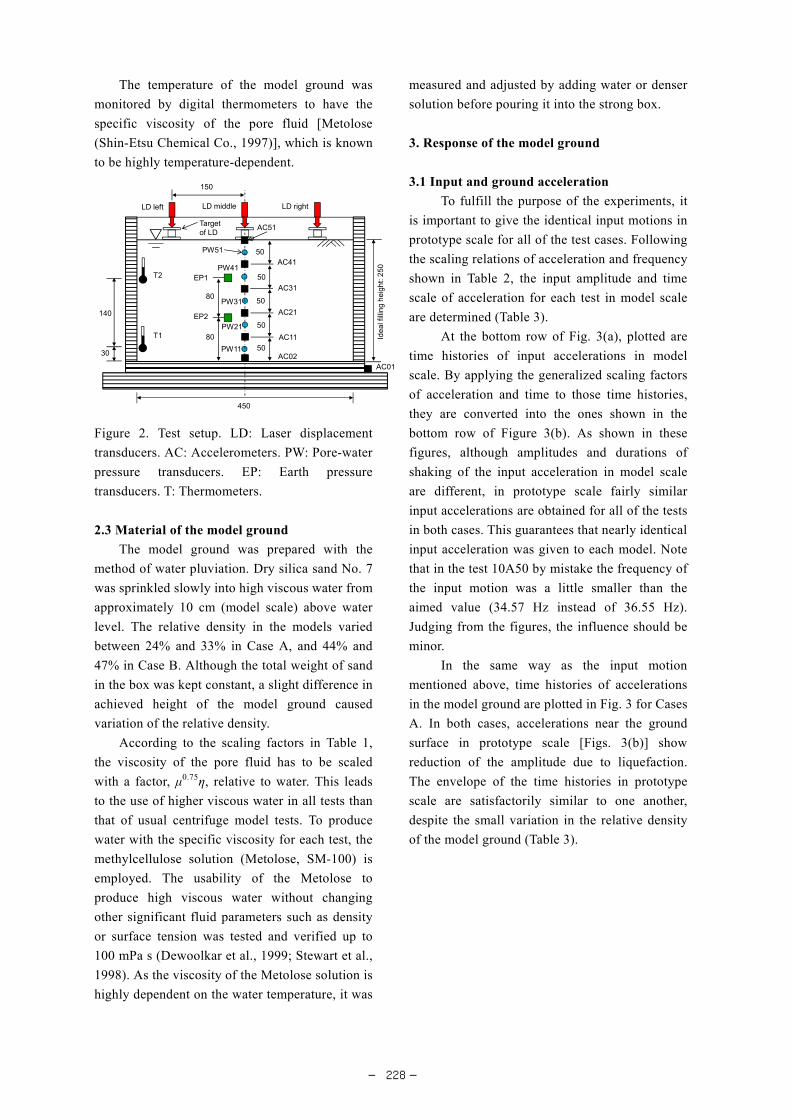
At the bottom row of Fig. 3(a), plotted are
time histories of input accelerations in model
scale. By applying the generalized scaling factors
of acceleration and time to those time histories,
they are converted into the ones shown in the
bottom row of Figure 3(b). As shown in these
figures, although amplitudes and durations of
shaking of the input acceleration in model scale
are different, in prototype scale fairly similar
input accelerations are obtained for all of the tests
in both cases. This guarantees that nearly identical
input acceleration was given to each model. Note
that in the test 10A50 by mistake the frequency of
the input motion was a little smaller than the
aimed value (34.57 Hz instead of 36.55 Hz).
Judging from the figures, the influence should be
minor.
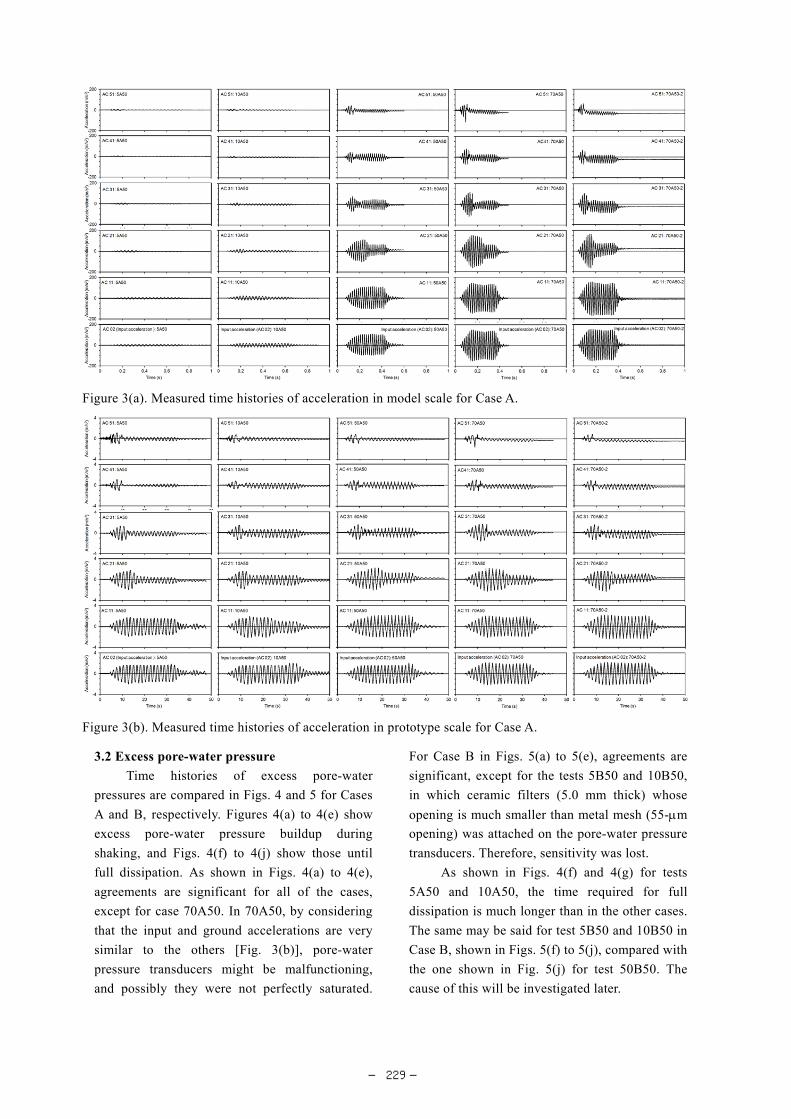
In the same way as the input motion
mentioned above, time histories of accelerations
in the model ground are plotted in Fig. 3 for Cases
A. In both cases, accelerations near the ground
surface in prototype scale [Figs. 3(b)] show
reduction of the amplitude due to liquefaction.
The envelope of the time histories in prototype
scale are satisfactorily similar to one another,
despite the small variation in the relative density
of the model ground (Table 3).
150
LD left LD middle LD right
Idea
l fill
ing
heig
ht: 2
50
140
30
80
80
AC02
AC11
AC21
AC31
AC41
AC51
AC01
50
50
50
50
50
T2
T1
PW51
PW41
PW31
PW21
PW11
EP1
EP2
450
Target of LD
― 228 ―
3.2 Excess pore-water pressure
Time histories of excess pore-water
pressures are compared in Figs. 4 and 5 for Cases
A and B, respectively. Figures 4(a) to 4(e) show
excess pore-water pressure buildup during
shaking, and Figs. 4(f) to 4(j) show those until
full dissipation. As shown in Figs. 4(a) to 4(e),
agreements are significant for all of the cases,
except for case 70A50. In 70A50, by considering
that the input and ground accelerations are very
similar to the others [Fig. 3(b)], pore-water
pressure transducers might be malfunctioning,
and possibly they were not perfectly saturated.
For Case B in Figs. 5(a) to 5(e), agreements are
significant, except for the tests 5B50 and 10B50,
in which ceramic filters (5.0 mm thick) whose
opening is much smaller than metal mesh (55-m
opening) was attached on the pore-water pressure
transducers. Therefore, sensitivity was lost.
As shown in Figs. 4(f) and 4(g) for tests
5A50 and 10A50, the time required for full
dissipation is much longer than in the other cases.
The same may be said for test 5B50 and 10B50 in
Case B, shown in Figs. 5(f) to 5(j), compared with
the one shown in Fig. 5(j) for test 50B50. The
cause of this will be investigated later.
Figure 3(a). Measured time histories of acceleration in model scale for Case A.
Figure 3(b). Measured time histories of acceleration in prototype scale for Case A.
― 229 ―
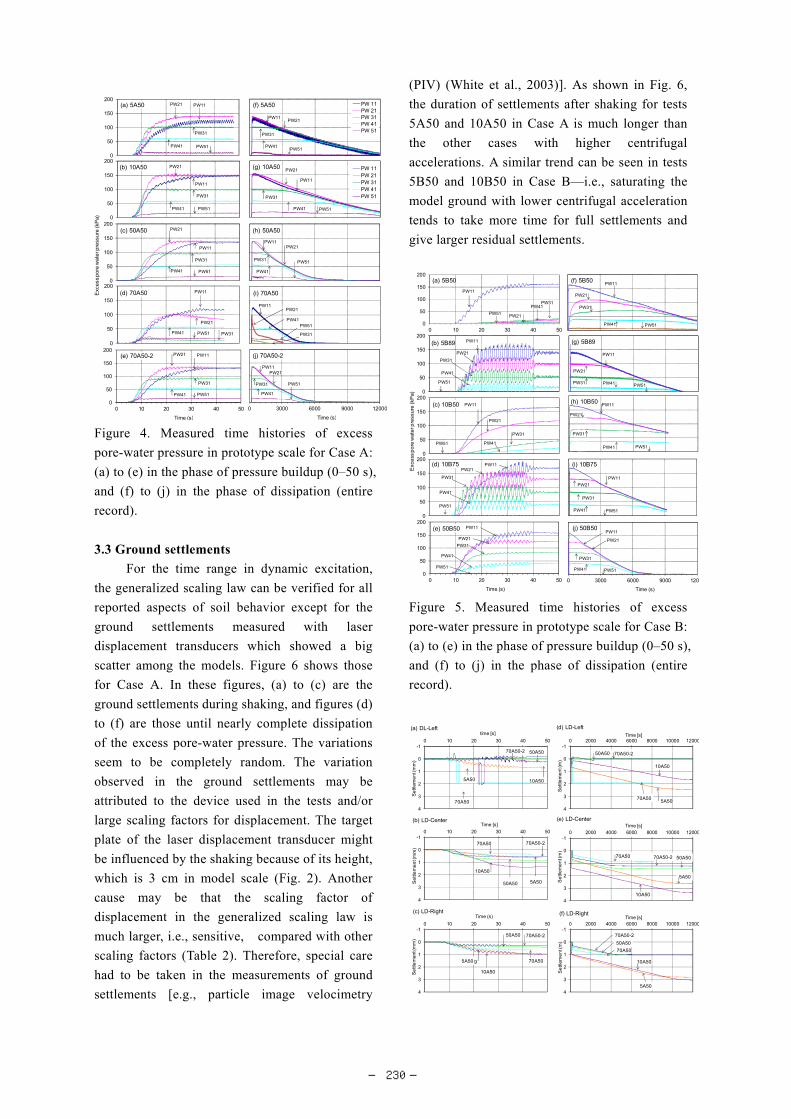
Figure 4. Measured time histories of excess
pore-water pressure in prototype scale for Case A:
(a) to (e) in the phase of pressure buildup (0–50 s),
and (f) to (j) in the phase of dissipation (entire
record).
3.3 Ground settlements
For the time range in dynamic excitation,
the generalized scaling law can be verified for all
reported aspects of soil behavior except for the
ground settlements measured with laser
displacement transducers which showed a big
scatter among the models. Figure 6 shows those
for Case A. In these figures, (a) to (c) are the
ground settlements during shaking, and figures (d)
to (f) are those until nearly complete dissipation
of the excess pore-water pressure. The variations
seem to be completely random. The variation
observed in the ground settlements may be
attributed to the device used in the tests and/or
large scaling factors for displacement. The target
plate of the laser displacement transducer might
be influenced by the shaking because of its height,
which is 3 cm in model scale (Fig. 2). Another
cause may be that the scaling factor of
displacement in the generalized scaling law is
much larger, i.e., sensitive, compared with other
scaling factors (Table 2). Therefore, special care
had to be taken in the measurements of ground
settlements [e.g., particle image velocimetry
(PIV) (White et al., 2003)]. As shown in Fig. 6,
the duration of settlements after shaking for tests
5A50 and 10A50 in Case A is much longer than
the other cases with higher centrifugal
accelerations. A similar trend can be seen in tests
5B50 and 10B50 in Case B—i.e., saturating the
model ground with lower centrifugal acceleration
tends to take more time for full settlements and
give larger residual settlements.
Figure 5. Measured time histories of excess
pore-water pressure in prototype scale for Case B:
(a) to (e) in the phase of pressure buildup (0–50 s),
and (f) to (j) in the phase of dissipation (entire
record).
0
50
100
150
200(a) 5A50 PW21 PW11
PW41 PW51
PW31
0
50
100
150
200(d) 70A50 PW11
PW41 PW51
PW21
PW31
0
50
100
150
200
0 10 20 30 40 50
Time (s)
(e) 70A50-2 PW21 PW11
PW41 PW51
PW31
0
50
100
150
200(c) 50A50 PW21
PW11
PW41 PW51
PW31
0
50
100
150
200(b) 10A50 PW21
PW11
PW41 PW51
PW31
Exc
ess
po
re w
ate
r pre
ssu
re (
kPa)
(f) 5A50 PW 11PW 21PW 31PW 41PW 51
PW21PW11
PW41PW51
PW31
(g) 10A50 PW 11PW 21PW 31PW 41PW 51
PW21
PW11
PW41 PW51
PW31
(h) 50A50
PW21PW11
PW41
PW51PW31
(i) 70A50
PW21PW11
PW41PW51
PW31
0 3000 6000 9000 12000
Time (s)
(j) 70A50-2
PW21PW11
PW41
PW51PW31
0
50
100
150
200
0 10 20 30 40 50
Time (s)
(e) 70A50-2 PW21 PW11
PW41 PW51
PW31
0
50
100
150
200
0 10 20 30 40 50
(a) 5B50
PW21
PW11
PW41
PW51
PW31
0
50
100
150
200(d) 10B75
PW21PW11
PW41
PW51
PW31
0
50
100
150
200
0 10 20 30 40 50
Time (s)
(e) 50B50
PW21
PW11
PW41
PW31
PW51
0
50
100
150
200(c) 10B50
PW21
PW11
PW41
PW31
PW51
0
50
100
150
200
(b) 5B89
PW21
PW11
PW41
PW31
PW51
Exc
ess
po
re w
ate
r pre
ssu
re (
kPa)
(f) 5B50
PW21
PW11
PW41 PW51
PW31
(g) 5B89
PW21
PW11
PW41 PW51PW31
(i) 10B75
PW21
PW11
PW41 PW51
PW31
0 3000 6000 9000 120
Time (s)
(j) 50B50
PW21
PW11
PW41 PW51
PW31
(h) 10B50
PW21
PW11
PW41 PW51
PW31
-1
0
1
2
3
4
0 10 20 30 40 50
Se
ttle
me
nt (
mm
)
Time (s)(c) LD-Right
5A50 g
10A50
70A50-250A50
70A50
-1
0
1
2
3
4
0 10 20 30 40 50
Se
ttle
me
nt (
mm
)
Time [s](b) LD-Center
5A50
10A50
70A50-2
50A50
70A50
-1
0
1
2
3
4
0 10 20 30 40 50
Se
ttle
me
nt (
mm
)
time [s](a) DL-Left
5A50 10A50
70A50-2 50A50
70A50
-1
0
1
2
3
4
0 2000 4000 6000 8000 10000 12000
Se
ttle
me
nt (
m)
Time [s](f) LD-Right
5A50
10A50
70A50-2
50A50
70A50
-1
0
1
2
3
4
0 2000 4000 6000 8000 10000 12000
Se
ttle
me
nt (
m)
Time [s](e) LD-Center
5A50
10A50
70A50-2 50A5070A50
-1
0
1
2
3
4
0 2000 4000 6000 8000 10000 12000
Se
ttle
me
nt (
m)
Time [s]
(d) LD-Left
5A50
10A50
70A50-250A50
70A50
― 230 ―
Figure 6. Measured time histories of ground
settlements in prototype scale for Case A: (a) to
(c) in the phase of shaking (0–50 s), and (d) to (f)
in the phase of dissipation (entire record).
4. Causes of discrepancy at low centrifugal
acceleration
The two cases that were run at 5 g and 10 g
showed much larger settlements and a longer
duration time for pore-water dissipation in
prototype scale than the others with higher
centrifugal accelerations. In what follows,
investigations are carried out to seek causes of the
low rate of dissipation of excess pore-water
pressure. Here, the following causes are assumed
and examined in detail: (1) effects of duration
time for consolidation before shaking, (2) effect
of low effective confining stress on the scaling
law, and (3) possible change of permeability of
the model ground due to adsorption of the
Metolose polymers on sand particles.
4.1 Effects of duration time for consolidation
before shaking
In the centrifuge experiments, to have a
normally consolidated ground under the given
centrifugal acceleration, the model ground is
consolidated about 5 min before shaking. This 5
min is arbitrarily taken because consolidation of
sandy ground is assumed to be quickly achieved.
However, with viscous fluid, this assumption may
be a mistake. In tests 5B50 and 10B50, fluid
viscosities are, respectively, 47.3 mPa s and 56.2
mPa s, and the duration times of consolidation are
converted, respectively, to 281 min and 237 min
in prototype scale, which is much shorter than that
of 50B50—421 min.
In Case B, tests 5B89 and 10B75 are the
cases in which the duration time of consolidation
is adjusted so that the same duration time with test
50B50 is applied in prototype scale. In tests 5B89
and 10B75, duration times for consolidation were,
respectively, 8.9 min and 7.5 min in model scale.
As shown in Fig. 5(g) for 5B89 and Fig. 5(i) for
10B75, dissipation of excess pore-water pressure
becomes quicker than in the cases of 5B50 and
10B50 and approaches the ones of 50 g’s [Fig.
5(j)]. Although the duration time of consolidation
is adjusted, a perfect match is not achieved,
indicating the existence of other causes on the
discrepancy.
4.2 Effect of low effective confining stress on
the scaling law
The curves in Figs. 4(f) to 4(j) and Figs. 5(f)
to 5(j) indicate that time required for excess
pore-water dissipation becomes systematically
shorter as the centrifugal acceleration increases.
Model behavior in dissipation phase can be
explained by the consolidation theory from which
the following formula for time for consolidation is
derived: 2 2
v v w v wT d m T dt
k Mk
(1)
where Tv: time factor, d: length of longest
drainage pass, mv: volume compressibility (=
1/M), M: constrained modulus of elasticity ( 2 (1 ) /(1 2 )G ), G: shear modulus, : Poisson
ratio, w: unit weight of water, and k: permeability.
In the experiments under low centrifugal
accelerations, the effective confining stress in
model scale is low in the dissipation phase, and
this may lead to a smaller stiffness of the model
ground. From Eq. (1), small elastic stiffness leads
to a long period of time for consolidation. Thus,
scaling of stiffness might have an influence on the
time of the pore-water dissipation.
In what follows, to investigate the scaling of
stiffness under low effective confining stress, a
scaling factor of strain in the 1-g model test is
derived by fitting with experimental results.
The scaling relation of time in general form
is expressed from row (4) in Table 1:
0.5/t g (2)
where , , and g are, respectively, the
scaling factor of length, strain, and acceleration.
In 1-g model tests, 1g , and if the scaling
factor of strain is assumed to be 0.5 (Iai,
1989), then the scaling factor of time is derived
from Eq. (2) as
0.75t (3)
For the scaling of centrifuge tests, 1/g , and
1 , and therefore the scaling of time is
― 231 ―

derived again from Eq. (2) to be
t (4)
When the scaling factor of a 1-g test is , and
that of a centrifuge test is , the generalized
scaling factor of time is given as a combination of
the above two factors (Iai et al., 2005):
0.75t (5)
In addition to the assumption made for the scaling
factor of strains, Iai (1989) showed that when the
shear-wave velocity is known, can be
determined more accurately with the following
form:
2
/s sp mV V
(6)
where ( )s pV and ( )s mV are, respectively, the
shear-wave velocity of the prototype and the
model. From Eq. (6), it is evident that the scaling
of stain is closely related to shear-wave velocity,
which can be readily converted to the shear
modulus of the ground.
Now, let us assume that the scaling factor of
strain can be expressed with as
(7)
Then, from Eq. (2), scaling of time becomes
0.5(1 )t
(8)
Scaling of time for the generalized scaling
relation is expressed as
0.5(1 )p mt t (9)
where pt and mt are, respectively, time in the
prototype and the model.
Next, parameter is fitted with
experimental results. Here, the duration time for
the excess pore-water dissipation measured at
PW31 of test 70A50-2, 70pt , in prototype scale,
is taken as a reference value to be fitted. Then, by
assuming that the duration times for dissipation at
PW31 of other tests, pt , in prototype scale, are
equal to 70pt :
70p pt t (10)
Rewriting Eq. (10) with the generalized scaling
factors given in Eq. (9), with time in model scale,
mt and 70mt ,
0.5(1 ) 0.5(1 ) 7070 70m mt t (11)
where 70 1.4 and 70 70 are scaling
factors, respectively, in the virtual 1-g and 70-g
centrifuge model tests. Here, the duration time for
dissipation in model scale is defined as,
2 1mt t t (12)
where 1t corresponds to the time when the
excess pore-water pressure at PW31 starts to
decrease [Figs. 7(a)–(d)] and 2t is defined at the
time when the excess pore-water pressure
becomes 5% of the one at time 1t . Solving Eq.
(11) for yields
17070
70
2 log log 1m
m
t
t
(13)
Table 4 shows the computed value of by
substituting mt and 70mt into Eq. (13).
In Table 4, the shear-wave ratio is computed
by
(1 ) / 2/s sp mV V (14)
and the ratio of shear modulus Gp/Gm is computed
by taking the square root of Eq. (14), where Gp
and Gm are, respectively, the shear modulus in
prototype and model scale.
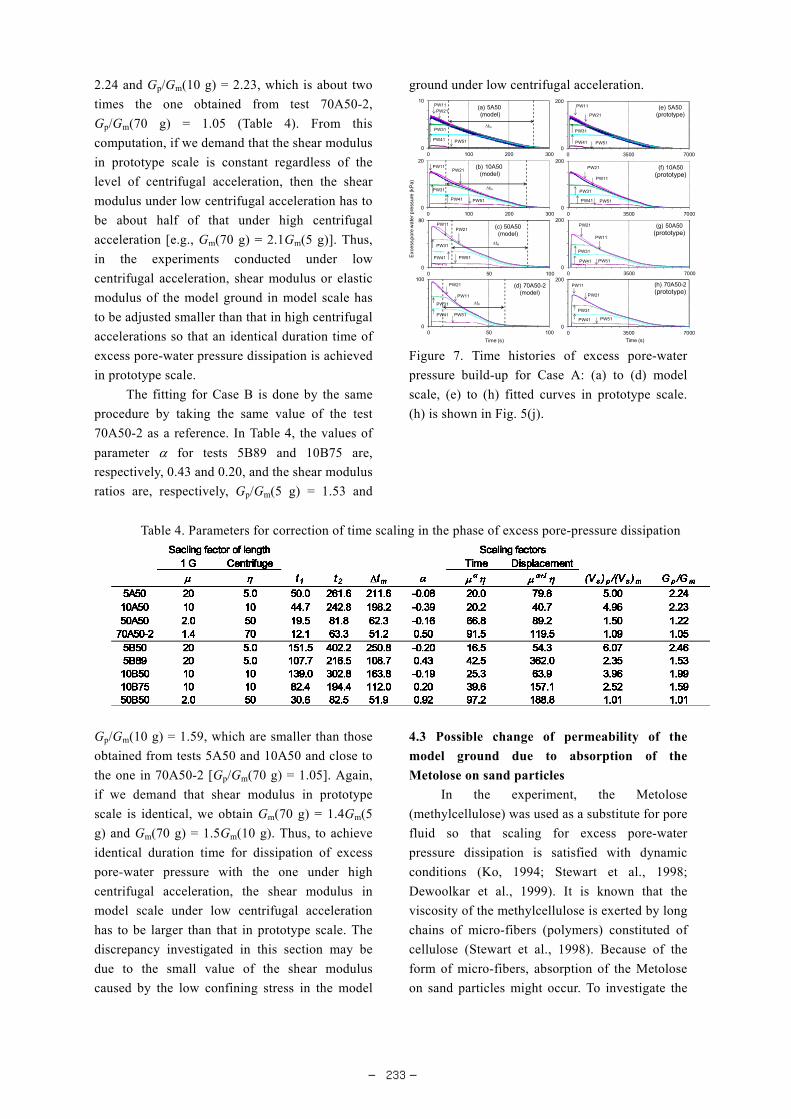
Figures 7 (a) to 7 (d) show time histories of
excess pore-water pressure in model scale. In
these figures, duration time for dissipation is
indicated by dotted vertical lines. Figures 7(e) to
7(h) are the converted time histories in prototype
scale with fitted scaling factors of time listed in
Table 4. Here, the scaling for stress—i.e., the
magnitude of excess pore-water pressure—is not
affected by the fitting procedure.
Ratios of the shear modulus computed with
the fitted parameter in Table 4 show that if the
1-g scaling factor of strain is given as 0.5
—i.e., = 0.5, then the ratio is assumed to be
Gp/Gm = 0.96. In this case (70A50-2), it is
recognized that the stiffness of the model and the
prototype are nearly equal.
For tests with low centrifugal accelerations,
5A50 and 10A50, the values of are negative,
and the ratios are computed to be Gp/Gm(5 g) =
― 232 ―
2.24 and Gp/Gm(10 g) = 2.23, which is about two
times the one obtained from test 70A50-2,
Gp/Gm(70 g) = 1.05 (Table 4). From this
computation, if we demand that the shear modulus
in prototype scale is constant regardless of the
level of centrifugal acceleration, then the shear
modulus under low centrifugal acceleration has to
be about half of that under high centrifugal
acceleration [e.g., Gm(70 g) = 2.1Gm(5 g)]. Thus,
in the experiments conducted under low
centrifugal acceleration, shear modulus or elastic
modulus of the model ground in model scale has
to be adjusted smaller than that in high centrifugal
accelerations so that an identical duration time of
excess pore-water pressure dissipation is achieved
in prototype scale.
The fitting for Case B is done by the same
procedure by taking the same value of the test
70A50-2 as a reference. In Table 4, the values of
parameter for tests 5B89 and 10B75 are,
respectively, 0.43 and 0.20, and the shear modulus
ratios are, respectively, Gp/Gm(5 g) = 1.53 and
Gp/Gm(10 g) = 1.59, which are smaller than those
obtained from tests 5A50 and 10A50 and close to
the one in 70A50-2 [Gp/Gm(70 g) = 1.05]. Again,
if we demand that shear modulus in prototype
scale is identical, we obtain Gm(70 g) = 1.4Gm(5
g) and Gm(70 g) = 1.5Gm(10 g). Thus, to achieve
identical duration time for dissipation of excess
pore-water pressure with the one under high
centrifugal acceleration, the shear modulus in
model scale under low centrifugal acceleration
has to be larger than that in prototype scale. The
discrepancy investigated in this section may be
due to the small value of the shear modulus
caused by the low confining stress in the model
ground under low centrifugal acceleration.
Figure 7. Time histories of excess pore-water
pressure build-up for Case A: (a) to (d) model
scale, (e) to (h) fitted curves in prototype scale.
(h) is shown in Fig. 5(j).
4.3 Possible change of permeability of the
model ground due to absorption of the
Metolose on sand particles
In the experiment, the Metolose
(methylcellulose) was used as a substitute for pore
fluid so that scaling for excess pore-water
pressure dissipation is satisfied with dynamic
conditions (Ko, 1994; Stewart et al., 1998;
Dewoolkar et al., 1999). It is known that the
viscosity of the methylcellulose is exerted by long
chains of micro-fibers (polymers) constituted of
cellulose (Stewart et al., 1998). Because of the
form of micro-fibers, absorption of the Metolose
on sand particles might occur. To investigate the
Exc
ess
po
re w
ate
r pre
ssu
re (
kPa)
0
10
0 100 200 300
(a) 5A50(model)
PW21PW11
PW41 PW51
PW31tm
0
20
0 100 200 300
(b) 10A50(model)
PW21PW11
PW41 PW51
PW31 tm
0
80
0 50 100
(c) 50A50 (model)
PW21PW11
PW41 PW51
PW31tm
0
100
0 50 100
Time (s)
(d) 70A50-2 (model)
PW21
PW11
PW41 PW51
PW31 tm
0
200
0 3500 7000
(e) 5A50(prototype) PW21
PW11
PW41 PW51
PW31
0
200
0 3500 7000
(f) 10A50(prototype)
PW21
PW11
PW41 PW51
PW31
0
200
0 3500 7000
(g) 50A50(prototype)
PW21
PW11
PW41 PW51
PW31
0
200
0 3500 7000
Time (s)
(h) 70A50-2(prototype)
PW21
PW11
PW41 PW51
PW31
Table 4. Parameters for correction of time scaling in the phase of excess pore-pressure dissipation
― 233 ―

possibility, falling head permeability tests for
silica sand No. 7 with a relative density of 40%
with water, Metolose solution, and silicone oil
were conducted. To conduct the tests, the
procedure specified by JIS A 1218:2009 was
followed. A metal-mesh net with a 75-m opening
was used as a filter instead of using filter paper in
order to prevent clogging of molecular cellulose.
Metolose of 2% solution was prepared and
adjusted to specific viscosity by adding water.
Details of tests can be found elsewhere (Tobita
and Iai, 2010, under preparation).
Test results are summarized in Fig. 8. As
shown in Fig. 8(a), the permeability of water is
kept constant at about 1.0 × 10⁻² cm/s. The
reduction of permeability after the 11th
measurements with water is -4.7%, which can be
regarded as no reduction. Meanwhile, as shown in
Figs. 8(b) and 8(c), the permeability with the
Metolose is consistently decreasing with the
number of measurements. For example, the
permeability of viscous fluid of 15 mPa s is
decreased 44% from 1.46 × 10⁻³ cm/s to 8.13 ×
10-4 cm/s after the 11th measurements. In Fig.
8(d), although the permeability of silicone oil is
fluctuating, the permeability is nearly constant for
each viscosity.
The reduction in permeability that may be
achieved with an increase in pore-fluid viscosity
is mostly smaller than the expected values. For
example, a reduction in permeability by a factor
of 2.4 was recorded for an increase in viscosity of
5 times. This trend has been reported in other
research papers (Stewart et al., 1998; Dewoolkar
et al., 1999). Stewart et al. (1998) gave possible
explanation for this discrepancy that both the
Metolose solution and silicone oil may exhibit
non-Newtonian behavior, where viscosity is not
constant with varying velocity gradients. If this is
the case, the reduction ratio of permeability would
be different than that of the inverse viscosity
ratio.
Based on the permeability test data, the
permeability of the model ground during the
centrifuge experiments might be slightly
decreasing as excess pore-water pressure
dissipates with the flow of the viscous fluid.
However, no clear trend is found on the
permeability change with the magnitude of
viscosity. Further investigation is necessary to
identify the effect of the absorption on the
reduction of permeability.
Figure 8. Variation of permeability with the
number of measurements: (a) water, (b)
methylcellulose of 5 and 15 mPa s, and (c)
methylcellulose of 30, 45, and 100 mPa s, and
silicone oil of 30, 50, 100 mPa s.
5. Conclusions
To investigate the applicability of the
generalized scaling law in dynamic centrifuge
tests on a flat, saturated sand deposit, the
modeling-of-models technique was implemented
in centrifugal accelerations ranging from 5 to 70 g,
and the results were compared in prototype scale.
In the tested range of an overall scaling factor of
1/100, the applicability of the generalized scaling
law was confirmed for the time range during
dynamic excitation. Only the ground settlement in
this time range varied among the cases with
different centrifugal accelerations. One of the
causes might be the target device for the laser
displacement transducers, which might not be
stable under shaking conditions. Additional care
has to be given to measurements of displacement
because in the generalized scaling law the scaling
factor of displacement tends to be very large, and
in turn very sensitive to the measurements.
In the time histories of pore-water
dissipation and surface settlements, two cases
below 10 g showed much larger duration time for
0.0E+00
1.0E-04
2.0E-04
3.0E-04
4.0E-04
5.0E-04
6.0E-04
1 2 3 4 5 6 7 8 9 10 11
30 mPa sec 45 mPa sec
100 mPa sec
Silica sand No. 7, Dr=40%
(c) Met. cellulose
0.0E+00
1.0E-04
2.0E-04
3.0E-04
4.0E-04
5.0E-04
6.0E-04
1 2 3 4 5 6 7 8 9 10 11
Number of measurememts
30 mPa sec 50 mPa sec
100 mPa sec
Silica sand No. 7, Dr=40% (d) Silicone oil
0.0E+00
5.0E-03
1.0E-02
1.5E-02
1 2 3 4 5 6 7 8 9 10 11
Pe
rme
ab
ility
(cm
/sec)
Silica sand No. 7, Dr=40%
(a) Water
0.0E+00
1.0E-03
2.0E-03
3.0E-03
4.0E-03
5.0E-03
1 2 3 4 5 6 7 8 9 10 11
Pe
rme
ab
ility
(cm
/s)
Number of measurements
5 mPa sec
15 mPa sec
Silica sand No. 7, Dr=40%
(b) Met. cellulose
― 234 ―

excess pore-water pressure dissipation.
Investigations are carried out for (1) the effect of
duration time for consolidation before shaking,
(2) the effect of low effective confining stress on
the scaling law, and (3) possible change of
permeability of the model ground due to
absorption of methylcellulose polymer on sand
particles. A major cause of the discrepancy might
be the small value of elastic stiffness due to low
confining stress in the model ground under low
centrifugal experiments. From results of the
permeability tests, use of the Metolose to
simulated dissipation behavior is questioned
because of the possibility of the absorption on
sand particles.
Acknowledgements
The authors acknowledge that experimental works
reported in the present paper are mainly conducted by
Ms. Loretta von der Tann (former graduate student at
ETH Zurich, Switzerland, visiting research student at
Kyoto University, Japan) and Mr. Yuji Yaoi (current
graduate student at Kyoto University, Japan.) as part of
their graduation thesis.
References
Craig, W. H. (1984), “Centrifuge modelling for
site-specific prototypes. Proc. Symp. Application of
Centrifuge Modelling to Geotechnical Design,”
University of Manchester, Balkema, Rotterdam,
473–489.
Dewoolkar, M. M., Ko, H.-Y., Stadler, A. T. and
Astaneh, S. M. F. (1999), “A substitute pore fluid
for seismic centrifuge modeling. Geotechnical
Testing Journal,” ASTM 22(3), 196–210.
Einde, V. D., Restrepo, L., Conte, J. P., Luco, E., Seible,
F., Filiatrault, A., Clark, A., Johnson, A., Gram, M.,
Kusner, D. and Thoen, B. (2004), “Development of
the George E. Brown Jr. network for earthquake
engineering simulation (NEES) large high
performance outdoor shake table at the University of
California, San Diego.” Proceedings of the 13th
World Conference on Earthquake Engineering,
Vancouver, BC, Canada, 1-6 August, Paper No.
3281.
Garnier, J., Gaudin, C., Springman, S. M., Culligan, P.
J., Goodings, D., Konig, D., Kutter, B., L., Phillips,
R., Randolph, M. F. and Thorel, L. (2007),
“Catalogue of scaling laws and similitude questions
in geotechnical centrifuge modelling.” International
Journal of Physical Modelling in Geotechnics, 7, No.
3, 1–23.
Gaudin, C., White, D. J., Bezuijen, A., Schaminee, P. E.
L. and Garnier, J. (2010), “Physical modelling with
industry — overview of practices and benefits,”
Physical Modelling in Geotechnics, Springman,
Laue & Seward (eds.). Taylor & Francis Group,
London, ISBN 978-0-415-59288-8.
Iai, S. (1989), “Similitude for shaking table tests on
soil-structure-fluid model in 1g gravitational field,”
Soils and Foundations, 29(1), 105–118.
Iai, S., Tobita, T. and Nakahara, T. (2005),
“Generalized scaling relations for dynamic
centrifuge tests,” Géotechnique, 55(5), 355–362.
Ko, H.-Y. (1994), “Modeling seismic problems in
centrifuges,” Centrifuge 94, Leung, Lee & Tan
(eds.), Balkema, Rotterdam, ISBN 90 5410 352 3
No. 3-12.
Schofield, A. N. (1980), “Cambridge geotechnical
centrifuge operations,” Géotechnique, 30(3), 227–
268.
Shin-Etsu Chemical Co., L. (1997), “Metolose
Brochure,” Cellulose Dept., 6-1, Ohtemachi
2-chome, Chiyoda-ku, Tokyo, Japan.
Stewart, D. P., Chen, Y.-R. and Kutter, B. L. (1998),
“Experience with the use of Methylcellulose as a
viscous pore fluid in centrifuge models,”
Geotechnical Testing Journal, 21(4), 365–369.
Tann, L. v. d., Tobita, T., and Iai, S. (2010).
"Applicability of two stage scaling in dynamic
centrifuge tests on saturated sand deposits." 7th
International Conference on Physical Modelling in
Geotechnics (ICPMG 2010), Springman, Laue &
Seward (eds), 191-196.
Terashi, M., Katagiri, M. and Ohishi, K. (2004), “Ten
years centrifuge operation at a consulting firm,”
International Journal of Physical Modelling in
Geotechnics, 4(1), 1–10.
Tobita, T., Iai, S., and Noda, S. (2009). "Study on
generalized scaling law in centrifuge modeling with
flat layered media." Proceedings of the 17th
International Conference on Soil Mechanics and
Geotechnical Engineering (17th ICSMGE), M.
Hamza et al. (Eds.), 664-667.
― 235 ―

Tobita, T., Iai, S., and Tann, L. v. d. (2010).
"Application of the generalized scaling law to
saturated ground." Submitted to the International
Journal of Physical Modelling in Geotechnics.
Tobita, T. and Iai, S. (2010), “Limitation of
methylcellulose as a viscous pore fluid in physical
model testing,” (Under preparation for publication.)
Tokimatsu, K., Suzuki, H., Tabata, K. and Sato, M.
(2007), “Three dimensional shaking table tests on
soil-pile-structure models using E-Defense facility,”
4th International Conference on Earthquake
Engineering, June 25–28, Thessaloniki, Greece.
White, D. J., Take, W. A. and Bolton, M. D. (2003),
“Soil deformation measurement using particle image
velocimetry (PIV) and photogrammetry,”
Géotechnique, 53(7), 619–63
飽和地盤に対する拡張型相似則の適用性
飛田哲男・井合進
要 旨
“Modeling of models”の手法を用い,動的遠心模型実験に用いられる拡張型相似則(Iai, et al. 2005)の適用
性を検討する。実物の100分の1の飽和砂質水平成層地盤を対象に,遠心加速度を5gから70gに変化させ実
験を行う。模型地盤に対し,プロトタイプスケールで最大入力加速度振幅2.5m/s2と3.1m/s2,振動数0.65Hz
の正弦波を与えた。いずれの実験ケースにおいても,振動中の応答加速度,水圧の挙動については,プ
ロトタイプ換算値でほぼ一致した。しかし,振動後の過剰間隙水圧の消散過程において,10g以下の低い
遠心加速度を用いた場合に,50g以上の高い遠心場の場合と比較して,消散時間が4倍以上長くなる現象
が見られた。低い遠心場では,有効拘束圧が小さいため地盤の弾性係数が小さく,圧密理論から予測さ
れるように,圧密時間(=水圧消散時間)が長くなるものと推察される。
キーワード: 遠心模型実験,相似則,液状化
― 236 ―