APPLICATION OF SIX SIGMA USING DEFINE MEASURE GARMENT … · improvement model PDCA...
17
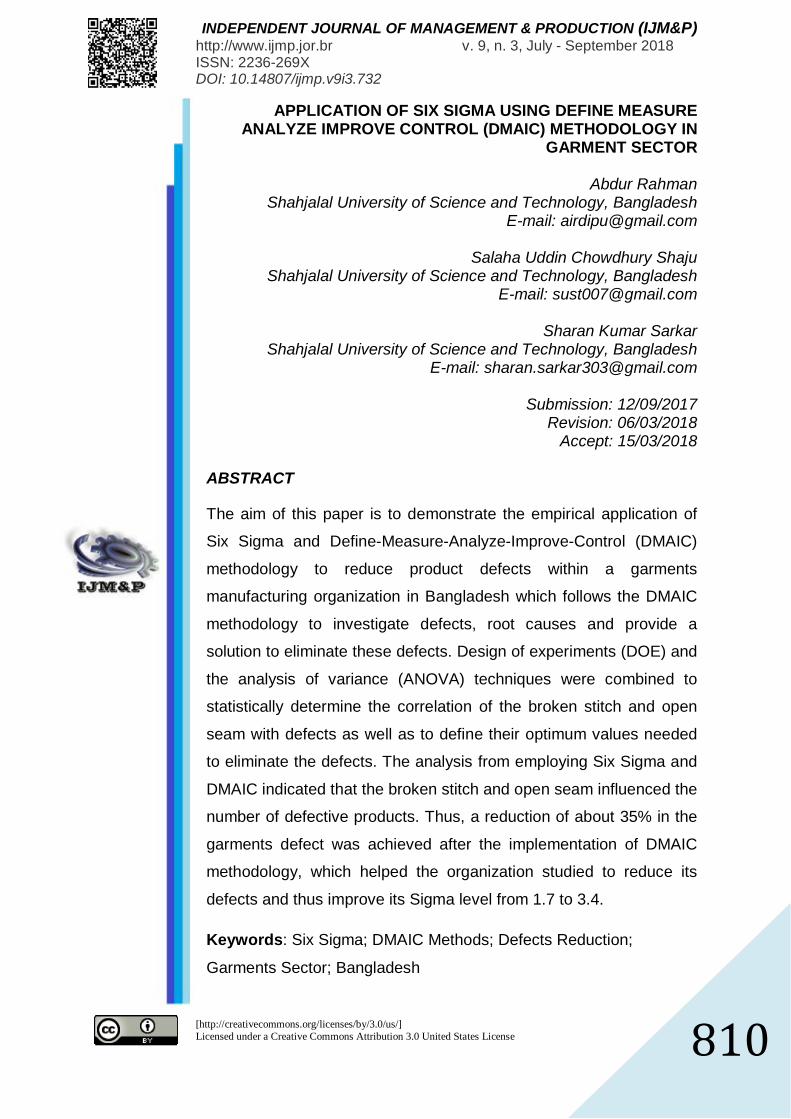
INDEPENDENT JOURNAL OF MANAGEMENT & PRODUCTION (IJM&P) http://www.ijmp.jor.br v. 9, n. 3, July - September 2018 ISSN: 2236-269X DOI: 10.14807/ijmp.v9i3.732 [http://creativecommons.org/licenses/by/3.0/us/] Licensed under a Creative Commons Attribution 3.0 United States License 810 APPLICATION OF SIX SIGMA USING DEFINE MEASURE ANALYZE IMPROVE CONTROL (DMAIC) METHODOLOGY IN GARMENT SECTOR Abdur Rahman Shahjalal University of Science and Technology, Bangladesh E-mail: [email protected] Salaha Uddin Chowdhury Shaju Shahjalal University of Science and Technology, Bangladesh E-mail: [email protected] Sharan Kumar Sarkar Shahjalal University of Science and Technology, Bangladesh E-mail: [email protected] Submission: 12/09/2017 Revision: 06/03/2018 Accept: 15/03/2018 ABSTRACT The aim of this paper is to demonstrate the empirical application of Six Sigma and Define-Measure-Analyze-Improve-Control (DMAIC) methodology to reduce product defects within a garments manufacturing organization in Bangladesh which follows the DMAIC methodology to investigate defects, root causes and provide a solution to eliminate these defects. Design of experiments (DOE) and the analysis of variance (ANOVA) techniques were combined to statistically determine the correlation of the broken stitch and open seam with defects as well as to define their optimum values needed to eliminate the defects. The analysis from employing Six Sigma and DMAIC indicated that the broken stitch and open seam influenced the number of defective products. Thus, a reduction of about 35% in the garments defect was achieved after the implementation of DMAIC methodology, which helped the organization studied to reduce its defects and thus improve its Sigma level from 1.7 to 3.4. Keywords: Six Sigma; DMAIC Methods; Defects Reduction; Garments Sector; Bangladesh
Transcript of APPLICATION OF SIX SIGMA USING DEFINE MEASURE GARMENT … · improvement model PDCA...
INDEPENDENT JOURNAL OF MANAGEMENT & PRODUCTION (IJM&P) http://www.ijmp.jor.br v. 9, n. 3, July - September 2018 ISSN: 2236-269X DOI: 10.14807/ijmp.v9i3.732
[http://creativecommons.org/licenses/by/3.0/us/] Licensed under a Creative Commons Attribution 3.0 United States License
810
APPLICATION OF SIX SIGMA USING DEFINE MEASURE ANALYZE IMPROVE CONTROL (DMAIC) METHODOLOGY IN
GARMENT SECTOR
Abdur Rahman Shahjalal University of Science and Technology, Bangladesh
E-mail: [email protected]
Salaha Uddin Chowdhury Shaju Shahjalal University of Science and Technology, Bangladesh
E-mail: [email protected]
Sharan Kumar Sarkar Shahjalal University of Science and Technology, Bangladesh
E-mail: [email protected]
Submission: 12/09/2017 Revision: 06/03/2018
Accept: 15/03/2018
ABSTRACT
The aim of this paper is to demonstrate the empirical application of
Six Sigma and Define-Measure-Analyze-Improve-Control (DMAIC)
methodology to reduce product defects within a garments
manufacturing organization in Bangladesh which follows the DMAIC
methodology to investigate defects, root causes and provide a
solution to eliminate these defects. Design of experiments (DOE) and
the analysis of variance (ANOVA) techniques were combined to
statistically determine the correlation of the broken stitch and open
seam with defects as well as to define their optimum values needed
to eliminate the defects. The analysis from employing Six Sigma and
DMAIC indicated that the broken stitch and open seam influenced the
number of defective products. Thus, a reduction of about 35% in the
garments defect was achieved after the implementation of DMAIC
methodology, which helped the organization studied to reduce its
defects and thus improve its Sigma level from 1.7 to 3.4.
Keywords: Six Sigma; DMAIC Methods; Defects Reduction;
Garments Sector; Bangladesh
[http://creativecommons.org/licenses/by/3.0/us/] Licensed under a Creative Commons Attribution 3.0 United States License
811
INDEPENDENT JOURNAL OF MANAGEMENT & PRODUCTION (IJM&P) http://www.ijmp.jor.br v. 9, n. 3, July - September 2018 ISSN: 2236-269X DOI: 10.14807/ijmp.v9i3.732
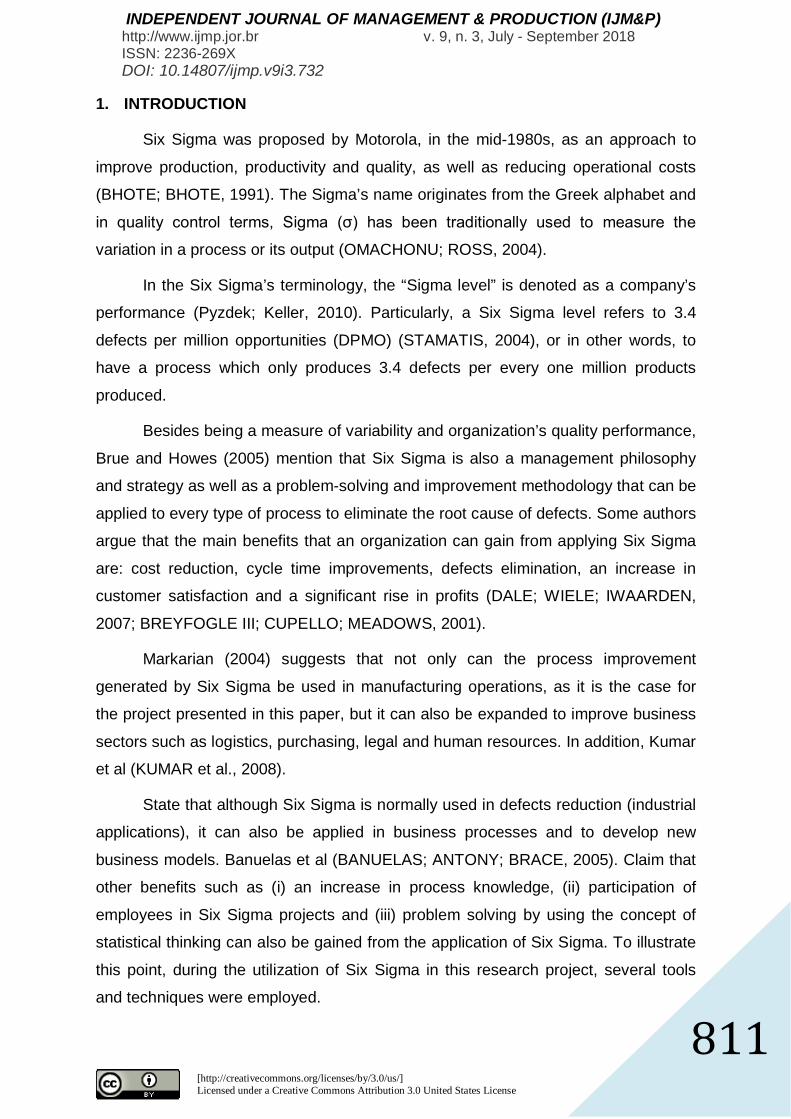
1. INTRODUCTION
Six Sigma was proposed by Motorola, in the mid-1980s, as an approach to
improve production, productivity and quality, as well as reducing operational costs
(BHOTE; BHOTE, 1991). The Sigma’s name originates from the Greek alphabet and
in quality control terms, Sigma (σ) has been traditionally used to measure the
variation in a process or its output (OMACHONU; ROSS, 2004).
In the Six Sigma’s terminology, the “Sigma level” is denoted as a company’s
performance (Pyzdek; Keller, 2010). Particularly, a Six Sigma level refers to 3.4
defects per million opportunities (DPMO) (STAMATIS, 2004), or in other words, to
have a process which only produces 3.4 defects per every one million products
produced.
Besides being a measure of variability and organization’s quality performance,
Brue and Howes (2005) mention that Six Sigma is also a management philosophy
and strategy as well as a problem-solving and improvement methodology that can be
applied to every type of process to eliminate the root cause of defects. Some authors
argue that the main benefits that an organization can gain from applying Six Sigma
are: cost reduction, cycle time improvements, defects elimination, an increase in
customer satisfaction and a significant rise in profits (DALE; WIELE; IWAARDEN,
2007; BREYFOGLE III; CUPELLO; MEADOWS, 2001).
Markarian (2004) suggests that not only can the process improvement
generated by Six Sigma be used in manufacturing operations, as it is the case for
the project presented in this paper, but it can also be expanded to improve business
sectors such as logistics, purchasing, legal and human resources. In addition, Kumar
et al (KUMAR et al., 2008).
State that although Six Sigma is normally used in defects reduction (industrial
applications), it can also be applied in business processes and to develop new
business models. Banuelas et al (BANUELAS; ANTONY; BRACE, 2005). Claim that
other benefits such as (i) an increase in process knowledge, (ii) participation of
employees in Six Sigma projects and (iii) problem solving by using the concept of
statistical thinking can also be gained from the application of Six Sigma. To illustrate
this point, during the utilization of Six Sigma in this research project, several tools
and techniques were employed.

[http://creativecommons.org/licenses/by/3.0/us/] Licensed under a Creative Commons Attribution 3.0 United States License
812
INDEPENDENT JOURNAL OF MANAGEMENT & PRODUCTION (IJM&P) http://www.ijmp.jor.br v. 9, n. 3, July - September 2018 ISSN: 2236-269X DOI: 10.14807/ijmp.v9i3.732
Therefore, skills in the use of these tools were built up within the staff of the
Thai organization studied. Consequently, people involved in the project enhanced
their knowledge and skills. As a reason, not only does an organization itself gain
benefits from implementing Six Sigma in terms of cost savings, productivity
enhancement and process improvement, but individuals involved also increase their
statistical knowledge and problem-solving skills by conducting a Six Sigma project.
One of the Six Sigma’s distinctive approaches to process and quality
improvement is DMAIC (GARZA-REYES et al., 2010). The DMAIC model refers to
five interconnected stages (i.e. define, measure, analyze, improve and control) that
systematically help organizations to solve problems and improve their processes.
Dale et al (DALE; WIELE; IWAARDEN, 2007) briefly defines the DMAIC phases as
follows:
Define – this stage within the DMAIC process involves defining the team’s
role; project scope and boundary; customer requirements and expectations and the
goals of selected projects (GIJO; SCARIA; ANTONY, 2011).
Measure – this stage includes selecting the measurement factors to be
improved and providing a structure to evaluate current performance as well as
assessing, comparing and monitoring subsequent improvements and their capability.
Analyze – this stage centers in determining the root cause of problems
(defects), understanding why defects have taken place as well as comparing and
prioritizing opportunities for advance betterment (ADAMS; GUPTA; WILSON, 2003).
Improve – this step focuses on the use of experimentation and statistical
techniques to generate possible improvements to reduce the amount of quality
problems and/or defects.
Control – finally, this last stage within the DMAIC process ensures that the
improvements are sustained and that ongoing performance is monitored. Process
improvements are also documented and institutionalized.
DMAIC resembles the Deming’s continuous learning and process
improvement model PDCA (plan-do-check-act) (DEMING, 1993). Within the Six
Sigma’s approach, DMAIC assures the correct and effective execution of the project
by providing a structured method for solving business problems (HAMMER;
GODING, 2001).
[http://creativecommons.org/licenses/by/3.0/us/] Licensed under a Creative Commons Attribution 3.0 United States License
813
INDEPENDENT JOURNAL OF MANAGEMENT & PRODUCTION (IJM&P) http://www.ijmp.jor.br v. 9, n. 3, July - September 2018 ISSN: 2236-269X DOI: 10.14807/ijmp.v9i3.732
Pyzdek (2003) considers DMAIC as a learning model that although focused
on “doing” (i.e. executing improvement activities), also emphasizes the collection and
analysis of data, previously to the execution of any improvement initiative. This
provides the DMAIC’s users with a platform to take decisions and courses of action
based on real and scientific facts rather than on experience and knowledge, as it is
the case in many organizations, especially small and medium side enterprises
(SMEs) (GARZA-REYES et al., 2010).
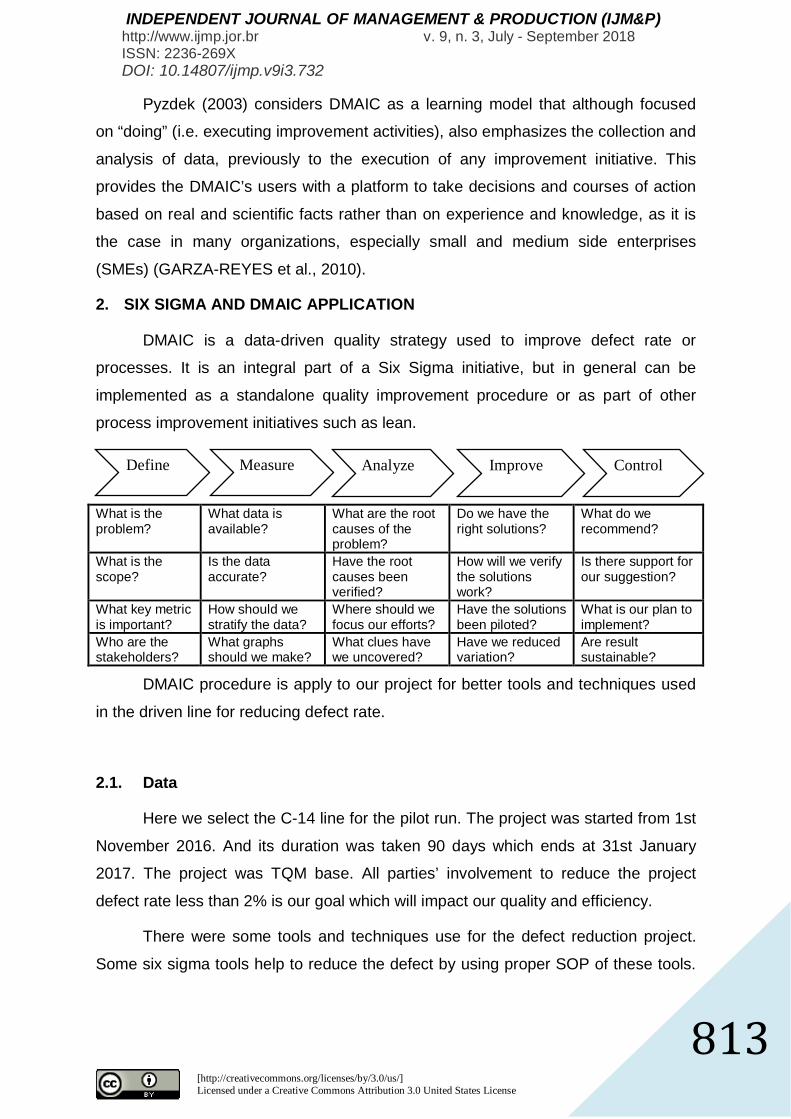
2. SIX SIGMA AND DMAIC APPLICATION
DMAIC is a data-driven quality strategy used to improve defect rate or
processes. It is an integral part of a Six Sigma initiative, but in general can be
implemented as a standalone quality improvement procedure or as part of other
process improvement initiatives such as lean.
What is the problem?
What data is available?
What are the root causes of the problem?
Do we have the right solutions?
What do we recommend?
What is the scope?
Is the data accurate?
Have the root causes been verified?
How will we verify the solutions work?
Is there support for our suggestion?
What key metric is important?
How should we stratify the data?
Where should we focus our efforts?
Have the solutions been piloted?
What is our plan to implement?
Who are the stakeholders?
What graphs should we make?
What clues have we uncovered?
Have we reduced variation?
Are result sustainable?
DMAIC procedure is apply to our project for better tools and techniques used
in the driven line for reducing defect rate.
2.1. Data
Here we select the C-14 line for the pilot run. The project was started from 1st
November 2016. And its duration was taken 90 days which ends at 31st January
2017. The project was TQM base. All parties’ involvement to reduce the project
defect rate less than 2% is our goal which will impact our quality and efficiency.
There were some tools and techniques use for the defect reduction project.
Some six sigma tools help to reduce the defect by using proper SOP of these tools.
Define Measure Analyze Improve Control

[http://creativecommons.org/licenses/by/3.0/us/] Licensed under a Creative Commons Attribution 3.0 United States License
814
INDEPENDENT JOURNAL OF MANAGEMENT & PRODUCTION (IJM&P) http://www.ijmp.jor.br v. 9, n. 3, July - September 2018 ISSN: 2236-269X DOI: 10.14807/ijmp.v9i3.732
The project mainly follows DMAIC process. In individual stages of DMAIC six sigma
tools helps to clear the path of the defect reduction.
2.2. Background of the study
First the line defect rate is more than 60% whereas the project defect rate is
43% respectively. Because of all buyer wants to check AQL level 2.5, the target
would be project defect rate reduces less than 2%. If we want to pass our good
garments for shipment within Buyer required AQL 1.5% or 2.5%, we have to fix up
on an average 2% defect rate in a line or factory. It was found from the statistical
analysis.
2.3. Assumption
Our focusing point is operator as a first QI. Individual process checking is
much easier rather than whole body checking. Also, here TLS (traffic light system)
maintained properly. We also focused on preventive maintenance of the machine by
maintaining various machine components life time. The project defect root-cause
would be identified on time and involve all party’s awareness. It will be helpful to
reduce the defect rate.
2.4. Scope
The scope would be identified from the fishbone diagram. Here 6M’s (Men,
Machine, Material, Mother Nature, Method & Measurement) involved to analyze the
project. It will help to reach the root-cause direction. It will much easier to problem
finding and solving.
2.5. Milestone
The desired goal is to achieve project defect rate less than 2%. Also, the
milestone is to complete the project within desired time so that all project related
work is visualized by the Gantt chart accordingly.
2.6. Impact statement
If the Defect rate is decreasing day by day, the required output will increase
much higher than the present situation or vice-versa. Also, it would be helped to
improve the workers performance as well as line efficiency.
2.7. Success Measurement
[http://creativecommons.org/licenses/by/3.0/us/] Licensed under a Creative Commons Attribution 3.0 United States License
815
INDEPENDENT JOURNAL OF MANAGEMENT & PRODUCTION (IJM&P) http://www.ijmp.jor.br v. 9, n. 3, July - September 2018 ISSN: 2236-269X DOI: 10.14807/ijmp.v9i3.732
The reduction of project defect rate increasing success of this project. The
measurement of defect rate would be calculated from the overall line defect through
entry into the excel data sheet. This measurement sheet also helps to calculate the
DPMO of the project. It would be helpful to know the line sigma level. Also, apply
to know the process capability and sigma level of the project too.
2.8. Implementation of Six Sigma
Six Sigma can be a great success or failure, depending on how it is
implemented. Implementation strategies can vary organization to organizations,
depending on their distinct culture and strategic business goals. After completing a
needs assessment and deciding to implement Six Sigma, an organization has two
basic options: Implement a Six Sigma program or initiative and create a Six Sigma
infrastructure.
2.9. The Metrics of Six Sigma
Much confusion exists relative to the metrics of Six Sigma. The sigma level
(that is, sigma–quality level) sometimes used as a measurement within a Six Sigma
program includes a ±1.5s value to account for typical shifts and drifts of the mean,
where s is the standard deviation of the process. This sigma–quality level
relationship is not linear. In other words, a percentage unit improvement in parts per
million (ppm) defect rate (or defect per million opportunities [DPMO] rate) does not
equate to the same percentage improvement in the sigma–quality level. Three
common measures of process performance are - Defects per Unit (DPU), Defects
per Million Opportunities (DPMO) and Parts per Million Defective (PPM). The key to
understanding the difference between these terms is to understand the difference
between a defect and a defective item:
A defect refers to a flaw or discrepancy on an item where more than one flaw
(defect) can be found. For example, a hospital admission form contains several fields
of information that can be missing or incorrect, so a given form can have more than
one defect. This means that a sample of 10 forms can show more than 10 defects.
An item is said to be defective when the decision is made that the item is not
acceptable, based either on one characteristic or the accumulation of multiple
defects. This means that a sample of 10 items can show a maximum 10 defective
units.
[http://creativecommons.org/licenses/by/3.0/us/] Licensed under a Creative Commons Attribution 3.0 United States License
816
INDEPENDENT JOURNAL OF MANAGEMENT & PRODUCTION (IJM&P) http://www.ijmp.jor.br v. 9, n. 3, July - September 2018 ISSN: 2236-269X DOI: 10.14807/ijmp.v9i3.732
Defects per unit (DPU) – the average number of defects per unit of product.
(1)
For example, when 26 defects (flaws) are found on 10 units of product, the
DPU is 26/10 or 2.6 defects per unit.
Defects per Million Opportunities (DPMO) – a ratio of the number of defects in
1 million opportunities when an item can contain more than one defect. To calculate
DPMO, you need to know the total number of defect opportunities.
Parts per Million Defective (PPM) – the number of defective units in one
million units. (PPM is typically used when the number of defective products produced
is small so that a more accurate measure of the defective rate can be obtained than
with the percent defective).
2.10. Process Capability ( )
Process Capability is one of best tools for determining six sigma by
continuous improvement process. Process capability means that how the process is
capable to do its job. To obtain the efficiency we have to measure the capability of
the respective process which one has been performed by the machine or operator.
Every process has been done its own capability by the machine or operator
performance. It has a statistical formula based on USL (Upper specification limit) and
LSL (Lower specification limit). If we want to determine the value, then we should
guess the ULS and LSL. They are not a fixed value it will vary from process to
process and phenomenon to phenomenon. It depends on the respective person who
will deal with in quality issue or production team. The formula is given below-
Where, is the standard deviation.
[http://creativecommons.org/licenses/by/3.0/us/] Licensed under a Creative Commons Attribution 3.0 United States License
817
INDEPENDENT JOURNAL OF MANAGEMENT & PRODUCTION (IJM&P) http://www.ijmp.jor.br v. 9, n. 3, July - September 2018 ISSN: 2236-269X DOI: 10.14807/ijmp.v9i3.732
2.11. Process Capability Index ( )
Process capability index is referred to . It means the expected process
capability around the target value. Hence, we can say that is nothing but the
quality index. Here,
(6)
And
(7)
Where, and are the mean and standard deviation. Now we can write the
formula of as,
(8)
It is known as the process capability index. If we want to reach in 6 sigma,
then we have to more take care of every process and on its capability. It is one of the
paramount statistical continuous improvement measuring tools by which we can
know the three things together such as process capability, variability and sigma.
Evrey businessmen or manufacturers desire 1.33 Cpk and 6 sigma in the long run.
3. METHODOLOGY
In our defect reduction project, we use the DMAIC procedure to know the
desired sigma level as well as our defect rate position. It also helps us for further
improvement and what type of way we should follow the project. It is very important
to know the level of project completion so that DMAIC procedure helps us to know
the level of the project. Here every phase of the DMAIC has different tools which we
apply for go to the sustainable phase for controlling the desired outcome of the
project. Either it was defect rate or processes. The project have run on three months
which also visualize by gantt chart.
The DMAIC process easily lends itself to the project approach to quality
improvement encouraged and promoted by Juran (JURAN; GODFREY, 1992). The
flowchart shows the DMAIC project how could go for right track and this chart help
us for further decision what it is (BORROR, 2009).
[http://creativecommons.org/licenses/by/3.0/us/] Licensed under a Creative Commons Attribution 3.0 United States License
818
INDEPENDENT JOURNAL OF MANAGEMENT & PRODUCTION (IJM&P) http://www.ijmp.jor.br v. 9, n. 3, July - September 2018 ISSN: 2236-269X DOI: 10.14807/ijmp.v9i3.732
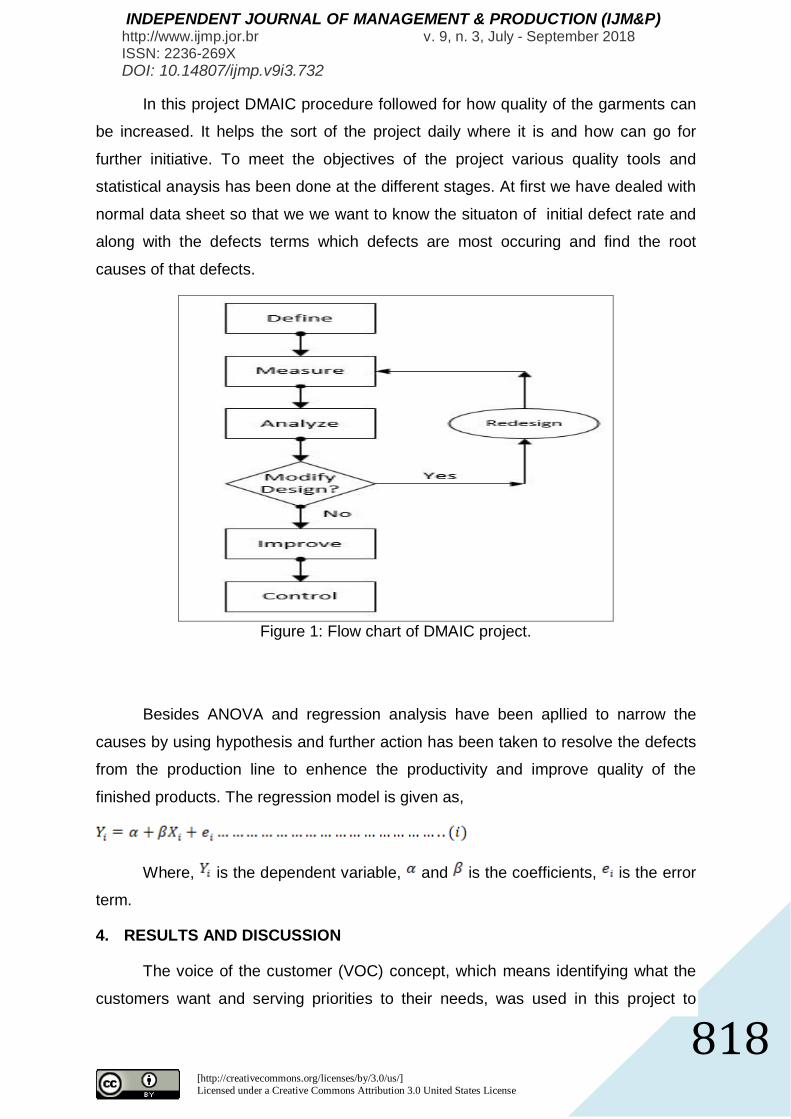
In this project DMAIC procedure followed for how quality of the garments can
be increased. It helps the sort of the project daily where it is and how can go for
further initiative. To meet the objectives of the project various quality tools and
statistical anaysis has been done at the different stages. At first we have dealed with
normal data sheet so that we we want to know the situaton of initial defect rate and
along with the defects terms which defects are most occuring and find the root
causes of that defects.
Figure 1: Flow chart of DMAIC project.
Besides ANOVA and regression analysis have been apllied to narrow the
causes by using hypothesis and further action has been taken to resolve the defects
from the production line to enhence the productivity and improve quality of the
finished products. The regression model is given as,
Where, is the dependent variable, and is the coefficients, is the error
term.
4. RESULTS AND DISCUSSION
The voice of the customer (VOC) concept, which means identifying what the
customers want and serving priorities to their needs, was used in this project to
[http://creativecommons.org/licenses/by/3.0/us/] Licensed under a Creative Commons Attribution 3.0 United States License
819
INDEPENDENT JOURNAL OF MANAGEMENT & PRODUCTION (IJM&P) http://www.ijmp.jor.br v. 9, n. 3, July - September 2018 ISSN: 2236-269X DOI: 10.14807/ijmp.v9i3.732
define, based on customer requirements we have select project’s objective. From
this point, voice of customer also ensured that the project problem, which was
defects reduction, became first priority for the improvement team and organization.
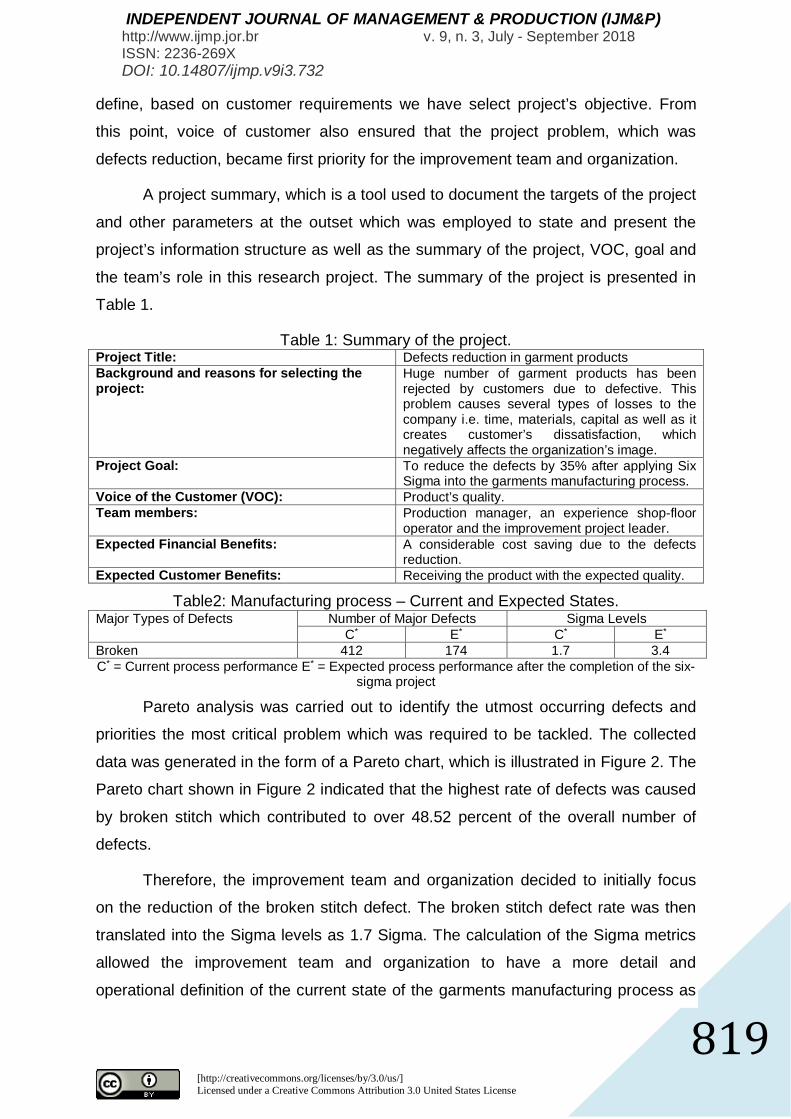
A project summary, which is a tool used to document the targets of the project
and other parameters at the outset which was employed to state and present the
project’s information structure as well as the summary of the project, VOC, goal and
the team’s role in this research project. The summary of the project is presented in
Table 1.
Table 1: Summary of the project. Project Title: Defects reduction in garment products Background and reasons for selecting the project:
Huge number of garment products has been rejected by customers due to defective. This problem causes several types of losses to the company i.e. time, materials, capital as well as it creates customer’s dissatisfaction, which negatively affects the organization’s image.
Project Goal:
To reduce the defects by 35% after applying Six Sigma into the garments manufacturing process.
Voice of the Customer (VOC): Product’s quality. Team members: Production manager, an experience shop-floor
operator and the improvement project leader. Expected Financial Benefits: A considerable cost saving due to the defects
reduction. Expected Customer Benefits: Receiving the product with the expected quality.
Table2: Manufacturing process – Current and Expected States. Major Types of Defects Number of Major Defects Sigma Levels
C* E* C* E*
Broken 412 174 1.7 3.4 C* = Current process performance E* = Expected process performance after the completion of the six-
sigma project
Pareto analysis was carried out to identify the utmost occurring defects and
priorities the most critical problem which was required to be tackled. The collected
data was generated in the form of a Pareto chart, which is illustrated in Figure 2. The
Pareto chart shown in Figure 2 indicated that the highest rate of defects was caused
by broken stitch which contributed to over 48.52 percent of the overall number of
defects.
Therefore, the improvement team and organization decided to initially focus
on the reduction of the broken stitch defect. The broken stitch defect rate was then
translated into the Sigma levels as 1.7 Sigma. The calculation of the Sigma metrics
allowed the improvement team and organization to have a more detail and
operational definition of the current state of the garments manufacturing process as

[http://creativecommons.org/licenses/by/3.0/us/] Licensed under a Creative Commons Attribution 3.0 United States License
820
INDEPENDENT JOURNAL OF MANAGEMENT & PRODUCTION (IJM&P) http://www.ijmp.jor.br v. 9, n. 3, July - September 2018 ISSN: 2236-269X DOI: 10.14807/ijmp.v9i3.732
well as the Six Sigma’s goal in terms of the garments process improvement. These
are shown in Table 3.
The next stage in the Six Sigma project and following the DMAIC
methodology, consisted in analyzing the root causes of this problem as well as
identifying an appropriate solution.
November 41 2 21 1 1 95 31Percent 48.5 24.9 23.0 3.7Cum % 48.5 73.4 96.3 1 00.0
Defect OtherOpenSkipBroken
900
800
700
600
500
400
300
200
1 00
0
1 00
80
60
40
20
0
Perce
nt
31
195211
412
Pareto for defect
Figure 2: Pareto chart for defect.
The figure 3 shows that initial line Defect Rate(DR) was too high that is 64 to
62 parcent and which was gradually decreasing day after day within one month.
Finally it shows the 24 parcent defect rate at the end of one month.
Figure 3: Project line defect rate (DR) before implimentation.

[http://creativecommons.org/licenses/by/3.0/us/] Licensed under a Creative Commons Attribution 3.0 United States License
821
INDEPENDENT JOURNAL OF MANAGEMENT & PRODUCTION (IJM&P) http://www.ijmp.jor.br v. 9, n. 3, July - September 2018 ISSN: 2236-269X DOI: 10.14807/ijmp.v9i3.732
The figure 4 shows that initial project Defect Rate (DR) was too high that is 43
to 39 parcent and which was gradually decreasing day after day within one month.
Finally it shows the 7 parcent defect rate at the end of one month.
Figure 4: Project defect rate (DR) before implimentation.
The figure 6 shows that initial line Defect Rate(DR) was too high that is 47 to
43 parcent and which was gradually decreasing day after day within the dead line.
Finally it shows the 14 parcent defect rate at the end of the project dead line.
Scope Area
Mother Nature
Measurements
Methods
Material
Machines
Man
Cut Mark not follow
Unskilled
Improper feed dog
Improper presser feed
Thread tension
Bobbin tension
Improper Thread
Poor fabric quality
Improper technique
Follow up
Mismatch of Size
Uneven cutting part
Production rush
Cause & Effect Diagram
Figure 5: Cause and effect diagram for scope area.
[http://creativecommons.org/licenses/by/3.0/us/] Licensed under a Creative Commons Attribution 3.0 United States License
822
INDEPENDENT JOURNAL OF MANAGEMENT & PRODUCTION (IJM&P) http://www.ijmp.jor.br v. 9, n. 3, July - September 2018 ISSN: 2236-269X DOI: 10.14807/ijmp.v9i3.732
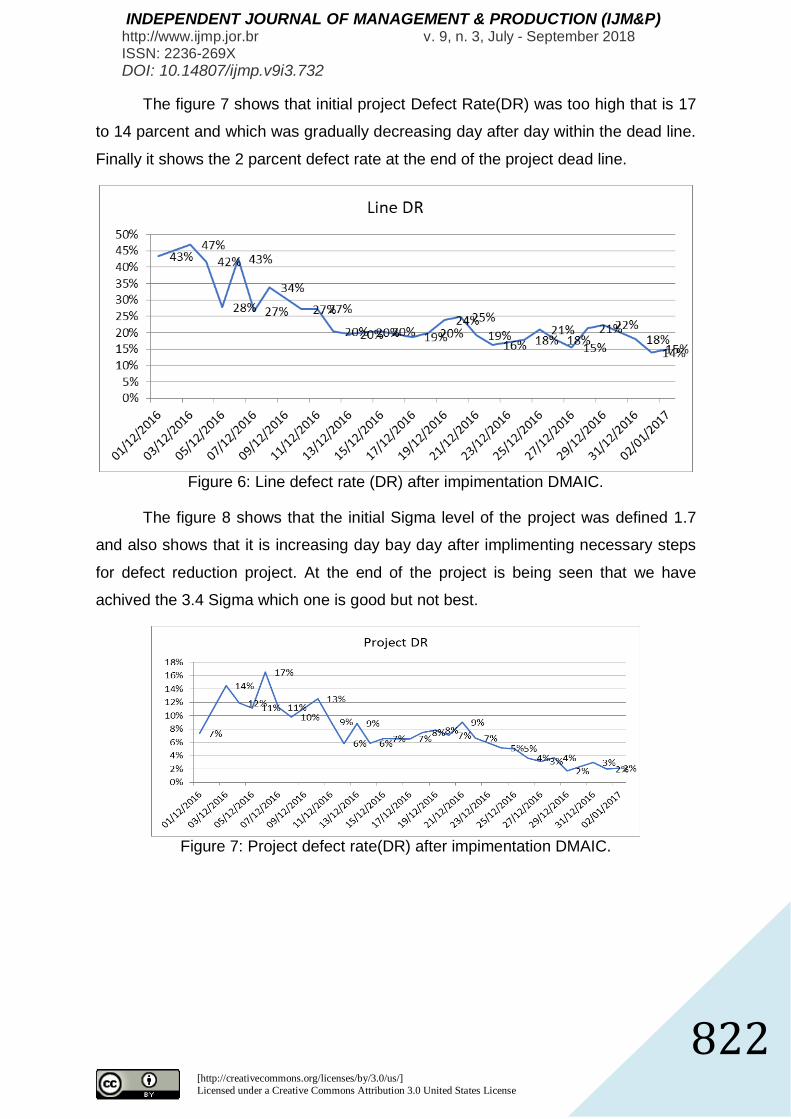
The figure 7 shows that initial project Defect Rate(DR) was too high that is 17
to 14 parcent and which was gradually decreasing day after day within the dead line.
Finally it shows the 2 parcent defect rate at the end of the project dead line.
Figure 6: Line defect rate (DR) after impimentation DMAIC.
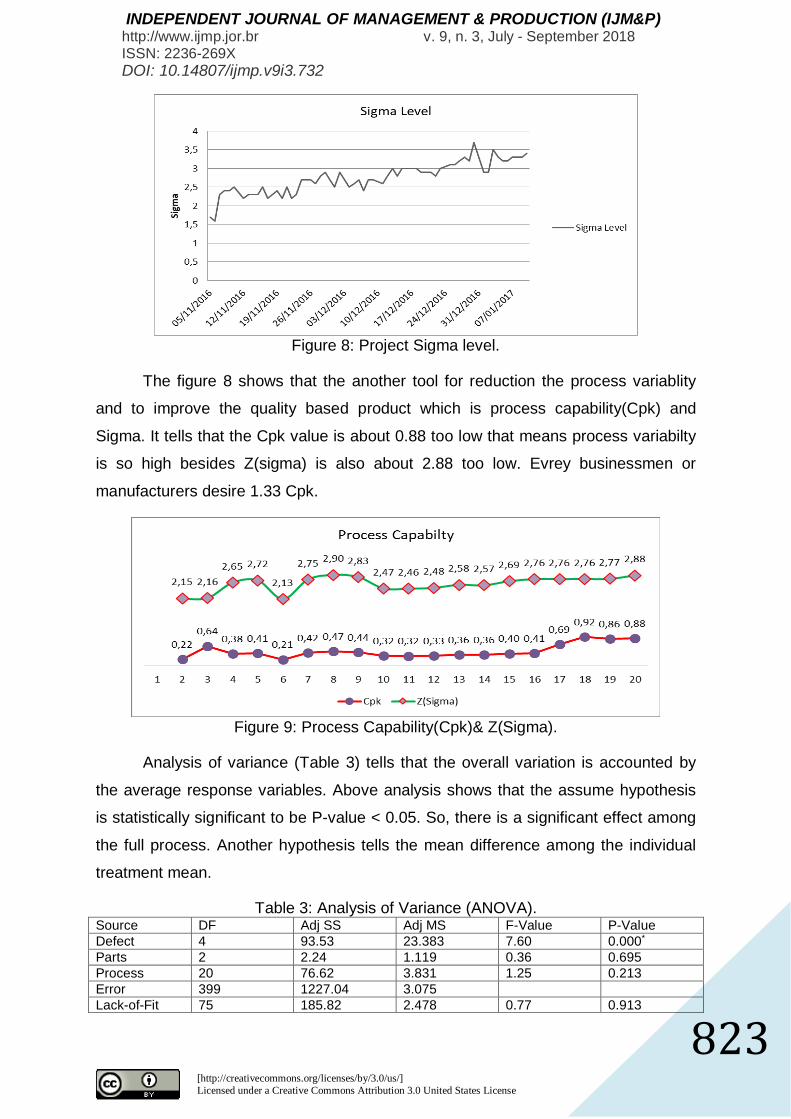
The figure 8 shows that the initial Sigma level of the project was defined 1.7
and also shows that it is increasing day bay day after implimenting necessary steps
for defect reduction project. At the end of the project is being seen that we have
achived the 3.4 Sigma which one is good but not best.
Figure 7: Project defect rate(DR) after impimentation DMAIC.
[http://creativecommons.org/licenses/by/3.0/us/] Licensed under a Creative Commons Attribution 3.0 United States License
823
INDEPENDENT JOURNAL OF MANAGEMENT & PRODUCTION (IJM&P) http://www.ijmp.jor.br v. 9, n. 3, July - September 2018 ISSN: 2236-269X DOI: 10.14807/ijmp.v9i3.732
Figure 8: Project Sigma level.
The figure 8 shows that the another tool for reduction the process variablity
and to improve the quality based product which is process capability(Cpk) and
Sigma. It tells that the Cpk value is about 0.88 too low that means process variabilty
is so high besides Z(sigma) is also about 2.88 too low. Evrey businessmen or
manufacturers desire 1.33 Cpk.
Figure 9: Process Capability(Cpk)& Z(Sigma).
Analysis of variance (Table 3) tells that the overall variation is accounted by
the average response variables. Above analysis shows that the assume hypothesis
is statistically significant to be P-value < 0.05. So, there is a significant effect among
the full process. Another hypothesis tells the mean difference among the individual
treatment mean.
Table 3: Analysis of Variance (ANOVA). Source DF Adj SS Adj MS F-Value P-Value Defect 4 93.53 23.383 7.60 0.000*
Parts 2 2.24 1.119 0.36 0.695 Process 20 76.62 3.831 1.25 0.213 Error 399 1227.04 3.075 Lack-of-Fit 75 185.82 2.478 0.77 0.913

[http://creativecommons.org/licenses/by/3.0/us/] Licensed under a Creative Commons Attribution 3.0 United States License
824
INDEPENDENT JOURNAL OF MANAGEMENT & PRODUCTION (IJM&P) http://www.ijmp.jor.br v. 9, n. 3, July - September 2018 ISSN: 2236-269X DOI: 10.14807/ijmp.v9i3.732
Pure Error 324 1041.21 3.214 Total 425 1489.03
*5% level of Significance
Some treatments have a statistically significant mean difference effect that
means they are highly correlated to occur defect. From the Table 4, they are Broken
stitch, Open seam, Arm hole and Side pocket. The fitted regression model is,
Response = 2.246-0.658*Broken Stitch-0.531*Open Seam+0.750*Arm
Hole+0.632*Side Pocket Table 4: Fitting the regression model.
Term Coefficient SE Coefficient T-Value P-Value VIF Constant 2.246 0.196 11.45 0.000** Defect
Broken Stitch -0.658 0.177 -3.71 0.000** 2.21 Open Seam -0.531 0.240 -2.21 0.027 2.89 Puckering 0.223 0.487 0.46 0.648 5.89 Skip Stitch -0.020 0.210 -0.09 0.926 2.65
Parts Inside -0.148 0.173 -0.85 0.394 2.48 Shell Part 0.091 0.177 0.52 0.607 3.26
Process
Arm Hole 0.750 0.277 2.71 0.007** 2.29 Back Side -2.32 1.69 -1.38 0.170 30.09 Collar -0.308 0.360 -0.85 0.393 2.66 Cuff 0.170 0.427 0.40 0.690 3.24 Eyelet/Button -0.071 0.992 -0.07 0.943 11.12 Front Side 1.68 1.20 1.39 0.164 15.81 Hem 0.188 0.467 0.40 0.688 3.50 Hood -0.035 0.340 -0.10 0.918 2.66 Label Main/Care -0.50 1.20 -0.42 0.675 15.78 Side pocket 0.632 0.362 1.75 0.041** 3.02
Loop 0.610 0.726 0.84 0.402 6.55 Neck JNT/TS -0.485 0.584 -0.83 0.407 4.61 Placket 0.407 0.314 1.30 0.196 2.70 Pocket -0.472 0.333 -1.42 0.157 2.74 Side Seam -0.291 0.533 -0.55 0.585 4.03
**5% level of Significance
5. CONCLUSION
The primary goal of this project is to identify action initiatives that make up the
help of conducting the project in the next step in order to reduce the defect rate at
2% which is the main objective of the project and to increase the productivity and
quality goods.
To that end, The Defect Reduction Project report shows that if it has been
taken proper steps, then many defects are reduced by only applying some scientific
method and also shows that process capability (Cpk) is an effective tool to reduce
the variability and to increase the productivity and ensure the more quality product.
[http://creativecommons.org/licenses/by/3.0/us/] Licensed under a Creative Commons Attribution 3.0 United States License
825
INDEPENDENT JOURNAL OF MANAGEMENT & PRODUCTION (IJM&P) http://www.ijmp.jor.br v. 9, n. 3, July - September 2018 ISSN: 2236-269X DOI: 10.14807/ijmp.v9i3.732
At the end, our project dead line we have been able to achieve the desired 2%
defect rate. Finally, we can say that all types off assignable causes are able to
control by reducing defect and continuous improvement process.
ACKNOWLEDGMENT:
We want to give thanks to the Managing Director of Snowtex Outerwear Ltd. S M
Khalid Hasan for giving the opportunity and inspiration to run the project.
Conflict of Interest: We declare that there is no conflict of interest.
REFERENCES
ADAMS, C. W.; GUPTA, P.; WILSON JR., C. E. (2003) Six Sigma deployment, Elsevier Science, Burlington USA. BANUELAS, R.; ANTONY, J.; BRACE, M. (2005) An application of Six Sigma to reduce waste, Quality and Reliability Engineering International, v. 21, n. 6, p. 553-570. BHOTE, K. R.; BHOTE, A. K. (1991) World-class quality: using design of experiments to make it happen, 2nd Edition, American Management Association, New York. BORROR, C. M. (2009) The certified quality engineer handbook, ASQ Quality Press, 2nd ed., p. 321–332. BREYFOGLE III, F. W.; CUPELLO, J. M.; MEADOWS, B. (2001) Managing Six Sigma, John Wiley & Sons Inc., New York. BRUE, G.; HOWES, R. (2005) Six Sigma: the MacGraw-Hill 36 hours’ course, MacGraw-Hill, New York. DALE, B. G.; WIELE, T.; IWAARDEN, J. (2007) Managing Quality, 5th Edition, Blackwell Publishing Ltd., Oxford. DEMING, W. E. (1993) The new economic for industry, government, education, MIT Center for Advanced Engineering Studies, Cambridge, MA. GARZA-REYES, J. A.; et al. (2010) An empirical application of Six Sigma and DMAIC methodology for business process improvement, Proceedings of the 20th International Conference on Flexible Automation and Intelligent Manufacturing (FAIM), July 12-14, California, US, 92-100. GIJO, E. V.; SCARIA, J.; ANTONY, J. (2011) Application of Six Sigma methodology to reduce defects of a grinding process, Quality and Reliability Engineering International, (Online), 3 May 2011. HAMMER, M.; GODING, J. (2001) Putting Six Sigma in perspective, Quality, v. 40, n. 10, p. 58-63. JURAN, J.; GODFREY, A. B. (1992) Quality Handbook, The McGraw-Hill Companies, Inc.
[http://creativecommons.org/licenses/by/3.0/us/] Licensed under a Creative Commons Attribution 3.0 United States License
826
INDEPENDENT JOURNAL OF MANAGEMENT & PRODUCTION (IJM&P) http://www.ijmp.jor.br v. 9, n. 3, July - September 2018 ISSN: 2236-269X DOI: 10.14807/ijmp.v9i3.732
KUMAR, U. D.; et al (2008) On the optimal selection of process alternatives in a Six Sigma implementation, International Journal of Production Economics, v. 111, n. 2, p. 456-467. MARKARIAN, J. (2004) Six Sigma: quality processing through statistical analysis, Plastics, Additives and Compounding, v. 9, n. 4, p. 28-31. OMACHONU, V. K.; ROSS, J. E. (2004) Principles of total quality, 3rd Edition, CRC Press LLC, Florida. PYZDEK, T. (2003) The Six Sigma handbook: a complete guide for green belts, black belts, and managers at all levels, McGraw-Hill Companies Inc., New York, NY. PYZDEK, T.; KELLER, P. A. (2010) The Six Sigma handbook: a complete guide for greenbelts, black belts, and managers at all levels, 3rd Edition, McGraw-Hill Companies Inc., New York. STAMATIS, D. H. (2004) Six Sigma fundamentals: a complete guide to the system, methods and tools, Productivity Press, New York.