Application of Seismic Sequence Stratigraphy to … of Seismic Sequence Stratigraphy to Exploitation...
10
Application of Seismic Sequence Stratigraphy to Exploitation of Oil and Gas in “X” Field of Niger Delta-Nigeria 1 InikoE. Bassey, 2 Dmitri G. Antoniadi, 3 Richard E. Antigha, 4 Nkpa M. Ogarekpe. 1and2 Institute of Oil, Gas and Energy, Kuban State Technological University, Ulitsa Starokubanskaya, Krasnodar, 350058, Russian Federation 3 and 4. Department of Civil Engineering, Cross River University of Technology, PMB 1123, Calabar-Nigeria 1. [email protected] 2. [email protected] 3. [email protected] 4. [email protected] ABSTRACT - This article is devoted to application of seismic sequence stratigraphic method to reveal the presence of oil and gas plays in the subsurface with the view of increasing field development and production in the «X» field. Two composite well logs have been interpreted to show these hydrocarbon reservoirs and their boundaries. The interpretation procedure involved identification of depositional sequences and fault structures, timing of horizons at selected shot points, time – depth conversion and contouring to produce isopach maps. These sequence boundaries and three associated sequences were interpreted within the 9000 feet (2,743.2m) depth of vertical section largely from seismic sections and with relevant inputs from well logs. The basis of the interpretation is aimed at finding new reserves, reducing the cost of field development and increasing production from existing field. Keywords: Stratigraphic traps, depositional sequence, topography, lithology, sequence boundary, reservoir I. Introduction Lithologic, Stratigraphic as well as the structural disposition of the subsurface rock units largely determines its potential for accumulation of hydrocarbon. Therefore its exploitation is predicated on the acquisition of reliable subsurface information obtained from well logs, seismic data as well as core samples. However, inaccurate location of wells due to poor understanding and inaccurate interpretation of the subsurface structural settings could result in huge economic loses during exploitation [9]. To avoid this, increasing reliable techniques are developed to give clearer definition of hydrocarbon bearing units and so offer more precise information about their locations and volume which were the major targets of early seismic interpretation. Emphasis is currently shifting to identification of lithographic and stratigraphic features as well as their characteristics. In line with these Edet (2000) observes that sequence stratigraphy has become an indispensable tool for hydrocarbon exploration. II. Stratigraphic Setting The study of the depositional environments and sedimentary facies of the delta has established a lithographic model that relates facies variations with a high energy, wave-dominated, and constructional, arcuate-lobate tropical delta. This is the basis for the palaeo-environmental, sedimentological and stratigraphic interpretations of the Cenozoic succession in the Niger Delta [11]. The Delta was built up with the formation of the Benue- Abakiliki trough in the early Cretaceous as a failed arm of the rift triple junction associated with the opening of the South Atlantic. [13] in defining and describing the Tertiary stratigraphy of the Niger Delta recognized three formations. In ascending order, these are the Akata, Agbada and Benin formations belonging to marine, transitional and continental environments respectively. These lithofaces are diachronous across the Niger Deltas and the stratigraphic succession is said to be an overall coarsening upward sequence of more than 12,000m thick.The Akata formation is generally an open marine and pro delta, dark grey shale with lenses of silt stones and sandstones. This unit is under- compacted in much of the Delta and has not been drilled except in the Delta margins. The parallic/transitional Agbada formation which overly Akata formation consist of cycle coarsening upward regressive sequence resulting from distributary’s migration and abandonment. It is composed of mostly shoreface and channel sands with minor shale in the upper part and an alternation of sands and shale in equal proportion in the lower part. The Benin formation is the uppermost unit in the Niger Delta, comprising of Eocene to Holocene massive, continental, poorly indurated sands and sandstones, shales, coals and gravels of continental to upper delta plain origin. This formation is about 2,000m thick in the central onshore part and thins out towards the ISSN (Print) : 2319-8613 ISSN (Online) : 0975-4024 InikoE. Bassey et al. / International Journal of Engineering and Technology (IJET) DOI: 10.21817/ijet/2017/v9i3/170903517 Vol 9 No 3 Jun-Jul 2017 1615
Transcript of Application of Seismic Sequence Stratigraphy to … of Seismic Sequence Stratigraphy to Exploitation...

Application of Seismic Sequence Stratigraphy to Exploitation of Oil and Gas
in “X” Field of Niger Delta-Nigeria 1InikoE. Bassey, 2Dmitri G. Antoniadi, 3Richard E. Antigha, 4Nkpa M. Ogarekpe.
1and2 Institute of Oil, Gas and Energy, Kuban State Technological University, Ulitsa Starokubanskaya, Krasnodar, 350058, Russian Federation
3 and 4. Department of Civil Engineering, Cross River University of Technology, PMB 1123, Calabar-Nigeria
1. [email protected] [email protected]
3. [email protected] [email protected]
ABSTRACT - This article is devoted to application of seismic sequence stratigraphic method to reveal the presence of oil and gas plays in the subsurface with the view of increasing field development and production in the «X» field. Two composite well logs have been interpreted to show these hydrocarbon reservoirs and their boundaries. The interpretation procedure involved identification of depositional sequences and fault structures, timing of horizons at selected shot points, time – depth conversion and contouring to produce isopach maps. These sequence boundaries and three associated sequences were interpreted within the 9000 feet (2,743.2m) depth of vertical section largely from seismic sections and with relevant inputs from well logs. The basis of the interpretation is aimed at finding new reserves, reducing the cost of field development and increasing production from existing field.
Keywords: Stratigraphic traps, depositional sequence, topography, lithology, sequence boundary, reservoir I. Introduction
Lithologic, Stratigraphic as well as the structural disposition of the subsurface rock units largely determines its potential for accumulation of hydrocarbon. Therefore its exploitation is predicated on the acquisition of reliable subsurface information obtained from well logs, seismic data as well as core samples. However, inaccurate location of wells due to poor understanding and inaccurate interpretation of the subsurface structural settings could result in huge economic loses during exploitation [9]. To avoid this, increasing reliable techniques are developed to give clearer definition of hydrocarbon bearing units and so offer more precise information about their locations and volume which were the major targets of early seismic interpretation. Emphasis is currently shifting to identification of lithographic and stratigraphic features as well as their characteristics. In line with these Edet (2000) observes that sequence stratigraphy has become an indispensable tool for hydrocarbon exploration.
II. Stratigraphic Setting The study of the depositional environments and sedimentary facies of the delta has established a lithographic model that relates facies variations with a high energy, wave-dominated, and constructional, arcuate-lobate tropical delta. This is the basis for the palaeo-environmental, sedimentological and stratigraphic interpretations of the Cenozoic succession in the Niger Delta [11]. The Delta was built up with the formation of the Benue- Abakiliki trough in the early Cretaceous as a failed arm of the rift triple junction associated with the opening of the South Atlantic. [13] in defining and describing the Tertiary stratigraphy of the Niger Delta recognized three formations. In ascending order, these are the Akata, Agbada and Benin formations belonging to marine, transitional and continental environments respectively. These lithofaces are diachronous across the Niger Deltas and the stratigraphic succession is said to be an overall coarsening upward sequence of more than 12,000m thick.The Akata formation is generally an open marine and pro delta, dark grey shale with lenses of silt stones and sandstones. This unit is under-compacted in much of the Delta and has not been drilled except in the Delta margins.
The parallic/transitional Agbada formation which overly Akata formation consist of cycle coarsening upward regressive sequence resulting from distributary’s migration and abandonment. It is composed of mostly shoreface and channel sands with minor shale in the upper part and an alternation of sands and shale in equal proportion in the lower part. The Benin formation is the uppermost unit in the Niger Delta, comprising of Eocene to Holocene massive, continental, poorly indurated sands and sandstones, shales, coals and gravels of continental to upper delta plain origin. This formation is about 2,000m thick in the central onshore part and thins out towards the
ISSN (Print) : 2319-8613 ISSN (Online) : 0975-4024 InikoE. Bassey et al. / International Journal of Engineering and Technology (IJET)
DOI: 10.21817/ijet/2017/v9i3/170903517 Vol 9 No 3 Jun-Jul 2017 1615

margins of the Delta. The Benin formation Miocene to Recent consists of predominantly massive, highly porous fresh bearing sandstones with local interbed of shale. This unit grades downward into and overly uncomformably the Agbada formation (figure 1).
Figure 1: Location map of the Niger Delta Basin
The Niger delta has suffered extensive deformation which results in the formation of stratigrahic traps, faults, anticlines and fractures. These features provide sufficient space for huge accumulation of hydrocarbons.
III. Materials and Methods
A. Materials obtained from Chevron Nigeria for this study included:
1. Seismic base map of the field area:
One copy of seismic situation map of “X” field was provided on a scale of 1:25000. Figure 2 is an excerpt
Figure 2: “X” Field of the Niger Delta showing interpreted seismic lines and oil well positions
of the seismic base map showing ten seismic lines, seven diplines labeled L-32, L- 31, L- 43, L-44, L -45, L-47, L-48 and three strikes lines consisting of L-07, L-13 and L-14 and wells labeled M-69, M-70 (BH), M-73(BA).
2. Seismic data:
High resolution true amplitude seismic sections for closely spaced dip and strike lines tied to well locations.
1 450 ‘
2 550 ‘
250
100
200
150
600
620
700
250650
200
150
200
250
150
200
250
150
200
250
300
250
200
150
L-43
L-48
L-47
L-44
L-32
L-45
L-31
L-14
L-07
L-13
LEGENDSeismic LinesWell LocationsShot Points 200, 150, etc
Scale: 1:50,000
N
CROSS LINES
IN - LINES
M-69 (BH)
M-74 (BH)
ISSN (Print) : 2319-8613 ISSN (Online) : 0975-4024 InikoE. Bassey et al. / International Journal of Engineering and Technology (IJET)
DOI: 10.21817/ijet/2017/v9i3/170903517 Vol 9 No 3 Jun-Jul 2017 1616

Ten seismic sections for lines 07, 13, 14, 31, 32, 43, 44, 45, 47, and 48 were also provided. Each of the sections cover more than 5km spread with all the sections processed and migrated.
3. Well logs:
Suites of resistivity logs for all the wells and composite logs, with lithologic description borehole compensated sonic log, gamma ray, and caliper log for wells M-69, M-70, and M-74. Composite logs were provided for this study for well 73 only. B. Methods of Interpretation
The approached modified after [8] was applied for the interpretation. 1. Seismic Data Analysis:
- Three significant horizons were selected for interpretation based on their: lateral continuity, good, strong reflections and thickness. (figure 3) Attempt was then made to tie the seismic sections to the geology of the Niger Delta area surface geology. - The horizons were traced one after the other with green ink from one line onto the other by tying loops. For each of the three significant horizons selected, horizon time picks were transferred to base map and time maps were contoured. - Velocity information for well 69 was evaluated and depth – converted. A plot of two-way-time versus depth was derived from the depth-converted values. The curve of that plot was then used to obtain equivalent depths for other seismic lines and three depth maps were produced for each of the three horizons. - Interval isopach maps were also plotted between the green, yellow and red horizons.These isopach and time maps are reliable guides to useful and reasonable deductions about sedimentation thickness and depositional environment of the subsurface layers under study. 2. - Sequence boundaries:
These were delineated where significant reflector terminations were interpreted; - sequence boundaries were delineated in green, yellow and red colours, -these sequence boundaries were correlated with well data. 3. Seismic Sequence Analysis:
The sequence boundaries were first interpreted by picking out the angular unconformities and tracing laterally into areas where they are conformable. This exercise was to allow the mapping of their outlines and thickness as well as the relevant reflection terminations [3]. This is seismic sequence analysis. The next step is the seismic faces analysis, which involves the examination of the nature and orientation of the reflection with each sequence - the interval stratal patterns. Here, the seismic facies are plotted with symbols on the sequence map. Armed with this information, useful and reasonable deductions were made about the rock types present. A chronostratigraphic chart to show the distribution of the seismic sequences in time and distance was then constructed as further step in the interpretation procedure. This chart shows the advance and retreat of sedimentation towards the edge of the basin. 4. Well Log Analysis
The wire line logs were subjected to the following analysis: Identification of lilthologic bodies (sand and shale) based on the relative abundance of shale and sand within the Formation. Well log patterns of sedimentary facies were interpreted and the positions of condensed sections, candidate Maximum Flooding Surfaces (MFS’s) and Sequence Boundaries (SB’s) were located and marked on the logs. Depositional sequences as well as systems tract were interpreted, and also the seismic and well data of well M-74 were matched and integrated. 5. Lithostratigraphic Correlation: This was done to identify and interpret structural and sedimentological features for the purpose of mapping the reservoir units. In this study, the GR log was used for the lithostratigraphic correlation with the resistivity information as a check. This is because of consistency of the GR in representing sand shale beds through the entire well depth (except for radioactive sands). [7] and [8] have used the GR log for chronostratigraphic correlation exercises in a number of studies in the Niger Delta and have come out with reliable results.
The approach adopted for this study was to align the logs using correlatable marker horizons identified in each well which are presumed to have been deposited as horizontal layers. This enables various facies distribution to be identified and the lateral continuity of reservoir units to be seen.The correlation followed the
ISSN (Print) : 2319-8613 ISSN (Online) : 0975-4024 InikoE. Bassey et al. / International Journal of Engineering and Technology (IJET)
DOI: 10.21817/ijet/2017/v9i3/170903517 Vol 9 No 3 Jun-Jul 2017 1617

selection of shale portions with distinctive log character and correlating them. Other shale units were also correlated and thereafter, the sand units and other deposits were successively correlated. [10] has posited that the most evident form of log correlation is by using log makers. This may be a distinctive peak, a distinctive shape or distinctive lithology. And correlating this log shapes gives a reliable chronostratigraphy [2]. So, log correlation and seismic mapping were undertaken together in an iterative approach. 5. Log Sequential Analysis
Major stratigraphic breaks are usually easily recognized on logs. This may appear as dip changes, distinct faunal gap, a change of compaction and/or anomalous log peaks. This sort of breaks corresponds to an angular unconformity. It has been made clear that eustatic sea level changes directly dictate the depositional cycles. These cycles are often directly marked on the well log and their limits become clear following sequential analysis. The correlation of sequentially analysed well .logs, both within and between basins demonstrate the continuity and importance of the log-defined limits.
IV. Results and Interpretation.
“X” field seismic stratigraphic patterns: The stratigraphic patterns of “X” field deduced here were evolved from the analysis and interpretation of depositional sequence to identify faults, truncation unconformities as well as obvious seismic termination patterns – onlaps, downlaps, toplaps etc. A. Identification of Sequence Boundaries. The three significant and recognizable horizons interpreted, correspond to sequence boundaries (SB’s) shown in figure 3.The sequence boundary of the green horizon was picked within the limit of seismic resolution at a TWT ranging from 0.60 and 0.72ms; (that is, between the depths of about 2150 to 2240 feet (based on the readings from the time depth conversion plot of figure 4). This is an unconformity surface which reveals a significant reflection and defined two genetically related reflections above and below it. This horizon conforms to the sequence boundary located on the well data of well M- 74 at the depth of 150 feet.
Figure 3: Interpreted section showing recognizable 3 layer sequence
The second sequence boundary SB 2 (yellow horizon) shown on figure 3 was interpreted and delineated at a TWT of between 1.6 and 1.8ms (between the depths of 5800 and 6560 feet). This boundary surface is defined at the unconformity surface based on the fact there are concordant relationships noticed within the packages at the upper and lower units of this surface.Another sequence boundary (red) was interpreted at an estimated TWT of between 1.9 – 2.2ms. The corresponding depths were estimated from the TWT/depth curve of figure 4 and shown on the well log data of appendix D. B. Mapping. Given the Time/Depth chart (Table 1) a plot of TWT versus Depth was produced as in figure 4 to show the relationship between depth and time. These values were obtained from well M- 69 which is considered to adequately represent the average time velocities of the other wells in the field.
0 . 0
0 . 1
0 . 2
0 . 3
0 . 4
0 . 6
0 . 5
0 . 7
0 . 8
0 . 9
1 . 0
1 . 1
1 . 2
1 . 3
1 . 4
1 . 5
1 . 6
1 . 7
1 5 01 0 05 0
LAYER 1
HORIZON 1
LAYER 2
HORIZON 2
HORIZON 3
LAYER 3
ISSN (Print) : 2319-8613 ISSN (Online) : 0975-4024 InikoE. Bassey et al. / International Journal of Engineering and Technology (IJET)
DOI: 10.21817/ijet/2017/v9i3/170903517 Vol 9 No 3 Jun-Jul 2017 1618
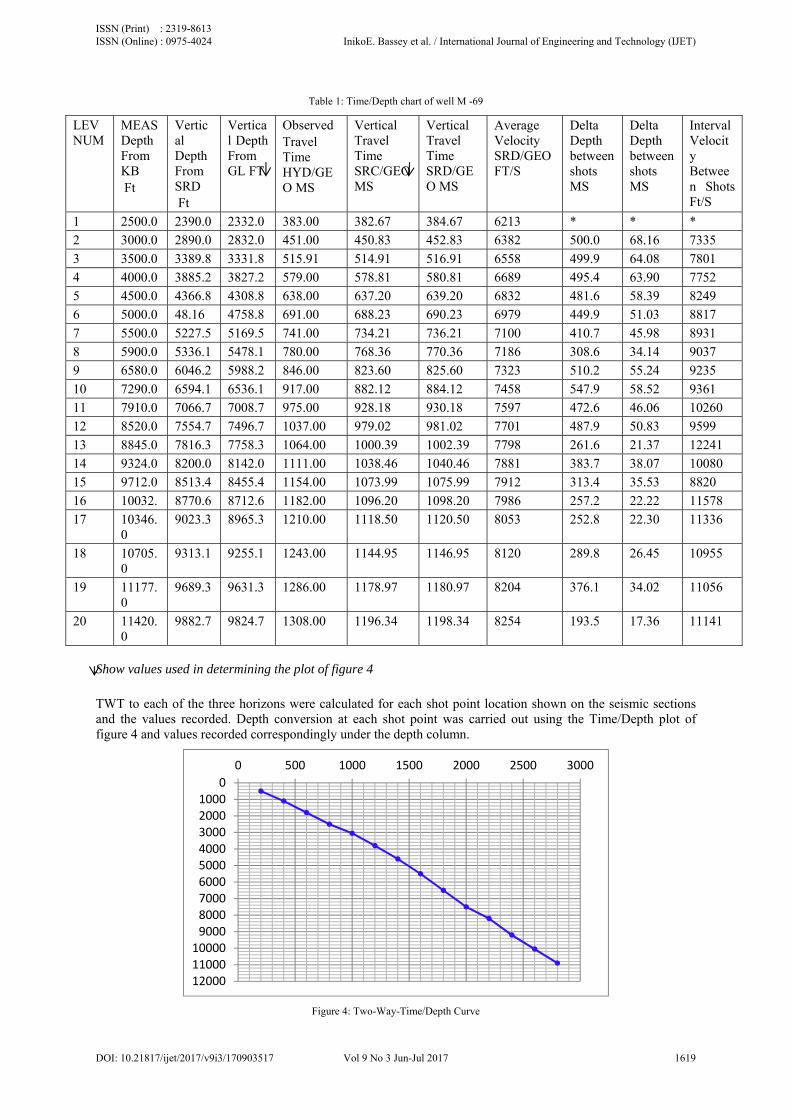
Table 1: Time/Depth chart of well M -69
LEV NUM
MEAS Depth From KB Ft
Vertical Depth From SRD Ft
Vertical Depth From GL FT
Observed Travel Time HYD/GEO MS
Vertical Travel Time SRC/GEO MS
Vertical Travel Time SRD/GEO MS
Average Velocity SRD/GEO FT/S
Delta Depth between shots MS
Delta Depth between shots MS
Interval Velocity Between Shots Ft/S
1 2500.0 2390.0 2332.0 383.00 382.67 384.67 6213 * * * 2 3000.0 2890.0 2832.0 451.00 450.83 452.83 6382 500.0 68.16 7335 3 3500.0 3389.8 3331.8 515.91 514.91 516.91 6558 499.9 64.08 7801 4 4000.0 3885.2 3827.2 579.00 578.81 580.81 6689 495.4 63.90 7752 5 4500.0 4366.8 4308.8 638.00 637.20 639.20 6832 481.6 58.39 8249 6 5000.0 48.16 4758.8 691.00 688.23 690.23 6979 449.9 51.03 8817 7 5500.0 5227.5 5169.5 741.00 734.21 736.21 7100 410.7 45.98 8931 8 5900.0 5336.1 5478.1 780.00 768.36 770.36 7186 308.6 34.14 9037 9 6580.0 6046.2 5988.2 846.00 823.60 825.60 7323 510.2 55.24 9235 10 7290.0 6594.1 6536.1 917.00 882.12 884.12 7458 547.9 58.52 9361 11 7910.0 7066.7 7008.7 975.00 928.18 930.18 7597 472.6 46.06 10260 12 8520.0 7554.7 7496.7 1037.00 979.02 981.02 7701 487.9 50.83 9599 13 8845.0 7816.3 7758.3 1064.00 1000.39 1002.39 7798 261.6 21.37 12241 14 9324.0 8200.0 8142.0 1111.00 1038.46 1040.46 7881 383.7 38.07 10080 15 9712.0 8513.4 8455.4 1154.00 1073.99 1075.99 7912 313.4 35.53 8820 16 10032. 8770.6 8712.6 1182.00 1096.20 1098.20 7986 257.2 22.22 11578 17 10346.
0 9023.3 8965.3 1210.00 1118.50 1120.50 8053 252.8 22.30 11336
18 10705.0
9313.1 9255.1 1243.00 1144.95 1146.95 8120 289.8 26.45 10955
19 11177.0
9689.3 9631.3 1286.00 1178.97 1180.97 8204 376.1 34.02 11056
20 11420.0
9882.7 9824.7 1308.00 1196.34 1198.34 8254 193.5 17.36 11141
Show values used in determining the plot of figure 4 TWT to each of the three horizons were calculated for each shot point location shown on the seismic sections and the values recorded. Depth conversion at each shot point was carried out using the Time/Depth plot of figure 4 and values recorded correspondingly under the depth column.
Figure 4: Two-Way-Time/Depth Curve
0100020003000400050006000700080009000
100001100012000
0 500 1000 1500 2000 2500 3000
ISSN (Print) : 2319-8613 ISSN (Online) : 0975-4024 InikoE. Bassey et al. / International Journal of Engineering and Technology (IJET)
DOI: 10.21817/ijet/2017/v9i3/170903517 Vol 9 No 3 Jun-Jul 2017 1619

The time values were then posted on to the base map. Minor fault gaps were identified on the north eastern and eastern portions of the contoured maps of layers 2 and 3 respectively. The resulting time and depth values are plotted as maps of figures 6a and b.Depth values to the first horizon were subtracted from those of the second horizon to derive depth values of the interval between horizons 1 and 2.
Figure 5: Isopach maps: a) Isopach map of layer 2 b) Time map of horizon 3
The depth values of the second horizon were similarly subtracted from those of the third horizon to
derive the depth interval 3. These values are then contoured to produce the isopach maps which reveal the true stratigraphic thickness of each layer as delineated. (see figures 5a and b.)
The general visual interpretation of the three isopach maps of figures 5a and b show that sedimentation is towards the south and the western portion of the map and sediment source is from the east. Depth values are increasing towards the upper left section indicating the direction of sediment thickening.
Fault traces extend from the east to the central portion of the isopach maps, particularly pronounced on maps of layers 2 and 3 between the two highs. This also suggests that any possible structural trap should be expected in that direction while stratigraphic traps and reservoir units are likely to be present in the lows.
C. Sequence Interpretation.
The three major sequence boundaries sectioned the entire sedimentary packages into three. The sequence boundaries through these sedimentary packages were difficult to locate and map because of the presence of antithetic growth faults within the formation. However, the approach explained by [14] was adopted by folding together parts of a section from opposite sides of each fault and ascertaining the time shiftwhich gives the best apparent match between reflection surfaces at points sufficiently far from the fault to avoid the distortion produced by such fault. The packages of reflection on each side of the gap were considered which revealed more identifiable character on the two sides of the fault. D. Well Log Stratigraphic Pattern:
1.Identification of Lithologic Bodies
The sand/sandstone units within the logged interval of wells M-69, M-70 and M-74 were identified and picked using gamma ray responses. This followed the approach used by [11]who used the gamma ray log to identify sand units in an offshore field of the Niger Delta. Sand and shale base lines were determined and significant sand and shale units were picked and marked on the log. With this combination, bed boundaries were properly defined and sand thickness determined. Individual sand beds vary in thickness 30 feet in well M- 70 and 400 feet in well M- 69 and are separated from each other by correlatable shale intervals.Their gross and net sand thickness and net-to-gross ratios were also computed.
2. Interpretation of Well log Patterns of Sedimentary Facies: In well M- 69 the gamma ray log shows a transition from distributary channel to shore face/ tidal flat deposits. The intervals are marked by tidal channels, incised valley fill sands, and barrier bar deposits, (figure 6).
ISSN (Print) : 2319-8613 ISSN (Online) : 0975-4024 InikoE. Bassey et al. / International Journal of Engineering and Technology (IJET)
DOI: 10.21817/ijet/2017/v9i3/170903517 Vol 9 No 3 Jun-Jul 2017 1620

3. Location of Candidate MFS and Sequence Boundaries These are important surfaces on the cycles of sedimentation which locate boundaries of system tract. Maximum flooding surfaces are identified on logs at points of combination of lowest resistivity and highest gamma values. Here is found most clay rich shale and faunal abundance peak (figure 6).
Sequence boundaries are located most commonly between the highstand and the lowstand systems tract. These boundaries are typically characterized by lowstand erosion and, incised valleys on shelf, canyon cuts and slumps scars on upper slope.
4. Interpretation of Sequences and System Tract on Well Logs: Three system tracts were recognized and marked on the well logs to study the sediment fill of the basin in terms of sea level changes. These system tracts connote the cyclic nature of stratigraphic successions and have chrono or time stratigraphic implication. -Transgressive System Tract (TST) is bounded at the top by maximum flooding surfaces, which are periods of peak transgressions.
9600
Figure 6: Interpreted log pattern associated with “X” field sequences and Systems Tract of Well M-74 (8670-9600ft depth interval)
It exhibits a general fining and thinning upward sequence with beach and shore face sands near base and neritic shale’s near top.
-Highstand System Tract (HST): It is bounded below by the downlap surface and above by the next sequence boundary and shows an overall coarsening and shallowing upward sand, interbedded with silt. (Figure 4).
- Lowstand System Tract (LST)located on the log are three main facies types- the slope fan, basin floor fan and prograding complex. The LST is bounded below by a sequence boundary and above by a trangressive surface. As evident on the log responses of figure 4, this system tract show generally coarsening up, prograding sands near top and blocky incised valley fills in some places. Figure 7a is a seismic section (line 14, between shot points 750 and 800 and TWT of 1.3 – 1.58ms) which shows an incised valley fill (IVF), a facies of the lowstand system tract as that illustratedin figure 7b.
The slope fan facies exhibit overall rounded shape of spiky sand packages. Within the LST intervals, there are series of thin units with blocky sand at base and each unit fines upward, exhibiting the “Christmas tree” pattern. The sand units are separated by thin fining upward.
E. Integration of Seismic sections and Well Logs:
In this study, we used seismic and well log data iteratively for stratigraphic interpretation. Log correlation and seismic mapping according to [10] should go together. The three sequence boundaries identified on seismic section 14 are consistent with those identified on well M-74 at the shot point number 40.
9600 8670
ISSN (Print) : 2319-8613 ISSN (Online) : 0975-4024 InikoE. Bassey et al. / International Journal of Engineering and Technology (IJET)
DOI: 10.21817/ijet/2017/v9i3/170903517 Vol 9 No 3 Jun-Jul 2017 1621

Figure 7a: Seismic section L-14 interpreted incised valley fill
Figure 7b: Schematic illustration of incised valley fill
The depositional sequences defined on the gamma ray log responses of well M-74 are correlated to the seismic stratigraphic sequences of section 14. This well is directly on seismic line 14 (figure 8). The estimated TWT to the green horizon is 0.63ms, 1.6ms to the yellow horizon and 1.98 to the red horizons. Converting these time values to depth on the time/depth plot (figure 5) interprets that SB 1 is at 1960 feet, SB 2 at 5880 ft. and SB 3 at 7700 ft. (below MSL) respectively.
The system tract at the log depth of about 7520ft. is interpreted to be a transgressive system tract with fining and thinning upward sequence with beach and shore face sands near the base. Depositional sequences defined on a depth-scale gamma log and wascorrelatedto seismic stratigraphic sequences. The pronounced progradational log expressions of well M-74 corresponds to the progradations on the seismic section L-14
This depth is consistent with a TWT of about 2.02 and 2.04ms which show very thin reflection. It clearly marks internal retrogradational geometries and is overlain by a maximum flooding surface recognized by the downlap of overlying clinoform[5]. This is an attempt at detailed integration of the depositional environments on seismic section L-14 and well M-74.
F. Lithostratigraphic Correlation:
Result of the lithostraphic correlation using MSL and correlatable marker horizon as in [14] is shown in figure 8. The gamma ray values for wells M-74 and M-69 are correlated from the depth of 4, 100 ft. below MSL to the depth of 9500ft below MSL. From the depth of 6170 ft below MSL, the GR values of well M-70 were matched and correlated with the former (wells M-69 and M-74).
ISSN (Print) : 2319-8613 ISSN (Online) : 0975-4024 InikoE. Bassey et al. / International Journal of Engineering and Technology (IJET)
DOI: 10.21817/ijet/2017/v9i3/170903517 Vol 9 No 3 Jun-Jul 2017 1622

Figure 8: Integrated correlation map of seismic section L-14 logs of well M-74
V. CONCLUSION
Sequence stratigraphic interpretation is becoming increasing useful in basin analysis and exploration of the sub surface for hydrocarbon. It has provided a chronostratigraphic framework for analysis and correlation of sediment fill of ‘X’ field in the offshore Niger Delta in terms of sea level changes and sediment supply. In this study, stratigraphic interpretation of the ‘X’ field offshore Niger Delta has been carried out. Three significant sand recognizable horizons were delineated and amended to correspond to sequence boundaries. These sequence boundaries (SB) were laterally traced through the seismic sections until they were linked up with where they started. This way the successions were demarcated into three major seismic sequences. Isopach maps of the seismic sequences have been produced in the study area. From the analysis of the seismic sections a flat spot was interpreted on L- 31 and the typifying fault pattern was identified. On L- 14 an incised valley fill and system tracts were identified. From the wire line log analysis, depositional sequences and system tract of well M-74 between the depths interval of 8670 and 9600 feet were shown. These have revealed - possible new reserve on L-14 - allow effective targeting of well placement - increased production from these field due to interpretation of new reserves. - reduced risk and cost by identification of barriers and pathways of fluid movement through the reservoirs.
ACKNOWLEDGMENTS The work presented here is based on the principal authors’ master’s degree study (2000–2002) at the University of Calabar -Nigeria. The Directorate of Petroleum Resources and Chevron Nigeria Ltd are gratefully acknowledged for the release of the data set used in this study
REFERENCES [1] Amogu, D. K., Filbrandt, J. I. Ladipo, K. O. and Anowai, C., 2011, Seismic interpretation, structural analysis and fractal study of the
Greater UghelliDepobelt, Niger Delta Basin, Nigeria: The Leading Edge 30, 640-648 [2] Bustin, R. M., 1988, Sedimentology and characteristics of dispersed organic matter in Tertiary Niger delta: Origin of source rocks in a
deltaic environment: AAPG Bulletin, v. 72, p. 277-298. [3] Doust, H. and Omatsola, E. 1990. “Niger Delta”. In: Divergent /Passive Margins. Edwards, J.D. and Santogrossi, P. (eds). Am. Assoc.
of Petrol. Geol. Memoir. Tulsa, OK. 48: 210-238. [4] Ejeh, O.I. 2010. Sedimentary Fill Modeling: Relationships to Sequence Stratigraphy and its implications for Hydrocarbon Exploration
in the Niger Delta, Nigeria. Pacific Journal of Science and Technology.
Well - 74
Major progradations on seismic section
ISSN (Print) : 2319-8613 ISSN (Online) : 0975-4024 InikoE. Bassey et al. / International Journal of Engineering and Technology (IJET)
DOI: 10.21817/ijet/2017/v9i3/170903517 Vol 9 No 3 Jun-Jul 2017 1623

[5] Evamy, B.D., Haremboure, J., Kamerling, P., Knaap, W A., Molloy, F.A., and Rowland, P.H. 1978. “Hydrocarbon Habitat of Tertiary Niger Delta”.Am. Assoc. Petrol. Geol. Bull. 62(1):1-39.
[6] Mitchum, R.M. Jr. and Van Wagoner, J.C. 1991. “High Frequency Sequences and their Stacking Patterns: Sequence Stratigraphic Evidence of High Frequency Eustatic Cycles”.Sedimentary Geology. 70:135-144.
[7] Ozumba, M.B., D.A. Omene, and C. Otoghile. 2005. “The Opuam Channel Area 3D Prospecitivity Review, Impact of High Resolution Sequence Stratigraphy”.NAPE Bulletin. 19(1): 1-11.
[8] Posamentier, H.W. and P.A. George 1994. “SiliciclasticSequenc Stratigraphy: Concepts and Application”. AAPG Short Course.10, 89p.
[9] Wagoner, J.C. (eds). Special Publication, Society of Economic Paleontologists and Mineralogists. 42:125-154. [10] Rider, W.H. 1986. The Geological Interpretation of Well Logs. Blackie and Sons, Ltd.. Glasgow, UK. 175. [11] Reijers, T.J.A., S.W. Petters, and C.S. Nwajide. 1997. “The Niger Delta Basin”. In: African Basins. Sedimentary Basins of the World. [12] Selly, R.C. (ed.). Elsivier Science: Amsterdam, The Netherlands. 3:151-172. [13] Short, K.C. and Stauble, A.J. 1967. “Outline Geology of the Niger Delta”.Am. Assoc. of Petrol. Geol. Bull. 51(5):761-779. [14] Vail, P.R. and Wornardt, W.W. 1990. “Well Log Seismic Sequence Stratigraphy: An Integrated Tool for the 90’s.Gulf Coast Section”.
Society of Economic Paleontologists and Mineralogists Foundation, 11th Annual Research Conference Programme and Extended Abstracts.379-388.
ISSN (Print) : 2319-8613 ISSN (Online) : 0975-4024 InikoE. Bassey et al. / International Journal of Engineering and Technology (IJET)
DOI: 10.21817/ijet/2017/v9i3/170903517 Vol 9 No 3 Jun-Jul 2017 1624