APPLICATION OF POLY-HARMONIC SIGNALS TO EDDY-CURRENT …
16
Metrol. Meas. Syst., Vol. 25 (2018) No. 2, pp. 387–402. METROLOGY AND MEASUREMENT SYSTEMS Index 330930, ISSN 0860-8229 www.metrology.pg.gda.pl APPLICATION OF POLY-HARMONIC SIGNALS TO EDDY-CURRENT METAL DETECTORS AND TO ADVANCED CLASSIFICATION OF METALS Jakub Svatoš, Tomáš Pospíšil, Josef Vedral Czech Technical University in Prague, Department of Measurement, Prague 6, Technická 2, 16627, Czech Republic ( [email protected], + 420 224 352 201, [email protected], [email protected]) Abstract A limited ability to discriminate between different materials is the fundamental problem with all conven- tional eddy-current-based metal detectors. This paper presents the use, evaluation and classification of non- traditional excitation signals for eddy-current metal detectors to improve their detection and discrimination ability. The presented multi-frequency excitation signals are as follows: a step sweep sine wave, a linear frequency sweep and sin(x)/x signals. All signals are evaluated in the frequency domain. Amplitude and phase spectra and polar graphs of the detector output signal are used for classification and discrimination of the tested objects. Four different classifiers are presented. The classification results obtained with the use of poly-harmonic signals are compared with those obtained with a classical single-tone method. Multi- frequency signals provide more detailed information, due to the response function – the frequency charac- teristic of a detected object, than standard single-tone methods. Based on the measurements and analysis, a metal object can be better distinguished than when using a single-tone method. Keywords: eddy current, metal detector, poly-harmonic signal, signal processing, classification. c ⃝ 2018 Polish Academy of Sciences. All rights reserved 1. Introduction The metal detection together with distinguishing different metals is the essential part of many branches – security, industry, ecology, archaeology or humanitarian demining [1]. Metal detec- tors are used in airports or important buildings as walk-through metal detectors to improve secu- rity. They are widely used in pharmacy, food and chemical industries or by the military for a land clearance from anti-tank or antipersonnel mines [2]. Amateur treasure hunters or archaeologists use detectors to detect ancient artefacts and old coins [3]. Last but not least, metal detectors are used for humanitarian demining [4, 5], where a handheld metal detector plays the key role during demining of Explosive Remnants of Wars (ERW). There are many methods of metal detection [6], but the electromagnetic detectors (Eddy- current-based metal detectors) are still the most commonly used types of metal detectors, al- though they have their weaknesses. Such detectors poorly recognize or discriminate different materials or objects [7]. These detectors, used nowadays, usually work with a single-tone signal detecting the changes of phase and amplitude of a measured signal (Very Low Frequencies detec- tors) or monitoring the time delay of a measured pulse (Pulse Induction detectors) to estimate the Article history: received on Dec. 21, 2017; accepted on Mar. 10, 2018; available online on Jun. 30, 2018, DOI: 10.24425/119564.
Transcript of APPLICATION OF POLY-HARMONIC SIGNALS TO EDDY-CURRENT …

Metrol. Meas. Syst., Vol. 25 (2018) No. 2, pp. 387–402.
METROLOGY AND MEASUREMENT SYSTEMS
Index 330930, ISSN 0860-8229www.metrology.pg.gda.pl
APPLICATION OF POLY-HARMONIC SIGNALS TO EDDY-CURRENT METALDETECTORS AND TO ADVANCED CLASSIFICATION OF METALS
Jakub Svatoš, Tomáš Pospíšil, Josef Vedral
Czech Technical University in Prague, Department of Measurement, Prague 6, Technická 2, 16627, Czech Republic( [email protected], +420 224 352 201, [email protected], [email protected])
AbstractA limited ability to discriminate between different materials is the fundamental problem with all conven-tional eddy-current-based metal detectors. This paper presents the use, evaluation and classification of non-traditional excitation signals for eddy-current metal detectors to improve their detection and discriminationability. The presented multi-frequency excitation signals are as follows: a step sweep sine wave, a linearfrequency sweep and sin(x)/x signals. All signals are evaluated in the frequency domain. Amplitude andphase spectra and polar graphs of the detector output signal are used for classification and discriminationof the tested objects. Four different classifiers are presented. The classification results obtained with theuse of poly-harmonic signals are compared with those obtained with a classical single-tone method. Multi-frequency signals provide more detailed information, due to the response function – the frequency charac-teristic of a detected object, than standard single-tone methods. Based on the measurements and analysis, ametal object can be better distinguished than when using a single-tone method.Keywords: eddy current, metal detector, poly-harmonic signal, signal processing, classification.
c⃝ 2018 Polish Academy of Sciences. All rights reserved
1. Introduction
The metal detection together with distinguishing different metals is the essential part of manybranches – security, industry, ecology, archaeology or humanitarian demining [1]. Metal detec-tors are used in airports or important buildings as walk-through metal detectors to improve secu-rity. They are widely used in pharmacy, food and chemical industries or by the military for a landclearance from anti-tank or antipersonnel mines [2]. Amateur treasure hunters or archaeologistsuse detectors to detect ancient artefacts and old coins [3]. Last but not least, metal detectors areused for humanitarian demining [4, 5], where a handheld metal detector plays the key role duringdemining of Explosive Remnants of Wars (ERW).
There are many methods of metal detection [6], but the electromagnetic detectors (Eddy-current-based metal detectors) are still the most commonly used types of metal detectors, al-though they have their weaknesses. Such detectors poorly recognize or discriminate differentmaterials or objects [7]. These detectors, used nowadays, usually work with a single-tone signaldetecting the changes of phase and amplitude of a measured signal (Very Low Frequencies detec-tors) or monitoring the time delay of a measured pulse (Pulse Induction detectors) to estimate the
Article history: received on Dec. 21, 2017; accepted on Mar. 10, 2018; available online on Jun. 30, 2018, DOI: 10.24425/119564.

J. Svatoš, T. Pospíšil, J. Vedral: APPLICATION OF POLY-HARMONIC SIGNALS TO EDDY-CURRENT METAL . . .
presence of a metal object with different conductivity or permeability. It leads to a limited dis-crimination ability, because some types of metals or objects have similar responses. For example,if a detector operator looks for a specific material (e.g. gold), the response can be mistaken for amaterial that has a similar response (e.g. tinfoil) [8]. The operating frequency of a detector is avery important parameter. The frequency influences the depth of penetration of the eddy current,as well as resolution and sensitivity. Low-frequency magnetic fields penetrating deeper into theground are less affected by magnetic or mineralized soils and the skin effect is reduced. On theother hand, high frequencies offer better resolution and sensitivity. Thus, the detector discrimi-nation and detection qualities strongly depend on the frequency of an excitation signal. It enablesto explore poly-harmonic signals and their processing and classification, to detect and to betteridentify an object, unlike conventional single-tone methods [9].
There are several papers presenting analyses and use of multi-frequency signals for eddy-current metal sensors. These eddy-current sensors are usually used for non-destructive testing ormetal separation. The majority of papers deal with the change of the sensor coil impedance [10,11] or use the magnetic induction spectroscopy [12].
Applying multi-harmonic or poly-harmonic signals and their processing offers an improve-ment to the determination ability of eddy-current metal detectors. Due to multiple frequencies ofexcitation signals, the response – frequency characteristic of a detected material is acquired ina wide band. In this frequency characteristic, multiple phases and amplitudes carry informationabout the detected object, and more detailed information about the object than that obtained witha standard single-tone method. The spectrum of the poly-harmonic signal is suitable for furtherspectral analysis of the response function (for more details of the response function see [9, 13])of the detected object. The response function can be used for discrimination of the object and itsclassification into a selected class.
The paper presents three non-conventional poly-harmonic excitation signals, their process-ing, evaluation and classification. These signals are as follows: step sweep sinusoidal, linearfrequency sweep sinusoidal and sinc signals. The emphasis is put primarily on the sinc signal.Support Vector Machine classifier (SVC) together with Naive Bayes (naivebc), k-Nearest Neigh-bours (KNN) and Linear Nearest Mean Classifier (NMC) are used for classifying. This papercontinues the previous experiments published in [9, 14] and [15], presents new approaches to themeasured signal processing and is supplemented with new results. A possible classification ofobjects into classes is also presented.
2. Methods
Three different excitation poly-harmonic signals: a step sweep sine-wave signal, a linearfrequency sweep signal and a sine cardinal (sinc) signal, were evaluated. The experimental mea-surements were performed in the frequency domain. All the presented experimental data weremeasured with a search head of a Schiebel ATMID metal detector [16, 17]. The detector uses adouble D configuration of the searching head with a diameter of 260 mm. The numbers of turnsof transmitting (Tx) and receiving (Rx) coils were 17 and approx. 190, respectively. The electricalequivalent circuit of the coil is shown in Fig. 1.
R1 is a resistance (ohms) and L1 is an inductance of Tx coil, R2 is a resistance, L2 is aninductance of Rx coil, and L1−2 corresponds to the mutual inductance between coils. The T–shape configuration of inductances in Fig. 1 corresponds to a transformer with inductances L1of the primary and L2 of secondary windings and the mutual inductance L1−2 between bothwindings. The measured parameter values for an operating frequency of 8.17 kHz are listed in
388

Metrol. Meas. Syst.,Vol. 25 (2018), No. 2, pp. 387–402.
Fig. 1. A diagram of the equivalent circuitof ATMID coil.
Table 1. These parameter values correspond to the parameter values given by the manufacturer[17]. The resonant frequency of the transmitting coil is approx. 90 kHz, whereas of the receivingcoil – approx. 45 kHz. Since the usable frequency range for poly-harmonic signals has to bebelow the resonant frequencies of both coils, the frequency of excitation signal has been set to arange of 1 kHz to 30 kHz.
Table 1. Double-D coil parameter values for the operating frequency of 8.170 kHz.
R1 (Ω) L1 (mH) R2 (Ω) L2 (mH) L1−2 (µH)
1.2 0.774 182 3.35 0.1
If only the search head, without its electronic, is used and if it operates on different frequen-cies than the tuned/balanced frequency (8.17 kHz), the coils will become unbalanced and theoutput voltage will not be minimal due to the mutual inductance L1−2. This effect can be usedfor further signal processing to compare the signal from a tested target with the signal withoutany target present – caused solely by the mutual inductance L1−2. Fig. 2 shows a block diagramof the measurement setup. The setup consists of a 14-bit programmable function generator AFG3102, a 15-bit digitizer connected to a PC and a Signal Recovery 7265 lock-in amplifier.
Fig. 2. A block diagram of the measurement setup.
For measuring linear frequency sweep sinusoidal and sinc signals, switches A and B areswitched to the 15-bit digitizer. In the case of the step sweep excitation signal the keys areswitched to Lock-in. The detector operates on a non-magnetic platform in a laboratory withoutany background noise. All excitation signals are 10 V voltage signals. As specimens, homoge-nous spheres of different diameters made of different ferrous and non-ferrous materials wereused. These targets were placed on the axis of the greatest sensitivity of the search head in theopen air at the distance of 50 mm from the coils. The targets were not placed into the ground
389
J. Svatoš, T. Pospíšil, J. Vedral: APPLICATION OF POLY-HARMONIC SIGNALS TO EDDY-CURRENT METAL . . .
to avoid the ground effect [18]. The measured data were processed in MATLAB software withclassification pattern recognition PRTools ver. 5 [19]. In the frequency domain, amplitude andphase spectra were calculated and presented together with polar graphs.
2.1. Step sweep sine-wave signal
The frequency step sweep signal, which consists of multiple frequencies equally steppedfrom lower to higher frequencies can be used to measure and verify the behaviour of the objectresponse function. An AFG 3102 generator generates measured frequencies of the voltage exci-tation signal from 3 kHz to 25 kHz with a step of 2 kHz. The frequency range covers one decadeof the response function for each target. The signal from the receiving coil is measured by theSignal Recovery 7265 lock-in amplifier. As a reference signal for the lock-in amplifier, the samesignal attenuated to the amplitude of 1 V (due to the lock-in reference input channel restrictions)is used (Fig. 2).
2.2. Linear frequency sweep signal
The linear frequency sweep, or the chirp signal, is commonly used in many areas, e.g. audioapplications, radar and sonar systems or communications [20]. Its advantage, as of all poly-harmonic signals, is that it can cover a wide frequency range of the response function. As adisadvantage, the impossibility of using synchronous demodulation has to be considered. Signalscomposed of multiple frequencies have to be first digitized and then processed using an advancedsignal processing method. The chirp signal spectrum is a rectangular function beginning withfrequency f0 and ending with frequency f1. The linear frequency sweep signal is generated usingthe formula:
u(t) = sin[
2π(
f0 +k2
t)
t]
and k =f1 − f0
T, (1)
where f0 is a starting (initial) frequency; f1 is a stopping frequency; t is a sweep time and k isa sweep rate. The selected starting frequency is 3 kHz and the sweep time is 10 ms. The signalfrom the receiving coil is acquired by a 15-bit analogue-to-digital converter with the samplingfrequency of 1 MS/s (Fig. 2). The signals that are composed of multiple frequencies, have to befirst digitized. After digitizing, advanced signal processing can be performed. The measured dataare filtered by a bandpass FIR filter of 300th order and Blackman-Harris window has been used.The lower frequency of the band pass filter is fd = 1 kHz and the upper frequency – fh = 30 kHz.Discrete Fourier Transformations (DFTs) from the filtered signals were calculated with a FastFourier Transform (FFT) algorithm. FFT was calculated for N = 1048578, which is the nearestpower of two for 1 M samples (1000 periods with 1000 samples each). Although the coherentsampling cannot be done, the results are relevant because of a large number N of samples usedin signal processing.
2.3. Sin(x)/x
The sine cardinal signal, commonly referred to as the sinc function, is one of the poly-harmonic signals suitable for metal detector excitation to cover a wide range of the responsefunctions of the detected object. The sinc signal is a very prospective and widely used excitationsignal due to its spectrum [21, 22]. The sinc function spectrum is appropriate for further spectralanalysis of the response function of the detected object. The number and positions of spectral
390
Metrol. Meas. Syst.,Vol. 25 (2018), No. 2, pp. 387–402.
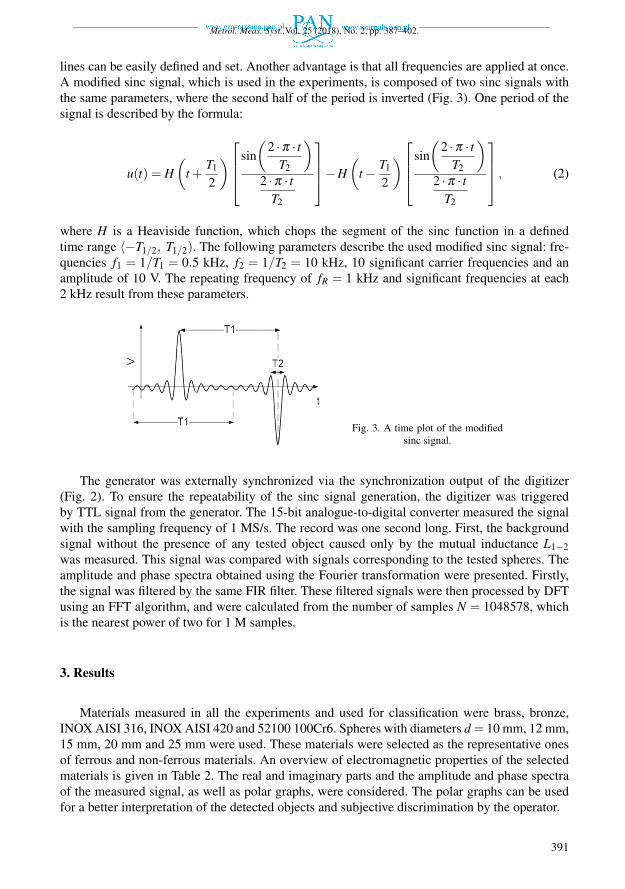
lines can be easily defined and set. Another advantage is that all frequencies are applied at once.A modified sinc signal, which is used in the experiments, is composed of two sinc signals withthe same parameters, where the second half of the period is inverted (Fig. 3). One period of thesignal is described by the formula:
u(t) = H(
t +T1
2
) sin(
2 ·π · tT2
)2 ·π · t
T2
−H(
t − T1
2
) sin(
2 ·π · tT2
)2 ·π · t
T2
, (2)
where H is a Heaviside function, which chops the segment of the sinc function in a definedtime range ⟨−T1/2, T1/2). The following parameters describe the used modified sinc signal: fre-quencies f1 = 1/T1 = 0.5 kHz, f2 = 1/T2 = 10 kHz, 10 significant carrier frequencies and anamplitude of 10 V. The repeating frequency of fR = 1 kHz and significant frequencies at each2 kHz result from these parameters.
Fig. 3. A time plot of the modifiedsinc signal.
The generator was externally synchronized via the synchronization output of the digitizer(Fig. 2). To ensure the repeatability of the sinc signal generation, the digitizer was triggeredby TTL signal from the generator. The 15-bit analogue-to-digital converter measured the signalwith the sampling frequency of 1 MS/s. The record was one second long. First, the backgroundsignal without the presence of any tested object caused only by the mutual inductance L1−2was measured. This signal was compared with signals corresponding to the tested spheres. Theamplitude and phase spectra obtained using the Fourier transformation were presented. Firstly,the signal was filtered by the same FIR filter. These filtered signals were then processed by DFTusing an FFT algorithm, and were calculated from the number of samples N = 1048578, whichis the nearest power of two for 1 M samples.
3. Results
Materials measured in all the experiments and used for classification were brass, bronze,INOX AISI 316, INOX AISI 420 and 52100 100Cr6. Spheres with diameters d = 10 mm, 12 mm,15 mm, 20 mm and 25 mm were used. These materials were selected as the representative onesof ferrous and non-ferrous materials. An overview of electromagnetic properties of the selectedmaterials is given in Table 2. The real and imaginary parts and the amplitude and phase spectraof the measured signal, as well as polar graphs, were considered. The polar graphs can be usedfor a better interpretation of the detected objects and subjective discrimination by the operator.
391
J. Svatoš, T. Pospíšil, J. Vedral: APPLICATION OF POLY-HARMONIC SIGNALS TO EDDY-CURRENT METAL . . .
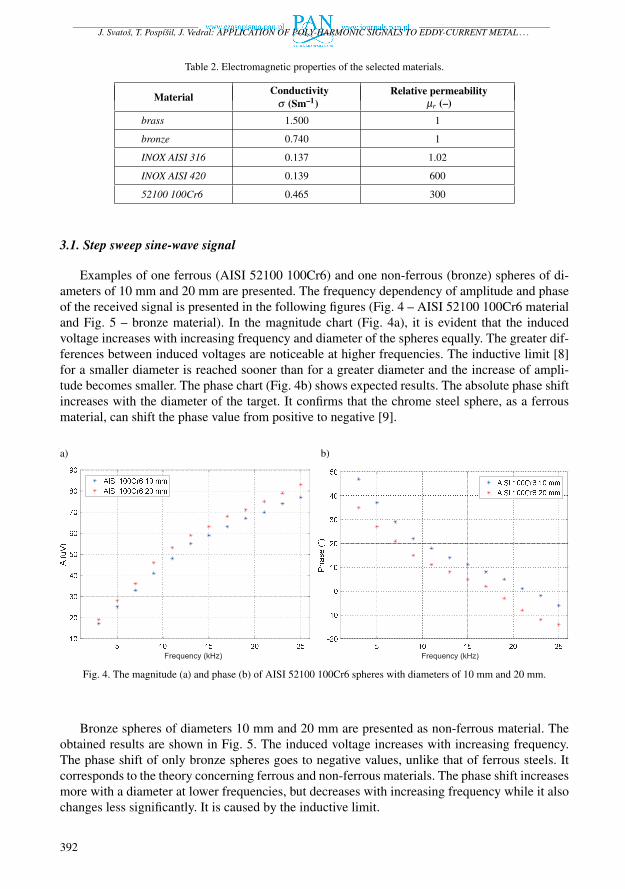
Table 2. Electromagnetic properties of the selected materials.
Material Conductivityσ (Sm–1)
Relative permeabilityµr (–)
brass 1.500 1
bronze 0.740 1
INOX AISI 316 0.137 1.02
INOX AISI 420 0.139 600
52100 100Cr6 0.465 300
3.1. Step sweep sine-wave signal
Examples of one ferrous (AISI 52100 100Cr6) and one non-ferrous (bronze) spheres of di-ameters of 10 mm and 20 mm are presented. The frequency dependency of amplitude and phaseof the received signal is presented in the following figures (Fig. 4 – AISI 52100 100Cr6 materialand Fig. 5 – bronze material). In the magnitude chart (Fig. 4a), it is evident that the inducedvoltage increases with increasing frequency and diameter of the spheres equally. The greater dif-ferences between induced voltages are noticeable at higher frequencies. The inductive limit [8]for a smaller diameter is reached sooner than for a greater diameter and the increase of ampli-tude becomes smaller. The phase chart (Fig. 4b) shows expected results. The absolute phase shiftincreases with the diameter of the target. It confirms that the chrome steel sphere, as a ferrousmaterial, can shift the phase value from positive to negative [9].
a) b)
Frequency (kHz) Frequency (kHz)
Fig. 4. The magnitude (a) and phase (b) of AISI 52100 100Cr6 spheres with diameters of 10 mm and 20 mm.
Bronze spheres of diameters 10 mm and 20 mm are presented as non-ferrous material. Theobtained results are shown in Fig. 5. The induced voltage increases with increasing frequency.The phase shift of only bronze spheres goes to negative values, unlike that of ferrous steels. Itcorresponds to the theory concerning ferrous and non-ferrous materials. The phase shift increasesmore with a diameter at lower frequencies, but decreases with increasing frequency while it alsochanges less significantly. It is caused by the inductive limit.
392

Metrol. Meas. Syst.,Vol. 25 (2018), No. 2, pp. 387–402.
a) b)
Frequency (kHz) Frequency (kHz)
Fig. 5. The magnitude (a) and phase (b) of bronze spheres with diameters of 10 mm and 20 mm.
3.2. Linear frequency sweep signal
The amplitude and phase spectra of a ferrous AISI 52100 100Cr6 sphere with a diameterof 10 mm and a non-ferrous bronze sphere with the same diameter of 10 mm are presented.The phase spectra were calculated and corrected as the difference between the transmitted andreceived signal phase spectra. Figs. 6 and 7 show the amplitude and phase spectra as well asa polar graph of two materials. They show the processed data of AISI 52100 100Cr6 and bronzespheres (both spheres with a diameter of 10 mm), respectively.
a) b)
Fig. 6. The amplitude and phase spectra of AISI 52100 100Cr6 sphere with a diameter of 10 mm (a); The amplitude andphase spectra of a bronze sphere with a diameter of 10 mm (b).
The shape of amplitude spectra for both materials shows that the material with a higherrelative permeability induces a higher voltage, especially at higher frequencies. It corresponds tothe step sweep sine-wave results and also to the theory. However, a noticeable difference is visiblefor the measured data of a bronze sphere where the magnitude for higher frequencies (greater
393

J. Svatoš, T. Pospíšil, J. Vedral: APPLICATION OF POLY-HARMONIC SIGNALS TO EDDY-CURRENT METAL . . .
than 10 kHz) does not increase. It can be explained by a very low level of the received signaland/or reaching the inductive limit by the induced voltage. The phase spectra of both materialsconfirm what is to be expected; the ferromagnetic materials, which have a relative permeabilityhigher than one, have the phase shift from positive to negative values and the non-ferromagneticmaterials have only negative values of the phase shift. The polar graph presented in Fig. 7 showscomparisons of both materials.
Fig. 7. A polar graph of both measured spheres.
3.3. Sin(x)/x
The presented materials are ferrous AISI 52100 100Cr6 and INOX AISI 420, whereas non-ferrous materials are brass and bronze. The phase spectra were calculated from the definitionof a complex variable. All presented phase spectra were calculated as the difference betweenthe phase spectrum of the signal, which corresponds to the measurement without any target(mutual inductance L1−2, no object) and the phase spectrum of the signal, which correspondsto the measurement with a testing target. For better presentation and comparison, the spectraof compared signals shown in the following figures are shifted by ±100 Hz. It is done only forbetter demonstration only. Figs. 8 and 9 show the measured amplitude and phase spectra togetherwith a polar graph of ferromagnetic AISI 52100 100Cr6 and INOX AISI 420 testing spheres oftwo different sizes (diameters of 10 mm and 20 mm).
The amplitude spectrum (Fig. 8a), which corresponds to AISI 52100 100Cr6 material, isgreater at all frequencies than the amplitude spectrum of the signal, which corresponds to theabsence of any object. It is caused by the ferrous material permeability, which is much greaterthan one. In general, the magnitude spectra become higher for all ferrous materials with increas-ing the sphere diameter. Magnitudes for low frequencies increase more significantly than thosefor higher frequencies, which can be caused by the character of the response function. The phaseshift difference confirms that ferrous materials shift the phase from positive to negative values.For a greater diameter, the absolute phase shift is increasing, whereas the relative phase shift isdecreasing due to reaching closer to the inductive limit.
The next presented ferromagnetic object (Fig. 9) is stainless steel INOX AISI 420, whichhas similar electromagnetic properties as chrome steel 100Cr6. The amplitude and phase spectra
394

Metrol. Meas. Syst.,Vol. 25 (2018), No. 2, pp. 387–402.
a) b)
Frequency (Hz)
Frequency (Hz)
Fig. 8. The amplitude and phase spectra (a) and a polar graph (b) corresponding to AISI 52100 100Cr6 spheres withdiameters of 10 mm and 20 mm.
a) b)
Frequency (Hz)
Frequency (Hz)
Fig. 9. The amplitude and phase spectra (a) and a polar graph (b) corresponding to INOX AISI 420 spheres with diametersof 10 mm and 20 mm.
are similar, too. Not surprisingly, at lower frequencies, the amplitude spectrum of the signal thatcorresponds to the INOX AISI 420 sphere increases more than at higher frequencies, similarly asfor the 100Cr6 chrome steel sphere. The phase difference spectrum also shows the same trend.The first presented non-ferrous material is brass. Brass spheres with diameters of 10 mm and20 mm are presented in Fig. 10.
The amplitude spectrum shows an essential difference from the ferrous materials. At higherfrequencies, non-ferrous materials cause a suppression of the induced voltage and a drop inspectral lines. A similar situation emerges with the difference of phase spectra. As expected, the
395

J. Svatoš, T. Pospíšil, J. Vedral: APPLICATION OF POLY-HARMONIC SIGNALS TO EDDY-CURRENT METAL . . .
a) b)
Frequency (Hz)
Frequency (Hz)
Fig. 10. The amplitude and phase spectra (a) and a polar graph (b) corresponding to brass spheres with diameters of10 mm and 20 mm.
phase shift caused by the non-ferrous objects goes only to negative values. At lower frequencies,the phase difference between the signal, which corresponds to the non-ferrous material, and thesignal, which corresponds to the measurement without any target present, is greater, as a diameterof the sphere becomes greater. At higher frequencies, a similar situation as for ferrous materialoccurs in the way that the relative phase shift decreases, reaching the inductive limit. The absolutephase shift becomes greater with a greater diameter of spheres. In Fig. 11, non-ferrous bronzematerial is presented.
a) b)
Frequency (Hz)
Frequency (Hz)
Fig. 11. The amplitude and phase spectra (a) and a polar graph (b) corresponding to bronze spheres with diameters of10 mm and 20 mm.
396

Metrol. Meas. Syst.,Vol. 25 (2018), No. 2, pp. 387–402.
The results resemble the situation for different ferrous materials. The response of non-ferrousmaterials – bronze and brass – is similar to each other. The behaviour of the amplitude and eventhe phase spectra is similar. The response function changed minimally because both materialshave a similar conductivity. A more detailed comparison of similar ferrous and non-ferrous ma-terials is presented in Fig. 12.
a) b)
Fig. 12. An X-Y chart corresponding to INOX AISI 420 and AISI 52100 100Cr6 spheres with diameters of 20 mm (a)and an X-Y chart corresponding to brass and bronze spheres with diameters of 20 mm (b).
Figure 12a shows the relation (X-Y chart, x-axis ~magnitude, y-axis ~phase) between theamplitude and phase spectra involving two specimens of similar materials: INOX AISI 420 andAISI 52100 100Cr6 spheres with diameters of 20 mm. The phase difference corresponding tothese materials is slightly greater than 1 degree at lower magnitudes (corresponding to lowerfrequencies) and slightly smaller than 1 degree at higher magnitudes (corresponding to higherfrequencies). The difference between both materials follows the trend of the phase spectrum.The minimal difference between the amplitude spectra is caused by a similar response parameterα value which depends on conductivity and on a relative permeability of the material [8].
When comparing (Fig. 12b) non-ferrous materials with similar electromagnetic properties(brass and bronze), a similar situation occurs. The difference in the amplitude spectrum in-creases with increasing frequency. The difference in the phase spectra decreases with increas-ing frequency. The phase difference at lower magnitudes (corresponding to lower frequencies) isequal to about 1.5 degree and only to about 0.25 degree for higher magnitudes (correspondingto higher frequencies). The trend of the phase shift depends on the value of the response param-eter α . The response parameter α value of brass is approx. twice greater than that of bronze.It leads to a smaller change in the phase. The change of the phase shift between materials withsimilar properties is decreasing with decreasing diameter similarly for ferrous and non-ferrousmaterials.
3.4. Classification
The classification of all measured objects was performed in MATLAB, extended by the pat-tern recognition toolbox PRTools. A Support Vector Machine classifier (SVC) together withNaive Bayes (naivebc), k-Nearest Neighbours (KNN) and Linear Nearest Mean Classifier (NMC)have been used. More details about these classifiers can be found in [20]. Nearest Mean Classifier
397
J. Svatoš, T. Pospíšil, J. Vedral: APPLICATION OF POLY-HARMONIC SIGNALS TO EDDY-CURRENT METAL . . .
is a commonly used classifier and it is primarily used for comparison of classification results. Inthe paper, the main emphasis is put on the sinc signal only.
To ensure the correct classification of data, a great amount of data has to be collected andprocessed. To reduce the required volume of data and calculations, the decision has been madethat the length of one measurement is 250 k samples. A sample rate of 1 MS/s has been used,i.e. one measurement has taken 250 ms and consisted of 250 periods (1000 samples/period) foreach target. At first, raw data have to be filtered. Since the frequency of measured data is fromfd = 1 kHz to fh = 21 kHz, a band-pass digital filter has been used. While the measured data froma specific object were compared with the data without any object, the background signal (causedonly by the mutual inductance L1−2, no object present) was measured before every single set ofmeasurements. Thereafter, a discrete Fourier transformation was calculated from the filtered rawdata of each set and all targets and saved to datasets.
All datasets were stored in a structure consisting of 80 sets of measurements, where oneset of measurements contained 20 different samples. Using the algorithm, a set of 10 desiredfrequencies and corresponding 10 values of amplitude spectra and 10 values of phase spectradifferent for each sphere and every measurement, were obtained. This way of processing gave a20-dimensional space (10 amplitudes and 10 phases) for classification. Since classifiers (SVC,naivebc, KNN and NMC) with supervised learning were used, the experimental data arranged inthe structure had to be divided into a training data group and a testing data group [24]. There aremany papers dealing with an optimal number of training data. One of the proposed methods usesthe Learning curve [25]. An optimal size of training data can be determined from the maximumof the Learning curve. The number of training datasets is optimal for 24 sets of measurementsout of 80 sets of measurements in total.
3.4.1. Classification into Ferrous and Non-ferrous Materials
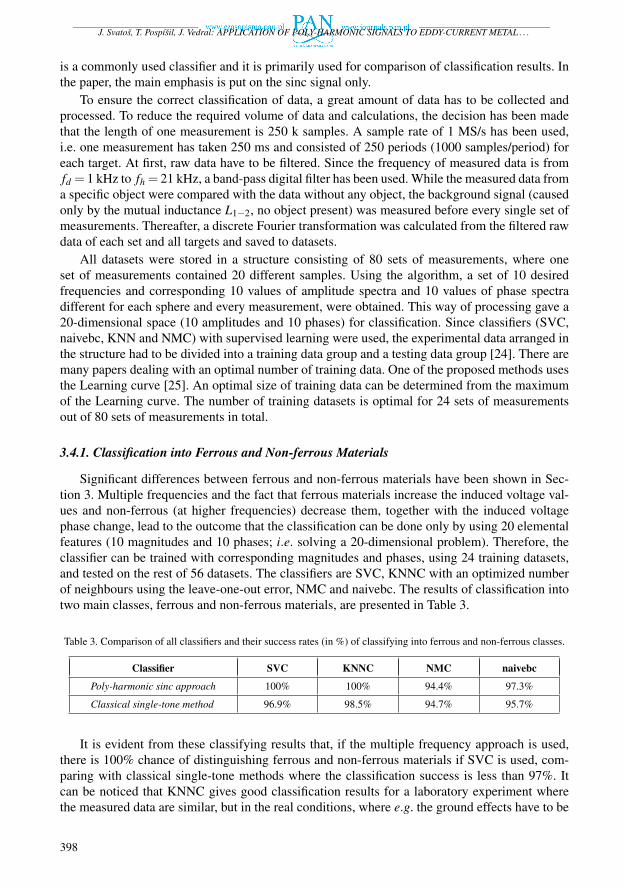
Significant differences between ferrous and non-ferrous materials have been shown in Sec-tion 3. Multiple frequencies and the fact that ferrous materials increase the induced voltage val-ues and non-ferrous (at higher frequencies) decrease them, together with the induced voltagephase change, lead to the outcome that the classification can be done only by using 20 elementalfeatures (10 magnitudes and 10 phases; i.e. solving a 20-dimensional problem). Therefore, theclassifier can be trained with corresponding magnitudes and phases, using 24 training datasets,and tested on the rest of 56 datasets. The classifiers are SVC, KNNC with an optimized numberof neighbours using the leave-one-out error, NMC and naivebc. The results of classification intotwo main classes, ferrous and non-ferrous materials, are presented in Table 3.
Table 3. Comparison of all classifiers and their success rates (in %) of classifying into ferrous and non-ferrous classes.
Classifier SVC KNNC NMC naivebc
Poly-harmonic sinc approach 100% 100% 94.4% 97.3%
Classical single-tone method 96.9% 98.5% 94.7% 95.7%
It is evident from these classifying results that, if the multiple frequency approach is used,there is 100% chance of distinguishing ferrous and non-ferrous materials if SVC is used, com-paring with classical single-tone methods where the classification success is less than 97%. Itcan be noticed that KNNC gives good classification results for a laboratory experiment wherethe measured data are similar, but in the real conditions, where e.g. the ground effects have to be
398

Metrol. Meas. Syst.,Vol. 25 (2018), No. 2, pp. 387–402.
taken into account, KNNC cannot be used because its algorithm is not robust. KNNC classifieris presented only for comparison of results.
3.4.2. Classification into Individual Non-ferrous Materials
There are only slight differences between individual non-ferrous materials, especially forsmall diameters. In order to classify them into individual material classes, a more complex ap-proach and additional features have to be considered. Magnitudes and phases, together withadditional features based on the relations between magnitudes and phases, should be used asfeatures. The added features do not need to have any physical nature and they can be definedusing the existing features. To improve the classification, the ratio of magnitudes and phases ofeach of 10 investigating frequencies were added, together with the differences between two sub-sequent values of phases (9 features). It adds 19 new features (39 features in total) that improvethe separation of individual ferrous and non-ferrous objects. These features were selected basedon the results presented in Section 3. Table 4 shows a comparison of results for various numbersof features and for used classifiers.
Table 4. Comparison of all classifiers and their success rates (in %) of classifying into individual non-ferrous classes.
Classifier SVC KNNC NMC naivebc
Poly-harmonic sinc approach with added features (39 features) 91.3% 99.3% 50% 90%
Poly-harmonic sinc approach (20 elemental features) 89.5% 99.3% 50% 90%
Classical single-tone method 68.2% 91.6% 70.5% 66.3%
The comparison of results shows that the success of SVC is less than 70% if a standard single-tone method is applied. If 20 elementary features are used, the classification success increasesto 89.5%. The classification success increases again to 91.3% when all 39 features are used.However, It does not mean that with the increasing number of features (dimensionality) the errorrate will be decreasing permanently [26].
3.4.3. Classification into Individual Ferrous Materials
The classification of individual ferrous materials has been done using the same approach as inthe classification of non-ferrous materials. Due to small differences between individual materials,additional features used for classification have been added. Table 5 shows results for all testedclassifiers and for various numbers of features.
Table 5. Comparison of all classifiers and their success rates (in %) of classifying into individual ferrous classes.
Classifier SVC KNNC NMC naivebc
Poly-harmonic sinc approach with added features (39 features) 97.3% 99.3% 54.5% 86.2%
Poly-harmonic sinc approach (20 elemental features) 94.4% 100% 50% 85.9%
Classical single-tone method 66.9% 86.1% 75% 78.3%
The results show a similar trend as in the classifying non-ferrous materials. In the case ofusing only two features (a standard single-tone method), the SVC success rate was smaller than67%. When 20 elemental features of 10 investigating frequencies were used for classification, the
399

J. Svatoš, T. Pospíšil, J. Vedral: APPLICATION OF POLY-HARMONIC SIGNALS TO EDDY-CURRENT METAL . . .
success rate increased to 94.42%. It confirms the previous results showing that when extra fea-tures for classification are added, even better results can be achieved. The classification successincreased to 97.32% when all defined features (39) were used. KNNC shows that an increasingnumber of features does not always decrease the error rate.
3.4.4. Classification into object size classes
The size estimation of a detected object could be considered as another possible classification.It is almost impossible to identify the exact size of a target, but one can roughly estimate asize using different trends of magnitude and phase spectra. The classification into different sizeestimation classes has been done after a successful classification into individual ferrous and non-ferrous material classes. Since spheres of a diameter ranging from d = 10 mm to d = 25 mm wereused during the experiment, three different classification classes have been chosen. The first classincludes object sizes to 10 mm, the second class includes object sizes from 11 mm to 19 mm andthird class includes objects larger than 19 mm. To determine the size, an approximate distancefrom the located object should be known. In [27] or [28], it is shown how to estimate the depth ofa located object. The results presented in Table 6 concern the similar distance from the detectorhead. It is possible to roughly estimate a located ferrous or non-ferrous object size under a givencondition. However, as the approximate distance of the object is not always known, it can onlybe used in certain cases.
Table 6. Comparison of various classifiers and their success rates (in %) of classifying for different sizes of materials.
Classifier SVC KNNC NMC naivebc
Poly-harmonic sinc approach 100% 100% 85.9% 100%
Non
-fe
rrou
s
Classical single-tone method 98.3% 99.2% 87.5% 92.3%
Poly-harmonic sinc approach 99.6% 99.6% 88.8% 100%
Ferr
ous
Classical single-tone method 99.3% 99.5% 97.5% 98.8%
4. Conclusion
In the paper, the application of poly-harmonic signals to metal detection and its classificationis presented. Step sweep sine-wave, linear frequency sweep and sinc signals were examined.A standard single-tone method offers the greatest sensitivity owing to the possibility of applyinga synchronous demodulator. Special synchronous demodulators offer a signal to noise ratio ofup to 120 dB, when compared with the poly-harmonic signal method where the synchronousdemodulation cannot be performed. Weaknesses of single-tone methods can be found in thefact that the received information about a detected object is contained only in the phase shift.Therefore, measuring only a single phase is not sufficient to state whether the object is ferrous ornon-ferrous, or even to state what type of material it is made of. Opposite to single-tone signals,the poly-harmonic signals have to be digitized. The signal-to-noise ratio of such a measurementchain, composed of a preamplifier and an analogue-to-digital converter, does not usually reachmore than 90 dB. A detailed analysis is presented in [29].
The frequency step sweep signal confirms the behaviour of ferrous and non-ferrous materialsfor different frequencies. The experiments show the possibility of using poly-harmonic signals
400
Metrol. Meas. Syst.,Vol. 25 (2018), No. 2, pp. 387–402.
to measure the response function of a detected object and to use the response function to iden-tify the object. A disadvantage of the frequency step sweep signal is the necessity to use thesynchronous demodulation for every frequency separately. The signal is processed per every sin-gle frequency, which makes individual measurements time-consuming. A poly-harmonic linearfrequency sweep signal covers a wide frequency range of the response function at once. An ad-vantage of this signal is the possibility of this method to display a wider response function whenan object is detected. However, the most promising and versatile excitation signal is a sinc signal.It is faster to apply a sinc signal than the other two methods, since all frequencies are generatedat once. Furthermore, the number of carrier frequencies and their positions (the start and stopfrequencies) can be defined easily.
A support vector classifier was used for the classification of measured data primarily, togetherwith other classifiers. All results showed that if the multiple frequencies’ approach (its magni-tudes and phases) was used as the features for classification and new features (relations betweenthe existing ones) were added, a successful classification could be obtained.
In the future work, a feature selection will be performed in order to reduce the dimensionalityand to select the most relevant features. Several feature selection algorithms, e.g. Branch andBound or Pudil’s floating feature selection, has been already tested and it is going to be a partof another project. Non-destructive testing (NDT) is another interesting area, where eddy-currentmethods are used. These techniques used in NDT could be examined and implemented in modernmetal detectors, to improve their abilities in a different way.
Acknowledgements
This research was supported by the SGS16/171/OHK3/2T/13 grant provided by the GrantAgency of the Czech Technical University in Prague.
References
[1] Acheroy, N., Milisavljevic, M. (2007). Signal processing for humanitarian mine action. IEEE SignalProcess. Mag., 24(4), 134–136.
[2] Novácek, P., Rohác, J., Šimánek, J., Ripka, P. (2013). Metal detector signal imprints of detected ob-jects. IEEE Trans. Magn., 49(1), 69–72.
[3] Connor, M., Scott, D.D. (1998). Metal Detector Use in Archaeology: An Introduction. Hist. Archaeol.,34(4), 76–85.
[4] Brooks, J.W. (2000). The Detection of Buried Non-Metallic Anti-Personnel Land Mines. The Univer-sity of Alabama in Huntsville.
[5] Guelle, D., Smith, A., Lewis, A., Bloodworth, T. (2003). Metal detector handbook for humanitariandemining. Luxembourg: Luxembourg: Office for Official Publications of the European Communities.
[6] Bielecki, Z., Janucki, J., Kawalec, A., Mikolajczyk, J., Palka, N., Pasternak, M., Pustelny, T.,Stacewicz, T., Wojtas, J. (2012). Sensors and systems for the detection of explosive devices – Anoverview. Metrol. Meas. Syst., 19(1), 3–28.
[7] Candy, B. (2010). Metal Detector Basics and Theory, Minleab. Available: http://www.minelab.com/_files/f/11043/kba_metal_detector_basics_&_theory.pdf.
[8] Bruschini, C. (2002). A Multidisciplinary Analysis of Frequency Domain Metal Detectors for Human-itarian Demining. Vrije Universiteit Brussel, 2002.
401
J. Svatoš, T. Pospíšil, J. Vedral: APPLICATION OF POLY-HARMONIC SIGNALS TO EDDY-CURRENT METAL . . .
[9] Svatoš, J., Vedral, J., Fexa, P. (2011). Metal detector excited by frequency-swept signal. Metrol. Meas.Syst., 18(1), 57–68.
[10] Gao, J., et al. (2009). Simulation analysis of multi-frequency eddy current sensor impedance property.2009 International Conference on Information Engineering and Computer Science, Wuhan, 1–4.
[11] Brojboiu, M., Popa, I.C., Ivanov, V. (2016). Numerical modeling of an eddy current sensor used ina metal separation device. 2016 International Conference on Applied and Theoretical Electricity,Craiova, 1–6.
[12] OToole, M., Karimian, N., Peyton, A.J. (2018). Classification of Non-ferrous Metals using MagneticInduction Spectroscopy. IEEE Transactions on Industrial Informatics, 3203, 1–9.
[13] Grant, F.S., West, G.F. (1965). Interpretation Theory in Applied Geophysics. New York: McGrawHill.
[14] Svatos, J., Vedral, J. (2012). The Usage of Frequency Swept Signals for Metal Detection. IEEE Trans.Magn., 48(4), 1501–1504.
[15] Svatos, J., Vedral, J., Novacek, P. (2012). Metal object detection and discrimination using Sinc signal.13th Biennial Baltic Electronics Conference, 307–310.
[16] Siegenfeld, A. (2003). ATMID – Technologie und Schaltungsbeschreibung. Schiebel.
[17] Schiebel, (2002). ATMID Maintenance Manual. Schiebel.
[18] Bruschini, C. (2004). On the low-frequency EMI response of coincident loops over a conductive andpermeable soil and corresponding background reduction schemes. IEEE Trans. Geosci. Remote Sens.,42(8), 1706–1719.
[19] Matlab Pattern Recognition Toolbox. Delft University of Technology. http//:prtools.org. (Sep. 2014).
[20] Svatoš, J., Vedral, J., Fexa, P. (2009). Methods for economical test of dynamic parameters adcs. Metrol.Meas. Syst., 16(1), 161–170.
[21] Kowalewski, M., Lentka, G. (2013). Fast High-Impedance Spectroscopy Method Using Sinc SignalExcitation. Metrol. Meas. Syst., 20(4), 645–654.
[22] Vedral, J., Fexa, P. (2012). DAC testing using impulse signals. Metrol. Meas. Syst., 19(1), 105–114.
[23] van der Heijden, F., Duin, R.P.W., de Ridder, D., Tax, D.M.J. (2004). Classification, Parameter Esti-mation and State Estimation. John Wiley & Sons, Ltd.
[24] Xiao, L., Deng, L. (2010). A geometric perspective of large-margin training of Gaussian models. IEEESignal Process. Mag., 27(6), 118–23.
[25] Beleites, C., Neugebauer, U., Bocklitz, T., Krafft, C., Popp, J. (2013). Sample size planning for clas-sification models. Anal. Chim. Acta, 760, 25–33.
[26] Kaski, J., Peltonen, S. (2011). Dimensionality reduction for data visualization. IEEE Signal Process.Mag., 28(1), 100–104.
[27] Das, Y., McFee, J., Chesney, R. (1985). Determination of Depth of Shallowly Buried Objects byElectromagnetic Induction. IEEE Trans. Geosci. Remote Sens., GE-23(1), 60–66.
[28] Das, Y., McFee, J., Toews, J., Stuart, G.C. (1990). Analysis of an electromagnetic induction detectorfor real-time location of buried objects. IEEE Trans. Geosci. Remote Sens., 28(3), 278–288.
[29] Svatoš, J. (2015). Advanced Instrumentation for Polyharmonic Metal Detectors (Doctoral disserta-tion), CTU in Prague, Prague, Czechia, https://dspace.cvut.cz/handle/10467/61084.
402
![i .] APPROXIMATING HARMONIC FUNCTIONS 499€¦ · APPROXIMATING HARMONIC FUNCTIONS 499 THE APPROXIMATION OF HARMONIC FUNCTIONS BY HARMONIC POLYNOMIALS AND BY HARMONIC RATIONAL FUNCTIONS*](https://static.fdocuments.net/doc/165x107/5f0873ba7e708231d42214c2/i-approximating-harmonic-functions-499-approximating-harmonic-functions-499-the.jpg)