APPLICATION OF PETROCHEMICALS INDUSTRY
34
DEPARTMENT OF TRADE AND INDUSTRY SAFEGUARD MEASURES CASE NAME: APPLICATION OF PETROCHEMICALS INDUSTRY PUBLIC VERSION SGM CASE NO. : SG05-2020 DATE : 28 August 2020 REPORT ON THE INITIATION OF A PRELIMINARY INVESTIGATION ON THE APPLICATION FOR SAFEGUARD MEASURES ON THE IMPORTATION OF HIGH-DENSITY POLYETHYLENE (HDPE) FROM VARIOUS COUNTRIES
Transcript of APPLICATION OF PETROCHEMICALS INDUSTRY

Public Version
0
DEPARTMENT OF TRADE AND INDUSTRY
SAFEGUARD MEASURES CASE NAME:
APPLICATION OF
PETROCHEMICALS INDUSTRY
PUBLIC VERSION
SGM CASE NO. : SG05-2020
DATE : 28 August 2020
REPORT ON THE INITIATION OF A PRELIMINARY
INVESTIGATION ON THE APPLICATION FOR
SAFEGUARD MEASURES ON THE IMPORTATION OF
HIGH-DENSITY POLYETHYLENE (HDPE) FROM
VARIOUS COUNTRIES
Public Version
1
REPORT ON THE INITIATION OF A PRELIMINARY INVESTIGATION ON THE APPLICATION FOR SAFEGUARD MEASURES ON THE IMPORTATION OF HIGH-
DENSITY POLYETHYLENE (HDPE) FROM VARIOUS COUNTRIES I. INTRODUCTION
This is an evaluation report on the evidence submitted by the petrochemical industry represented by JG Summit Petrochemical Corporation (JGSPC). The industry filed an application for the imposition of safeguard measures on the importation of High-Density Polyethylene (HDPE) pellets and granules from various countries. JGSPC alleged that serious injury to the domestic industry was caused by the increased import volume of HDPE which is classified under ASEAN Harmonized Tariff Nomenclature (AHTN) Code 3901.20.00 A. The Philippine Industry's Petition
A.1 Parties to the Petition - Domestic Industry/Petitioner
Section 4 (f) of RA 8800 defines "domestic industry" as referring to the "domestic producers, as a whole, of like or directly competitive products manufactured or produced in the Philippines or those whose collective output of like or directly competitive products constitutes a major proportion of the total production of those products". Rule 4.1 of the Implementing Rules and Regulations (IRRs) of RA 8800 further provides that: "(1) in the case of a domestic producer which also imports the product under consideration, only its domestic production of the like or directly competitive product shall be treated as part of the domestic production, or (2) in the case of a domestic producer which produces more than one product, only that portion of its production of the like or directly competitive product may be treated as part of such domestic industry". JGSPC was incorporated in 1994 as a joint venture between JG Summit Holdings, Inc. and Marubeni Corporation. Today, JGSPC is the largest manufacturer of polyolefins in the Philippines. It is the first and only integrated PE and PP resin manufacturer in the country. They produce HDPE, LLDPE, PP-H, and PP-R resins marketed under the EVALENE® brand using the world-renowned UNIPOL™ technology. 1
JGSPC’s in-house fabrication capabilities allow it to understand the customers' technical, operational, and performance requirements. The Product R&D laboratory has the following equipment that enables it to conduct lab-scale fabrication and analysis: blown film line, tubular water quench/IPP film line, cast film line, injection molding, blow molding, compression molding, compounding using a single screw or twin-screw extruder. 2
1 https://jgspetrochem.com/jg-summit-petrochemical-corporation/company-overview/ 2 https://jgspetrochem.com/choose-us/

Public Version
2
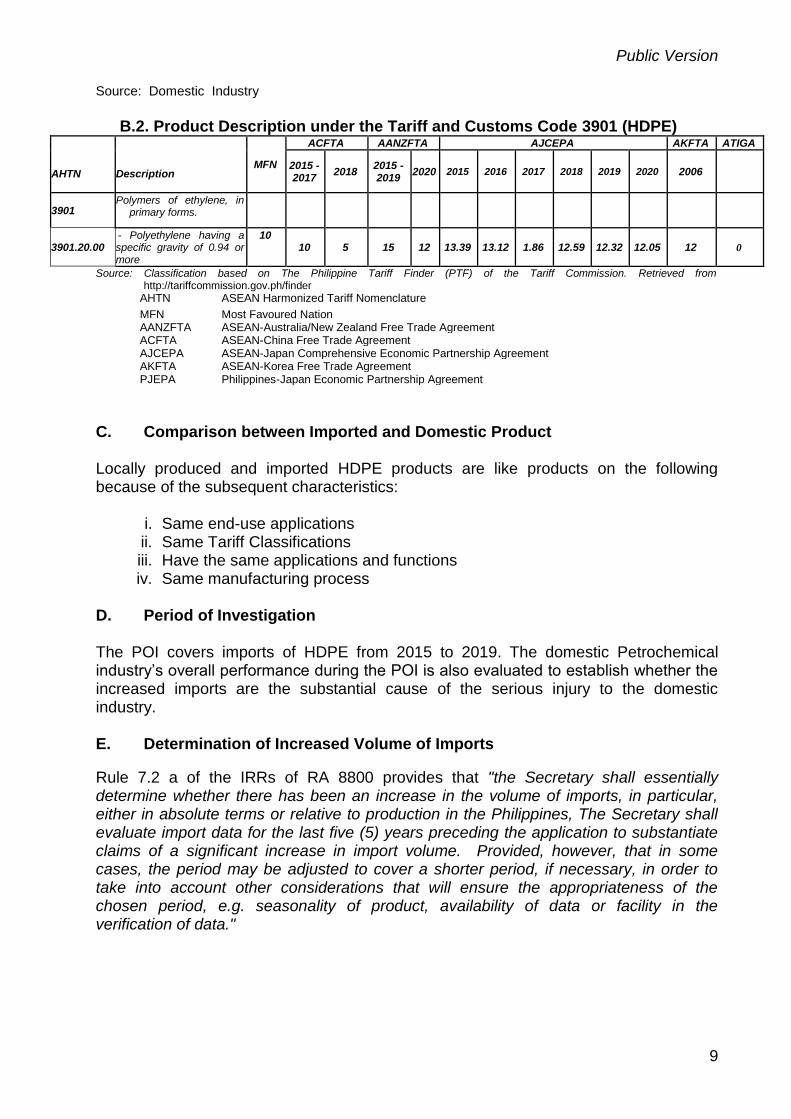
According to JGSPC, for their local and indirect export sales, they primarily sell its HDPE resins directly to over 200 local plastic products manufacturers and secondarily through distributors. While for export sales, JGSPC mainly sells through accredited distributors and trading partners. Since 1998, JGSPC has sold its products to over thirty (30) countries worldwide. Pursuant to Rule 4.1 cited above, JGSPC meets the legal requirement to be considered a domestic industry since JGSPC accounts for a 100% share of the total domestic production of HDPE. A.2. Importers and Exporters of HDPE Annexes A and B are the lists of importers and exporters of HDPE products during the period of the investigation. A.3. Industry Overview Petrochemicals is a strategic sector of the economy that could anchor the country’s industrial development. Because of its strong linkages upstream, midstream and downstream, the sector provides robust multiplier effects on other main sectors of the economy such as construction, electronics and computer, medical services, transportation and automotive, packaging, education, telecommunications, electrical and water distribution, agriculture and fishery, and furniture, among others3.
The industry's objective is to achieve self-sufficiency in strategic resin supply and increase the petrochemical sector’s contribution to total Philippine GDP from Php 44 B in 2010 to Php 113 B in 2018 and Php 215 B by 2025 through the progressive integration of upstream, midstream and downstream components of the sector. Such progressive integration will involve the entry into various other petrochemical branches that will provide exponential value addition in different industries, spurring domestic and export growth and potentially contributing up to 5-10% of GDP by 2025.
B. Role of the DTI under RA 8800 (The Safeguard Measures Act)
B.1 Examination of Evidence to Justify Initiation of Investigation
In establishing whether there is sufficient evidence to justify the initiation of the investigation, the Secretary relied on Section 6 paragraph 3 of RA 8800 and its IRRs. The said provision provides, "the Secretary shall review the accuracy and adequacy of the evidence adduced in the petition to determine the existence of a prima facie case that will justify the initiation of a preliminary investigation within five (5) days from receipt of the petition."
3 http://industry.gov.ph/industry/petrochemicals/

Public Version
3
B.2 Documents Received/Gathered by DTI On 09 March 2020, DTI received an application from JGSPC for the initiation of a safeguard measures investigation on the importation of HDPE from various countries. DTI evaluated the initial documents and informed JGSPC to submit additional data. On 27 May 2020, additional data were submitted by the industry, i.e. product description, raw materials used, export information, among others. II. THE PROCESS OF INITIATION OF INVESTIGATION A. Acceptance of the Petition In accepting the petition, the Secretary relied on the following provisions of the IRRs of RA 8800:
Rule 6.3 b provides, "the Secretary shall preliminary screen the application if the following conditions are met:
i. The application is signed; ii. All relevant questions are answered or the reasons for the absence of
information are given; and iii. The attachments to the application are complete".
Rule 6.3 c provides, "failure to supply all the information sought in the application will lead to the non-acceptance thereof. The Secretary shall check the consistency of the information provided in the application against other information available to him. The Secretary shall clarify any unclear or ambiguous statement with the applicant".
Rule 6.3 d provides, "as soon as the requirements are completed, the Secretary shall acknowledge in writing that he has already accepted a properly documented application. The date of the Secretary's letter shall be considered as day zero (0) of the five (5) calendar days within which he is required to determine whether there is sufficient evidence to justify the initiation of an investigation. The Secretary shall issue the letter as soon as practicable from his receipt of a properly documented application. If the applicant decides to give the Secretary further information in support of an application, the five (5) day period herein mentioned shall commence from the date of the submission of the new information. After this period, the Secretary shall no longer entertain any information that may be provided by the applicant".
On 24 August 2020, the Secretary officially informed JG Summit Petrochemical Corporation (JGSPC) that their petition has been accepted as a properly documented application.
Public Version
4
B. Decision to Initiate Rule 6.4 a of the IRRs of RA 8800 provides that "the Secretary shall, within five (5) calendar days from the date of his letter of acceptance of the properly documented application referred to in Rule 6.3.d, examine the accuracy and adequacy of the evidence submitted to determine the existence of a prima facie case that will justify the initiation of a preliminary investigation. In assessing the sufficiency of evidence provided in the application, the Secretary shall satisfy himself that based on the documents available to him, he can determine that the increased imports of the product under consideration are the substantial cause of the serious injury or threat thereof to the domestic producers of the product under consideration".
III. SAFEGUARD MEASURES: PARAMETERS FOR EVALUATION A. The Concept and Purpose of Safeguards Section 2 of RA 8800 provides that "the state shall promote the competitiveness of domestic industries and producers based on sound industrial and agricultural development policies, and the efficient use of human, natural and technical resources. In pursuit of this goal and in the public interest, the state shall provide safeguard measures to protect domestic industries and producers from increased imports which cause or threaten to cause serious injury to those domestic industries and producers."
B. Relevant Provisions on Initiation of Investigation Section 6 paragraphs 1 and 2 of RA 8800 states that "any person, whether natural or juridical, belonging to or representing a domestic industry may file with the Secretary a verified petition requesting that action be taken to remedy the serious injury or prevent the threat thereof to the domestic industry caused by increased imports of the product under consideration. The petition shall include documentary evidence supporting the facts that are essential to establish:
(1) an increase in imports of like or directly competitive products; (2) the existence of serious injury or threat thereof to the domestic industry; and (3) the causal link between the increased imports of the product under
consideration and the serious injury or threat thereof". Rule 6.2 a of the IRRs of RA 8800 further provides that "any person whether natural or juridical, belonging to or representing a domestic industry, may file a written application using a proforma protestant's questionnaire which shall include evidence of (i) an increase in the volume of imports of the like or directly competitive products, (ii) the existence of serious injury or threat thereof to the domestic industry; and (iii) a causal link between the increased imports of the product under consideration and the serious injury or threat thereof. The applicant shall submit four (4) copies of the application, including annexes, two (2) copies of which shall contain the non-confidential summaries of the information submitted".
Public Version
5
IV. THE EVIDENCE PRESENTED BY THE INDUSTRY
A. The Product Subject to the Petition Section 4 (h) of RA 8800 defines like product as "a domestic product which is identical, i.e. alike in all respects to the imported product under consideration, or in the absence of such a product, another domestic product which, although not alike in all respects, has characteristics closely resembling those of the imported product under consideration".
Section 4 (e) of RA 8800 further provides, "directly competitive product shall mean domestically produced substitutable products". A comparison of the imported HDPE with the locally produced HDPE is required to determine if these are like or directly competitive products.
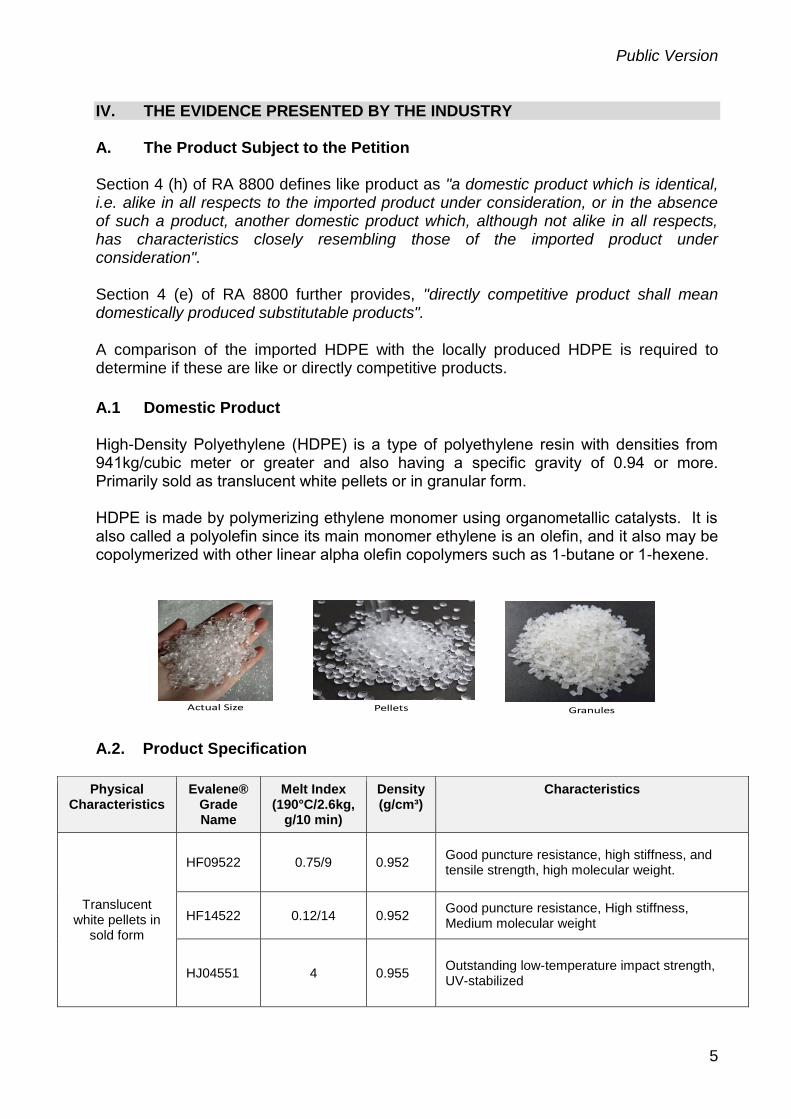
A.1 Domestic Product High-Density Polyethylene (HDPE) is a type of polyethylene resin with densities from 941kg/cubic meter or greater and also having a specific gravity of 0.94 or more. Primarily sold as translucent white pellets or in granular form. HDPE is made by polymerizing ethylene monomer using organometallic catalysts. It is also called a polyolefin since its main monomer ethylene is an olefin, and it also may be copolymerized with other linear alpha olefin copolymers such as 1-butane or 1-hexene.
A.2. Product Specification
Physical Characteristics
Evalene® Grade Name
Melt Index (190°C/2.6kg,
g/10 min)
Density (g/cm³)
Characteristics
Translucent white pellets in
sold form
HF09522 0.75/9 0.952 Good puncture resistance, high stiffness, and tensile strength, high molecular weight.
HF14522 0.12/14 0.952 Good puncture resistance, High stiffness, Medium molecular weight
HJ04551 4 0.955 Outstanding low-temperature impact strength, UV-stabilized
Pellets GranulesActual Size

Public Version
6
HJ04601 4 0.96 Excellent impact strength, High stiffness, UV-stabilized
HJ04602 4 0.96 Organoleptic-certified
HJ08601 8 0.96 Good impact strength, UV-stabilized, Organoleptic-certified
HJ20571 20 0.957 Excellent processability
HB09521 0.075/9 0.952 Outstanding Environmental Stress Crack Resistance (ESCR >700 hrs). High stiffness, High molecular weight
HB23551 0.27/23 0.955 Good ESCR, High stiffness
HB33531 0.39/33 0.953 Good processability
HP10441 0.08/10 0.944 High Oxidation-Induction Time (OIT), PE 80-certified
HP10441 0.08/10 0.944 High Oxidation-Induction Time (OIT), PE 80-certified
HP10491 0.02/6 0.949 PE100-certified, Excellent sag resistance, Excellent slow crack and rapid crack growth resistance, High Oxidation-Induction Time (OIT)
HM10561 1 0.956 Excellent tenacity, High stretchability
Source: Domestic Industry
A.3. Uses and Applications HDPE grades exhibit a superior balance of stiffness, impact strength and chemical resistance, making them ideal for a broad range of applications such as:
Evalene® Grade Name
Typical Application
HF09522 Grocery bags, Supermarket produce bags, carrier bags, trash bags, sack liners
HF14522 Produce bags on a roll, supermarket produce bags, wet market bags, sando bags, laundry bags, carrier bags, trash bags, sack liners, flexible packaging
HJ04551 Pallets and crates for cold storage applications
HJ04601 Pallets, Dunnage trays, crates, Industrial parts
HJ04602 Beverage caps for mineral water, juice and tea drinks
HJ08601 Crates and cases, caps for still and mineral water
HJ20571 Housewares, caps, pails, toys
HB09521 Medium size extrusion blow molded containers (10-50 liters) for household and industrial chemicals (HIC) condiments and cooking oil.
Public Version
7
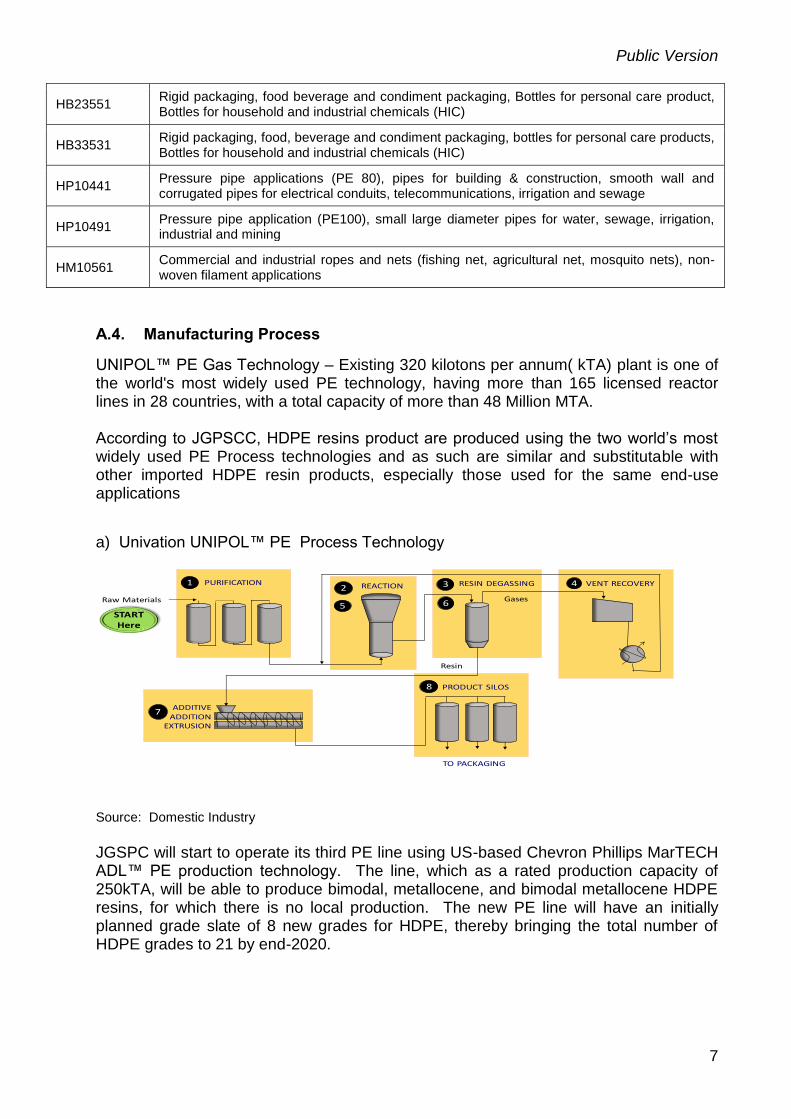
A.4. Manufacturing Process
UNIPOL™ PE Gas Technology – Existing 320 kilotons per annum( kTA) plant is one of the world's most widely used PE technology, having more than 165 licensed reactor lines in 28 countries, with a total capacity of more than 48 Million MTA. According to JGPSCC, HDPE resins product are produced using the two world’s most widely used PE Process technologies and as such are similar and substitutable with other imported HDPE resin products, especially those used for the same end-use applications
a) Univation UNIPOL™ PE Process Technology
Source: Domestic Industry
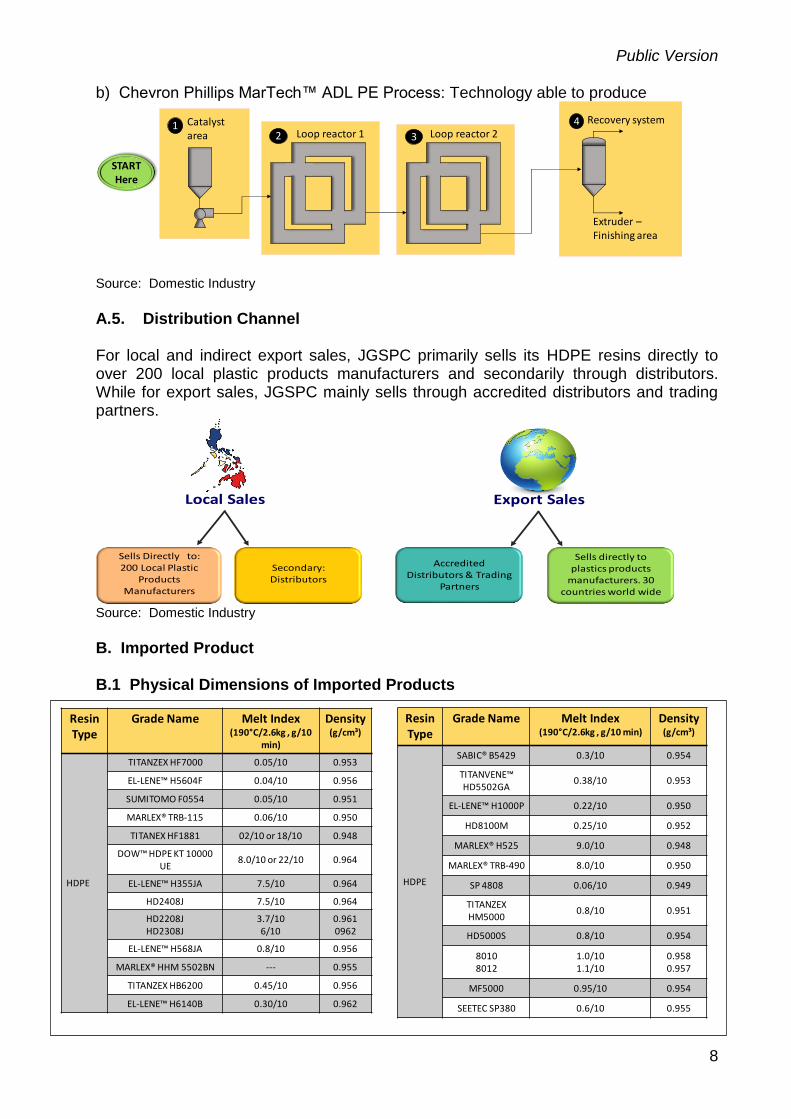
JGSPC will start to operate its third PE line using US-based Chevron Phillips MarTECH ADL™ PE production technology. The line, which as a rated production capacity of 250kTA, will be able to produce bimodal, metallocene, and bimodal metallocene HDPE resins, for which there is no local production. The new PE line will have an initially planned grade slate of 8 new grades for HDPE, thereby bringing the total number of HDPE grades to 21 by end-2020.
Raw Materials
PURIFICATION REACTION RESIN DEGASSING VENT RECOVERY
ADDITIVE ADDITION
EXTRUSION
PRODUCT SILOS
TO PACKAGING
12 3 4
7
8
5 6
STARTHere
Resin
Gases
HB23551 Rigid packaging, food beverage and condiment packaging, Bottles for personal care product, Bottles for household and industrial chemicals (HIC)
HB33531 Rigid packaging, food, beverage and condiment packaging, bottles for personal care products, Bottles for household and industrial chemicals (HIC)
HP10441 Pressure pipe applications (PE 80), pipes for building & construction, smooth wall and corrugated pipes for electrical conduits, telecommunications, irrigation and sewage
HP10491 Pressure pipe application (PE100), small large diameter pipes for water, sewage, irrigation, industrial and mining
HM10561 Commercial and industrial ropes and nets (fishing net, agricultural net, mosquito nets), non- woven filament applications
Public Version
8
b) Chevron Phillips MarTech™ ADL PE Process: Technology able to produce
Source: Domestic Industry
A.5. Distribution Channel
For local and indirect export sales, JGSPC primarily sells its HDPE resins directly to over 200 local plastic products manufacturers and secondarily through distributors. While for export sales, JGSPC mainly sells through accredited distributors and trading partners.
Source: Domestic Industry
B. Imported Product B.1 Physical Dimensions of Imported Products
Catalyst area Loop reactor 1 Loop reactor 2
Recovery system
Extruder –Finishing area
12 3
4
STARTHere
Sells Directly to: 200 Local Plastic
Products Manufacturers
Secondary:Distributors
Local Sales
Accredited Distributors & Trading
Partners
Sells directly to plastics products
manufacturers. 30 countries world wide
Export Sales
Resin Type
Grade Name Melt Index(190°C/2.6kg , g/10
min)
Density(g/cm³)
HDPE
TITANZEX HF7000 0.05/10 0.953
EL-LENE™ H5604F 0.04/10 0.956
SUMITOMO F0554 0.05/10 0.951
MARLEX® TRB-115 0.06/10 0.950
TITANEX HF1881 02/10 or 18/10 0.948
DOW™ HDPE KT 10000 UE
8.0/10 or 22/10 0.964
EL-LENE™ H355JA 7.5/10 0.964
HD2408J 7.5/10 0.964
HD2208JHD2308J
3.7/10 6/10
0.9610962
EL-LENE™ H568JA 0.8/10 0.956
MARLEX® HHM 5502BN --- 0.955
TITANZEX HB6200 0.45/10 0.956
EL-LENE™ H6140B 0.30/10 0.962
Resin Type
Grade Name Melt Index(190°C/2.6kg , g/10 min)
Density(g/cm³)
HDPE
SABIC® B5429 0.3/10 0.954
TITANVENE™ HD5502GA
0.38/10 0.953
EL-LENE™ H1000P 0.22/10 0.950
HD8100M 0.25/10 0.952
MARLEX® H525 9.0/10 0.948
MARLEX® TRB-490 8.0/10 0.950
SP 4808 0.06/10 0.949
TITANZEXHM5000
0.8/10 0.951
HD5000S 0.8/10 0.954
80108012
1.0/101.1/10
0.9580.957
MF5000 0.95/10 0.954
SEETEC SP380 0.6/10 0.955
Public Version
9
Source: Domestic Industry
B.2. Product Description under the Tariff and Customs Code 3901 (HDPE)
AHTN
Description
MFN
ACFTA AANZFTA AJCEPA AKFTA ATIGA
2015 - 2017
2018 2015 - 2019
2020 2015 2016 2017 2018 2019 2020 2006
3901 Polymers of ethylene, in
primary forms.
3901.20.00 - Polyethylene having a specific gravity of 0.94 or more
10 10 5 15 12 13.39 13.12 1.86 12.59 12.32 12.05 12 0
Source: Classification based on The Philippine Tariff Finder (PTF) of the Tariff Commission. Retrieved from http://tariffcommission.gov.ph/finder
AHTN ASEAN Harmonized Tariff Nomenclature
MFN Most Favoured Nation AANZFTA ASEAN-Australia/New Zealand Free Trade Agreement ACFTA ASEAN-China Free Trade Agreement AJCEPA ASEAN-Japan Comprehensive Economic Partnership Agreement AKFTA ASEAN-Korea Free Trade Agreement PJEPA Philippines-Japan Economic Partnership Agreement
C. Comparison between Imported and Domestic Product Locally produced and imported HDPE products are like products on the following because of the subsequent characteristics:
i. Same end-use applications ii. Same Tariff Classifications iii. Have the same applications and functions iv. Same manufacturing process
D. Period of Investigation The POI covers imports of HDPE from 2015 to 2019. The domestic Petrochemical industry’s overall performance during the POI is also evaluated to establish whether the increased imports are the substantial cause of the serious injury to the domestic industry. E. Determination of Increased Volume of Imports
Rule 7.2 a of the IRRs of RA 8800 provides that "the Secretary shall essentially determine whether there has been an increase in the volume of imports, in particular, either in absolute terms or relative to production in the Philippines, The Secretary shall evaluate import data for the last five (5) years preceding the application to substantiate claims of a significant increase in import volume. Provided, however, that in some cases, the period may be adjusted to cover a shorter period, if necessary, in order to take into account other considerations that will ensure the appropriateness of the chosen period, e.g. seasonality of product, availability of data or facility in the verification of data."

Public Version
10
E.1. Absolute Terms
The period of investigation covers HDPE imported into the Philippines from 2015 to 2019. All data were sourced from the Bureau of Customs (BOC), Single Administrative Document-Import Entry and Internal Revenue Document (SAD-IEIRD). For the analysis of import volume, DTI removed imports made by the domestic industry as well as products with different commodity descriptions from the product subject to the investigation (i.e. polyethylene wax, ethylene acrylic acid copolymer, polypropylene, et al) to determine whether the increase in imports is the principal cause of serious injury to the industry.
1.a Import Volume
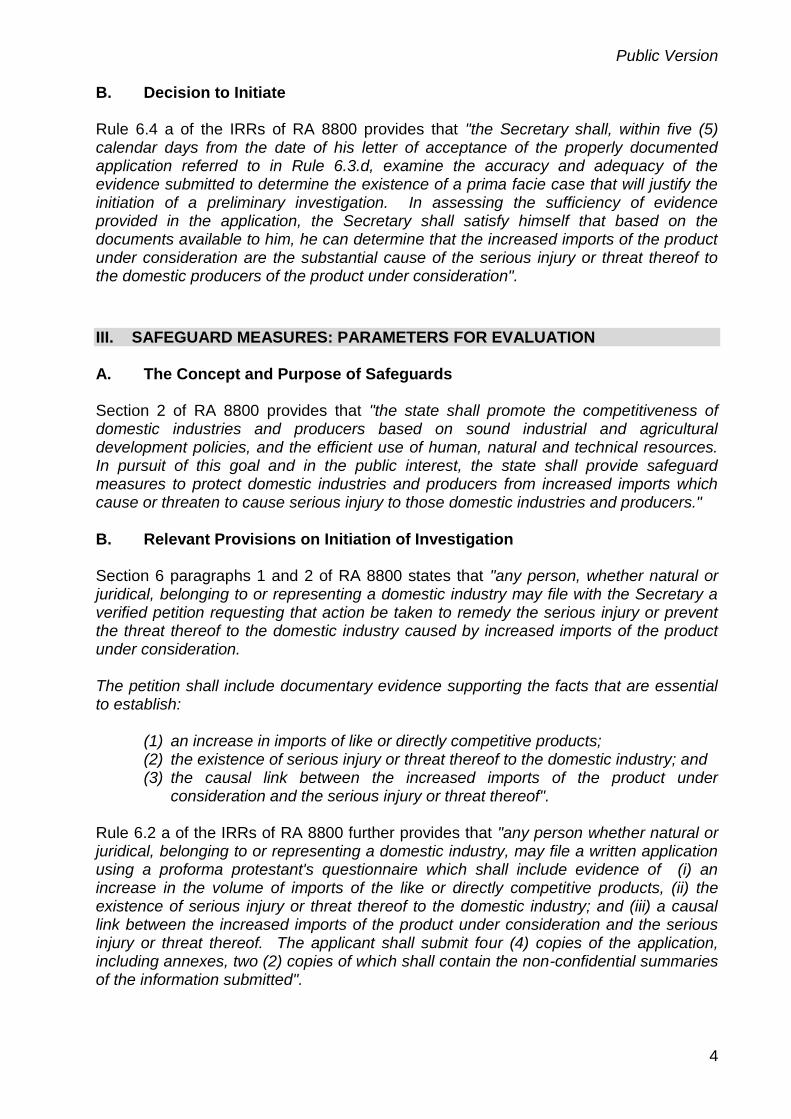
Figure 1a: Import Volume of High-Density Polyethylene (2015 – April 2020) in MT
Table 1: Import Volume of High-Density Polyethylene - HDPE (2015 – 2019) in MT
Source: Bureau of Customs (SAD-IEIRD)
The HDPE growth rate of imports for the five (5)-year period was recorded at 274%. Over the five (5)-year period, there were two significant surges in imports, one in 2016 and the other in 2019. The importation of HDPE recorded at 29,692MT in 2015. Imports rose by 53,860MT or 181% in 2016. It slightly declined by 2,881MT or 3% in 2017. Imports increased by 7,596MT or 9% in 2018. In 2019, imports significantly increased by 22,856MT or by 26% compared to the previous year. For January-April 2020, imported HDPE is already 36% of the 2019 level.
-
20,000
40,000
60,000
80,000
100,000
120,000
2015 2016 2017 2018 2019
MT
HDPE Volume of Imports from Various Countries(MT) 2015 to 2019
Year Period of Investigation (POI) 2020
Jan - April 2015 2016 2017 2018 2019
Imports 29,692 83,553 80,672 88,268 111,124 40,282 Absolute
Increase Decrease - 53,860 (2,881) 7,596 22,856 3,365
Growth - 181% (3%) 9% 26% -

Public Version
11
1. b. Share of Imports (by Country)
Table 2.a: Share of Imports (by Country) HDPE (2015 – 2019) in MT COUNTRY
2015 %
Share 2016
% Share
2017 %
Share 2018 % Share 2019 % Share
Thailand 13,600 45.80 32,957 39.44 25,914 32.12 31,177 35.32 32,372 29.13
Malaysia 4,757 16.02 12,977 15.53 10,175 12.61 19,972 22.63 31,596 28.43
Singapore 7,905 26.62 23,134 27.69 19,804 4.55 16,789 19.02 22,506 20.25
Saudi Arabia 1,188 4.00 6,107 7.31 14,966 18.55 13,384 15.16 12,513 11.26
Total: Major Suppliers
27,450 92.45 75,175 89.97 70,859 87.84 81,322 92.13 98,987 89.08
Other Suppliers 2,243 7.55 8,378 10.03 9,813 12.16 6,946 7.87 12,136 10.92
Total: Major & Other Sources
29,693 100.00 83,553 100.00 80,672 100 88,268 100.00 111,123 100.00
Source: Bureau of Customs (SAD-IEIRD)
The Philippine major suppliers of HDPE are Thailand, Malaysia, Singapore, and Saudi Arabia throughout the POI. OTHER SOURCES Table 2.b: Share of Imports (by Country) HDPE (2015 – 2019) in MT
Country 2015 %
Share
2016 %
Share
2017 %
Share
2018 %
Share
2019 %
Share
United Arab Emirates 1,430 4.82 866 1.04 1,095 1.36 829 0.94 867 0.78 Japan 124 0.42 116 0.14 280 0.35 410 0.46 339 0.31
United States 14 0.05 1,659 1.99 1,853 2.30 910 1.03 4,655 4.19
Republic of Korea 53 0.18 502 0.60 - 0.00 74 0.08 237 0.21
Indonesia 315 1.06 1,360 1.63 2,393 2.97 805 0.91 1,402 1.26
PROC 172 0.58 1,235 1.48 124 0.15 368 0.42 949 0.85
Kuwait 101 0.34 198 0.24 149 0.18 - 0.00 50 0.04
Austria 1 0.00 1 0.00 - - - 0.00 - -
Chinese Taipei 5 0.02 537 0.64 3,560 4.41 1,817 2.06 2,318 2.09
Belgium 28 0.09 - - - - - - - -
India 1 0.00 - - - - - - - -
Finland - - 6 0.01 - - - - 21 0.02
Netherlands - - 192 0.23 44 0.05 44 0.05 69 0.06
Qatar - - 271 0.32 67 0.08 1,036 1.17 934 0.84
Germany - - 1 0.00 - - 22 0.02 - -
Russia - - 1,436 1.72 - - - - - -
Hong Kong - - - - 250 0.31 372 0.42 243 0.22
Viet Nam - - - - - - 161 0.18 24 0.02
Brazil - - - - - - 99 0.11 6 0.005
Egypt - - - - - - - - 24 0.02
Total: Other Suppliers
2,243 7.55 8,378 10.03 9,813 12.16 6,946 7.87 12,136 10.92
Source: Bureau of Customs (SAD-IEIRD)

Public Version
12
E.2. Relative Terms Table 3: Comparison of Volume of Imports to Domestic Production of HDPE (2015-2019) in MT
Year Imports
(MT)
Domestic Production
(MT)*
Share of Imports to Domestic Production
(%)
2015 29,692 100 xxx
2016 83,553 110 xxx
2017 80,672 114 xxx
2018 88,268 115 xxx
2019 111,124 94 xxx Sources: Bureau of Customs (BOC-SAD-IEIRD) – Import Volume Domestic Industry – Domestic Production *Figures indexed due to confidentiality
The share of HDPE imports increased by 17% to domestic production in 2015. It further increased in 2016 and slightly declined in 2017. It increased again to in 2018 and further in 2019. Imports of HDPE relative to domestic production increased from 2015 to 2019. The domestic industry stated that as imports grew, in order to maintain their market share, they strived to keep their production volume greater than x x x per annum, despite the poor financial returns that the industry started to experience from 2017 onwards. V. EVIDENCE OF SERIOUS INJURY Rule 3.1 of the IRRs of RA 8800 provides that “a general safeguard measure under Chapter II of these IRRs shall apply where there is an increase in the quantity of a product being imported, whether absolute or relative to the domestic production, which is determined to be a substantial cause of serious injury or threat thereof to the domestic industry”. Section 4 (o) of RA 8800 also provides that “a serious injury shall mean a significant impairment in the position of the domestic industry after evaluation by competent authorities of all relevant factors of an objective and quantifiable nature having a bearing on the situation of the industry concerned. In particular, the rate and amount of the increase in imports of the product concerned in absolute and relative terms, the share of the domestic market taken by increased imports, changes in levels of sales, production, productivity, capacity utilization, profit and losses, and employment”. Section 12 of RA 8800 further provides that “in reaching a positive determination that the increase in the importation of the product under consideration is causing serious injury or threat thereof to a domestic industry producing like products or directly competitive products, all relevant factors having a bearing on the situation of the domestic industry shall be evaluated. These shall include, in particular, the rate and amount of the increase in imports of the products concerned in absolute and relative terms, the share of the domestic market taken by the increased imports, and changes in the level of sales, production, productivity, capacity utilization, profits and losses, and employment.

Public Version
13
Such positive determination shall not be made unless the investigation demonstrates on the basis of objective evidence, the existence of the causal link between the increased imports of the product under consideration and serious injury or threat thereof to the domestic industry. When factors other than increased imports are causing injury, such injury shall not be attributed to increased imports.”
A. Share of the Domestic Industry and Market Share
A.1 Philippine Market (size and share)
Table 4: Total Apparent Philippine Market (MT) – HDPE
Year
Imports Domestic Sales
Volume*
Total Apparent Philippine
Market*
% Increase Decrease
Market Share
Imports Domestic
Sales Non-
Manufacturers Manufac
turers Non-
Manufacturers Manufacturers
2015 29,692 - 100 100 - xxx xxx xxx
2016 83,553 3 119 154 54% xxx xxx xxx
2017 80,672 7 138 167 8% xxx xxx xxx
2018 88,268 - 136 171 3% xxx xxx xxx
2019 111,124 1 120 175 2% xxx xxx xxx
Sources: Bureau of Customs (BOC-SAD-IEIRD) – Import Volume Domestic Industry – Domestic Sales Volume
*Figures indexed due to confidentiality
Table 4 shows the total apparent Philippine market for HDPE from 2015 to 2019.
The total Philippine apparent market continuously increased during the POI. In 2016, the apparent Philippine market increased by 54%, as imports increased by 181%, while the domestic sales volume increased by 19%. It continued to increase by 8% in 2017. In 2018, apparent consumption grew by 3% as imports increased by 9% while domestic sales slightly declined by 1%. In 2019, there was a 2% growth in the apparent demand due to the 26% increase in imports while the domestic industry's share dropped by 12%.
The share of HDPE imports (non-manufacturers) relative to the total Philippine market increased significantly from 2015 to 2019 while the domestic industry’s imports accounted for less than one percent during the POI.
The share of domestic sales volume to the Philippine market declined from 2015 to 2016 and improved in 2017. However, the share of domestic sales declined in 2018 and further declined in 2019. According to the domestic industry, in 2018, for them to compete and defend their market share, the industry tried to keep their production volumes at a certain level. By 2019, production volumes had to be reduced to mitigate further losses.
Thus, the industry’s market share shrank as the share of imports increased during the POI.

Public Version
14
B.1. Domestic Sales
Table 5: Domestic Sales Volume and Value
Year Sales Volume
(MT)* % Increase (Decrease)
Sales Value (Php Million)*
% Increase (Decrease)
2015 100 - 100 -
2016 119
18.86 112 12.50
2017 138
15.98 141 25.15
2018 136
(1.11) 164 16.48
2019 120
(11.98) 126 (22.92) Source: Domestic Industry
*Figures indexed due to confidentiality
The industry’s domestic sales volume increased from 2015 to 2017 by 19% and 16%, respectively. However, sales volume declined by 2% in 2018 and further declined by 12% in 2019. Meanwhile, domestic sales value increased from 2015 to 2018 by 13%, 25%, and 17%, respectively. However, in 2019 sales value declined by 23%. According to the domestic industry, they have been steadily losing substantial sales volume from its existing customers since 2017 due to an increase in the volume of importation of competing products that are being sold at much lower prices, even lower than the industry's own cost to produce and sell. B.2. Export Sales Table 6: Export Sales Volume and Value
Year Sales Volume
(MT)* % Increase (Decrease)
Sales Value (Php Million)*
% Increase (Decrease)
2015 100 - 100 -
2016 113
13.41 108
8.24
2017 82
(28.06) 83
(23.53)
2018 61
(24.80) 74
(10.00)
2019 62
1.65 62
(16.73) Source: Domestic Industry *Figures indexed due to confidentiality
The industry’s export sales volume and value increased in 2016 by 14% and 8%, respectively. However, sales volume declined by 28% in 2017 and further by 25% in 2018 while sale value decreased by 24% and 10%, respectively. Despite the increase in sales volume by 2% in 2019, sales value declined by 17% in the same year. According to the domestic industry, they sell mainly through accredited distributors and trading partners but may also sell directly to plastic product manufacturers. Since 1998, they sold their products to over 30 countries worldwide.
Public Version
15
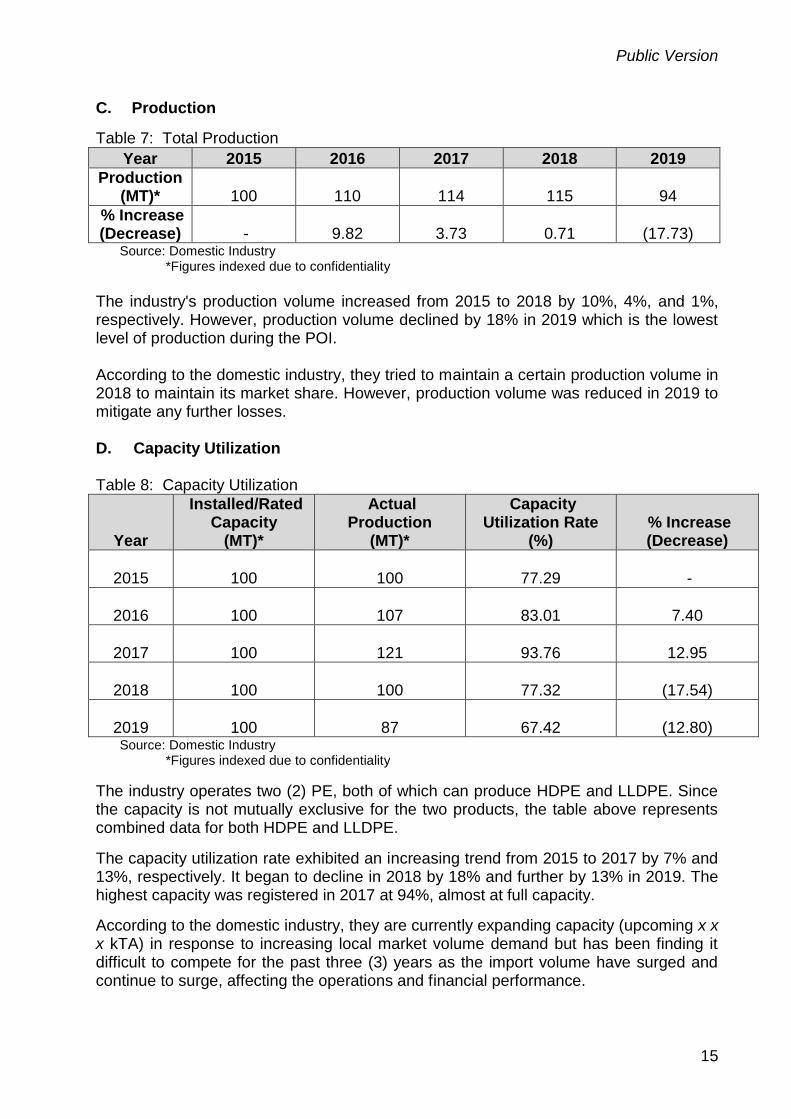
C. Production
Table 7: Total Production
Year 2015 2016 2017 2018 2019
Production (MT)* 100 110 114 115 94
% Increase (Decrease) -
9.82
3.73
0.71
(17.73)
Source: Domestic Industry *Figures indexed due to confidentiality
The industry's production volume increased from 2015 to 2018 by 10%, 4%, and 1%, respectively. However, production volume declined by 18% in 2019 which is the lowest level of production during the POI. According to the domestic industry, they tried to maintain a certain production volume in 2018 to maintain its market share. However, production volume was reduced in 2019 to mitigate any further losses.
D. Capacity Utilization Table 8: Capacity Utilization
Year
Installed/Rated Capacity
(MT)*
Actual Production
(MT)*
Capacity Utilization Rate
(%) % Increase (Decrease)
2015 100 100
77.29 -
2016 100 107
83.01
7.40
2017 100 121
93.76
12.95
2018 100 100
77.32
(17.54)
2019 100 87
67.42
(12.80) Source: Domestic Industry *Figures indexed due to confidentiality
The industry operates two (2) PE, both of which can produce HDPE and LLDPE. Since the capacity is not mutually exclusive for the two products, the table above represents combined data for both HDPE and LLDPE.
The capacity utilization rate exhibited an increasing trend from 2015 to 2017 by 7% and 13%, respectively. It began to decline in 2018 by 18% and further by 13% in 2019. The highest capacity was registered in 2017 at 94%, almost at full capacity.
According to the domestic industry, they are currently expanding capacity (upcoming x x x kTA) in response to increasing local market volume demand but has been finding it difficult to compete for the past three (3) years as the import volume have surged and continue to surge, affecting the operations and financial performance.

Public Version
16
E. Finished Goods Inventory
Table 9: Finished Goods Inventory
Year Volume
(MT)* % Increase (Decrease)
Value (Php Million)*
% Increase (Decrease)
2015 100 - 100 -
2016 93
(6.93) 99
(1.12)
2017 79
(14.99) 138
39.30
2018 213
169.26 348
151.97
2019 183
(14.16) 240
(30.90) Source: Domestic Industry *Figures indexed due to confidentiality
The finished goods inventory volume declined from 2015 to 2017 by 7% and 15%, respectively, while inventory value slightly declined by 1% in 2016 but increased by 39% in 2017. In 2018, both volume and value increased by 169% and 152%, respectively as the industry tried to maintain production volume. In 2019, the inventory volume and value declined by 14% and 31%, respectively as the industry managed their production output to mitigate further losses. According to the domestic industry, the remaining inventory year on year has been increasing since 2017, which reflects the increasing difficulty to reduce inventory by year-end due to an increase in the volume of lower-priced imports in the market. F. Cost to Produce Table 10: Cost to Produce
Particulars
2015
2016
2017
2018
2019
Raw Materials* 94.2 93.9 90.1 93.6 92.7
Direct Labor* 0.6 0.7 0.2 0.2 0.2
Manufacturing Overhead*
5.2 5.4 9.8 6.2 7.1
Cost to Produce (per MT)*
100 100 100 100 100
% Increase (Decrease)** - (9.93) 12.37 12.04 (5.30)
Source: Domestic Industry *Figures in percentage to the cost to produce per MT
**Computed based on the absolute figures of cost to produce per MT
The industry's production cost per unit declined in 2016 by 10%, increased in 2017 by 12%, and an additional increase of 12% in 2018. In 2019, it declined by 5%.
Public Version
17
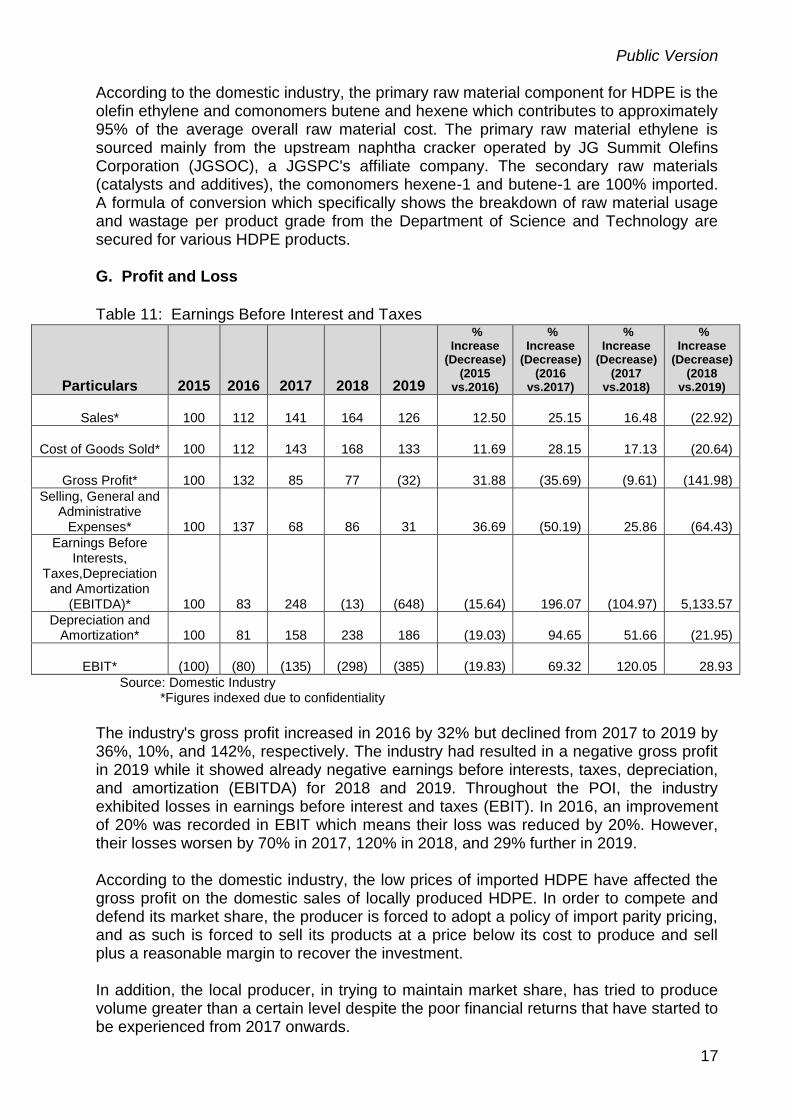
According to the domestic industry, the primary raw material component for HDPE is the olefin ethylene and comonomers butene and hexene which contributes to approximately 95% of the average overall raw material cost. The primary raw material ethylene is sourced mainly from the upstream naphtha cracker operated by JG Summit Olefins Corporation (JGSOC), a JGSPC's affiliate company. The secondary raw materials (catalysts and additives), the comonomers hexene-1 and butene-1 are 100% imported. A formula of conversion which specifically shows the breakdown of raw material usage and wastage per product grade from the Department of Science and Technology are secured for various HDPE products. G. Profit and Loss
Table 11: Earnings Before Interest and Taxes
Particulars 2015 2016 2017 2018 2019
% Increase
(Decrease) (2015
vs.2016)
% Increase
(Decrease) (2016
vs.2017)
% Increase
(Decrease) (2017
vs.2018)
% Increase
(Decrease) (2018
vs.2019)
Sales* 100 112 141 164 126
12.50
25.15
16.48
(22.92)
Cost of Goods Sold* 100 112 143 168 133
11.69
28.15
17.13
(20.64)
Gross Profit* 100 132 85 77 (32)
31.88
(35.69)
(9.61)
(141.98)
Selling, General and Administrative
Expenses* 100 137 68 86 31
36.69
(50.19)
25.86
(64.43)
Earnings Before Interests,
Taxes,Depreciation and Amortization
(EBITDA)* 100 83 248 (13) (648)
(15.64)
196.07
(104.97)
5,133.57
Depreciation and Amortization* 100 81 158 238 186
(19.03)
94.65
51.66
(21.95)
EBIT* (100) (80) (135) (298) (385)
(19.83)
69.32
120.05
28.93
Source: Domestic Industry *Figures indexed due to confidentiality
The industry's gross profit increased in 2016 by 32% but declined from 2017 to 2019 by 36%, 10%, and 142%, respectively. The industry had resulted in a negative gross profit in 2019 while it showed already negative earnings before interests, taxes, depreciation, and amortization (EBITDA) for 2018 and 2019. Throughout the POI, the industry exhibited losses in earnings before interest and taxes (EBIT). In 2016, an improvement of 20% was recorded in EBIT which means their loss was reduced by 20%. However, their losses worsen by 70% in 2017, 120% in 2018, and 29% further in 2019. According to the domestic industry, the low prices of imported HDPE have affected the gross profit on the domestic sales of locally produced HDPE. In order to compete and defend its market share, the producer is forced to adopt a policy of import parity pricing, and as such is forced to sell its products at a price below its cost to produce and sell plus a reasonable margin to recover the investment. In addition, the local producer, in trying to maintain market share, has tried to produce volume greater than a certain level despite the poor financial returns that have started to be experienced from 2017 onwards.
Public Version
18
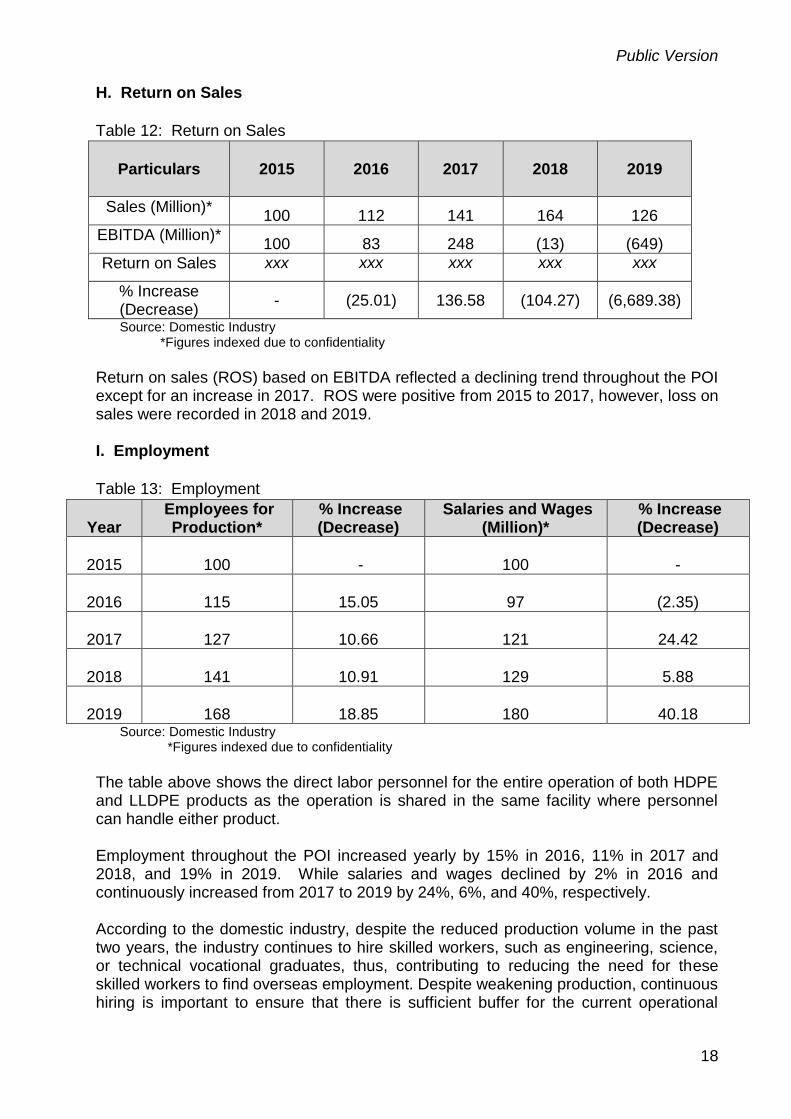
H. Return on Sales
Table 12: Return on Sales
Particulars
2015
2016
2017
2018
2019
Sales (Million)* 100 112 141 164 126
EBITDA (Million)* 100 83 248 (13) (649)
Return on Sales xxx xxx xxx xxx xxx
% Increase (Decrease)
- (25.01) 136.58 (104.27) (6,689.38)
Source: Domestic Industry *Figures indexed due to confidentiality
Return on sales (ROS) based on EBITDA reflected a declining trend throughout the POI except for an increase in 2017. ROS were positive from 2015 to 2017, however, loss on sales were recorded in 2018 and 2019. I. Employment
Table 13: Employment
Year Employees for
Production* % Increase (Decrease)
Salaries and Wages (Million)*
% Increase (Decrease)
2015 100 - 100 -
2016 115
15.05 97 (2.35)
2017 127
10.66 121 24.42
2018 141
10.91 129 5.88
2019 168
18.85 180 40.18 Source: Domestic Industry *Figures indexed due to confidentiality
The table above shows the direct labor personnel for the entire operation of both HDPE and LLDPE products as the operation is shared in the same facility where personnel can handle either product. Employment throughout the POI increased yearly by 15% in 2016, 11% in 2017 and 2018, and 19% in 2019. While salaries and wages declined by 2% in 2016 and continuously increased from 2017 to 2019 by 24%, 6%, and 40%, respectively. According to the domestic industry, despite the reduced production volume in the past two years, the industry continues to hire skilled workers, such as engineering, science, or technical vocational graduates, thus, contributing to reducing the need for these skilled workers to find overseas employment. Despite weakening production, continuous hiring is important to ensure that there is sufficient buffer for the current operational
Public Version
19
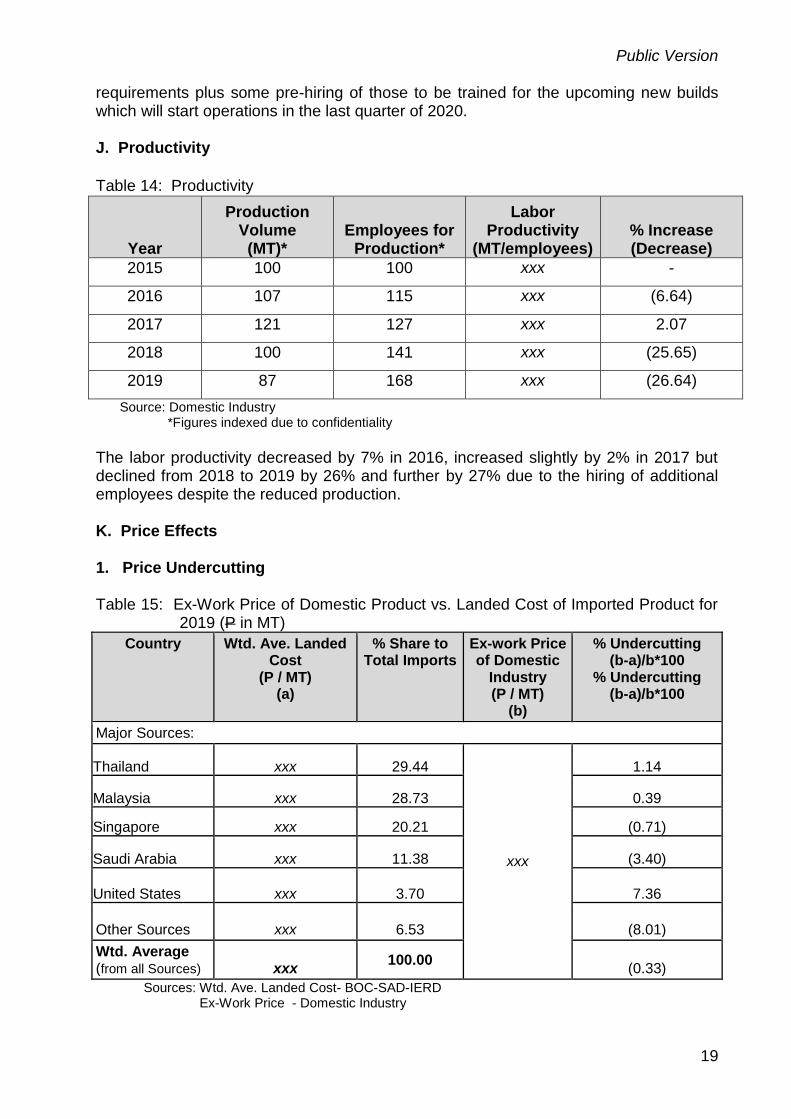
requirements plus some pre-hiring of those to be trained for the upcoming new builds which will start operations in the last quarter of 2020. J. Productivity
Table 14: Productivity
Year
Production Volume (MT)*
Employees for Production*
Labor Productivity
(MT/employees) % Increase (Decrease)
2015 100 100 xxx -
2016 107 115 xxx (6.64)
2017 121 127 xxx 2.07
2018 100 141 xxx (25.65)
2019 87 168 xxx (26.64)
Source: Domestic Industry *Figures indexed due to confidentiality
The labor productivity decreased by 7% in 2016, increased slightly by 2% in 2017 but declined from 2018 to 2019 by 26% and further by 27% due to the hiring of additional employees despite the reduced production. K. Price Effects 1. Price Undercutting Table 15: Ex-Work Price of Domestic Product vs. Landed Cost of Imported Product for
2019 (P in MT)
Country Wtd. Ave. Landed Cost
(P / MT) (a)
% Share to Total Imports
Ex-work Price of Domestic
Industry (P / MT)
(b)
% Undercutting (b-a)/b*100
% Undercutting (b-a)/b*100
Major Sources:
Thailand xxx 29.44
xxx
1.14
Malaysia xxx 28.73 0.39
Singapore xxx 20.21 (0.71)
Saudi Arabia xxx 11.38 (3.40)
United States xxx 3.70 7.36
Other Sources xxx 6.53 (8.01)
Wtd. Average (from all Sources) xxx
100.00 (0.33)
Sources: Wtd. Ave. Landed Cost- BOC-SAD-IERD Ex-Work Price - Domestic Industry
Public Version
20
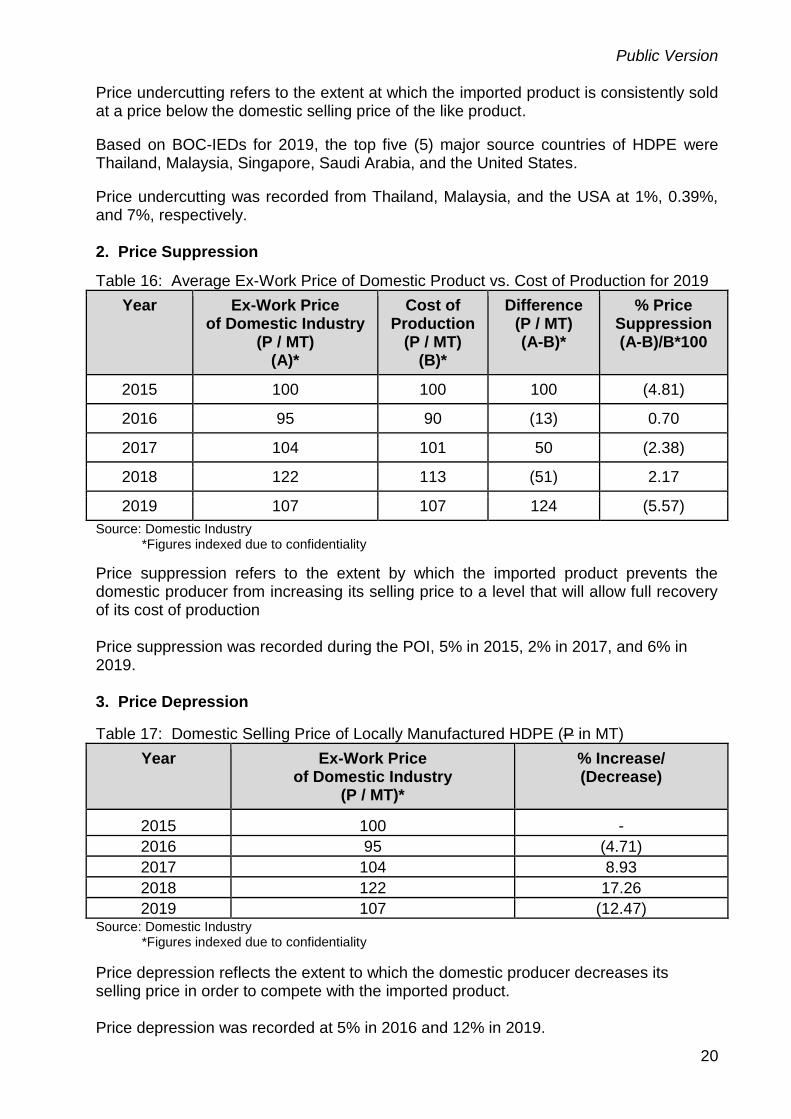
Price undercutting refers to the extent at which the imported product is consistently sold at a price below the domestic selling price of the like product.
Based on BOC-IEDs for 2019, the top five (5) major source countries of HDPE were Thailand, Malaysia, Singapore, Saudi Arabia, and the United States.
Price undercutting was recorded from Thailand, Malaysia, and the USA at 1%, 0.39%, and 7%, respectively. 2. Price Suppression
Table 16: Average Ex-Work Price of Domestic Product vs. Cost of Production for 2019
Year Ex-Work Price of Domestic Industry
(P / MT) (A)*
Cost of Production
(P / MT) (B)*
Difference (P / MT) (A-B)*
% Price Suppression (A-B)/B*100
2015 100 100 100 (4.81)
2016 95 90 (13) 0.70
2017 104 101 50 (2.38)
2018 122 113 (51) 2.17
2019 107 107 124 (5.57)
Source: Domestic Industry *Figures indexed due to confidentiality
Price suppression refers to the extent by which the imported product prevents the domestic producer from increasing its selling price to a level that will allow full recovery of its cost of production Price suppression was recorded during the POI, 5% in 2015, 2% in 2017, and 6% in 2019. 3. Price Depression
Table 17: Domestic Selling Price of Locally Manufactured HDPE (P in MT)
Year Ex-Work Price of Domestic Industry
(P / MT)*
% Increase/ (Decrease)
2015 100 -
2016 95 (4.71)
2017 104 8.93
2018 122 17.26
2019 107 (12.47) Source: Domestic Industry
*Figures indexed due to confidentiality
Price depression reflects the extent to which the domestic producer decreases its selling price in order to compete with the imported product. Price depression was recorded at 5% in 2016 and 12% in 2019.

Public Version
21
L. Other Adverse Effects
The negative financial status of the industry has made it increasingly difficult to get financing for its modernization, expansion, and operational requirements.
Cash flow has been affected because of the lower return on sales. The industry has been unable to increase the wages up to global standards
because of the negative financial situation and it is more difficult to hold on and retain its more important technical personnel.
M. Other Matters Update of JGSPC Operations Amidst the Covid19
Able to continue with manufacturing operations on skeletal force, following IATF guidelines on proper social distancing, enhanced health monitoring, and safety procedures
Ongoing expansion projects have completely stopped during the ECQ period but with GCQ in effect in Batangas since May 16, their BOI-registered projects including the PE project is set to resume construction, following DPWH guidelines and under LGU monitoring.
Severely impacted by the COVID health pandemic due to lockdowns causing the shutdown of customers' plants, sudden dive in prices and drop in demand, not just locally but worldwide
Significantly affected by recently enacted EO 113, effective for the duration of Bayanihan Heal as One Act, which adds 10% duty to naphtha and LPG that they use as raw materials to produce petrochemical products. Thus, making them even more uncompetitive compared to imported products who are not likewise being imposed with additional tariffs during this pandemic period by their respective governments.
VI.1 FINDINGS AND CONCLUSIONS A. Volume of Imports
A.1 In Absolute Terms
Between 2015-2016, imports significantly increased by about 54,000MT or 181%, slightly declined by about 3,000MT or 3% in 2017. Imports were up again by 9% in 2018 and 26% in 2019.
Imported HDPE recorded a 274% growth rate over the five (5)-year period
Imports in 2020 (Jan– April) increased by 9% from 2019 (Jan – April) level.
Thailand, Singapore, Malaysia, and Saudi Arabia are the major suppliers during the POI
A.2 In Relative Terms
Share of imports to domestic production increased from 17% in 2015 to 45% in 2016.
Slightly declined to 42% in 2017; increased again to 45% in 2018 and further to 69% in 2019.
Public Version
22
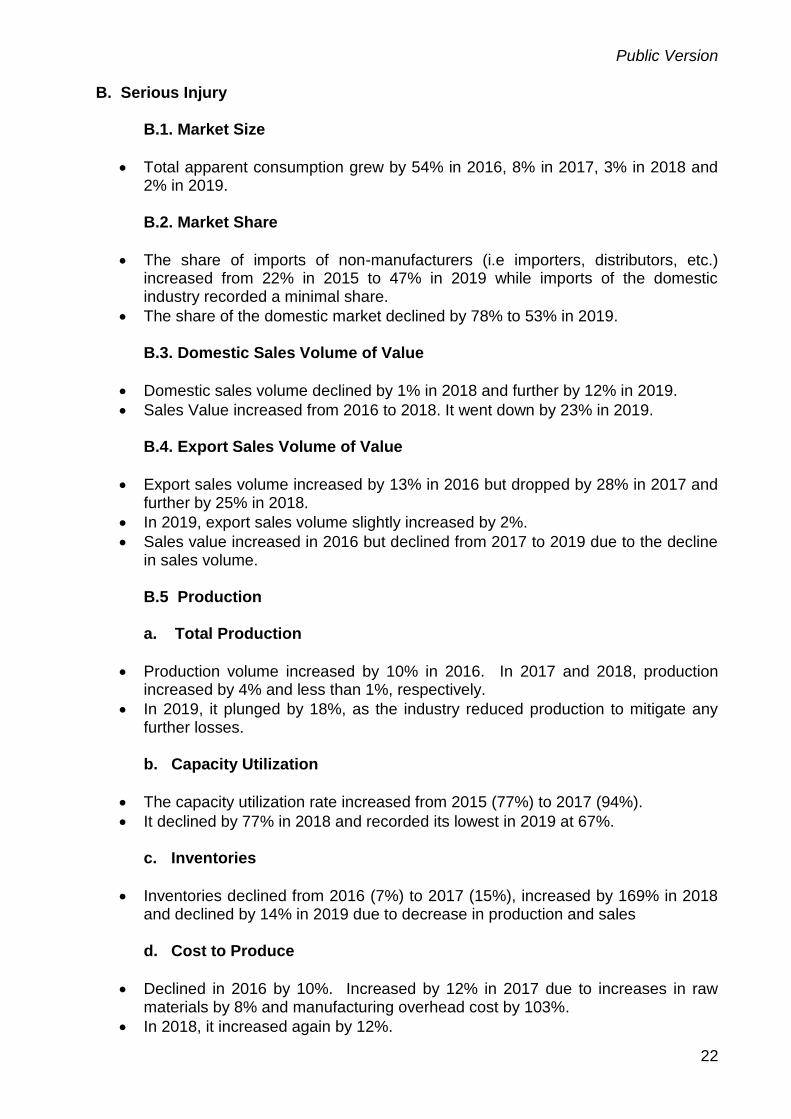
B. Serious Injury B.1. Market Size
Total apparent consumption grew by 54% in 2016, 8% in 2017, 3% in 2018 and 2% in 2019. B.2. Market Share
The share of imports of non-manufacturers (i.e importers, distributors, etc.) increased from 22% in 2015 to 47% in 2019 while imports of the domestic industry recorded a minimal share.
The share of the domestic market declined by 78% to 53% in 2019. B.3. Domestic Sales Volume of Value
Domestic sales volume declined by 1% in 2018 and further by 12% in 2019.
Sales Value increased from 2016 to 2018. It went down by 23% in 2019. B.4. Export Sales Volume of Value
Export sales volume increased by 13% in 2016 but dropped by 28% in 2017 and further by 25% in 2018.
In 2019, export sales volume slightly increased by 2%.
Sales value increased in 2016 but declined from 2017 to 2019 due to the decline in sales volume. B.5 Production a. Total Production
Production volume increased by 10% in 2016. In 2017 and 2018, production increased by 4% and less than 1%, respectively.
In 2019, it plunged by 18%, as the industry reduced production to mitigate any further losses.
b. Capacity Utilization
The capacity utilization rate increased from 2015 (77%) to 2017 (94%).
It declined by 77% in 2018 and recorded its lowest in 2019 at 67%. c. Inventories
Inventories declined from 2016 (7%) to 2017 (15%), increased by 169% in 2018 and declined by 14% in 2019 due to decrease in production and sales d. Cost to Produce
Declined in 2016 by 10%. Increased by 12% in 2017 due to increases in raw materials by 8% and manufacturing overhead cost by 103%.
In 2018, it increased again by 12%.
Public Version
23
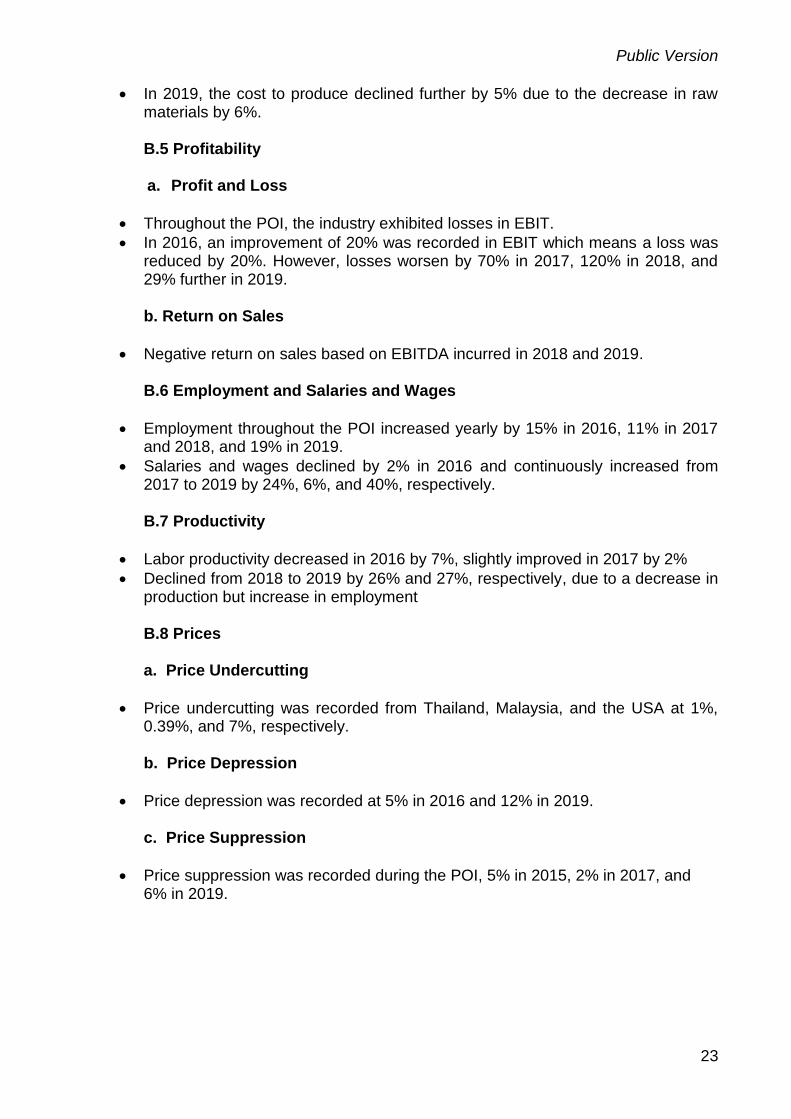
In 2019, the cost to produce declined further by 5% due to the decrease in raw materials by 6%. B.5 Profitability a. Profit and Loss
Throughout the POI, the industry exhibited losses in EBIT.
In 2016, an improvement of 20% was recorded in EBIT which means a loss was reduced by 20%. However, losses worsen by 70% in 2017, 120% in 2018, and 29% further in 2019. b. Return on Sales
Negative return on sales based on EBITDA incurred in 2018 and 2019. B.6 Employment and Salaries and Wages
Employment throughout the POI increased yearly by 15% in 2016, 11% in 2017 and 2018, and 19% in 2019.
Salaries and wages declined by 2% in 2016 and continuously increased from 2017 to 2019 by 24%, 6%, and 40%, respectively. B.7 Productivity
Labor productivity decreased in 2016 by 7%, slightly improved in 2017 by 2%
Declined from 2018 to 2019 by 26% and 27%, respectively, due to a decrease in production but increase in employment B.8 Prices a. Price Undercutting
Price undercutting was recorded from Thailand, Malaysia, and the USA at 1%, 0.39%, and 7%, respectively. b. Price Depression
Price depression was recorded at 5% in 2016 and 12% in 2019. c. Price Suppression
Price suppression was recorded during the POI, 5% in 2015, 2% in 2017, and 6% in 2019.
Public Version
24
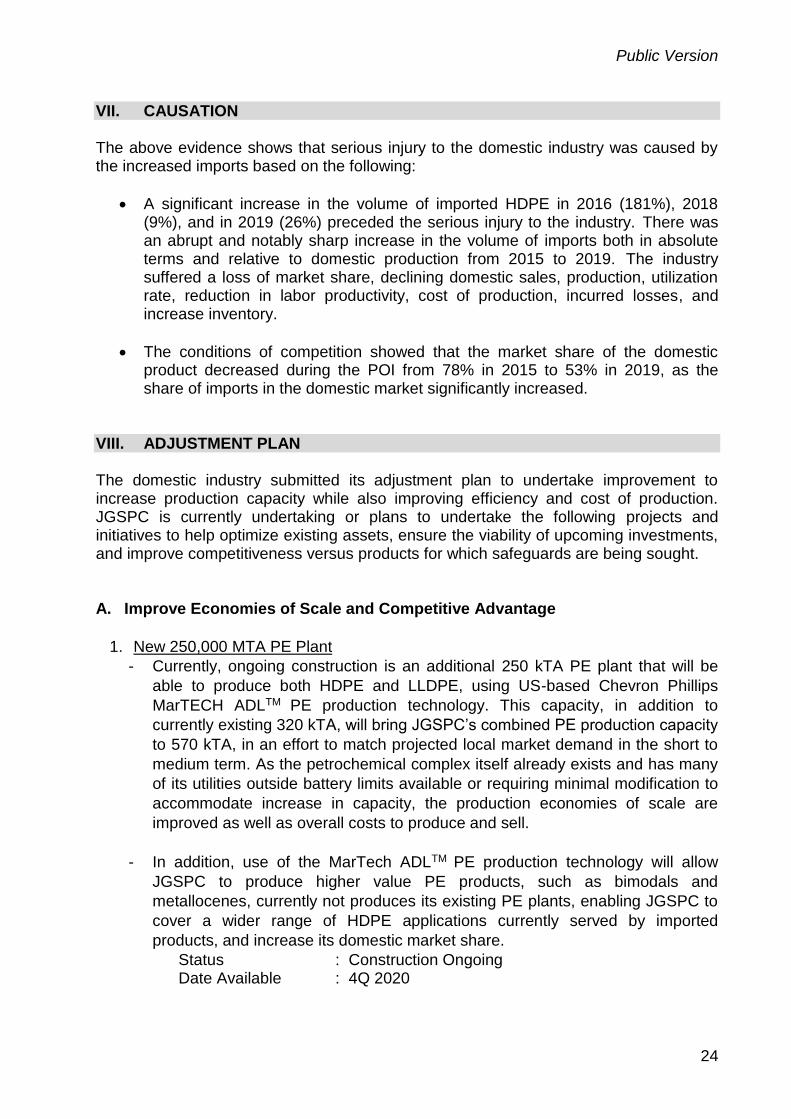
VII. CAUSATION The above evidence shows that serious injury to the domestic industry was caused by the increased imports based on the following:
A significant increase in the volume of imported HDPE in 2016 (181%), 2018 (9%), and in 2019 (26%) preceded the serious injury to the industry. There was an abrupt and notably sharp increase in the volume of imports both in absolute terms and relative to domestic production from 2015 to 2019. The industry suffered a loss of market share, declining domestic sales, production, utilization rate, reduction in labor productivity, cost of production, incurred losses, and increase inventory.
The conditions of competition showed that the market share of the domestic product decreased during the POI from 78% in 2015 to 53% in 2019, as the share of imports in the domestic market significantly increased.
VIII. ADJUSTMENT PLAN The domestic industry submitted its adjustment plan to undertake improvement to increase production capacity while also improving efficiency and cost of production. JGSPC is currently undertaking or plans to undertake the following projects and initiatives to help optimize existing assets, ensure the viability of upcoming investments, and improve competitiveness versus products for which safeguards are being sought. A. Improve Economies of Scale and Competitive Advantage
1. New 250,000 MTA PE Plant
- Currently, ongoing construction is an additional 250 kTA PE plant that will be
able to produce both HDPE and LLDPE, using US-based Chevron Phillips
MarTECH ADLTM PE production technology. This capacity, in addition to
currently existing 320 kTA, will bring JGSPC’s combined PE production capacity
to 570 kTA, in an effort to match projected local market demand in the short to
medium term. As the petrochemical complex itself already exists and has many
of its utilities outside battery limits available or requiring minimal modification to
accommodate increase in capacity, the production economies of scale are
improved as well as overall costs to produce and sell.
- In addition, use of the MarTech ADLTM PE production technology will allow
JGSPC to produce higher value PE products, such as bimodals and
metallocenes, currently not produces its existing PE plants, enabling JGSPC to
cover a wider range of HDPE applications currently served by imported
products, and increase its domestic market share.
Status : Construction Ongoing Date Available : 4Q 2020
Public Version
25
B. Improve on Costs
1. Power – 100 MW Coal-Fired Power Plant
- The petrochemical complex where the HDPE polymer manufacturing plants
are located currently source its power requirements primarily from its diesel
generators and secondarily from the grid. With power costs making up most of
the variable cost, it is imperative to find ways to improve on both reducing the
power costs and reducing power consumption. To this end, JGSPC plans to
put up a 100 MW coal-fired power plant to provide for its own power
requirements, using the latest Circulating Fluidized Bed technology for cost
efficiency and even reduced emissions as opposed to current diesel or bunker-
fired generation.
Status : Under evaluation Date Available : 2023
2. Raw Material Cost – Expansion of Cracker (source of ethylene)
- JGSPC’s cracking facility is currently also undergoing expansion, again in an
effort to improve economies of scale and to help build up capacity to match
projected local market demand in the short to medium term. With the 50%
increase in cracking capacity, larger bulk shipments of the feedstock naptha
and LPG are made possible, which in turn will translate into lower feedstock
costs per MT for the production of ethylene, which is the primary raw material
for HDPE.
Status : Ongoing Commissioning Date Available : 1Q 2020
3. Raw Material Costs – Additives and Catalyst Savings
- With the new PE project, JGSPC invested in a catalyst activator which will
allow JGSPC to activate its catalyst onsite rather than offsite (abroad),
including those catalysts used for its existing plants, thereby helping to reduce
on catalyst activation costs.
Status : Construction Ongoing Date Available : 4Q 2020
- JGSPC also continuously reviews its catalysts and additives portfolio in an
effort to find suitable alternative additives at lower cost, as well as higher
productivity/efficiency alternatives for its catalysts.
Status : Ongoing

Public Version
26
C. Improve Plant Reliability
1. Benchmarking Study on Reliability and Maintenance Performance
- JGSPC is undertaking a maintenance benchmarking study to analyze the
primary factors impacting plant reliability and maintenance effectiveness,
thereby helping identify key inefficiencies, to enable the maintenance team to
focus efforts on specific and measurable improvements and leverage
resources to where most needed.
Status : Ongoing Date Available : 2Q 2020
D. Improve Production Efficiency and Output
1. Purchase of Operator Training Simulator (OTS)
- For the new PE plant, JGSPC has procured an Operator Training Simulator
which is a system of networked computers programmed to mimic the actual
plant processes and associated control systems. The plant model running in the
OTS server is built using the same engineering data that is used in the actual
plant, using graphics that are identical to those used in actual control systems.
With simulated training, trainees can get operational experience in an
environment that closely resembles the actual plan without posing any risk to
the actual plant. Thereby helping minimize incidence of plant upsets caused by
human-related errors.
Status : Ongoing purchase of software Date Available : 2H 2020
2. Advanced Process Control (APC) System
- Advanced Process Control (APC) is a technology that uses computers to
predict the behavior of the plant and manage the changes that continuously
happen in the plant. It attempts to mimic the actions of the most efficient and
knowledgeable human control operator, except it works untiringly 24/7, 365
days in a year.
JGSPC uses APC modules to help improve plant control stability, feed, and production maximization, reduce energy consumption, and reduce variability in product quality
Upgrade for Existing PE Plants:
Status : Completed Date Available : 2020
New APC for New PE Plant:
Status : Data gathering to be initiated once new PE plant is operational
Date Available : Targeting 2024

Public Version
27
IX. THE WORLD TRADE ORGANIZATION AGREEMENT ON SAFEGUARDS Article XIX (Emergency Action on Imports of Particular Products) of the General Agreement on Tariffs and Trade (GATT) 1994 provides that: “If, as a result of unforeseen developments and of the effect of the obligations incurred by a contracting party under this Agreement, including tariff concessions, any product is being imported into the territory of that contracting party in such increased quantities and under such conditions as to cause or threaten serious injury to domestic producers in that territory of like or directly competitive products the contracting party shall be free, in respect of such product, and to the extent and for such time as may be necessary to prevent or remedy such injury, to suspend the obligation in whole or in part or to withdraw or modify the concession.” The WTO Appellate Body in Argentina – Footwear and Korea – Certain Dairy Products established that safeguard measures may be applied only when the prerequisites of Article XIX of GATT 1994 and the conditions of the Agreement on Safeguards (both Multilateral Trade Agreements and as such are integral parts of the WTO Agreement) are clearly demonstrated. The investigation is governed by RA 8800, the Safeguard Measures Act, and the terms and conditions of the Agreement on Safeguards.
IX.a. Unforeseen Development
US and Middle East petrochemical plants are heavily cost-advantaged versus Asian petrochemical plants The US shale gas boom has led to an oversupply of PE, which is primarily intended for export and is expected to flood Asian markets. The US-China trade war has caused the displacement of usual trade flows, giving rise to increased exports into the Philippines MOSCOW (MRC)--Prices of HDPE have started to increase in Russia after slipping over the last nine months in Russia due to excess supply, according to the ICIS-MRC Price Report. Russian HDPE prices began to decrease in October last year mostly because of a significant surge in imports, significantly affecting prices through to June 2020, when levels fell to the lows of 2014. The situation began to change in July amid a significant increase in the cost of polyethylene in foreign markets. Source: Independent commodity Intelligence
Services (i.c.i.s) https://www.icis.com/explore/resources/news/2020/07/16/10530897/russia-hdpe-prices-begin-to-rise-after-long-period-of-falls
That according to plastic pricing information supplier ChemOrbis, which reports that poor demand from buyers in China has spurred a number of global LLDPE sellers to divert their cargoes to other markets in hopes of achieving greater sales, while some traders inside China are offering their existing LLDPE stocks to other global markets in order to pare down their stock levels. One trader also told ChemOrbis he was offering Chinese LLDPE film to buyers in Southeast Asia in hopes of speeding up his sales. Source: https://www.plasticstoday.com/author/PlasticsToday-Staff Jun 03, 2011

Public Version
28
New trade regulations and COVID-19 are having an impact on the supply chain and forcing manufacturing companies to develop new sourcing strategies to avoid disruptions. As a result, many plastics processors are switching to regional supply partners located in North America and Mexico. For regional reshoring to be a win-win business decision, cost and quality of products must be maintained, explained Chroma Color, adding that many plastics processors are “switching to Chroma Color to achieve” both of these goals. Chroma also attributes the switch to its extensive technical capabilities, geographically diverse manufacturing sites, market-specific expertise, and “relentless pursuit” of cost-effective innovative technologies that bring value to its customers. Source: Clare Goldsberry | Jul 16, 2020, plasticstoday.com
IX.b. Notification Requirement Article 12.1 of the WTO Agreement on safeguards states that a Member shall immediately notify the Committee on Safeguards upon:
(a) initiating an investigatory process relating to serious injury or threat thereof and the reasons for it;
IX.c. Articles 11 of the ASEAN Trade in Goods Agreement (ATIGA) Articles 11 of the ATIGA provide provisions on the Notification as follows: “Article 11 - Notification Procedures
1. Unless otherwise provided in this Agreement, Member States shall notify any action or measure that they intend to take:
(a) which may nullify or impair any benefit to the other Member States, directly or indirectly under this Agreement; or
(b) when the action or measure may impede the attainment of any objective of this Agreement.
2. x x x 3. A Member State shall make a notification to Senior Economic Officials Meeting
(SEOM) and the ASEAN Secretariat before effecting such action or measure referred to in paragraph 1 of this Article. Unless otherwise provided in this Agreement, notification shall be made at least sixty (60) days before such an action or measure is to take effect. A Member State proposing to apply an action or measure shall provide adequate opportunity for prior discussion with those Member States having an interest in the action or measure concerned.”
Public Version
29
X. RECOMMENDATIONS Based on the above findings, there are indications that increased imports of HDPE pellets and granules are the substantial cause of serious injury to the domestic industry in terms of declining domestic sales, production, utilization rate, reduction in labor productivity, incurred losses, suppression, depression and increase inventory. Wherefore, premises considered, the Department, finds prima facie evidence to initiate and conduct a preliminary safeguard investigation to determine whether HDPE pellets and granules are being imported into the Philippines in increased quantities and is causing serious injury to the domestic industry. Let the notice of initiation of a preliminary safeguards investigation be published in two (2) newspapers of general circulation and individual notices be sent to all interested parties including the country members concerned. SO ORDERED. 28 August 2020

Public Version
30
LIST OF IMPORTERS OF 3901
I. IMPORTERS OF PETROCHEMICALS
IMPORTER IMPORTER
1. A L A COMMODITY ENTERPRISES 37. DOUBLE INFINITY WORLD TRADE INC
2. ABUNDANCEYIELD TRADING CORPORATION
38. DRAGONLUCK ENTERPRISES CO
3. ALCOS GLOBAL CORPORATION 39. DUNHILL PLASTIC INDUSTRIES INC.
4. ALPHATECH DEVELOPMENT CORPORATION
40. EASTERN INTERNATIONAL PLASTIC PACKAGING
5. APOLLO BAG INDUSTRIAL CORPORATION
41. EDNARRO TRADING
6. ARC REFRESHMENTS CORPORATION 42. ELTA INDUSTRIES INCORPORATED
7. ARROW PLASTIC INDUSTRIES CORP. 43. ESSEL PROPACK PHILIPPINES INC.
8. ARTPACK PHILIPPINES INC. 44. EURO-MED LABORATORIES PHILS. INC.
9. ASHLAR INDUSTRIAL CORPORATION 45. EVERBRIGHT NET & TWINE MFG. CORP.
10. ASIA BREWERY INCORPORATED 46. EVERGOOD PLASTIC INDUSTRY INC.
11. ASIAN PLASTIC CENTER 47. FILPET INC.
12. ASTROBAG MANUFACTURING CORP. 48. FLEXIBLE PACKAGING PRODUCTS CORP.
13. AXIANTA TRADING CO. LTD. 49. FLEXO MANUFACTURING CORPORATION
14. BASIC PACKAGING CORPORATION 50. FORTUNE INTERNATIONAL TRADING CORP.
15. BEST AVANTRADE INC 51. GILVAN PACKAGING CORPORATION
16. BESTANK MANUFACTURING CORPORATION
52. GLOBAL COMPAK INC.
17. BRIGHT GOAL TRADING 53. GLOWING LINE TRADING
18. C.B. ANDREW ASIA INC 54. GOLDENFORTUNE ENTERPRISES CO
19. CALYPSO PLASTIC CENTER CO. 55 GOLDSTAR POLYMER TRADING CORP.
20. CANGCO DOTINGCO ENTERPRISES 56. GOODYEAR STEEL PIPE CORPORATION
21. CEBU SENTRA PLASTICS CORP. 57. GRAND ARRAIER TRADING
22. CEBU SHERILIN TRADING CORPORATION
58. GREIF PHILIPPINES INC.
23. CEED FORMING CORPORATION 59. GT INDUSTRIAL DEVELOPMENT INC
24. CENTREUM CORPORATION 60. HANTEX INTERNATIONAL CORP.
25. CHEMPLAS COMMERCIAL TRADING INC
61. HANTEX TRADING CO. INC
26. CITIPLAS PLASTIC SERVICING CENTER
62. HYDRO PHIL. ASIA INC.
27. CLOSURE SYSTEMS INTERNATIONAL 63. INCON INDUSTRIAL CORPORATION
28. COEX INC. 64. INNOVAPLAS PACKAGING CORPORATION
29. COFTA MOULDINGS CORPORATION 65. INTEGRATED LOGISTICS PHILS INC
30. CONSOLIDATED COPOLYPACK CORPORATION
66. INTEGRATED PACKAGING CORPORATION
31. CORNERSTONE INTERNATIONAL PHILS.
67. INTERNATIONAL SYNTHETIC INDS. INC.
32. CROWN ASIA CHEMICALS CORP. 68. ISLAND PLASTIC MFG CO INC.
33. CYBERMANN INDUSTRIAL CORPORATION
69. JFILM PHILIPPINES INC.
34. CYBERMATE INDUSTRIAL CORPORATION
70. JGKS UNIVERSAL PLASTIC CORPORATION
35. CYGNUS INDUSTRIES INC. 71. JHAYCOR INDUSTRIES INC.
36. D & L POLYMER AND COLOURS INC. 72. JHAYMARTS INDUSTRIES INC
Annex A

Public Version
31
73. JOSEFINO TRADING 108. POLYGOLD MANUFACTURING CORPORATION
74. JUNNI INDUSTRIES INC. 109. POLYLINE INDUSTRIES INC.
75. KILOTRADE MARKETING 110. POSITIVE FAXFAIR TRADING
76. KRAH PIPES MANILA INC 111. PREMIER CREATIVE PACKAGING INC.
77. LEWISTON CONCEPT INDUSTRIAL 112. PRIMA PLASTIC MANUFACTURING CORP.
78. LICHT INDUSTRIAL CORPORATION 113. PROSPERITYLINK MARKETING CO
79. LICTON INDUSTRIAL CORP. 114. RIM 21 CORP
80. LIQUID PACKAGING CORPORATION 115. ROBTON INDUSTRIES INC.
81. LONDON INDUSTRIAL PRODUCTS INC. 116. RPMC PLASTICS PHILS. INC.
82. LUCKY SAPPHIRE TRADING 117. SAN MIGUEL YAMAMURA PACKAGING
83. MACONDRAY PLASTICS PRODUCTS INC
118. SENCAR INDUSTRIAL CORPORATION
84. MANLY PLASTICS INC. 119. SHRINKPACK PHILS. CORP.
85. MHYLINK TRADING 120. SILVERMANE MARKETING VENTURES CORP
86. MICHEM MARKETING INC. 121. SOLIDPOINT MARKETING
87. MIESTO INTERNATIONAL FOODS CORP.
123. SPECTRUM HIGHLANDS MKTG CORP
88. MILLS & MOTT INTERNATIONAL TRADING
124. STYROTECH CORPORATION
89. MOLDEX PRODUCTS INC 125. SYNERGY SALES INTERNATIONAL CORP
90. MULTIFLEX RNC PHILS. INC. 126. SYNTHETIC WORLD CORPORATION
91. NETTEX MFG. & EXPORT CORP. 127. TAT RECYCLABLES AND RENEWABLES CORP
92. NIKKOPLAS INC. 128. TENKEI PRIME INTL CORP.
93. OMEGA-VENTURES WL TRADING CORP.
129. TOP MOST PACKAGING CORPORATON
94. OUTBACK FIVE STAR CLARK PHILS INC
130. TRADESPHERE INDUSTRIAL COMMODITIES
95. PACIFIC TWINE AND NET MFG CO INC 131. TRANS WORLD TRADING CO.INC.
96. PAKVITE MFG. CORP. 132. UNIBAG MANUFACTURING CORPORATION
97. PARAGONPLATINUM INTERNATIONAL 133. UNITED POLYRESINS INC.
98. PHELPS DODGE PHILIPPINES ENERGY PRO
134. UNITY SYNTHETIC CORPORATION
99. PHIL VALVE MFG CO 135. UNIVERSAL ROBINA CORPORATION
100. PHILIPPINE FISHING GEAR INDUSTRIES INC.
136. URIGHT RESOURCES CORPORATION
101. PHILIPPINE GLASS PROCESSING SPECIALIST INC
137. VITAL MANUFACTURING CO. INC.
102. PHILIPPINE SPRING WATER RESOURCES INC
138. WOODSTRALL AND SONS INCORPORATED
103. PHILIPS WIRE AND CABLE CO 139. WPC DESU TENSO TRADING
104. PHILPLASTIC AND POLYMERS INC. 140. ZELLER PLASTIK PHILIPPINES INC.
105. PLASTIC CONTAINER PACKAGING CORPORA
141. ZEST-O CORPORATION
106. PLASTIMER INDUSTRIAL CORPORATION
142. ZHONG FU PACKAGING INC.
107. PLASTMANN INDUSTRIAL CORPORATION
143. ZHONG FU UNIMAGNA PHILS. INC.
Public Version
32
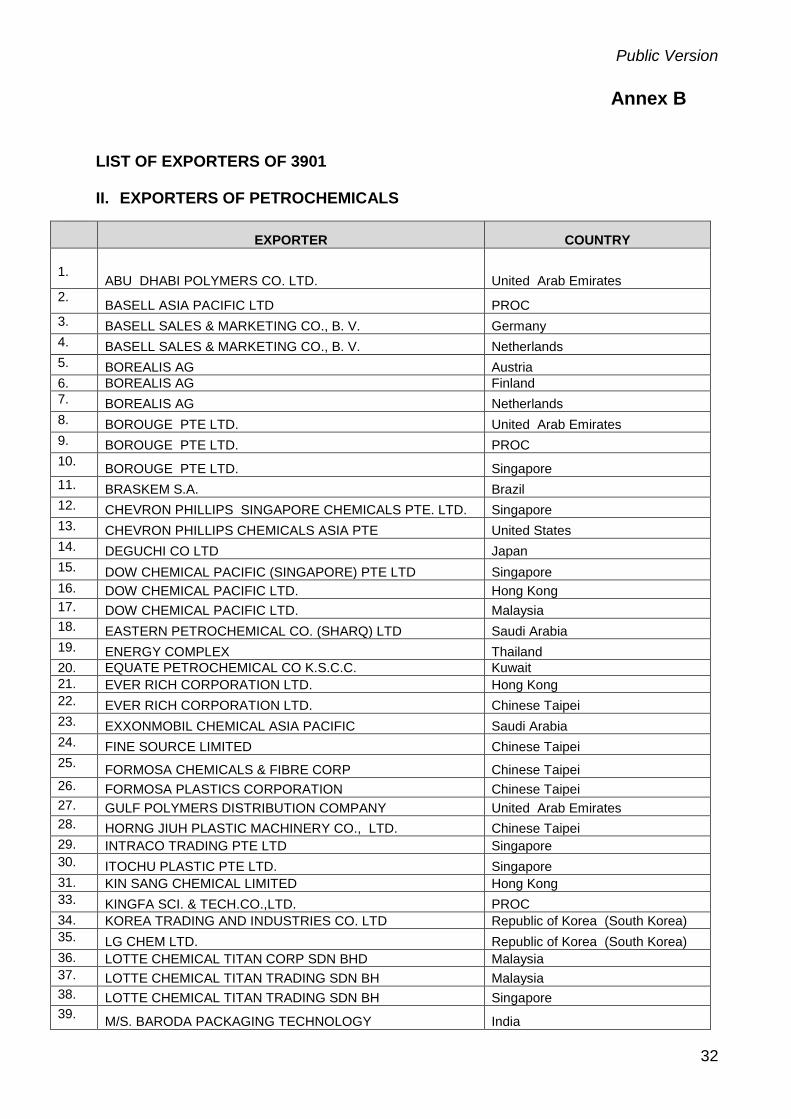
LIST OF EXPORTERS OF 3901
II. EXPORTERS OF PETROCHEMICALS
EXPORTER COUNTRY
1.
ABU DHABI POLYMERS CO. LTD. United Arab Emirates
2. BASELL ASIA PACIFIC LTD PROC
3. BASELL SALES & MARKETING CO., B. V. Germany
4. BASELL SALES & MARKETING CO., B. V. Netherlands
5. BOREALIS AG Austria
6. BOREALIS AG Finland
7. BOREALIS AG Netherlands
8. BOROUGE PTE LTD. United Arab Emirates
9. BOROUGE PTE LTD. PROC
10. BOROUGE PTE LTD. Singapore
11. BRASKEM S.A. Brazil
12. CHEVRON PHILLIPS SINGAPORE CHEMICALS PTE. LTD. Singapore
13. CHEVRON PHILLIPS CHEMICALS ASIA PTE United States
14. DEGUCHI CO LTD Japan
15. DOW CHEMICAL PACIFIC (SINGAPORE) PTE LTD Singapore
16. DOW CHEMICAL PACIFIC LTD. Hong Kong
17. DOW CHEMICAL PACIFIC LTD. Malaysia
18. EASTERN PETROCHEMICAL CO. (SHARQ) LTD Saudi Arabia
19. ENERGY COMPLEX Thailand
20. EQUATE PETROCHEMICAL CO K.S.C.C. Kuwait
21. EVER RICH CORPORATION LTD. Hong Kong
22. EVER RICH CORPORATION LTD. Chinese Taipei
23. EXXONMOBIL CHEMICAL ASIA PACIFIC Saudi Arabia
24. FINE SOURCE LIMITED Chinese Taipei
25. FORMOSA CHEMICALS & FIBRE CORP Chinese Taipei
26. FORMOSA PLASTICS CORPORATION Chinese Taipei
27. GULF POLYMERS DISTRIBUTION COMPANY United Arab Emirates
28. HORNG JIUH PLASTIC MACHINERY CO., LTD. Chinese Taipei
29. INTRACO TRADING PTE LTD Singapore
30. ITOCHU PLASTIC PTE LTD. Singapore
31. KIN SANG CHEMICAL LIMITED Hong Kong
33. KINGFA SCI. & TECH.CO.,LTD. PROC
34. KOREA TRADING AND INDUSTRIES CO. LTD Republic of Korea (South Korea)
35. LG CHEM LTD. Republic of Korea (South Korea)
36. LOTTE CHEMICAL TITAN CORP SDN BHD Malaysia
37. LOTTE CHEMICAL TITAN TRADING SDN BH Malaysia
38. LOTTE CHEMICAL TITAN TRADING SDN BH Singapore
39. M/S. BARODA PACKAGING TECHNOLOGY India
Annex B

Public Version
33
40. MITSUI & CO (ASIA PACIFIC) PTE LTD Japan
41. MTS LOGISTICS, INC. United States
42. OPEC PLASTICS JOINT STOCK CO. Viet Nam
43. P T LOTTE CHEMICAL TITAN NUSANTARA Indonesia
44. PACKAGING ENTERPRISE LLC United States
45. PETRONAS CHEMICAL MARKETING Malaysia
46. PLASTRADE MATERIALS TECHNOLOGY Malaysia
47. PMS CO., LTD. Chinese Taipei
48. POLYMER LINK SDN BHD Malaysia
49. PT. CHANDRA ASRI PETROCHEMICAL TBK. Indonesia
50. PTT POLYMER MARKETING CO. LTD. Thailand
51. QATAR CHEMICAL & PETROCHEMICAL MARKETING AND DISTRIBUTION COMPANY Qatar
52. RABIGH REFINING & PETROCHEMICAL CO. Saudi Arabia
53. RAVAGO DISTRIBUTION CENTER NV Belgium
54. SABIC ASIA PACIFIC PTE LTD. Singapore
55. SASOL CHEMICALS PACIFIC LTD. Singapore
56. SAUDI ARAMCO PRODUCTS TRADING CO. United Arab Emirates
57. SAUDI ETHYLENE & POLYEHTYLENE CO. Saudi Arabia
58. SAUDI PLASTIC MARKETING EST Saudi Arabia
59. SCG PLASTIC CO., LTD. Thailand
60. SIAM POLYETHYLENE CO., LTD. Thailand
61. SUMITOMO CHEMICAL ASIA PTE LTD. Singapore
62. THE DOW CHEMICAL COMPANY United States
63. THE EGYPTIAN ETHYLENE & DERIVATIVES CO Egypt
64. TOYOTA TSUSHO CORPORATION Republic of Korea (South Korea)
65. TRACIMEXCO SUPPLY CHAINS AND AGENCY SERVICES JSC Viet Nam
66. UNIT CARGO CONTAINER LINE, INC. United States
67. VINMAR OVERSEAS LTD. United States
68. XIAMEN ZHONGDAO IMPORT AND EXPORT CO LTD PROC
69. YUYAO ZHONGYU ECONOMIC AND TRADE CO LTD PROC