Application Of Modified Porters’ Five Forces Model In ...
66
1 APPLICATION OF MODIFIED PORTERS’ FIVE FORCES MODEL IN ASSESSING ATTRACTIVENESS OF INSURANCE INDUSTRY IN KENYA SHARIFF NHAAMAN O.ABUOR. A RESEARCH PROJECT SUBMITTED IN PARTIAL FULFILLMENT FOR THE REQUIREMENT OF THE DEGREE OF MASTERS OF BUSINESS ADMINSTRATION (MBA) , SCHOOL OF BUSINESS,UNIVERSITY OF NAIROBI NOVEMBER, 2014
Transcript of Application Of Modified Porters’ Five Forces Model In ...
1
APPLICATION OF MODIFIED PORTERS’ FIVE FORCES
MODEL IN ASSESSING ATTRACTIVENESS OF INSURANCE
INDUSTRY IN KENYA
SHARIFF NHAAMAN O.ABUOR.
A RESEARCH PROJECT SUBMITTED IN PARTIAL
FULFILLMENT FOR THE REQUIREMENT OF THE DEGREE
OF MASTERS OF BUSINESS ADMINSTRATION (MBA) ,
SCHOOL OF BUSINESS,UNIVERSITY OF NAIROBI
NOVEMBER, 2014
2
DECLARATION
This is to declare that this research project is my original work and has not been
submitted for a degree course in this or any other University or Institution of higher
learning for examination.
Signed ……………………………… Date……………..…………
SHARIFF NHAAMAN O. ABUOR
REG. No.D61/68125/2011
This Management Research Project has been submitted for examination with my
approval as the University supervisor.
Signed …………………………... Date …………………………..
DR. JACKSON MAALU
SUPERVISOR, SCHOOL OF BUSINESS
UNIVERSITY OF NAIROBI.

3
ACKNOWLEDGEMENTS
I give all to God for guidance. Sincere gratitude to Dr. J. Maalu; my supervisor for
constantly advising and perfecting my project and Mr.S.Odongo, who spared his busy
schedule to guide and moderate the project. Without you precious people, i would
have not made it.
I would also like to acknowledge great support from MBA classmates, friends and
relatives. Madam RoselyneSamo who tirelessly typed this piece. Her devotion and
dedication throughout the project work was incredible.
Deepest appreciation to my wife Millicent, daughters; Shehnaz, Vennezar, Zainab and
Aisha-Tabby. Your understanding and support was abundant, i adore you. To all the
people not mentioned here, take pride.
May God bless the work of your hands, God bless you All
ALHAMDULILLAH
4
DEDICATION
To my parents and heroes, the late father and mother (Abuor Jakoguta &Tabitha
Nyakadiang‟a) you instilled sense of love, endurance and hard work. Your memory is
forever engraved in my heart. My beloved wife Milly,, daughters; Sheh, Veh, Zah
and Aisha-Tabby. You literally endured life without a father when I used to burn the
mid night oil studying. To my brother, late Wilson, sister late Dorine and brother-in-
law Salim Musa: you financially facilitated my early education. Take pride.
5
ABSTRACT
The insurance industry in Kenya has undergone a lot of changes in the recent past.
Many companies have closed shops while others have cropped up on equal measure.
There has not been a clear predictable trend on suitability of insurance industry in
Kenya. The purpose of this study was to apply the modified porters five forces model
in assessing attractiveness of insurance industry in Kenya. This was to shed light on
an industry which has witnessed death of as many companies as birth of others.
Porter‟s five forces model has been used world over to understand the competitive
forces in an industry. In specific terms, the study sought to determine how
attractiveness of insurance industry in Kenya is influenced by bargaining power of
suppliers & buyers, threat of new entrants, threat of substitute products or services,
competitive rivalry in the industry, politics, government and others. A descriptive
survey design was undertaken based on self-competition questionnaires. Data was
collected from 33 respondents out of the targeted population of 47 insurance
companies registered in Kenya. Completed questionnaires were collected and results
analyzed using descriptive statistics. Tables, mean score and standard deviation were
used for presentation and analysis. The findings of this research revealed that
Politics/Government was a minimal force with a mean of 3.44, Industry rivalry 3.59,
Barrier to entry 3.63, Threat of substitutes 3.68, bargaining power of suppliers 3.88,
and finally bargaining power of buyers 3.98. The research further identified the
Presence of Substitute Suppliers Scored a mean of 4.24, Supplier concentration 3.73,
impact of supplier on cost 3.97, supplier difference 3.48 and Importance of Volume of
business to the suppliers mean of 3.97. The study concluded that the insurance
industry in Kenya is growing and looks vibrant as perceived externally.
6
TABLE OF CONTENTS
DECLARATION………………………….………………....................ii
ACKNOWLEDDGEMENTS…………………………………………..iii
DEDICATION……..………….….……………………...……………...iv
ABSTRACT………………………….…………….……………………v
LIST OFTABLES……………………………………………...………viii
CHAPTER ONE: INTRODUCTION ..................................................................................... 1
1.1Background of the Study ...................................................................................................... 1
1.1.1 Industry Attractiveness ..................................................................................................... 2
1.1.3 Insurance Industry in Kenya ............................................................................................. 3
1.2 Research Problem ................................................................................................................ 4
1.3 Research Objective .............................................................................................................. 6
1.4 Value of the Study ............................................................................................................... 6
CHAPTER TWO: LITERATURE REVIEW .......................................................................... 15
2.1 Introduction ........................................................................................................................ 15
2.2. Theoretical Review..................................................................................................7
2.2.1 Competitive Theory………...…………………...……………………………….7
2.2.2 Industry Theory……………………………………………………………….…7
2.3 Porter‟s five forces Model……………………………...………………………….8
2.3.1 Threat of Substitute Products or Services ....................................................................... 16
2.3.2 Threat of New Entrant ...................................................................................................... 8
2.3.3 Rivarly among existing firms.......................................................................................... 10
2.3.4 Bargaining powers of suppliers ...................................................................................... 10
2.3.5 Bargaining power of buyers ............................................................................................ 19
2.4 Modified Porter's Framework…..…..…………………………………………….12
2.5 Empirical literature on industry analysis 21
2.6 Summary of the Literature……………………………………………………..14
CHAPTER THREE: RESEARCH METHODOLOGY .......................................................... 23
3.1 Introduction ........................................................................................................................ 23
3.2 Research Design................................................................................................................. 23
3.3 Population of study ............................................................................................................ 23
3.4 Data Collection .................................................................................................................. 23
3.5 Data Analysis ..................................................................................................................... 24
7
CHAPTER FOUR: DATA ANALYSIS, RESULTS AND DISCUSSIONS ……….17
4.1 Introduction ……………………………………………………………….....17
4.2 The Response Rate…………………………………………………………...17
4.3 Organisational Information………………………………………..………....17
4.3.1 Ownership Structure……………………………………………………….....18
4.3.2 Products or Service Offered ……………………………….……………...…18
4.3.3 Organisation's years in operation…………....…………………………….....19
4.4 Attractiveness of the Insurance Industry ……………………..…………......20
4.4.1 Supplier Bargaining Power ……………………………………………….....20
4.4.2 Bargaining Power of Customer/Buyers ………………………………….......22
4.4.3 Threats of New Entrants/Barrier to Entry ……………………….…….........24
4.4.4 Threat of Substitutes ……………………………………………………...…28
4.4.5 Degree of Rivalry Among Existing Firms ……………………………..........29
4.4.6 Politics/Government/Power of Other Stakeholders ……………………........32
CHAPTER FIVE: SUMMARY, CONCLUSIONS AND
RECOMMENDATIONS ........................................................................36
5.1 Introduction …………….…………………………………………..………..36
5.2 Summary ……………………………………………………….……………36
5.3 Conclusion …………………………………………………………….…….39
5.4 Limitations of the study…………..……………………………….………….39
5.5 Recommendation …………………………….………………….…………...40
5.6 Suggestion for Policy and Practices………………………………………….40
5.7 Suggestion for Further Studies……………………………………………….40
REFERENCE ………………………………………………..…………41
APPENDIX…………………………………………………….……….44
8
LIST OF TABLES
Table 4.I Ownership Structure……………………………………………...18
Table 4.2 Product of Services offered 19
Table 43 Organisation‟s years in operation 19
Table 4.4 Existence of Bargaining Power of Suppliers 20
Table 4.5 Determinants of Supplier Bargaining Power 21
Table 4. 6: Aspects of suppliers Power 22
Table 4.7: Determinant of Buyer/Customer Bargaining Power 23
Table 4. 8: Aspects of Bargaining power of customer/buyer 24
Table 4.9 Existence of Barriers to Entry 25
Table 4.10: Entry Barriers 25
Table 4.11: Extent to Which New Operators Affect Existing 26
Table 4.12 Extent to which new Entrants are a threat to Companies‟ profit 27
Table 4.13:Factors Driving New Companies to enter Insurance Industry 28
Table 4.14:Threat of Substitutes Effect on Insurance Companies‟ Prof 29
Table 4.15:Determinants of Threat of Substitutes 30
Table 4.16:Extent of the Effect of Substitutes on Insurance Companies‟ 31
Table 4.17 Determinants of Rivalry 32
Table 4.18:Intensity of Competition in the Insurance Industry 33
Table 4.19:Extent of the Effect of Competition on Companies‟ Profit 34
Table 4.20: Effects of Politics of the Day 35
Table 4.21:Whether Government has impact on Insurance 35
Table 4.22:Nature of Impact of Government/ Politics on Insurance 36
Table 4.23:Membership to Trade Union 36
Table 4.24:Extent of Effects of Politics/Government/Other Stakeholder 36
Table 4.25:Strengths of the six forces of the modified Porters‟ 37
9
CHAPTER ONE: INTRODUCTION
1.1 Background of the Study
Industry attractiveness is the value generated by economic activity of the industry
participants as well as the ability to share in the wealth created thereof called Profit,
(Hax & Maljuf 1983). The business world is encountering an unprecedented speed of
change, radical technologies and massive entry of new competitors. The key concern
of organizations is to continue existing over time at a profit. For this to be achieved,
organizations have to constantly adjust to their environment. In such a rapidly
changing environment, the only competitive advantage is the ability to continuously
create new sources of competitive advantage. It is imperative that organizations
continuously adopt their activities in order to ensure survival (Porter 1980, Pearce &
Robinson 1997, Hamel & Prahalad, 1999). Organizations develop & implement
competitive strategies to succeed. Competitive strategy specifies the distinctive
approach which the firm intends to use in order to succeed in each strategic business
areas. Competitive strategy gives a company an advantage over its rivals in attracting
customers and defending against competitive forces (Ansoff 1985).
Every Industry has unique structures and the greater the threat posed by an industry
force, the lesser attractive the industry becomes. Clear understanding of what forces
are on play enables business owners to formulate and implement corresponding
strategies to deal with them and consequently develop unique ways to satisfy
customers in order to obtain competitive advantage over industry rivals. Cook (1995)
notes that in any particular industry, not all the five forces will be equally
important. The five forces frame work do not eliminate the need for creativity in
finding new methods of dealing with competition within the industry but helps
managers to focus on aspects of industry structure that brings long term profitability.
Increased competition is one of the challenges presented by a dynamic environment.
The theory of competition in economics is heavily focused on price competition. A
company can gain a competitive advantage through charging lower prices than its
rivals (Murphy 2005). This is a complex phenomenon which determines whether a
firm‟s activities are appropriate and how much it contributes to profit.
10
Porters famous five forces of competitive positioning model provides a simple but
powerful perspective tool for assessing and analyzing the competitive strength and
position of a business, organization or corporation in a given industry (Porter,
1980).Firms wishing to gain a competitive edge should consider building defenses
against these forces and formulate specific courses of competitive action that can
directly influence these forces (Grundy, 2006; Grant and Jordan (2012).
1.1.1 Assessment Of Industry Attractiveness
An industry is a group of firms that market products which are close substitute for
each other (Grant 2012). For a firm to succeed in business, it is necessary to evaluate
the attractiveness of various industries in terms of their potential to generate suitable
profit. Industry attractiveness is the relative future profit potential of a market which
can be established by industry analysis. According to Hax & Majluf (1996), Industry
analysis is an orderly process that attempts to capture those structural factors that
define the long term profitability prospects of an Industry, and to identify and
characterize the behavior of the most significant competitors. Pearce and Robinson
(2005) say that industry analysis is the basis of intelligent planning. It is a systematic
process of gathering and analyzing information about an industry on a domestic and
global scope.
According to Porter (1980) a company can out-perform rivals only if it can establish a
difference that it can preserve. This is done by creating a unique and valuable
position involving a different set of activities and making trade-offs in competitive
environment. Porters (1980) notes that a firm can change the industry‟s structure
through the adopted strategies and that if the firm can shape the industry structure, it
can fundamentally change the industry attractiveness either negatively or positively.
The reasons why some companies make more profit than others lie in understanding
of competitive structure and strategic plans. Strategy is the way by which a firm
achieves its mission and attains its objectives. According to Drucker (1961), strategy
is the pattern of major objectives, purpose or goals and essential policies or plans for
achieving these goals; stated in such a way that it defines what business the company
is in or to be in and the kind of company it is or is to be. According to Barney (1997),
strategy is a pattern of resource allocation that enables firms to maintain or improve
11
their performance. The essence of strategy lies in creating favorable asymmetries
between a firm and its rivals. A good strategy neutralizes threats, exploits
opportunities, capitalizes on strengths and fixes weakness (Barney 1993).
Management of a firm needs to understand the industry‟s key success factors and
formulate its strategy around it to enable the firm to create sustainable competitive
advantage. Key success factors are Competitive advantage like benefits derived when
an organization acquires or develops an attribute or combination of attributes that
allows it to outperform its competitors. According to Porter(1980) competitive
strategy involves finding a position in the industry where the company can best
defend itself against competitive forces or influence them in its favour.
1.1.3 Insurance Industry in Kenya
The insurance industry in Kenya has realized rapid growth over the recent past. To
date there are forty seven insurance companies operating in the country (AKI, 2012).
At this rate of growth without a corresponding growth in the economy, the industry is
faced with stiff competition.
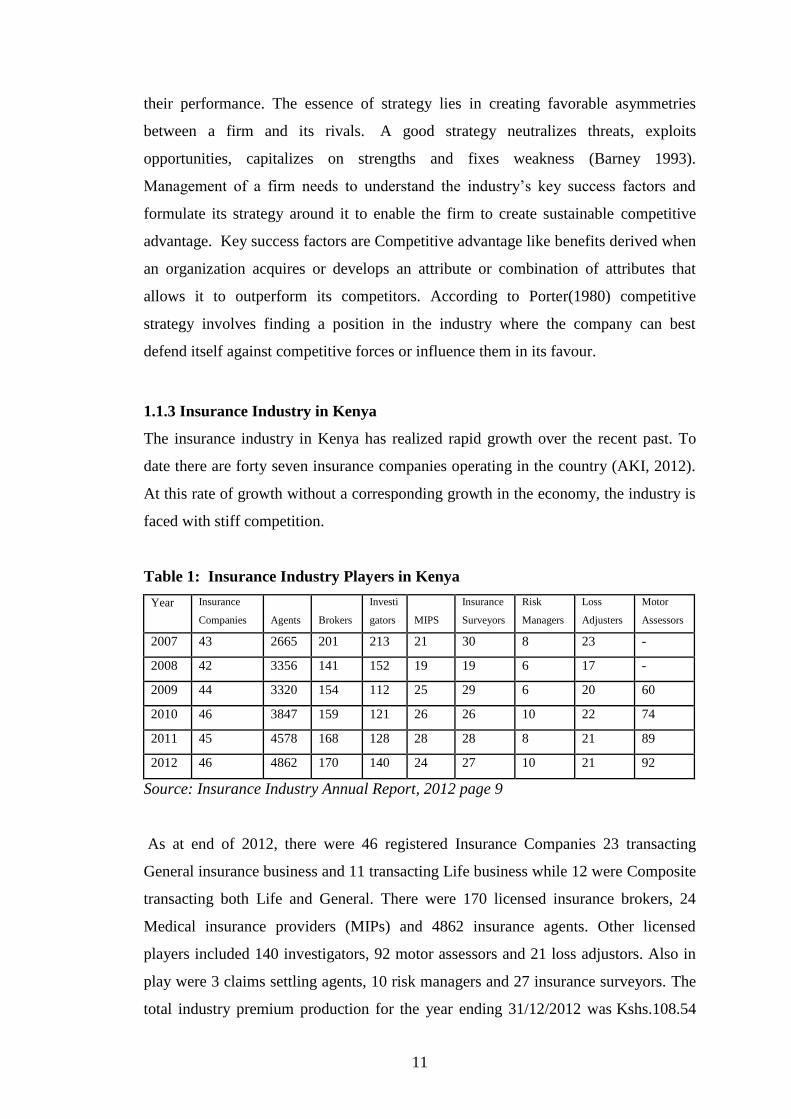
Table 1: Insurance Industry Players in Kenya
Year Insurance
Companies
Agents
Brokers
Investi
gators
MIPS
Insurance
Surveyors
Risk
Managers
Loss
Adjusters
Motor
Assessors
2007 43 2665 201 213 21 30 8 23 -
2008 42 3356 141 152 19 19 6 17 -
2009 44 3320 154 112 25 29 6 20 60
2010 46 3847 159 121 26 26 10 22 74
2011 45 4578 168 128 28 28 8 21 89
2012 46 4862 170 140 24 27 10 21 92
Source: Insurance Industry Annual Report, 2012 page 9
As at end of 2012, there were 46 registered Insurance Companies 23 transacting
General insurance business and 11 transacting Life business while 12 were Composite
transacting both Life and General. There were 170 licensed insurance brokers, 24
Medical insurance providers (MIPs) and 4862 insurance agents. Other licensed
players included 140 investigators, 92 motor assessors and 21 loss adjustors. Also in
play were 3 claims settling agents, 10 risk managers and 27 insurance surveyors. The
total industry premium production for the year ending 31/12/2012 was Kshs.108.54
12
billion which was composed of Life Kshs.37.08 billion (34.16%) and Non-life
Kshs.71.46 billion (65.84%). Production in 2015 is projected to be Kshs.200 billion
(AKI 2012). The penetration of insurance in Kenya is estimated at 3.16%. Initiatives
such as improved regulatory framework, innovative products, adoption of alternative
distribution channels, enhanced public education and use of technology have
contributed to the improved penetration level in Kenya.
The Kenyan Insurance Industry is the leader in East Africa (Uganda, Tanzania, DRC
Congo, Rwanda) and COMESA region (Common Market for East and Southern
Africa) employing over 10,000 people. Total Annual premium in 2012 was 108.54
Billion with net claims paid being over Kshs.48.36 Billion (AKI 2012). On the top ten
by premium production (not in any order) are Jubilee, Kenindia, Heritage, APA,
ICEALION, CIC, UAP, AIG, British America and Pan Africa. They command over
50% of the market share. Insurance Industry in Kenya is regulated by the Insurance
Act Cap 487 as amended. In 2007, sections of the Act were amended which allowed
conversion of the former Office of Commissioner of Insurance under the ministry of
finance into an autonomous authority called Insurance Regulatory Authority (IRA). It
is mandated to provide general control and guidance i.e. licensing, registration,
supervision, consumer education/protection and so on.
1.2 Research Problem
Porter‟s modified “Five Forces” model is a widely used managerial tool for analyzing
potential industry margins and for classifying features which affect the competitive
environment. According to Porter (2002) Industry structures are determined by the
interplay of five forces thus; bargaining power of buyers, bargaining power of
suppliers, threat of new entrants, threat of substitute products, and intensity of
industry rivalry. Other scholars like Aosa (1997) added other forces like government,
logistics and power play. All competitive forces and their interactions are governed by
a regulatory framework that sets the „rules of the game‟ for all participants.An
industry‟s economic traits and competitive conditions and how they are expected to
change determine whether its future prospects will be poor, average, or excellent.
Industry and competitive conditions differ so much that leading companies in
unattractive industries can find it hard to earn respectable profits while weak
13
companies in attractive industries can report good performances (Porter, 1980;
Thompson and Strickland, 2003; Pearce and Robinson, 2005).
Insurance Industry in Kenya is one of the most volatile industries undergoing drastic
changes. The industry has witnessed the collapse of giant firms e.g. Kenya National
Assurance co. Ltd in 1990, Lakester, United and Blue shield among others. Over the
last 15 years, eight (8) new insurance firms have entered the industry. The rapid
collapse of existing firms and equally rapid entry of new ones sends mixed signals
about this industry. For some companies, the industry looks attractive while for others
it is bleak. In Kenya, only 8 out of the current registered 47 insurance firms
underwrite Public Service Vehicles (PSV) and out of the 6 collapsed companies 4
were underwriting PSVs ( AKI 2012). The legislation; the Insurance Act cap 487 vide
legal notice No.58 is a major barrier to entry as it stipulates that Kshs. 500M must be
deposited with the government before being licensed to carry on general and Kshs.
300M for life insurance respectively. The public perception of the industry is negative
as they always perceive insurance firms as organizations which hide under small
prints to avoid settlement of claims. Unscrupulous lawyers and fraudulent public see
the industry as cash cow while employees especially managers in public service
vehicles (PSV) underwriters view the industry as very unattractive.
.
Past studies on application of Porters five forces model have limited the scope to the
missionary five forces only without consideration to modifications. Further, no studies
have been done specifically on insurance industry in Kenya. Aosa (1997) included
three other additional forces thus government, logistics, and power play only. His
work was neither in the insurance industry nor exhaustive in terms of the modifying
factors. Muchiri (2008) studied porter‟s five forces application to assess attractiveness
of the mailing industry in Kenya while Langat (2009) anchored her studies on how the
forces shape competition in handcraft industry in Kenya. Nyale (2007) researched on
mobile telephone and Olouch (2003) applied the concept while studying the perceived
attractiveness in freight and forwarding industry Muhu (2008) researched on
perception of attractiveness of public service vehicles (PSV) insurance business in
Kenya. Kiandiko (2007) narrowed down to one of the five forces; the Entry Barrier
and studies its extent to profitability in the air pressure Industry in Kenya. All the
other known studies were therefore different in context and time. This leaves a
14
remarkable knowledge gap in terms of context and time which this research will
satisfy. This study will try to assess how attractive Insurance industry in Kenya is
using the Porters modified five forces
1.3 Research Objective
The objective of the study is to apply the Modified Porter‟s Forces Model to assess
the attractiveness of insurance industry in Kenya
1.4 Value of the Study
The study will help the current insurance companies in Kenya and those companies or
individual aspiring to invest in the insurance market to assess potentiality of the
industry
For scholars, the study will not only increase the level of literature available in
understanding how attractive Insurance Industry in Kenya is but also help in critically
analyzing and appreciating porter‟s forces model and its applicability in Kenya‟s
insurance industry.
It will also help the statutory authorities (Insurance Regulatory Authority – IRA) and
(Association of Kenya Insurers –AKI) to better understand the viability of the
industry for policy formulation and decision making.
15
CHAPTER TWO: LITERATURE REVIEW
2.1 Introduction
This chapter discusses relevant literature information on the study topic and in line
with the research objectives. The chapter begins with the theoretical foundation of the
study. The chapter ends with empirical review on attractiveness in an industry and
concluding summary of the same.
2.2 Theoretical Review
2.2.1 Competitive Theory
Industry analysis is an orderly process that attempt to capture the structural factors
that define the long-term profitability prospects to an industry. Rowe et al (1994)
define industry analysis as an environmental scan to determine what forces in a firm‟s
external environment have direct impact on its competitive position and what
competitive actions need to be taken to achieve competitive advantage. It focuses on
industries in which the firm competes (Comeford & Callagham. 1990).There is an
established relationship between business strategy, innovation and organizational
performance. In response to new technology driven global markets, companies have
increased their use of advanced technologies as well as their innovation efforts (Zahra
& Covin, 1993). The increasingly competitive environment in the financial services
market has resulted in pressure to develop and utilize alternative delivery channels
(Pearson & Robinson, 2007).
2.2.2 Industry Theory
The survival and success of an organization occurs when the organization creates and
maintains a match between its strategy and the environment and also between its
internal capability and its strategy (Grant, 2002). In order to achieve new gains for its
stakeholders and fulfill their needs and requirements, organizations must
continuously search for the development of its product and services through
marketing innovation and creativity. This will play a very important role in achieving
competitive advantage especially in the insurance industry where competition is
intense, through the forces of change brought into the industry by recapitalization and
consolidation (Business Monitor International, 2012).
16
2.3 Porter’s Five Forces Model
2.3.1 Threat of Substitute Products or Services
Price to customers willing to pay for a product depends partly on the availability of
substitute products. The absence of close substitutes for a product as in the case of
Petrol or cigarettes means that consumers are comparatively insensitive to price
hence demand is inelastic with respect to price. Existence of close substitute‟s means
that customers will switch to substitutes in response to price increases for the product
hence demand is elastic with respect to price. If an industry earns a return on capital
in excess of capital, it acts like a magnet to attract firms outside the industry. If entry
of new firms is unrestricted, the rate of profit will fall towards its competitive
level. Threat of entry rather than actual entry may be sufficient to ensure that
established firms constrain their prices to the competitive level.
New entrants in an industry contribute to extra capacity, technology, desire to gain
market share and so on. In microeconomics theory, the entry is a response to the
prevailing industry attractiveness as manifested in profit margin enjoyed by the
industry operating companies. However, according to Geroski (1995), there is
evidence that entry reacts slowly to high expected profits and that only important
differences of expected profits among industries may lead to different rates of entry
hence profits are a sign of industry attractiveness only if they are relatively high and
the response by potential entrants is slow. One may therefore reason that speed of
entry as a reaction to high profit may depend on other factors connected with an entry
of new firms such as capital and technology requirements, transaction costs and so
on. However, these factors are mainly industry specific hence leading to a conclusion
that entry reaction to high profit industry may depend on industry itself, (Barbot,
2001).
2.3.2 Threat of New Entrant
Entry barrier is the major factor determining the speed and magnitude of threat of
new entrants and can also be considered to be low or high depending on the resources
and competencies of the potential entrants. With high sustainable profits, new
entrants will be attracted in large numbers and will highly be motivated to commit
any level of needed resources to negate the barriers to entry. In this case, relevance
17
of entry barrier diminishes. According to Keegan (1995), the entry of new players
disrupts the level of Industry‟s profitability by increasing the industry capacity and
reducing the price leading to reduced profit margin; the law of demand and supply.
The barrier can be maintained by having unique capabilities which cannot be copied
by competitor making it easy for the firm to enter the industry but unacceptably
difficult for everybody else.(Hax & Majluf, 1996). Industry growth is another
important determinant of entry as growing industries attract new firms and vice
versa. An industry where no barriers to entry or exit exists is contestable; prices and
profits tend towards the competition level regardless of the number of firms within
the industry (Grant & Jordan, 2012). Contestability depends on the absence of sunk
costs i.e. investments whose values cannot be recovered. Absence of such costs make
an industry vulnerable to „hit-and-run‟ entry wherever established firms raise their
prices above the competitive level (Grant & Jordan, 2012).
Capital cost of getting established may also be a hindrance to entry. Product
differentiation is another entry deterrent. In an industry where products are highly
differentiated, established firms possess the advantage of brand recognition and
customer loyalty. This will force new entrants to spend heavily on promotion and
advertisement to gain brand awareness and goodwill. Control of channel of
distribution may also work as a barrier to entry. Limited capacity within distribution
channels example. Brokers, Agents, and Banks. Big Brokers and Agents have already
placed their loyalty in some few companies. Economists from the Chicago school
theorize that the only effective barriers to entry are those created by government
(Legal barriers) (Grant & Jordan, 2012). Barriers to entry also depends on the
entrants expectations as to possible retaliation by established firms. This may take the
firm of increased advertising, price cutting or even litigation.
For most industries, the major determinant of the overall state of competition and the
general level of probability is competition among the firms within the industry. In
some industries, firms compete aggressively pushing prices below cost hence
industry wide losses. In other industries, price competition is muted and rivalry
focuses on advertising, innovation and service quality. Concentration of sellers; as
measured by concentration ratio is one of the methods of measuring intensity of
competition between established firms. Seller‟s concentration refers to the number
18
and size distribution of firms competing within a market. Diversity of competitors
and product differentiation also helps in measuring the inter industry rivalry. The
more similar the offerings among rival firms, the more willing are customers to
switch between them and the greater inducements for firms to cut prices to boost
sales. Where products of rival firms are virtually indistinguishable, price is the sole
basis for competition. Excess capacity and exit barriers also help to ascertain the
intensity of intra industry competition. Unused capacity encourages firms to offer
price cuts to attract new business while barrier to exits are costs associated with
capacity leaving an industry e.g. where resources are durable and specialized and
employees entitled to Job protection, emotional ties, government or social restrictions
and the like.
2.3.3 Rivalry among existing firms
Competitive strategy aims to establish a sustainable profitable position against the
forces that determine industry competition (Porter 2002). The choice of competitive
strategy depends on attractiveness for long-term profitability and factors that
determine it, not all industries offer equal opportunity for sustained profitability
which is an essential ingredient in determining the profitability of a
firm. Determinants of relative competitive position within an industry helps to
explain why some firms are more profitable than others regardless of average
profitability of the industry. A firm in a very attractive industry may still not earn
attractive profit if it has chosen a poor competitive position. Conversely, a firm in an
excellent competitive position may be in such a poor industry, that it is not very
profitable. Industries become more or less attractive over time and competitive
position reflects a sustained war among competitors. Even long period of stability
can be ended abruptly by competitive moves (Anker, 1998).
2.3.4 Bargaining powers of suppliers
There are a number of strategic options for high performance and success. These are
product and service innovation, super customer service, geographical expansion &
product differentiation, sales promotion and so on. The intensity of competition
tends to increase when an industry is characterized by a number of well balanced
competitors, a slow rate of industry growth, high fixed costs and lack of
differentiation between products. According to Cook (1995) supplies to organizations
19
refer to all those sources of inputs that the organization need to provide goods and
services. Powerful suppliers can connive to bring down profits in an industry by
raising prices or reducing quality of supplied goods and services. Suppliers
bargaining power is high when; market is dominated by a few powerful large
suppliers as opposed to small and weak fragmented source, when there are no
substitute to a product or service, high switching costs, high possibility of forward
integration.
Singh and Wah (1997) concluded that firms and their suppliers needed to have a good
relationship for their mutual benefit. Leverick and Cooper (1998) observed that
organizations have tended to move away from adversarial relationship with suppliers
towards a more cooperative way of doing business. The bargaining power of
suppliers determines the costs of raw materials and other inputs. Suppliers power can
affect the relationship between a small business and its customers by influencing the
quality and price of the final product (Porter 2003). In the insurance industry, effect
of suppliers are seen in computer hardware and software, office equipment,
stationery and so on.
2.3.5 Bargaining power of buyers
Buyers are those who use the products or services of an organization. Before buying
a product, a consumer collects information from various sources which then goes
through the consumer buying process till decision to buy is made. Buyers will
normally compete with the industry by bargaining for lower prices, high quality
products or services. Buyer power is high when the volume of purchase of the
buyer is high, there are alternative source of supply, cost of switching supplies is low,
there is threat of backward integration; buyers have full information of demand,
actual market price and supplies costs. Powerful buyers can exert pressure on
business by demanding lower prices, higher quality services and even playing off
competitors against one another. The strength of buying power that firms face from
their customers depends on two factors thus buyer‟s price sensitivity and relative
bargaining power. Price sensitivity is the extent to which buyers respond to a firm‟s
price changes in an industry.
20
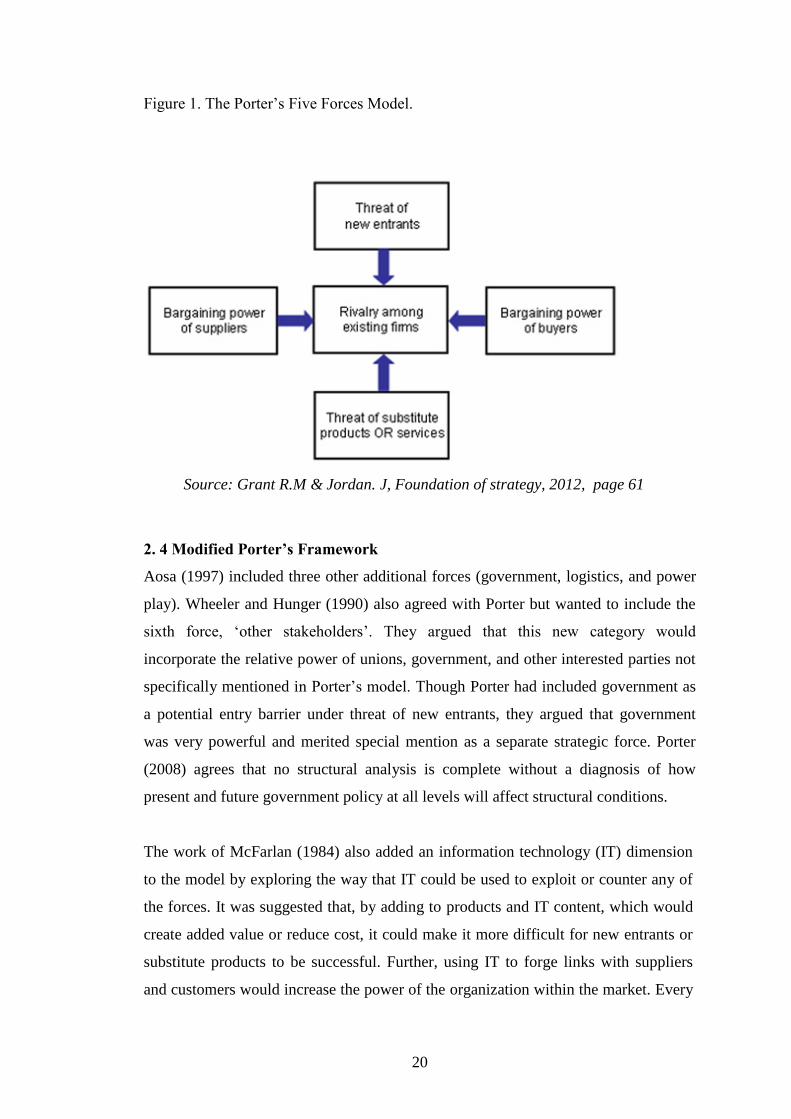
Figure 1. The Porter‟s Five Forces Model.
Source: Grant R.M & Jordan. J, Foundation of strategy, 2012, page 61
2. 4 Modified Porter’s Framework
Aosa (1997) included three other additional forces (government, logistics, and power
play). Wheeler and Hunger (1990) also agreed with Porter but wanted to include the
sixth force, „other stakeholders‟. They argued that this new category would
incorporate the relative power of unions, government, and other interested parties not
specifically mentioned in Porter‟s model. Though Porter had included government as
a potential entry barrier under threat of new entrants, they argued that government
was very powerful and merited special mention as a separate strategic force. Porter
(2008) agrees that no structural analysis is complete without a diagnosis of how
present and future government policy at all levels will affect structural conditions.
The work of McFarlan (1984) also added an information technology (IT) dimension
to the model by exploring the way that IT could be used to exploit or counter any of
the forces. It was suggested that, by adding to products and IT content, which would
create added value or reduce cost, it could make it more difficult for new entrants or
substitute products to be successful. Further, using IT to forge links with suppliers
and customers would increase the power of the organization within the market. Every
21
industry feels the influence of other forces like politics of the day, government,
employees and special groups, the public, lobby groups and registered trade unions
and so on hence called the sixth force. The sixth force either influence industry
attractiveness through all the main five forces or act as a separate force
2.5 Empirical literature on industry analysis
Illangakon (2010) on Analysis of Industry attractiveness using Porter's five forces in
UK music Industy examined and concluded that the universal applicability of music
as a form of entertainment may remain to be the largest selling proposition for this
industry and is the largest reason behind the high profitability of the industry. In
conclusion therefore, it can be said that applying five forces theory is extremely
important in industry analysis as it allows firms to develop better strategies through
identification of forces operating in the market and understanding of overall
attractiveness of the industry.
Cafferky (2005) in The Porter Five-forces Industry Analysis Framework For
Religious Nonprofits in the USA contends that the profitability (and correspondingly
attractiveness) of an industry is a function of the cumulative effect of the five forces.
Profitability of the religious “industry” is not meaningful if discussed in terms of
marginal costs versus marginal revenues. What is needed is a better description of the
outcome of the five forces in the religious industry. Share of world-view and mind-set
advantages versus the tradeoffs for the consumer may offer descriptions of outcomes
more relevant than profit though exceedingly difficult to measure. Aldrichs (1979)
concept of environmental capacity, richness and leanness may be helpful in
understanding the environment in which religious non profit organizations operate.
Vengesayi (2009) on A conceptual model of tourism destination Competitiveness and
Attractiveness examined that there have been advances in modeling competitiveness
in tourism but there is little empirical evidence to support the models proposed by
researchers. The symmetrical approach to tourism destination evaluation should be a
starting point in harmonizing the interests of the destination as well as those of the
tourists. The results of such an approach could be used to sell the destination interests
to visitors as well as the interests of visitors to the destination operators. Researchers
22
now need to move from conceptual to empirical validation of the proposed models.
Initially the challenge should be to investigate the relationship between the identified
variables and how strongly they influence the attractiveness and competitiveness of
tourism destinations.
In Kenya, studies that have been conducted focused only on the application of the
ordinary Porter‟s Five Forces Model without the modification. However, Waithaka
(2001), studied funeral industry attractiveness and adopted the modified model
advanced by Aosa (1997), which included three other additional forces (government,
logistics, and power play). These forces were found to define the structure of the
funeral industry. The same modified model has been applied by Oluoch (2003) in
studying the perceived attractiveness of the freight and forwarding industry. Other
studies that have adopted Porter‟s Five Forces Model include those of Nyale (2007)
who researched on mobile telephony and Wachira (2008) in the insurance industry.
The studies are also in support of the views advanced by Aosa, (1997) Osigweh,
(1989) Hussey,(1990) and Austin, (1991) that management is sensitive to the context
in which it is practiced and that strategic management models advanced in developed
countries where strategic management originated may not be directly applicable in
developing African countries.
2.6 Summary of the literature Review
The Kenyan insurance industry is experiencing intensified competition and
regulations. This study will analyze the „big picture‟ of the insurance industry in
Kenya through Porter‟s Modified Five Forces model of competition. It will also
examine the key players aligned with the Modified Five Forces and their impact on
competition and industry Profitability in Kenya. Finally, it will assess attractiveness
of the insurance industry in Kenya through the modified porter‟s model.
23
CHAPTER THREE: RESEARCH METHODOLOGY
3.1 Introduction
This chapter focuses on the methodology that will be employed in the research
project. It details the research design, population under study, sampling technique
used, nature of the data collected and method of data analysis.
3.2 Research Design
The study was a descriptive survey of all the 47 Insurance companies registered in
Kenya and are members of The Association of Kenya Insurers (Appendix 2). It was
carried out by descriptive survey design which is favoured because it
describes the state of affairs as it exist at present (Kothari 2003). The researcher
wanted to assess the attractiveness of insurance industry at the moment.
According to Donald and Pamela (1998) a descriptive study was concerned with
finding out the what, where and how of a phenomenon, hence the how, or how not
attractive the insurance industry in Kenya is and due to what forces. The design
involved primary research methods and field research involved collection of primary
data.
3.3 Population of study
Population of interest in this Study was all the Insurance companies registered in
Kenya comprising 47 companies which are registered with the Association of Kenya
Insurers (Appendix 1).
3.4 Data Collection
A population is defined as a complete set of elements with some common observable
characteristics, Mugenda and Mugenda (1999). The study used primary data which
are largely descriptive in nature. Data was collected by Structured questionnaire due
to convenience of facilitating collection of large amount of data in a given sector of
the economy. It captures respondense‟s feeling and makes comparison and analysis
easy (Kibera and Wariunge). The researcher identified the targeted individual
respondents from each insurance company and wrote introductory letter together with
24
questionnaire to them. The questionnaire dwelt on the modified Porter‟s five forces
model which was regarded as variables. Question format embraced Five Point likert
scale. It targeted Chief Executive Officers because the research is intended for
officers at policy formulation levels who are able to appreciate the industry
challenges. Method of distribution was by hand delivery to respondents and
collecting later. This method is favored due to its convenience.
3.5 Data Analysis
Descriptive statistical method was used because the research questions are descriptive
in nature. The data was presented using tables for further analysis and to facilitate
comparison. Quantitative data was analyzed using descriptive statistics such as
frequencies, percentages, mean score and standard deviation. Data from open ended
questions was analyzed thematically according to objectives and research questions
after categorizing and allocating points for each answer. Inferences and conclusions
were then drawn from the analyzed data. The mean of the points was computed by
use of Statistics for Practices of Social and Sciences ( SPSS). While mean scores
measures the average, Standard deviation connotes the disparity from the central
tendency.
25
CHAPTER FOUR: DATA ANALYSIS, RESULTS AND DISCUSSIONS
4.1 Introduction
This chapter presents analysis and findings of the study as set out in the research
methodology. The results are presented in line with objectives of the study which was
to assess attractiveness of insurance industry in Kenya by application of Porter‟s
modified five forces model. The data was gathered using questionnaires which was
designed in two sections. The first section covered brief background information of
the insurance companies while second section covered the information on Porter‟s
modified five forces. The likert scale of 1 to 5 points was used in which I meant No
or low effect while 5 meant very high effect. Statistical tools like means, percentages
were employed to analysed data and presentation done in table form.
4.2 The Response Rate
The response rate is the return rate expressed as a percentage of total number of
questionnaires the researcher gave out. The study targeted the 47 Insurance
Companies operation in Kenya and registered as members of the Association of
Kenya Insurers (AKI). Out of the 47 questionnaires given out, 33 were completed
and returned in good time for analysis. The response rate was therefore 70.2% which
was considered fair and representative. According to Mugenda and Mugenda (1999)
a responses rate of 50% is considered adequate for reporting, 60% is good and 70% is
very good. The researcher initially called respective managing directors in advance to
request for their assistance in completing the questionnaire. After a short period soft
copies were sent followed by hard copies dropped for those who alleged to had not
received the soft copies. Respondents who did not respond to the questionnaire cited a
number of reasons including busy schedules, targeted personnel being out of the
country and some deliberately refused to divulge any information.
4.3 Organisational Information
This aspect was analysed based on ownership structure, age of the company and the
products and/or services offered. This aspect of organization information was
considered relevant as it facilitates proper understanding of the insurance industry.
26
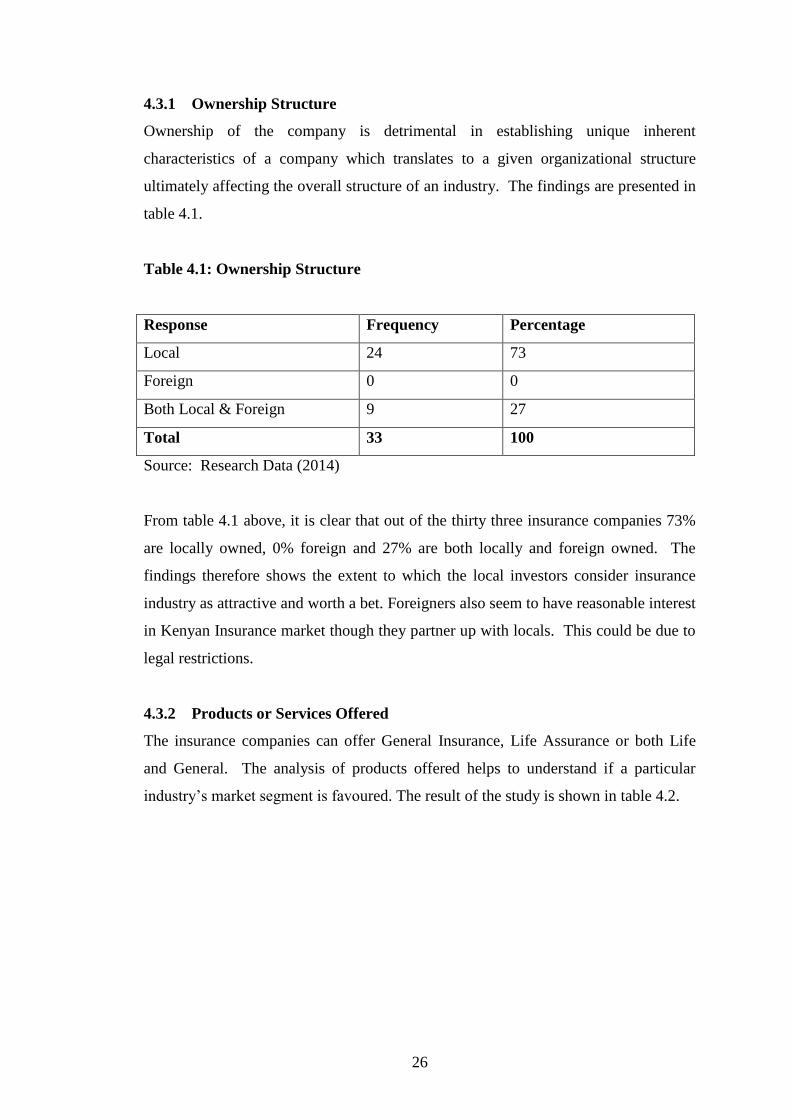
4.3.1 Ownership Structure
Ownership of the company is detrimental in establishing unique inherent
characteristics of a company which translates to a given organizational structure
ultimately affecting the overall structure of an industry. The findings are presented in
table 4.1.
Table 4.1: Ownership Structure
Response Frequency Percentage
Local 24 73
Foreign 0 0
Both Local & Foreign 9 27
Total 33 100
Source: Research Data (2014)
From table 4.1 above, it is clear that out of the thirty three insurance companies 73%
are locally owned, 0% foreign and 27% are both locally and foreign owned. The
findings therefore shows the extent to which the local investors consider insurance
industry as attractive and worth a bet. Foreigners also seem to have reasonable interest
in Kenyan Insurance market though they partner up with locals. This could be due to
legal restrictions.
4.3.2 Products or Services Offered
The insurance companies can offer General Insurance, Life Assurance or both Life
and General. The analysis of products offered helps to understand if a particular
industry‟s market segment is favoured. The result of the study is shown in table 4.2.
27
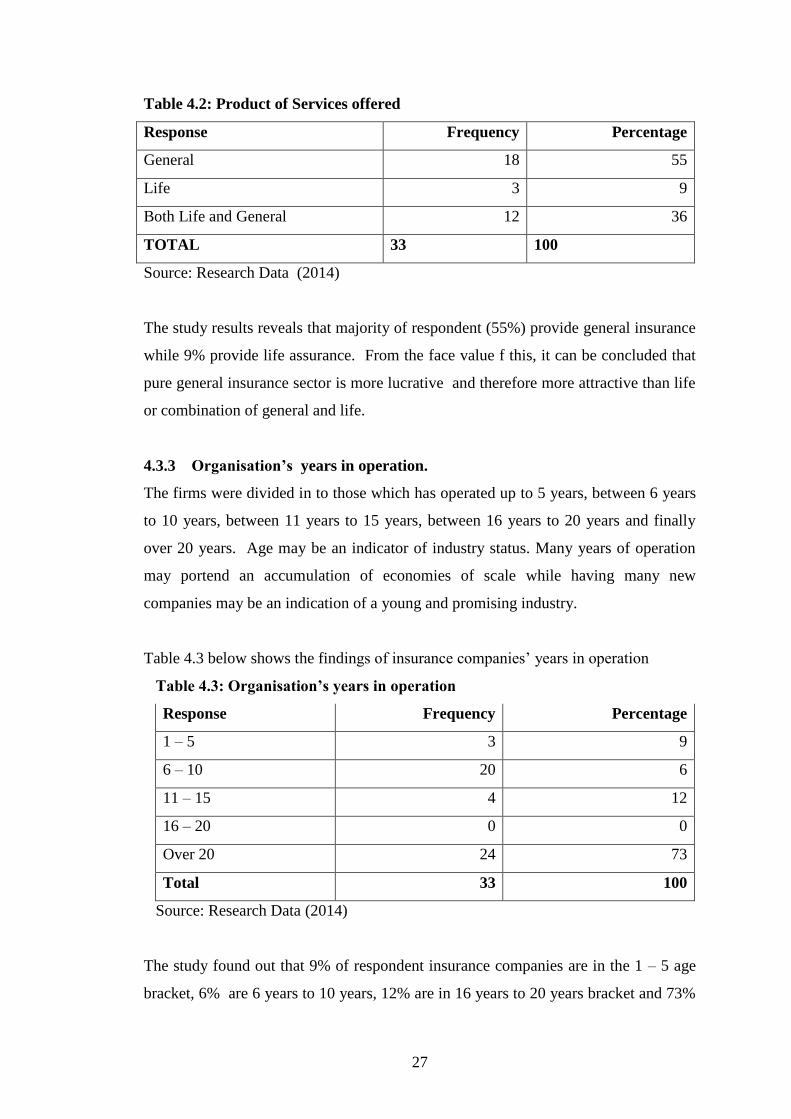
Table 4.2: Product of Services offered
Response Frequency Percentage
General 18 55
Life 3 9
Both Life and General 12 36
TOTAL 33 100
Source: Research Data (2014)
The study results reveals that majority of respondent (55%) provide general insurance
while 9% provide life assurance. From the face value f this, it can be concluded that
pure general insurance sector is more lucrative and therefore more attractive than life
or combination of general and life.
4.3.3 Organisation’s years in operation.
The firms were divided in to those which has operated up to 5 years, between 6 years
to 10 years, between 11 years to 15 years, between 16 years to 20 years and finally
over 20 years. Age may be an indicator of industry status. Many years of operation
may portend an accumulation of economies of scale while having many new
companies may be an indication of a young and promising industry.
Table 4.3 below shows the findings of insurance companies‟ years in operation
Table 4.3: Organisation’s years in operation
Response Frequency Percentage
1 – 5 3 9
6 – 10 20 6
11 – 15 4 12
16 – 20 0 0
Over 20 24 73
Total 33 100
Source: Research Data (2014)
The study found out that 9% of respondent insurance companies are in the 1 – 5 age
bracket, 6% are 6 years to 10 years, 12% are in 16 years to 20 years bracket and 73%
28
are over 20 years. It can therefore be concluded that majority of insurance companies
in Kenya are over 20 years old meaning the industry is mature, followed by those of
11 – 15 and 1 – 5 years at 12% and 9% respectively. This means the industry is
attracting new ones.
4.4 Attractiveness of the Insurance Industry
The objective of the study was the application of modified Porters five forces model
to assess attractiveness of insurance industry in Kenya. Porter‟s model provides an
assessment tool to analyze industry forces and profitability through bargaining power
of suppliers, bargaining power of buyers, threat of new entrants/barrier to entry, threat
of substitutes, competitive rivalry in the industry and power of other stakeholders.
These forces are the major determinants of industry profitability with great influence
on cost of production, prices, level of competition, operational policies and others.
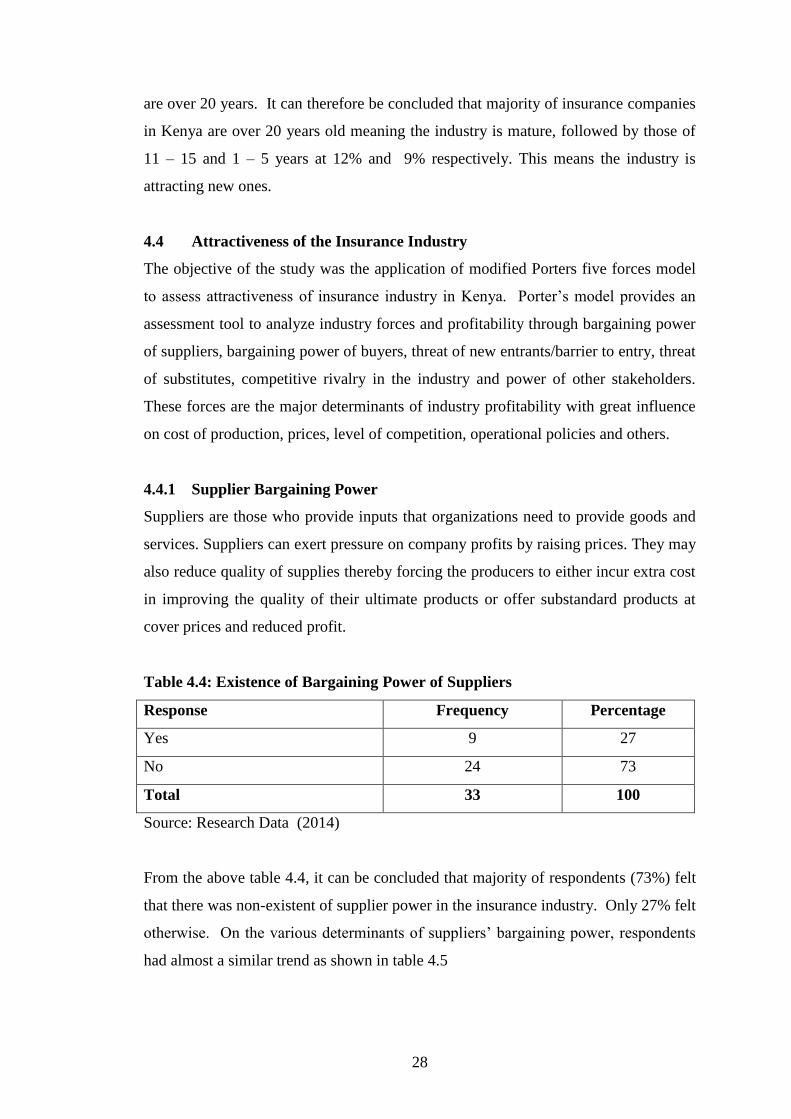
4.4.1 Supplier Bargaining Power
Suppliers are those who provide inputs that organizations need to provide goods and
services. Suppliers can exert pressure on company profits by raising prices. They may
also reduce quality of supplies thereby forcing the producers to either incur extra cost
in improving the quality of their ultimate products or offer substandard products at
cover prices and reduced profit.
Table 4.4: Existence of Bargaining Power of Suppliers
Response Frequency Percentage
Yes 9 27
No 24 73
Total 33 100
Source: Research Data (2014)
From the above table 4.4, it can be concluded that majority of respondents (73%) felt
that there was non-existent of supplier power in the insurance industry. Only 27% felt
otherwise. On the various determinants of suppliers‟ bargaining power, respondents
had almost a similar trend as shown in table 4.5
29
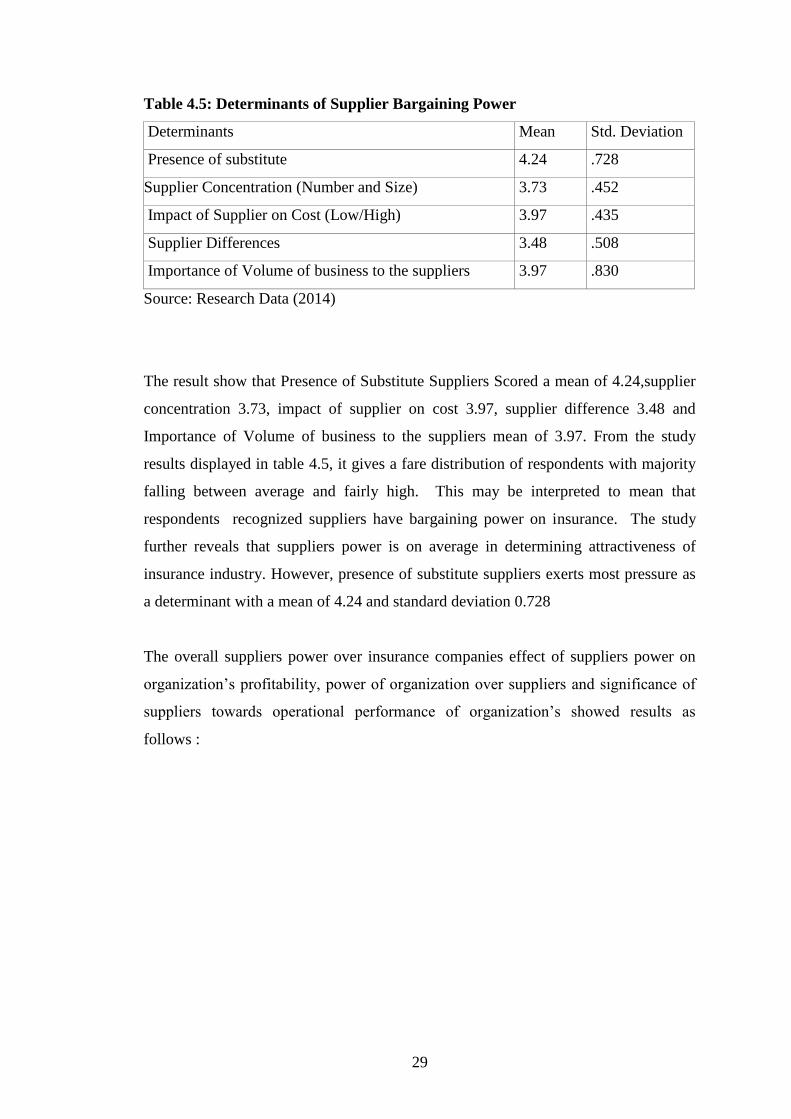
Table 4.5: Determinants of Supplier Bargaining Power
Determinants Mean Std. Deviation
Presence of substitute 4.24 .728
Supplier Concentration (Number and Size) 3.73 .452
Impact of Supplier on Cost (Low/High) 3.97 .435
Supplier Differences 3.48 .508
Importance of Volume of business to the suppliers 3.97 .830
Source: Research Data (2014)
The result show that Presence of Substitute Suppliers Scored a mean of 4.24,supplier
concentration 3.73, impact of supplier on cost 3.97, supplier difference 3.48 and
Importance of Volume of business to the suppliers mean of 3.97. From the study
results displayed in table 4.5, it gives a fare distribution of respondents with majority
falling between average and fairly high. This may be interpreted to mean that
respondents recognized suppliers have bargaining power on insurance. The study
further reveals that suppliers power is on average in determining attractiveness of
insurance industry. However, presence of substitute suppliers exerts most pressure as
a determinant with a mean of 4.24 and standard deviation 0.728
The overall suppliers power over insurance companies effect of suppliers power on
organization‟s profitability, power of organization over suppliers and significance of
suppliers towards operational performance of organization‟s showed results as
follows :
30
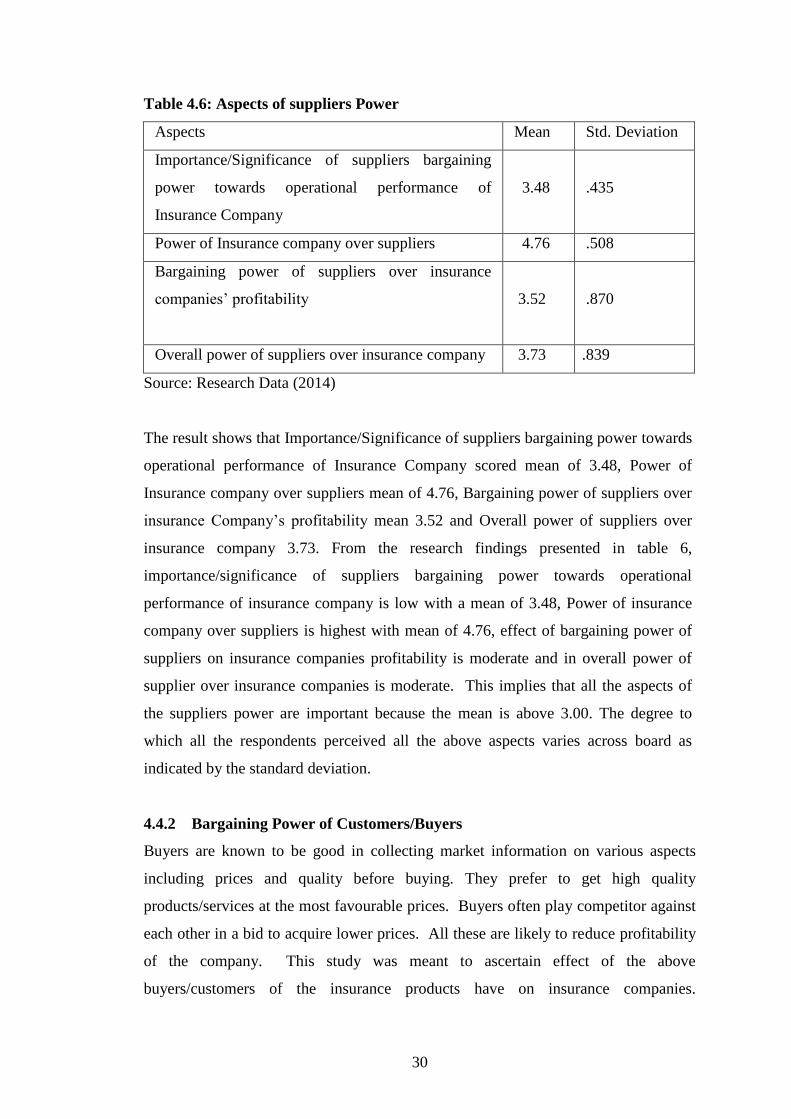
Table 4.6: Aspects of suppliers Power
Aspects Mean Std. Deviation
Importance/Significance of suppliers bargaining
power towards operational performance of
Insurance Company
3.48 .435
Power of Insurance company over suppliers 4.76 .508
Bargaining power of suppliers over insurance
companies‟ profitability
3.52 .870
Overall power of suppliers over insurance company 3.73 .839
Source: Research Data (2014)
The result shows that Importance/Significance of suppliers bargaining power towards
operational performance of Insurance Company scored mean of 3.48, Power of
Insurance company over suppliers mean of 4.76, Bargaining power of suppliers over
insurance Company‟s profitability mean 3.52 and Overall power of suppliers over
insurance company 3.73. From the research findings presented in table 6,
importance/significance of suppliers bargaining power towards operational
performance of insurance company is low with a mean of 3.48, Power of insurance
company over suppliers is highest with mean of 4.76, effect of bargaining power of
suppliers on insurance companies profitability is moderate and in overall power of
supplier over insurance companies is moderate. This implies that all the aspects of
the suppliers power are important because the mean is above 3.00. The degree to
which all the respondents perceived all the above aspects varies across board as
indicated by the standard deviation.
4.4.2 Bargaining Power of Customers/Buyers
Buyers are known to be good in collecting market information on various aspects
including prices and quality before buying. They prefer to get high quality
products/services at the most favourable prices. Buyers often play competitor against
each other in a bid to acquire lower prices. All these are likely to reduce profitability
of the company. This study was meant to ascertain effect of the above
buyers/customers of the insurance products have on insurance companies.
31
Respondents were asked to rate selected nine known determinants of buyer/customer
power in a bid to shed more light to the varying results of existence of buyer/customer
bargaining power. The findings are tabulated in table 4.7.
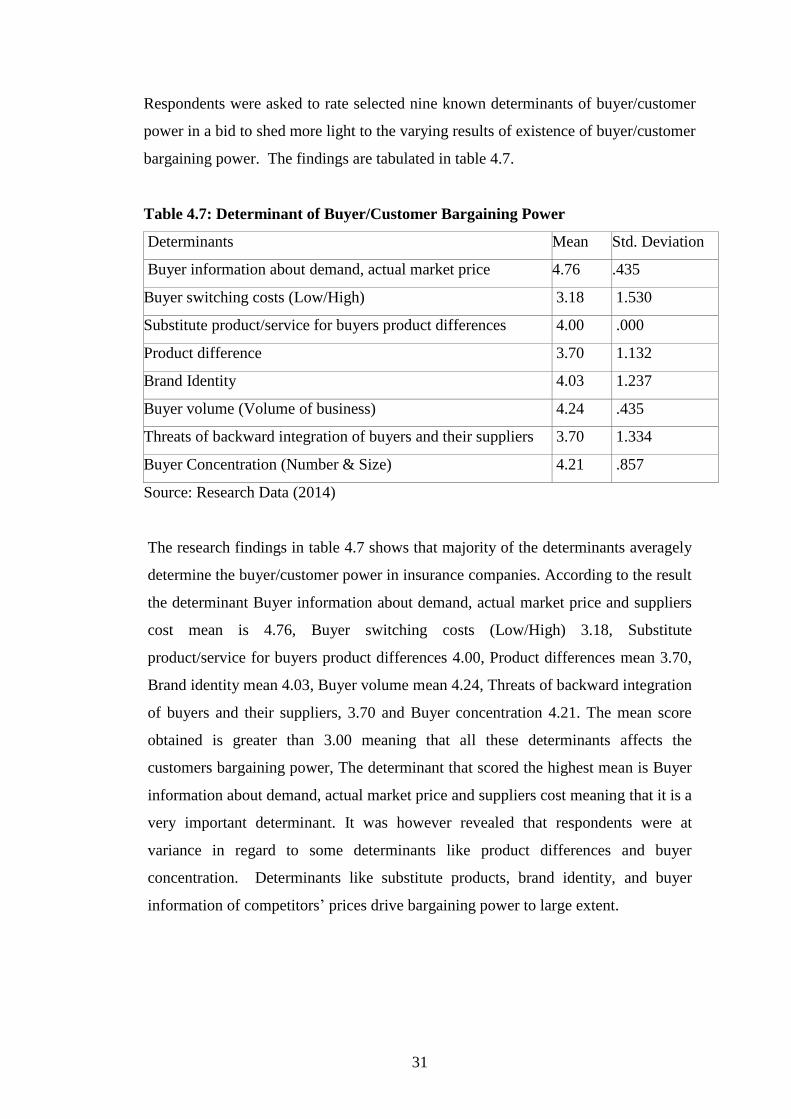
Table 4.7: Determinant of Buyer/Customer Bargaining Power
Determinants Mean Std. Deviation
Buyer information about demand, actual market price 4.76 .435
Buyer switching costs (Low/High) 3.18 1.530
Substitute product/service for buyers product differences 4.00 .000
Product difference 3.70 1.132
Brand Identity 4.03 1.237
Buyer volume (Volume of business) 4.24 .435
Threats of backward integration of buyers and their suppliers 3.70 1.334
Buyer Concentration (Number & Size) 4.21 .857
Source: Research Data (2014)
The research findings in table 4.7 shows that majority of the determinants averagely
determine the buyer/customer power in insurance companies. According to the result
the determinant Buyer information about demand, actual market price and suppliers
cost mean is 4.76, Buyer switching costs (Low/High) 3.18, Substitute
product/service for buyers product differences 4.00, Product differences mean 3.70,
Brand identity mean 4.03, Buyer volume mean 4.24, Threats of backward integration
of buyers and their suppliers, 3.70 and Buyer concentration 4.21. The mean score
obtained is greater than 3.00 meaning that all these determinants affects the
customers bargaining power, The determinant that scored the highest mean is Buyer
information about demand, actual market price and suppliers cost meaning that it is a
very important determinant. It was however revealed that respondents were at
variance in regard to some determinants like product differences and buyer
concentration. Determinants like substitute products, brand identity, and buyer
information of competitors‟ prices drive bargaining power to large extent.
32
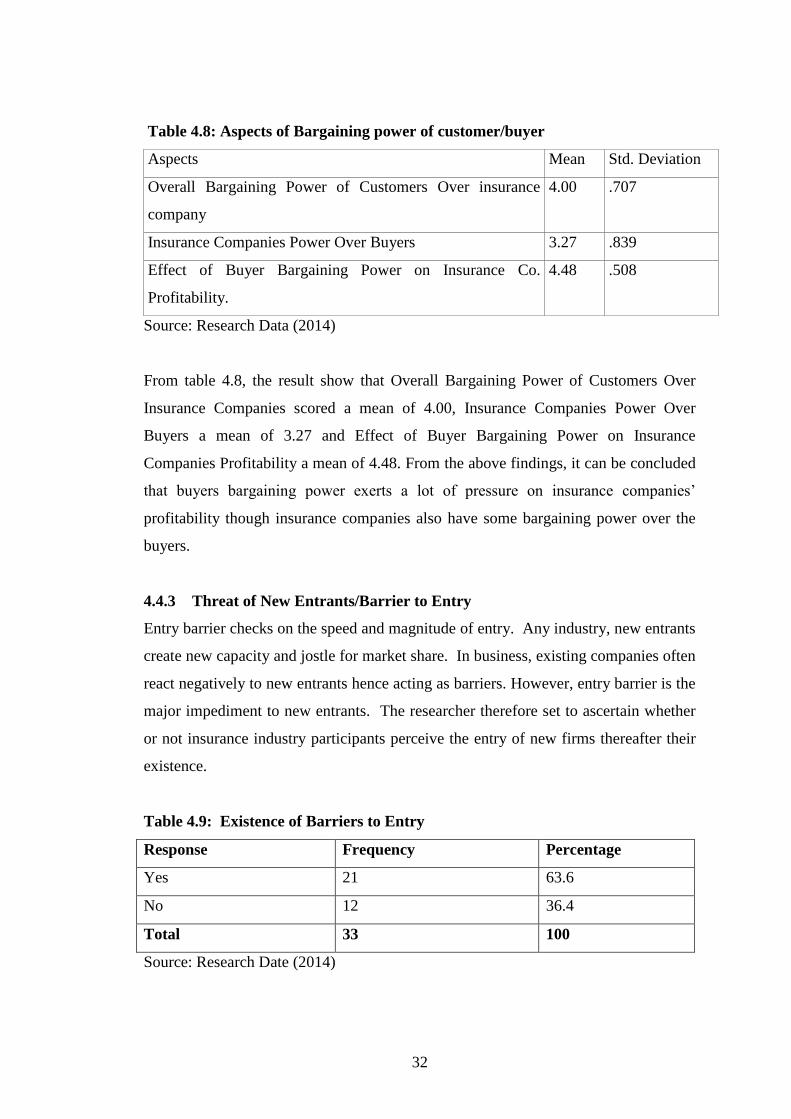
Table 4.8: Aspects of Bargaining power of customer/buyer
Aspects Mean Std. Deviation
Overall Bargaining Power of Customers Over insurance
company
4.00 .707
Insurance Companies Power Over Buyers 3.27 .839
Effect of Buyer Bargaining Power on Insurance Co.
Profitability.
4.48 .508
Source: Research Data (2014)
From table 4.8, the result show that Overall Bargaining Power of Customers Over
Insurance Companies scored a mean of 4.00, Insurance Companies Power Over
Buyers a mean of 3.27 and Effect of Buyer Bargaining Power on Insurance
Companies Profitability a mean of 4.48. From the above findings, it can be concluded
that buyers bargaining power exerts a lot of pressure on insurance companies‟
profitability though insurance companies also have some bargaining power over the
buyers.
4.4.3 Threat of New Entrants/Barrier to Entry
Entry barrier checks on the speed and magnitude of entry. Any industry, new entrants
create new capacity and jostle for market share. In business, existing companies often
react negatively to new entrants hence acting as barriers. However, entry barrier is the
major impediment to new entrants. The researcher therefore set to ascertain whether
or not insurance industry participants perceive the entry of new firms thereafter their
existence.
Table 4.9: Existence of Barriers to Entry
Response Frequency Percentage
Yes 21 63.6
No 12 36.4
Total 33 100
Source: Research Date (2014)
33
Findings from Table 4.9 above reveals that 63.6% indicated existence of barriers to
entry into the insurance industry as opposed to 36.4% who replied to the contrary.
Buoyed by the above findings, the researcher advanced to establish the extent to
which set of known barriers threaten entry into the insurance industry. The findings
are tabulated in Table 4.10
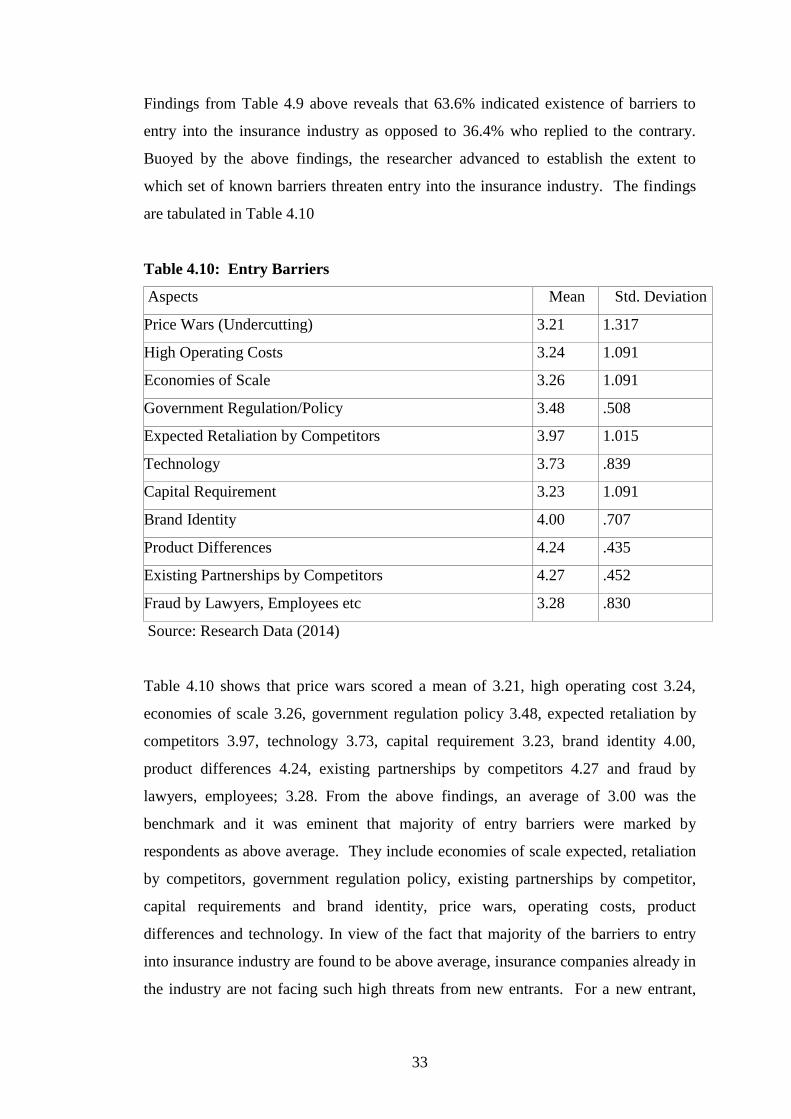
Table 4.10: Entry Barriers
Aspects Mean Std. Deviation
Price Wars (Undercutting) 3.21 1.317
High Operating Costs 3.24 1.091
Economies of Scale 3.26 1.091
Government Regulation/Policy 3.48 .508
Expected Retaliation by Competitors 3.97 1.015
Technology 3.73 .839
Capital Requirement 3.23 1.091
Brand Identity 4.00 .707
Product Differences 4.24 .435
Existing Partnerships by Competitors 4.27 .452
Fraud by Lawyers, Employees etc 3.28 .830
Source: Research Data (2014)
Table 4.10 shows that price wars scored a mean of 3.21, high operating cost 3.24,
economies of scale 3.26, government regulation policy 3.48, expected retaliation by
competitors 3.97, technology 3.73, capital requirement 3.23, brand identity 4.00,
product differences 4.24, existing partnerships by competitors 4.27 and fraud by
lawyers, employees; 3.28. From the above findings, an average of 3.00 was the
benchmark and it was eminent that majority of entry barriers were marked by
respondents as above average. They include economies of scale expected, retaliation
by competitors, government regulation policy, existing partnerships by competitor,
capital requirements and brand identity, price wars, operating costs, product
differences and technology. In view of the fact that majority of the barriers to entry
into insurance industry are found to be above average, insurance companies already in
the industry are not facing such high threats from new entrants. For a new entrant,
34
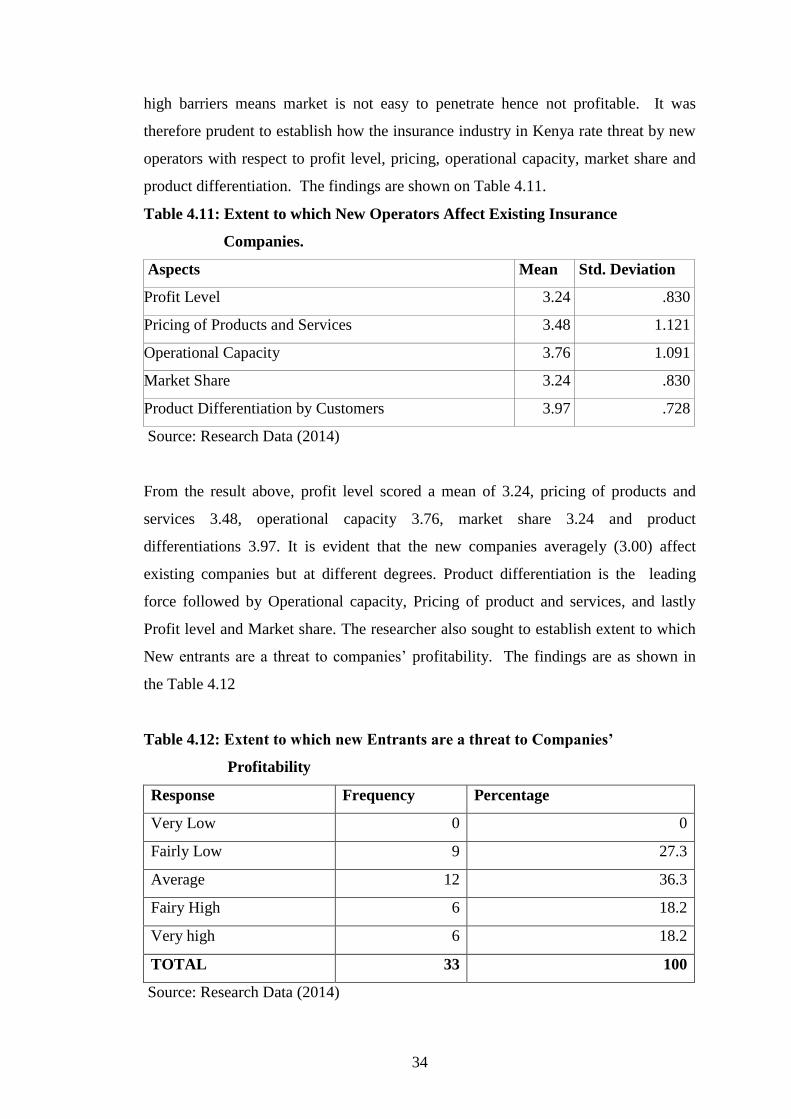
high barriers means market is not easy to penetrate hence not profitable. It was
therefore prudent to establish how the insurance industry in Kenya rate threat by new
operators with respect to profit level, pricing, operational capacity, market share and
product differentiation. The findings are shown on Table 4.11.
Table 4.11: Extent to which New Operators Affect Existing Insurance
Companies.
Aspects Mean Std. Deviation
Profit Level 3.24 .830
Pricing of Products and Services 3.48 1.121
Operational Capacity 3.76 1.091
Market Share 3.24 .830
Product Differentiation by Customers 3.97 .728
Source: Research Data (2014)
From the result above, profit level scored a mean of 3.24, pricing of products and
services 3.48, operational capacity 3.76, market share 3.24 and product
differentiations 3.97. It is evident that the new companies averagely (3.00) affect
existing companies but at different degrees. Product differentiation is the leading
force followed by Operational capacity, Pricing of product and services, and lastly
Profit level and Market share. The researcher also sought to establish extent to which
New entrants are a threat to companies‟ profitability. The findings are as shown in
the Table 4.12
Table 4.12: Extent to which new Entrants are a threat to Companies’
Profitability
Response Frequency Percentage
Very Low 0 0
Fairly Low 9 27.3
Average 12 36.3
Fairy High 6 18.2
Very high 6 18.2
TOTAL 33 100
Source: Research Data (2014)
35
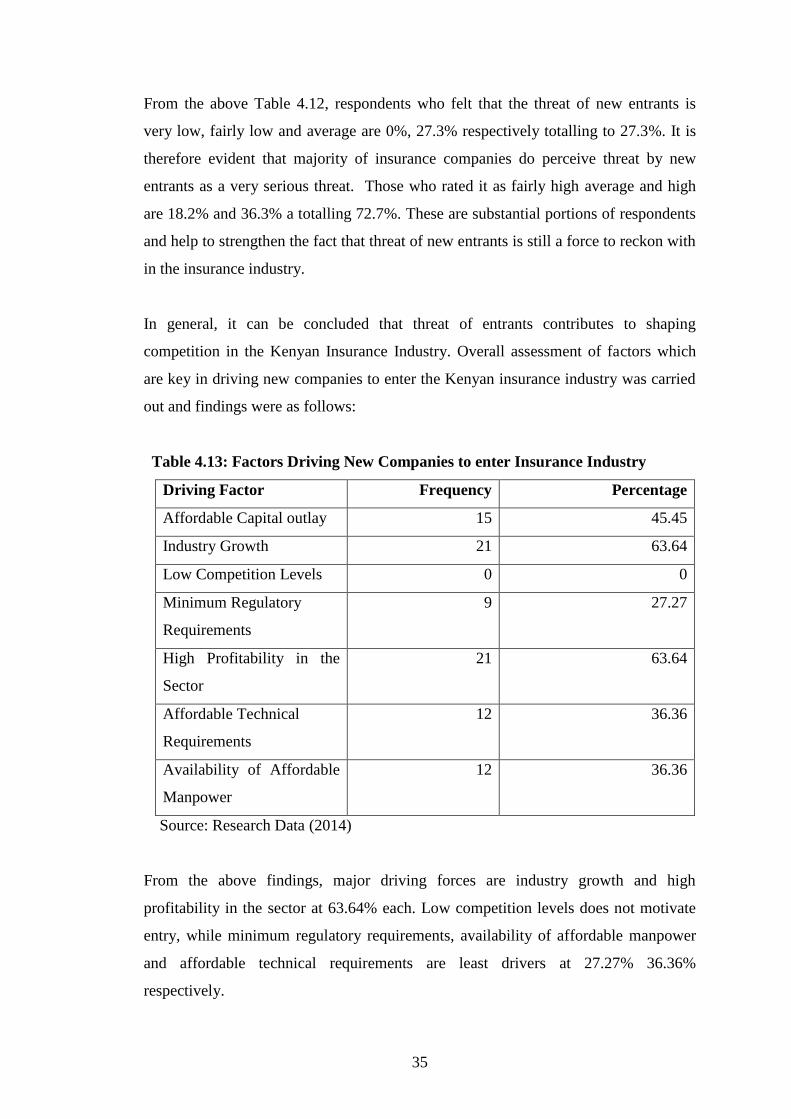
From the above Table 4.12, respondents who felt that the threat of new entrants is
very low, fairly low and average are 0%, 27.3% respectively totalling to 27.3%. It is
therefore evident that majority of insurance companies do perceive threat by new
entrants as a very serious threat. Those who rated it as fairly high average and high
are 18.2% and 36.3% a totalling 72.7%. These are substantial portions of respondents
and help to strengthen the fact that threat of new entrants is still a force to reckon with
in the insurance industry.
In general, it can be concluded that threat of entrants contributes to shaping
competition in the Kenyan Insurance Industry. Overall assessment of factors which
are key in driving new companies to enter the Kenyan insurance industry was carried
out and findings were as follows:
Table 4.13: Factors Driving New Companies to enter Insurance Industry
Driving Factor Frequency Percentage
Affordable Capital outlay 15 45.45
Industry Growth 21 63.64
Low Competition Levels 0 0
Minimum Regulatory
Requirements
9 27.27
High Profitability in the
Sector
21 63.64
Affordable Technical
Requirements
12 36.36
Availability of Affordable
Manpower
12 36.36
Source: Research Data (2014)
From the above findings, major driving forces are industry growth and high
profitability in the sector at 63.64% each. Low competition levels does not motivate
entry, while minimum regulatory requirements, availability of affordable manpower
and affordable technical requirements are least drivers at 27.27% 36.36%
respectively.
36
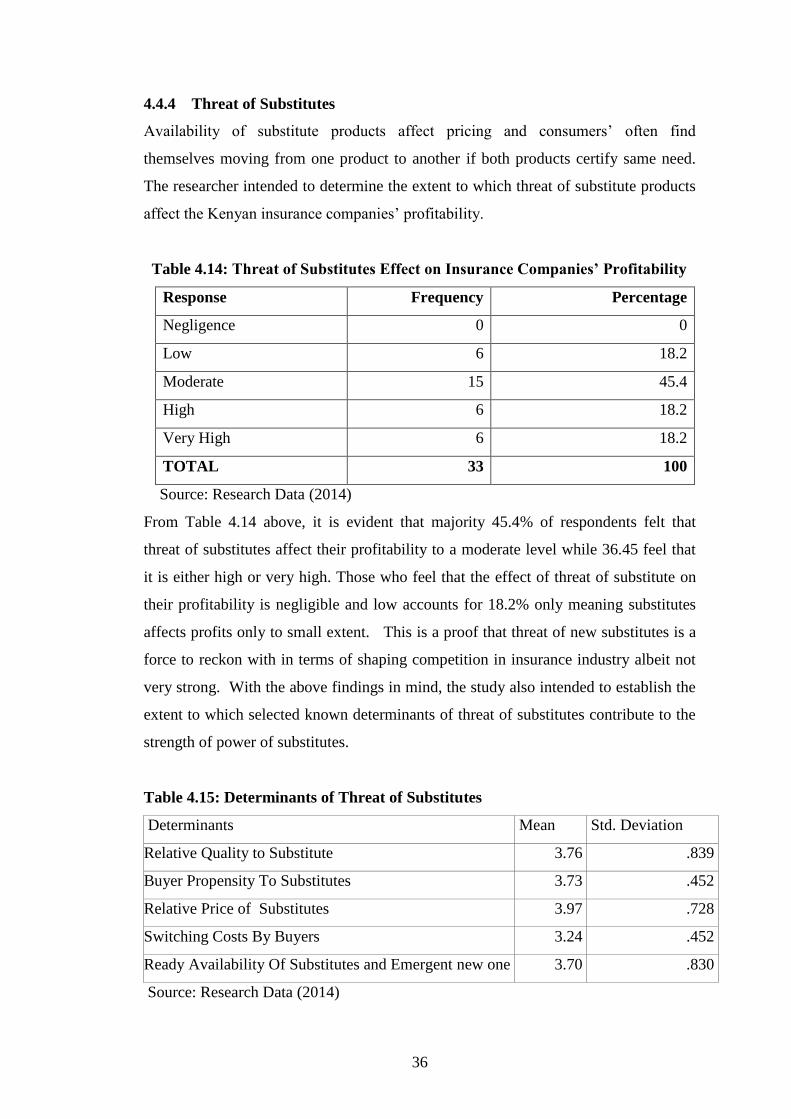
4.4.4 Threat of Substitutes
Availability of substitute products affect pricing and consumers‟ often find
themselves moving from one product to another if both products certify same need.
The researcher intended to determine the extent to which threat of substitute products
affect the Kenyan insurance companies‟ profitability.
Table 4.14: Threat of Substitutes Effect on Insurance Companies’ Profitability
Response Frequency Percentage
Negligence 0 0
Low 6 18.2
Moderate 15 45.4
High 6 18.2
Very High 6 18.2
TOTAL 33 100
Source: Research Data (2014)
From Table 4.14 above, it is evident that majority 45.4% of respondents felt that
threat of substitutes affect their profitability to a moderate level while 36.45 feel that
it is either high or very high. Those who feel that the effect of threat of substitute on
their profitability is negligible and low accounts for 18.2% only meaning substitutes
affects profits only to small extent. This is a proof that threat of new substitutes is a
force to reckon with in terms of shaping competition in insurance industry albeit not
very strong. With the above findings in mind, the study also intended to establish the
extent to which selected known determinants of threat of substitutes contribute to the
strength of power of substitutes.
Table 4.15: Determinants of Threat of Substitutes
Determinants Mean Std. Deviation
Relative Quality to Substitute 3.76 .839
Buyer Propensity To Substitutes 3.73 .452
Relative Price of Substitutes 3.97 .728
Switching Costs By Buyers 3.24 .452
Ready Availability Of Substitutes and Emergent new one 3.70 .830
Source: Research Data (2014)
37
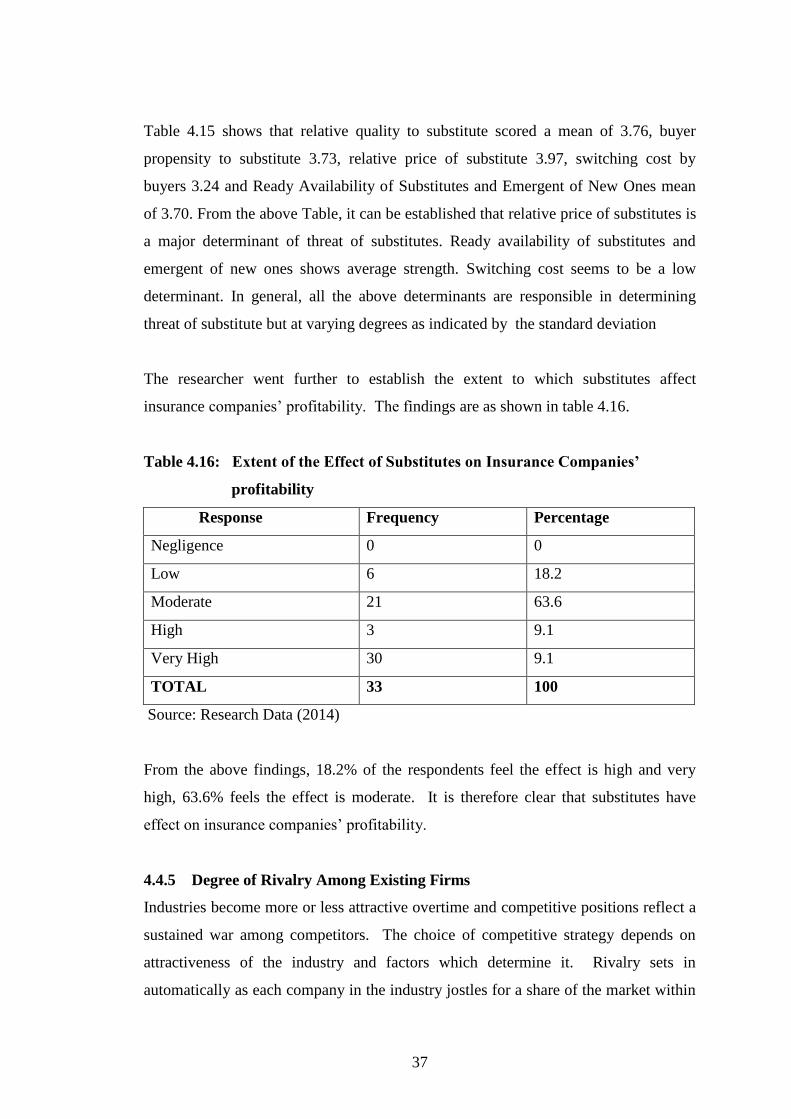
Table 4.15 shows that relative quality to substitute scored a mean of 3.76, buyer
propensity to substitute 3.73, relative price of substitute 3.97, switching cost by
buyers 3.24 and Ready Availability of Substitutes and Emergent of New Ones mean
of 3.70. From the above Table, it can be established that relative price of substitutes is
a major determinant of threat of substitutes. Ready availability of substitutes and
emergent of new ones shows average strength. Switching cost seems to be a low
determinant. In general, all the above determinants are responsible in determining
threat of substitute but at varying degrees as indicated by the standard deviation
The researcher went further to establish the extent to which substitutes affect
insurance companies‟ profitability. The findings are as shown in table 4.16.
Table 4.16: Extent of the Effect of Substitutes on Insurance Companies’
profitability
Response Frequency Percentage
Negligence 0 0
Low 6 18.2
Moderate 21 63.6
High 3 9.1
Very High 30 9.1
TOTAL 33 100
Source: Research Data (2014)
From the above findings, 18.2% of the respondents feel the effect is high and very
high, 63.6% feels the effect is moderate. It is therefore clear that substitutes have
effect on insurance companies‟ profitability.
4.4.5 Degree of Rivalry Among Existing Firms
Industries become more or less attractive overtime and competitive positions reflect a
sustained war among competitors. The choice of competitive strategy depends on
attractiveness of the industry and factors which determine it. Rivalry sets in
automatically as each company in the industry jostles for a share of the market within
38
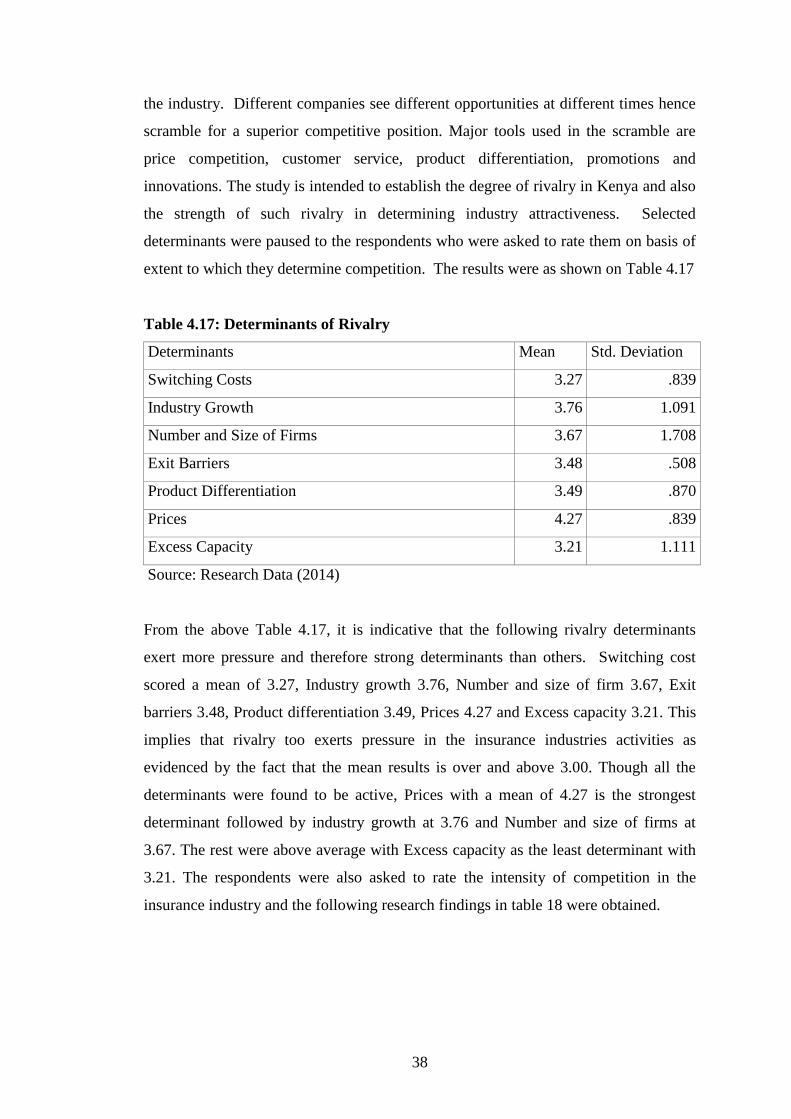
the industry. Different companies see different opportunities at different times hence
scramble for a superior competitive position. Major tools used in the scramble are
price competition, customer service, product differentiation, promotions and
innovations. The study is intended to establish the degree of rivalry in Kenya and also
the strength of such rivalry in determining industry attractiveness. Selected
determinants were paused to the respondents who were asked to rate them on basis of
extent to which they determine competition. The results were as shown on Table 4.17
Table 4.17: Determinants of Rivalry
Determinants Mean Std. Deviation
Switching Costs 3.27 .839
Industry Growth 3.76 1.091
Number and Size of Firms 3.67 1.708
Exit Barriers 3.48 .508
Product Differentiation 3.49 .870
Prices 4.27 .839
Excess Capacity 3.21 1.111
Source: Research Data (2014)
From the above Table 4.17, it is indicative that the following rivalry determinants
exert more pressure and therefore strong determinants than others. Switching cost
scored a mean of 3.27, Industry growth 3.76, Number and size of firm 3.67, Exit
barriers 3.48, Product differentiation 3.49, Prices 4.27 and Excess capacity 3.21. This
implies that rivalry too exerts pressure in the insurance industries activities as
evidenced by the fact that the mean results is over and above 3.00. Though all the
determinants were found to be active, Prices with a mean of 4.27 is the strongest
determinant followed by industry growth at 3.76 and Number and size of firms at
3.67. The rest were above average with Excess capacity as the least determinant with
3.21. The respondents were also asked to rate the intensity of competition in the
insurance industry and the following research findings in table 18 were obtained.
39
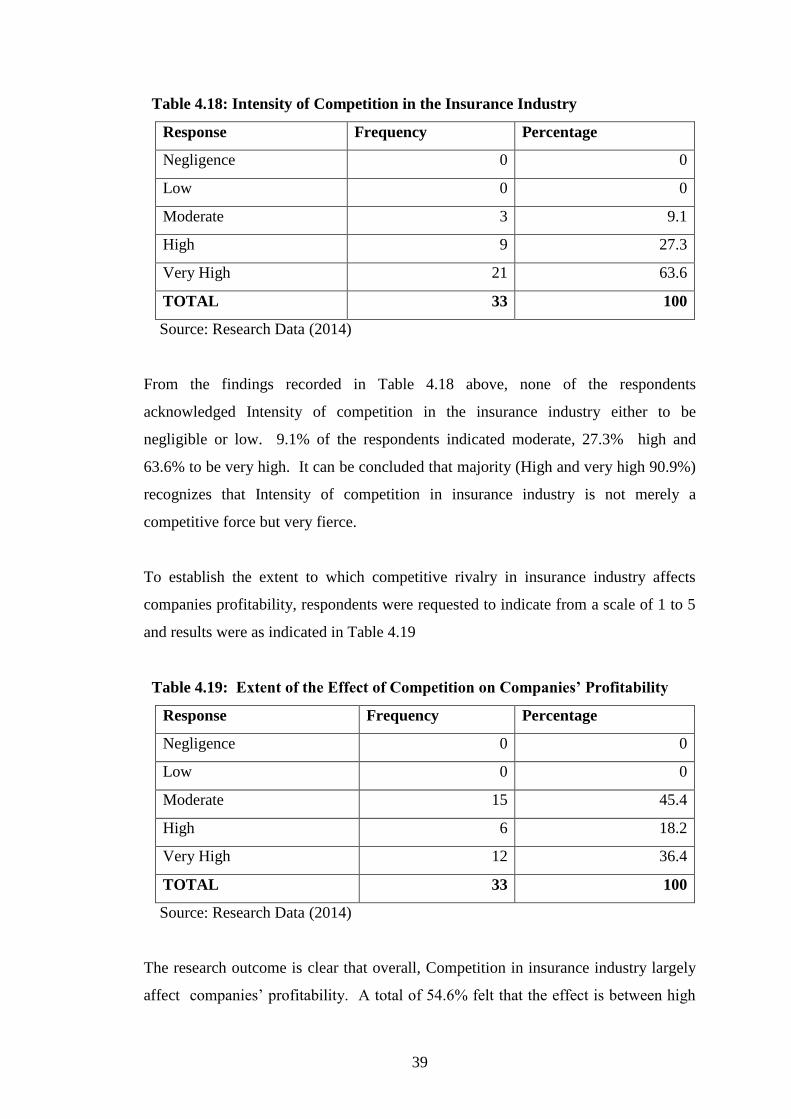
Table 4.18: Intensity of Competition in the Insurance Industry
Response Frequency Percentage
Negligence 0 0
Low 0 0
Moderate 3 9.1
High 9 27.3
Very High 21 63.6
TOTAL 33 100
Source: Research Data (2014)
From the findings recorded in Table 4.18 above, none of the respondents
acknowledged Intensity of competition in the insurance industry either to be
negligible or low. 9.1% of the respondents indicated moderate, 27.3% high and
63.6% to be very high. It can be concluded that majority (High and very high 90.9%)
recognizes that Intensity of competition in insurance industry is not merely a
competitive force but very fierce.
To establish the extent to which competitive rivalry in insurance industry affects
companies profitability, respondents were requested to indicate from a scale of 1 to 5
and results were as indicated in Table 4.19
Table 4.19: Extent of the Effect of Competition on Companies’ Profitability
Response Frequency Percentage
Negligence 0 0
Low 0 0
Moderate 15 45.4
High 6 18.2
Very High 12 36.4
TOTAL 33 100
Source: Research Data (2014)
The research outcome is clear that overall, Competition in insurance industry largely
affect companies‟ profitability. A total of 54.6% felt that the effect is between high
40
and very high; an indication of serious impact of competition on profits. Though
there is remarkable variation of extent on the strength of the effect, the actual effect
on the profit is quite significant.
When the respondents were asked to briefly explain in what other way rivalry in the
industry influence performance, they gave various reasons including undercutting of
rates, and when asked for recommendations to make insurance industry more
attractive, respondents gave various reasons like competition on service delivery not
on price, product development, training of insurance personnel and strict adherence to
the rule of law.
4.4.6 Politics/Government/Power of other Stakeholders
Politics, Government policies and other stakeholders plays big role in the industry and
forms the modification in the porters‟ five forces model hence referred to as the sixth
force. While government enact rules and regulations for insurance industry, other
stakeholders like trade unions and lobby groups exert pressure on insurance
companies. Information technology is very detrimental in shaping the industry
destiny and politics of the day dictates a lot on how insurance companies conduct
their business. In order to gauge susceptibility of insurance companies to other
stakeholders, the researcher sought to know how many insurance companies have
their staff as members of trade unions and results were as in the tables below.
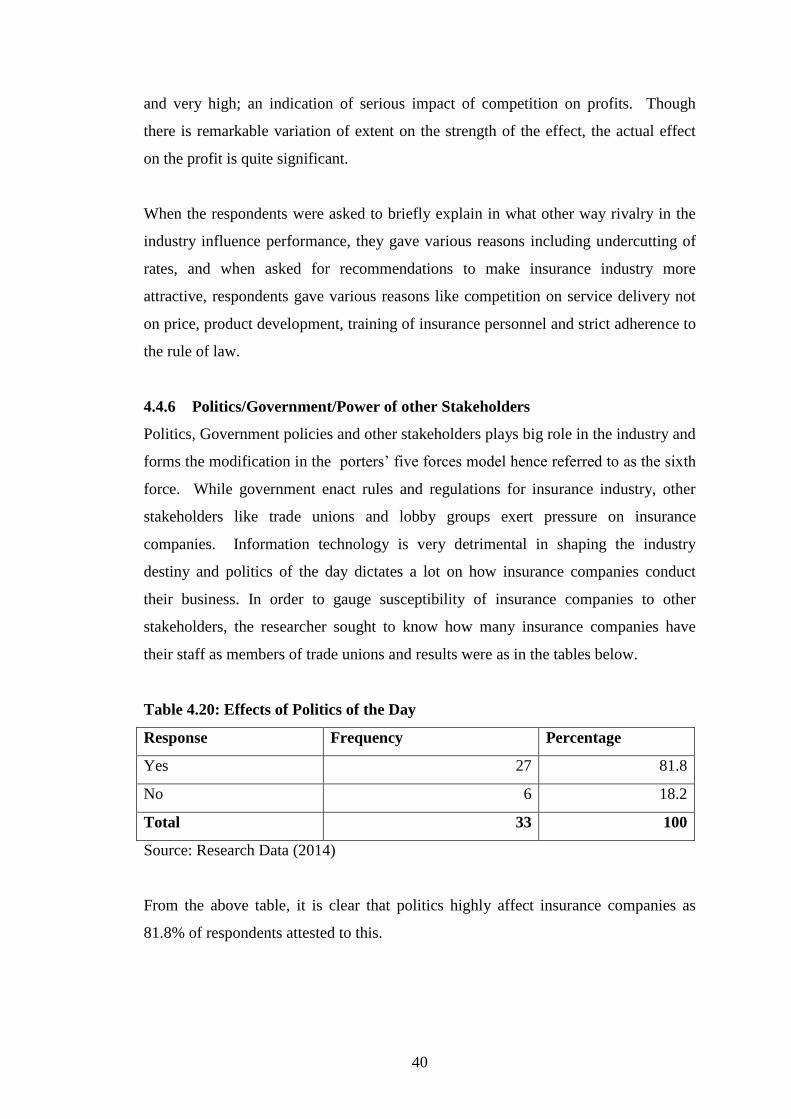
Table 4.20: Effects of Politics of the Day
Response Frequency Percentage
Yes 27 81.8
No 6 18.2
Total 33 100
Source: Research Data (2014)
From the above table, it is clear that politics highly affect insurance companies as
81.8% of respondents attested to this.
41
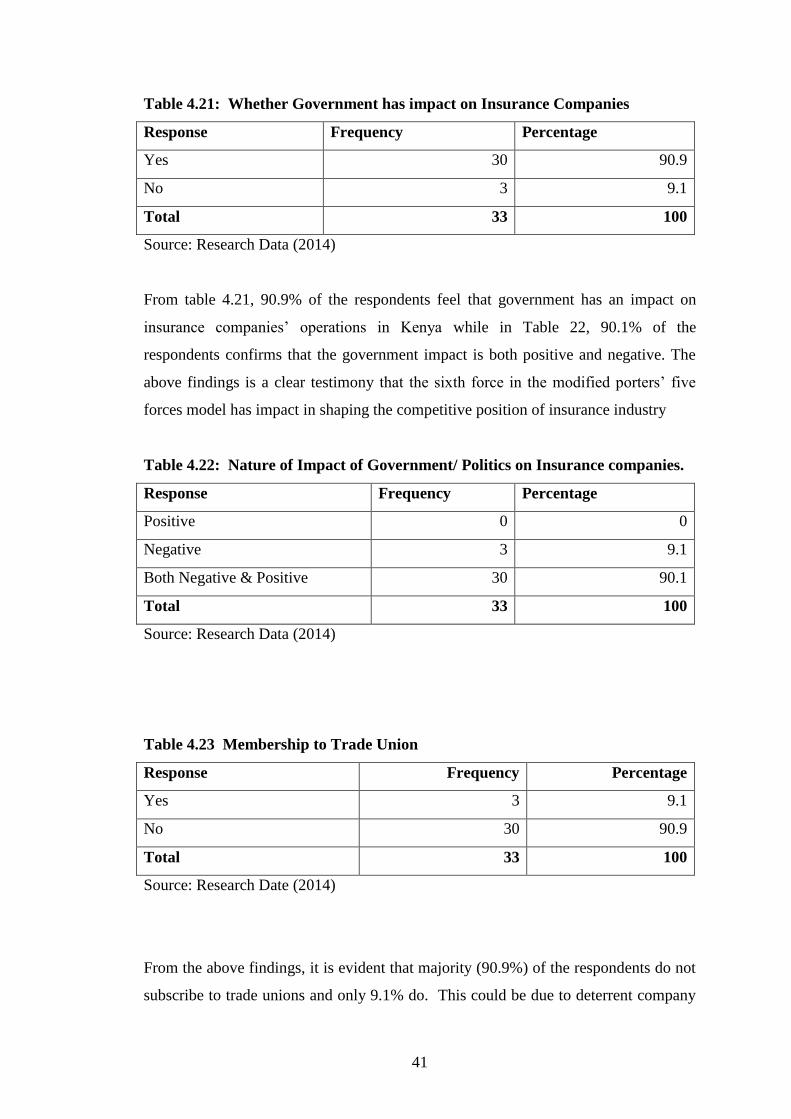
Table 4.21: Whether Government has impact on Insurance Companies
Response Frequency Percentage
Yes 30 90.9
No 3 9.1
Total 33 100
Source: Research Data (2014)
From table 4.21, 90.9% of the respondents feel that government has an impact on
insurance companies‟ operations in Kenya while in Table 22, 90.1% of the
respondents confirms that the government impact is both positive and negative. The
above findings is a clear testimony that the sixth force in the modified porters‟ five
forces model has impact in shaping the competitive position of insurance industry
Table 4.22: Nature of Impact of Government/ Politics on Insurance companies.
Response Frequency Percentage
Positive 0 0
Negative 3 9.1
Both Negative & Positive 30 90.1
Total 33 100
Source: Research Data (2014)
Table 4.23 Membership to Trade Union
Response Frequency Percentage
Yes 3 9.1
No 30 90.9
Total 33 100
Source: Research Date (2014)
From the above findings, it is evident that majority (90.9%) of the respondents do not
subscribe to trade unions and only 9.1% do. This could be due to deterrent company
42
policies or general fair treatment to the extent that staff do not perceive viability of
unionism. The research further intended to establish the extent to which the above
stakeholders affect operation of insurance companies in Kenya. The findings are as
shown in table 4.24.
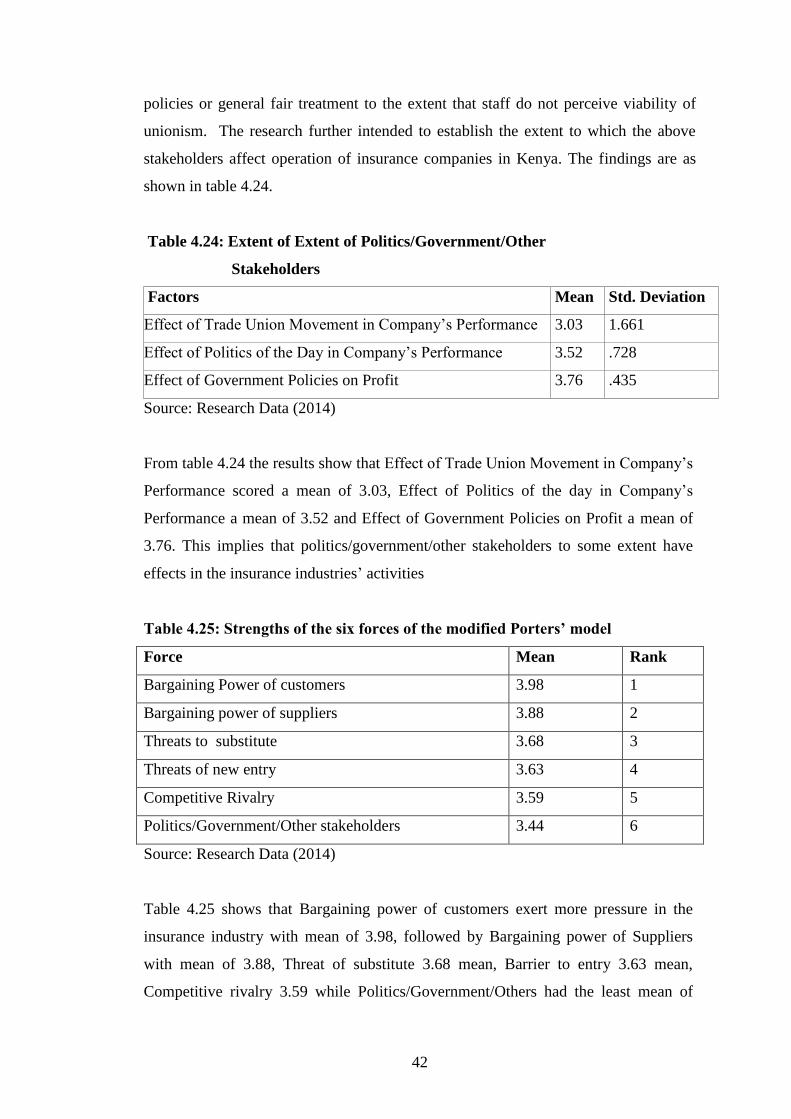
Table 4.24: Extent of Extent of Politics/Government/Other
Stakeholders
Factors Mean Std. Deviation
Effect of Trade Union Movement in Company‟s Performance 3.03 1.661
Effect of Politics of the Day in Company‟s Performance 3.52 .728
Effect of Government Policies on Profit 3.76 .435
Source: Research Data (2014)
From table 4.24 the results show that Effect of Trade Union Movement in Company‟s
Performance scored a mean of 3.03, Effect of Politics of the day in Company‟s
Performance a mean of 3.52 and Effect of Government Policies on Profit a mean of
3.76. This implies that politics/government/other stakeholders to some extent have
effects in the insurance industries‟ activities
Table 4.25: Strengths of the six forces of the modified Porters’ model
Force Mean Rank
Bargaining Power of customers 3.98 1
Bargaining power of suppliers 3.88 2
Threats to substitute 3.68 3
Threats of new entry 3.63 4
Competitive Rivalry 3.59 5
Politics/Government/Other stakeholders 3.44 6
Source: Research Data (2014)
Table 4.25 shows that Bargaining power of customers exert more pressure in the
insurance industry with mean of 3.98, followed by Bargaining power of Suppliers
with mean of 3.88, Threat of substitute 3.68 mean, Barrier to entry 3.63 mean,
Competitive rivalry 3.59 while Politics/Government/Others had the least mean of

43
3.44. This implies that customers still have the strongest powers in influencing the
Insurance industry and should therefore be treated with great care.
44
CHAPTER FIVE
SUMMARY, CONCLUSION AND RECOMMEDATIONS
5.1 Introduction
The prime objective of the study was to apply the modified porters five forces in
assessing attractiveness of insurance industry in Kenya. This chapter mainly
summarizes the findings, draws conclusions, highlights limitations of the study and
makes viable recommendations as guided by the research findings. Data was collected
by use of structured questionnaire which was developed in line with objectives of the
study. A programme Statistics for Practice of Social and Science ( SPSS) was used to
produce the results. Analysis and presentations were done using frequencies,
percentages, mean scores and standard deviation which were found to be suitable for
the type of analysis required.
5.2 Summary
Industry can be described to be attractive based on various factors but majorly on
profit margins. The business world will only venture into an industry after thorough
scrutiny of level of industry attractiveness. However, the porters five forces model,
which the study adopted, with modifications as the sixth force, have been a viable
strategic framework by which attempt is made to predict how an industry behaves,
grows and responds within a competitive environment. The forces include Threat of
substitute product or service, Threat of new entrants, Rivalry among existing firms,
Bargaining powers of suppliers, Bargaining power of buyers, Government and Others.
The research findings were varied for each force but also with a lot of similarity in
trends.
Results showed that Politics/Government was a minimal force with a mean of 3.44,
Industry rivalry 3.59, Barrier to entry 3.63, Threat of substitutes 3.68, bargaining
power of suppliers 3.88, and finally bargaining power of buyers 3.98. From the above
results, it is evident that all the forces are above average ( 3.00) and therefore plays a
great role in influencing competition in the industry.
45
Presence of Substitute Suppliers Scored a mean of 4.24, Supplier concentration 3.73,
impact of supplier on cost 3.97, supplier difference 3.48 and Importance of Volume of
business to the suppliers mean of 3.97 On the determinants, presence of substitute
suppliers rank high as determinant with a total of 90.9% of respondents falling on
average and above. Determinants like suppliers concentration impact of suppliers on
cost and importance of volume of business stand out to be fairly strong determinants
with over 50% of respondents. However, impact of supplier differences as a
determinant is average with up to 72%. In overall, power of suppliers over insurance
companies is revealed to be average with 63.6% of the respondents. Findings on
bargaining power of customers/buyers revealed that in overall, buyers of insurance
products hold a lot of powers over the insurance companies with 36% acknowledging
that its high and 45.4% as fairly high. For power of insurance companies over their
customers, the scale oscillates on the reverse with a whopping 63.6% of respondents
choosing between fairly low and average.
The above finding sends a strong message to product development managers who
must consider the feeling of customers before producing, packing, pricing and finally
selling. On effect on profitability, effect of customers is manifested at varying levels
with 45.4% of respondents saying its high and 36.4% feeling that its fairly high.
Here, customers came out to be the reigning king. Regarding determinants of buyers
bargaining powers, all are fairly high, a clear indication that all substantially
determine the customer bargaining power. Determinants like buyer volume, buyer
information about actual market price and substitute product are so strong that every
strategist needs to greatly consider them when formulating competitive market
strategies.
Findings regarding threat of new entrants/barrier to entry had a different outcome with
that of buyers powers. Here distribution of respondents is fairly even. The
determinant factors are fairly average with exception of the likes of capital
requirement, government regulation and brand identity to be fairly high. On the effect
of new entrants on existing companies, the finding reveal that the effect is average.
This means that new entrants do not pose such a strong threat to the existing industry
players. Industry growth and high profitability were found to be the leading entry
drives followed by affordable capital and availability of affordable manpower.
46
However, majority of entry barriers presented for studies were found to be strong; like
government regulations. Threat of substitutes was studied and findings revealed that
45.4% of the respondents felt that the effect on companies‟ profitability is moderate
while 18.2% felt is was very high. It could therefore be concluded that substitutes has
averagely moderate effect on companies profit. Major determinants of threat of
substitutes were listed and respondents gave general verdict. All the factors are
determinant of threat of substitute but some factors like relative quality of substitute,
relative price and ready availability of substitutes are strong determinants. From the
research findings, it was revealed that substitutes have moderate effect (63.6%) on
companies profitability. In general, threat of substitutes is a contending competitive
force in the insurance industry with potential to shape competitive strategy of the
industry players
Study on rivalry among existing firms revealed that all determinants of rivalry are
neither low of high motivators but moderate. This means that competition in
insurance is not a fierce cut throat as people would believe, players are not on a strong
serious competitive war. However, determinants like prices, industry growth and
number and size of firms exert more pressure as motivators of competitive rivalry.
But respondents indicated the above with a lot f variance. Competitive rivalry was
also found to negatively impact on insurance companies‟ profitability with up to
36.4% of respondents acknowledging it is very high. When respondents were asked
to gauge the intensity of competition in the insurance industry, 63.6% felt it is very
high and 27.3% felt it is high with only 9.1 feeling its average. This over-shadows the
revelation by determinants. In general therefore, competition intensity in Kenya
insurance industry is quite high and mainly fought on the basis of price.
The sixth force under the study is a category of factors which are sometimes referred
to as others. These include government, politics and power of other stake holders.
Effect of government policies highly affect operations of insurance companies with
up to 54.5% of respondents feeling the effect is high. This is felt through taxation,
fixing of premium rates, burning of night travels for public service vehicles and lack
of supervisory muscle and will to tame errand companies. Trade unionism was
observed to have minimal effects on insurance operations but effects of politics of the
day was recognized by majority of respondents, 90.1% of the respondents felt the
47
impact is both positive and negative. Political influence was felt by 81.8% of the
respondents with only 18.2% feeling free of political influence.
5.3 Conclusion
From the findings of the study, it was concluded that the insurance industry in
Kenya is growing and looks vibrant as perceived externally. However, from the
internal perceptive, the vibrancy and growth is dwarfed by the so many players
with fierce competition mainly based on pricing and lately product differentiation.
However, new entrants may not find it quite attractive due to strong internal
competitive rivalry.
Government policies, politics of the day and pressure from other stakeholders
affect insurance industry at varied degrees. Effect of stakeholders like trade
unions have mild effect while government policies and politics highly affect
operations of Kenyan insurance companies.
The determinants factors were meant to ascertain the extent to which a force has
an effect in shaping the competitive position of a company. It was found that most
of the determinants were moderate with a lot of variations. This means that
respondents had varied perception on determinants.
5.4 Limitations
The study faced limitations of various degrees and impact. First, the respondents were
chief executive officers and data was collected in the month of September and
October. It was as if fate conspired against the study as many of respondents were
found to be out of Nairobi on strategic meetings. Some simply felt that they did not
have time while others were in delegating to their deputies to handle. There was also
problem of time allocated for research. This became prominent because some
respondents were not co-operative. Costs was another hindrance as the data was to be
collected in Nairobi where all the chief executive officers are found. The researcher
together with assistants had to shift base and lodge in Nairobi for the period.
48
5.5 Recommendation
This study could probably be different if the target respondents were strategic or
business development managers. These group are mostly young, aggressive and hands
on specialization in market analysis unlike the chief executive offices who may be of
older generation with a laid back attitude. Most of them will find questionnaires to be
mind boggling.
Linkert scale has some weaknesses, other researches could be done using other tools.
Insurance Regulatory Authority (IRA) should not only enact rules and regulations but
must also ensure strict enforcement of the same. Insurance playing ground do not
seem to be levelled.
Insurance practitioners should move towards „Blue Ocean‟ principle and avoid
competition on price (premium rate). Instead of so many insurance companies for a
small economy like Kenya, the government should encourage mergers and also enact
favourable fiscal and monetary policies to protect and safeguard the industry.
Innovation, information technology and professional training should be upheld in the
industry.
5.6 Suggestion for Policy and Practices
The Government should legislate laws to seal loop holes being exploited by the
unscrupulous public to fleece insurance companies. There should be structured
compensation index depending on extent of injury and at what part of the body, not to
leave it at the whims of the bar and the bench. Besides Work Injury Benefits and
Motor Third Party Insurance which are compulsory, more other critical classes like
trade risks insurance should be made compulsory to ensure business security and
boost penetration which is now at a paltry 3.4%
5.7 Suggestion for further Studies
The study recommends that further research should be done on the Modified Porter‟s
five forces model so as to assess attractiveness of insurance industry in East and
Central African region given that regionalization is the way to go
49
REFERENCE
Ansoff, H.I. (1965), Corporate Strategy, London: London: Penguin
Ansoff, I. & McDonell, E. (1990). Implanting Strategy Management , 2nd
Edition.UK: Prentice Hall.
Aosa, E. (1997), Contextual Influence on Strategic Planning: Porter‟s Industry
. in the Kenyan Setting. Moi University Business Journal, Issue 1, Vol. 1, Pp.
4-5.
Austin, J. (1991) The Boundaries of Business: The Developing Country Difference
Harvard Business Review, July-Aug. 1991 Pp. 134-137.
Burns, B (2000), Managing Changes: A Strategic Approach to Organizational
Dynamics, 3rd
Edition, Prentice Hall
Cole G. A. Strategic Management Theory and Practice; 2nd
Edition South-Western
Grant, R. N. (2000). Contemporary Strategic Analysis, Concepts, Techniques,
Applications, 3rd
Edition, Massachusetts: Blackwell Publishers.
Hax, A.C. & Majluf, N.S.(1996) The strategy concept and process. A
Pragmatic approach; 2nd
Edition
Hussey, D. E. (1990), Development in Strategic Management in Hussey D. E
(ed), International Review of Strategic Management, John Wiley and
Sons, Vol 1.
Johnson G & Scholar K (2002) Exploring Corporate Strategy 6th
Edition,
Prentice Hall, NS, USA.
Johnson G. & Scholes K. (1999). Exploring Corporate Strategy. 5th
Edition, New
Delhi: Prentice Hall.
Lengopito F.D.(2004), Strategic responses to increased competition in the
Healthcare Industry. Unpublished MBA project, University of Nairobi
Kibera, F. (1996) Introduction to Business: A Kenyan Perspective (Editor):
Nairobi: Kenya Litrerature Bureau.
Pearce (11) J. A. and Robinson (Jr.) R. B. (1991). Strategic Management;
Formulation, Implementation and Control, 4th
Edition, USA: Richard D.
Irwin.
Kothari, C. R. (2004). Research method, 2nd
Edition, New Delhi: New age
international (p) Ltd.
50
Kotler, P. (1998), Marketing Management: Analysis, Planning, Implementation and
Control, Prentice Hall of India.
Mintzberg, H.(1994), The Rise and Fall of Strategic Planning: Reconceiving Roles
for Planning, Plans, Planners. New York: Free Press.
Mogeni K. (2008). Responses to competition by Kisii Bottlers Ltd. Unpublished MBA
Thesis, UON.
Muchiri, C. A. (2008). The application of Porter’s five forces model in assessing the
attractiveness of the mailing industry in Kenya. Unpublished MBA Thesis,
UON.
Mwarania J. M. (2003) Response by Reinsurance Companies in Kenya to Changes in
the Environment. The Case of Kenya Re. Unpublished MBA Project,
University of Nairobi.
Nachmias V. F. and Nachmias, D. (1996) Research Methods in the Social Sciences,
5th
Edition
Nyale, M. N. (2007), Structural and Competitive Analysis of the Mobile Telephony
Industry in Kenya: An Application of Porter‟s Five Forces Model”,
Unpublished MBA Project, University of Nairobi, School of Business.
Oluoch, J. (2003), A Survey of the Perceived Attractiveness in the Freight
Forwarding Industry. An Application of Porters Modified Model”,
Unpublished MBA Research Project, University of Nairobi, Nairobi, Kenya
Porter, M. E. (1980) Competitive Strategy: Techniques for Analyzing Industries
and Competitors. New York: Free Press.
Pearce J. A. (II) and Robinson R. B. (Jr), (1997), Strategic Management:
Formulation,
Implementation, and Control, Irwin McGraw-Hill, Boston, USA.
Porter, M. E. (1979), How Competitive Forces Shape Strategy, Harvard Business
Review, 57(2), March-April.
Porter, M. E. (1980), Competitive Strategy, Free Press, New York, NY.
Porter, M. E. (2008), The Five Competitive Forces that Shape Strategy, Harvard
Business Review, Pp. 79-93.
51
Schandol, D. E., & Hofer, C. W. (1979). Research Needs and Issues in Strategic
Management (Eds.1979).
Tanui J. K. (2008) Strategic Response to Increased Competitive Challenges in
the Telecommunications Industry in Kenya: A case of Telkom Kenya
Limited, Unpublished MBA Project, University of Nairobi.
Thompson A. A. Jr & Strickland III A. J.(1993) Strategic Management Concepts
and Cases: Mc Graw-Hill.
G. Hamel and CK prahalad. Strategy as stretch and leverage.
Waithaka W. (2001), An Analysis of the Funeral Industry in Kenya, Unpublished
MBA Research Project, University of Nairobi, Nairobi, Kenya.
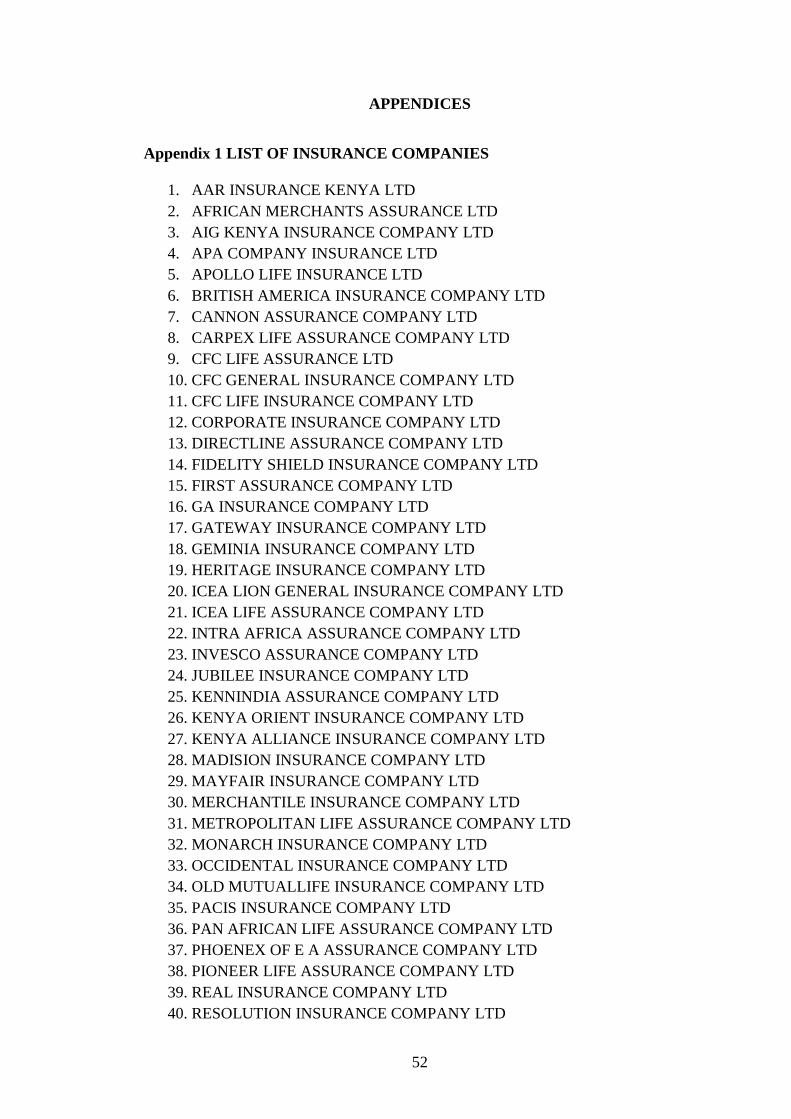
52
APPENDICES
Appendix 1 LIST OF INSURANCE COMPANIES
1. AAR INSURANCE KENYA LTD
2. AFRICAN MERCHANTS ASSURANCE LTD
3. AIG KENYA INSURANCE COMPANY LTD
4. APA COMPANY INSURANCE LTD
5. APOLLO LIFE INSURANCE LTD
6. BRITISH AMERICA INSURANCE COMPANY LTD
7. CANNON ASSURANCE COMPANY LTD
8. CARPEX LIFE ASSURANCE COMPANY LTD
9. CFC LIFE ASSURANCE LTD
10. CFC GENERAL INSURANCE COMPANY LTD
11. CFC LIFE INSURANCE COMPANY LTD
12. CORPORATE INSURANCE COMPANY LTD
13. DIRECTLINE ASSURANCE COMPANY LTD
14. FIDELITY SHIELD INSURANCE COMPANY LTD
15. FIRST ASSURANCE COMPANY LTD
16. GA INSURANCE COMPANY LTD
17. GATEWAY INSURANCE COMPANY LTD
18. GEMINIA INSURANCE COMPANY LTD
19. HERITAGE INSURANCE COMPANY LTD
20. ICEA LION GENERAL INSURANCE COMPANY LTD
21. ICEA LIFE ASSURANCE COMPANY LTD
22. INTRA AFRICA ASSURANCE COMPANY LTD
23. INVESCO ASSURANCE COMPANY LTD
24. JUBILEE INSURANCE COMPANY LTD
25. KENNINDIA ASSURANCE COMPANY LTD
26. KENYA ORIENT INSURANCE COMPANY LTD
27. KENYA ALLIANCE INSURANCE COMPANY LTD
28. MADISION INSURANCE COMPANY LTD
29. MAYFAIR INSURANCE COMPANY LTD
30. MERCHANTILE INSURANCE COMPANY LTD
31. METROPOLITAN LIFE ASSURANCE COMPANY LTD
32. MONARCH INSURANCE COMPANY LTD
33. OCCIDENTAL INSURANCE COMPANY LTD
34. OLD MUTUALLIFE INSURANCE COMPANY LTD
35. PACIS INSURANCE COMPANY LTD
36. PAN AFRICAN LIFE ASSURANCE COMPANY LTD
37. PHOENEX OF E A ASSURANCE COMPANY LTD
38. PIONEER LIFE ASSURANCE COMPANY LTD
39. REAL INSURANCE COMPANY LTD
40. RESOLUTION INSURANCE COMPANY LTD

53
41. SHIELD ASSURANCE COMPANY LTD
42. TAKATUI INSURANCE OF AFRICA LTD
43. TAUSI ASSURANCE COMPANY LTD
44. TRIDENT INSURANCE COMPANY LTD
45. UAP INSURANCE COMPANY LTD
46. UAP LIFE ASSURANCE COMPANY LTD
47. XPLICO INSURANCE COMPANY LTD
54
Appendix 11 – QUESTIONAIRE FOR BUSINESS EXECUTIVES.
I am a MBA Strategic Management student at the University of Nairobi. I have
witnessed collapse of many insurance firms and experienced the dynamics of the
industry. As part of the requirements for my project work I would wish to assess the
attractiveness of the insurance industry in Kenya by applying the Porters modified
Five Forces Model. This questionnaire is therefore purposely meant to gather the
relevant data for this noble goal.
Kindly assist by participating in answering the questions. The Information collected
will strictly be used for academic purposes only
Thank you in advance for your time and co-operation.
Regards,
Shariff Nhaaman.
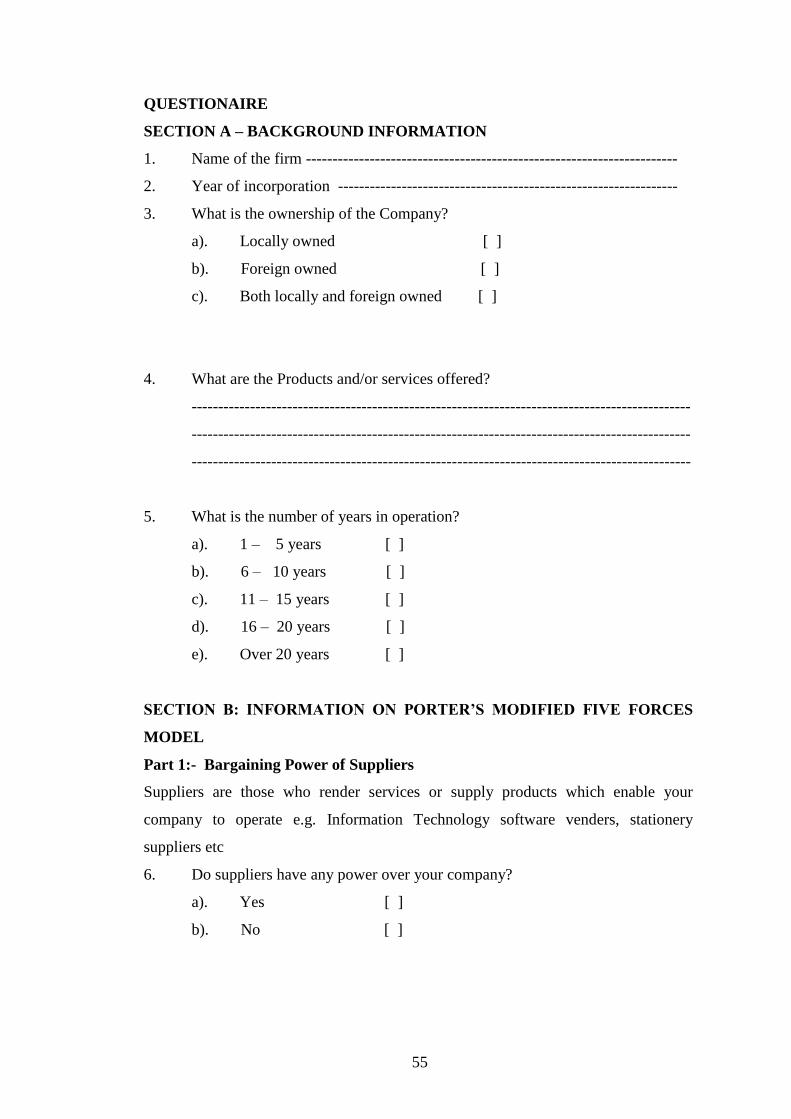
55
QUESTIONAIRE
SECTION A – BACKGROUND INFORMATION
1. Name of the firm ----------------------------------------------------------------------
2. Year of incorporation ----------------------------------------------------------------
3. What is the ownership of the Company?
a). Locally owned [ ]
b). Foreign owned [ ]
c). Both locally and foreign owned [ ]
4. What are the Products and/or services offered?
----------------------------------------------------------------------------------------------
----------------------------------------------------------------------------------------------
----------------------------------------------------------------------------------------------
5. What is the number of years in operation?
a). 1 – 5 years [ ]
b). 6 – 10 years [ ]
c). 11 – 15 years [ ]
d). 16 – 20 years [ ]
e). Over 20 years [ ]
SECTION B: INFORMATION ON PORTER’S MODIFIED FIVE FORCES
MODEL
Part 1:- Bargaining Power of Suppliers
Suppliers are those who render services or supply products which enable your
company to operate e.g. Information Technology software venders, stationery
suppliers etc
6. Do suppliers have any power over your company?
a). Yes [ ]
b). No [ ]
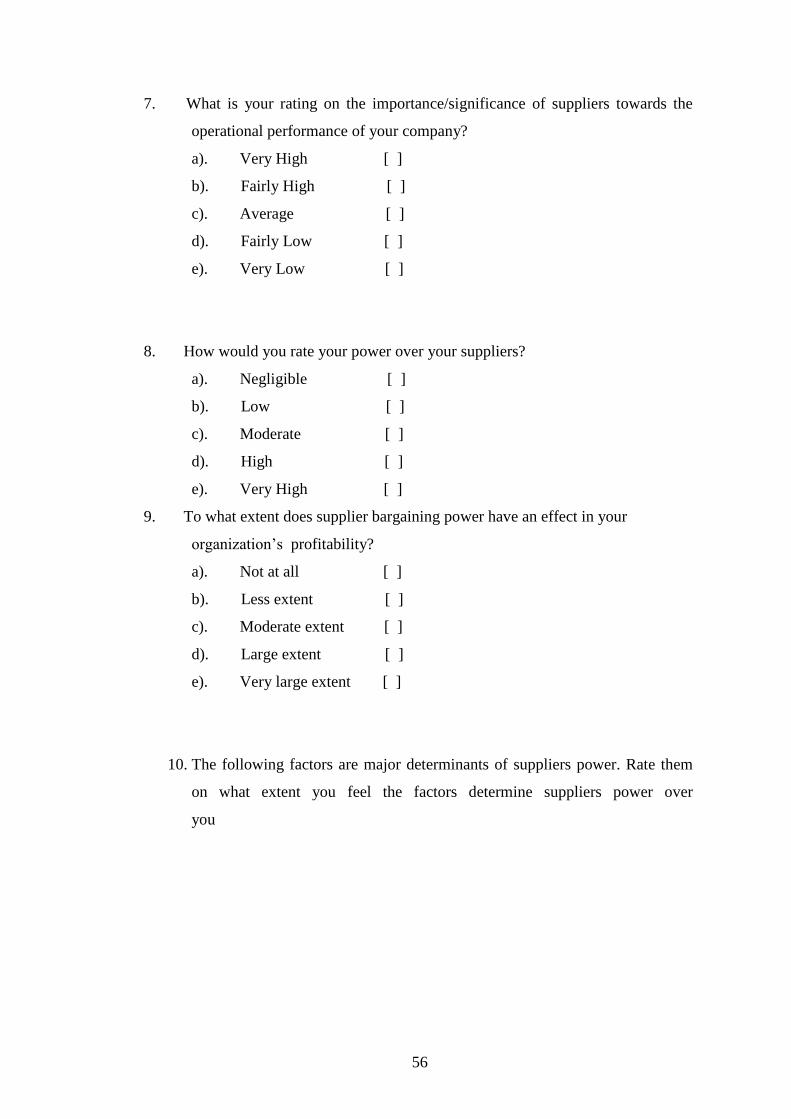
56
7. What is your rating on the importance/significance of suppliers towards the
operational performance of your company?
a). Very High [ ]
b). Fairly High [ ]
c). Average [ ]
d). Fairly Low [ ]
e). Very Low [ ]
8. How would you rate your power over your suppliers?
a). Negligible [ ]
b). Low [ ]
c). Moderate [ ]
d). High [ ]
e). Very High [ ]
9. To what extent does supplier bargaining power have an effect in your
organization‟s profitability?
a). Not at all [ ]
b). Less extent [ ]
c). Moderate extent [ ]
d). Large extent [ ]
e). Very large extent [ ]
10. The following factors are major determinants of suppliers power. Rate them
on what extent you feel the factors determine suppliers power over
you
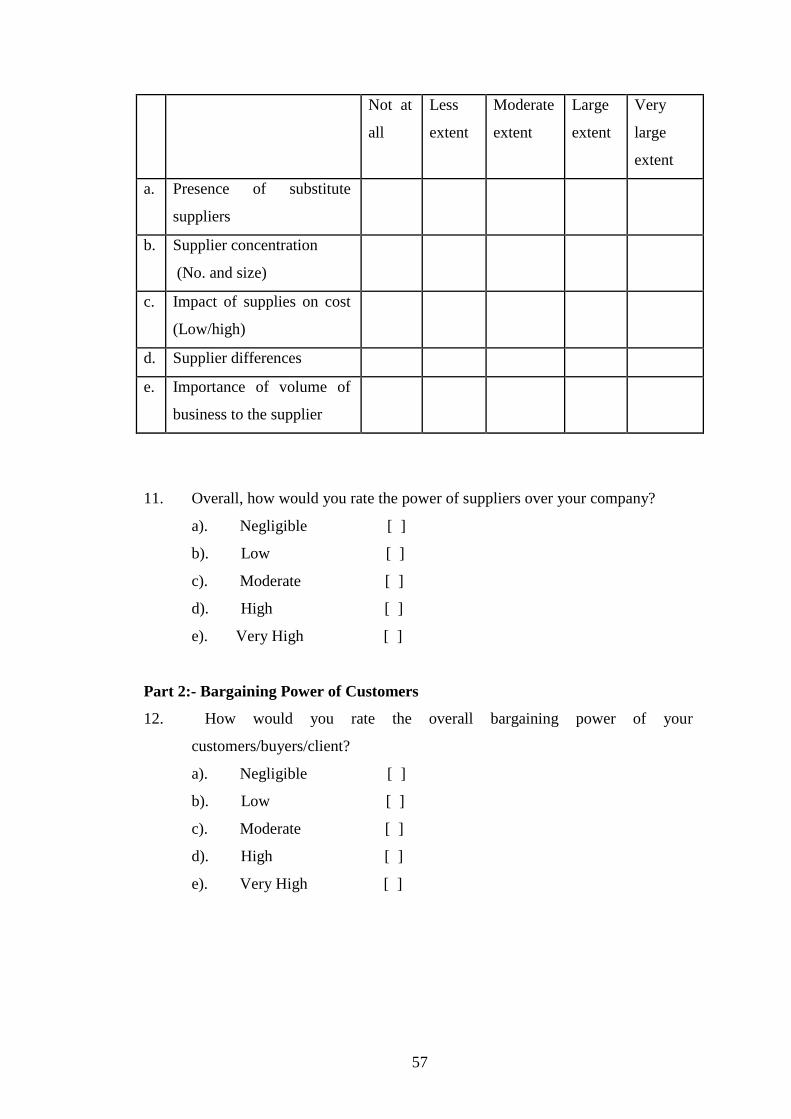
57
Not at
all
Less
extent
Moderate
extent
Large
extent
Very
large
extent
a. Presence of substitute
suppliers
b. Supplier concentration
(No. and size)
c. Impact of supplies on cost
(Low/high)
d. Supplier differences
e. Importance of volume of
business to the supplier
11. Overall, how would you rate the power of suppliers over your company?
a). Negligible [ ]
b). Low [ ]
c). Moderate [ ]
d). High [ ]
e). Very High [ ]
Part 2:- Bargaining Power of Customers
12. How would you rate the overall bargaining power of your
customers/buyers/client?
a). Negligible [ ]
b). Low [ ]
c). Moderate [ ]
d). High [ ]
e). Very High [ ]
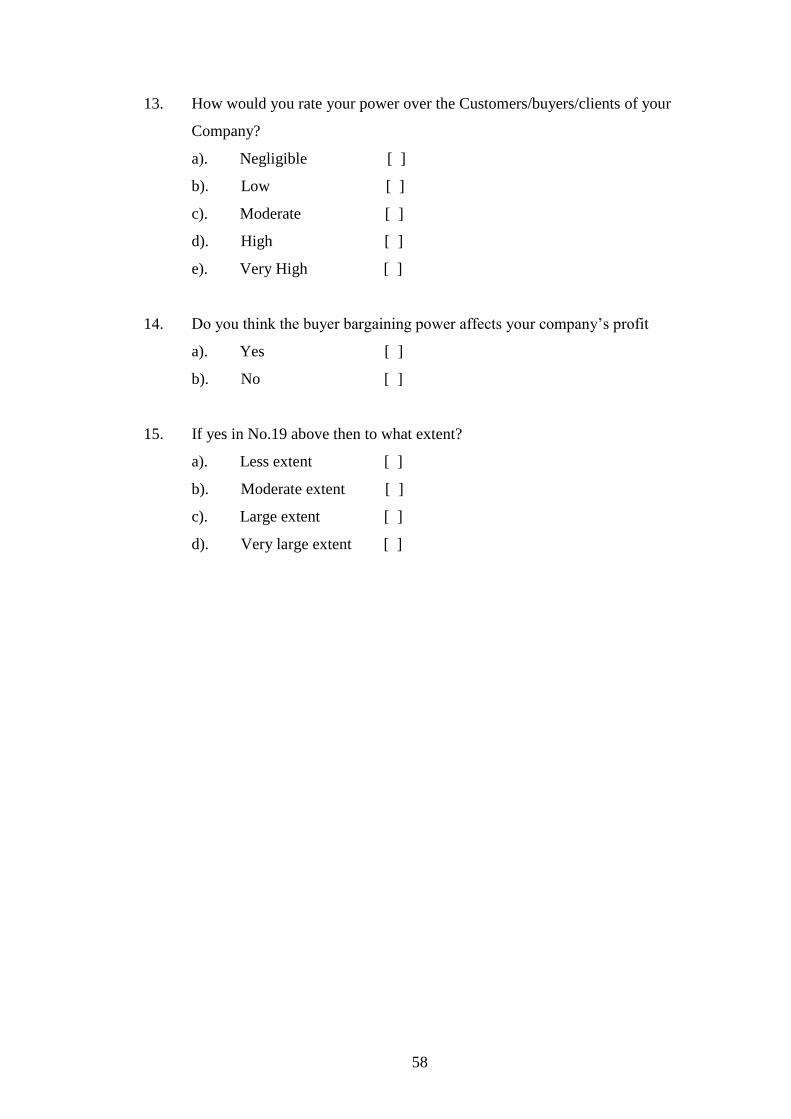
58
13. How would you rate your power over the Customers/buyers/clients of your
Company?
a). Negligible [ ]
b). Low [ ]
c). Moderate [ ]
d). High [ ]
e). Very High [ ]
14. Do you think the buyer bargaining power affects your company‟s profit
a). Yes [ ]
b). No [ ]
15. If yes in No.19 above then to what extent?
a). Less extent [ ]
b). Moderate extent [ ]
c). Large extent [ ]
d). Very large extent [ ]
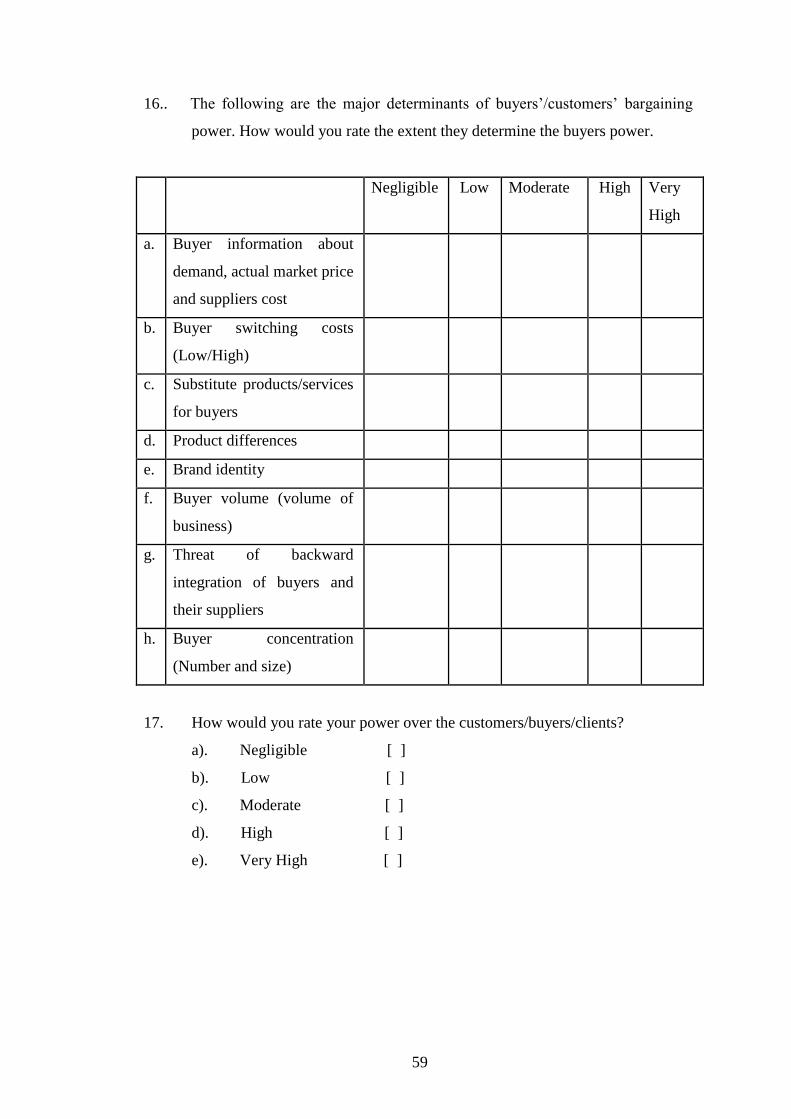
59
16.. The following are the major determinants of buyers‟/customers‟ bargaining
power. How would you rate the extent they determine the buyers power.
Negligible Low Moderate High Very
High
a. Buyer information about
demand, actual market price
and suppliers cost
b. Buyer switching costs
(Low/High)
c. Substitute products/services
for buyers
d. Product differences
e. Brand identity
f. Buyer volume (volume of
business)
g. Threat of backward
integration of buyers and
their suppliers
h. Buyer concentration
(Number and size)
17. How would you rate your power over the customers/buyers/clients?
a). Negligible [ ]
b). Low [ ]
c). Moderate [ ]
d). High [ ]
e). Very High [ ]
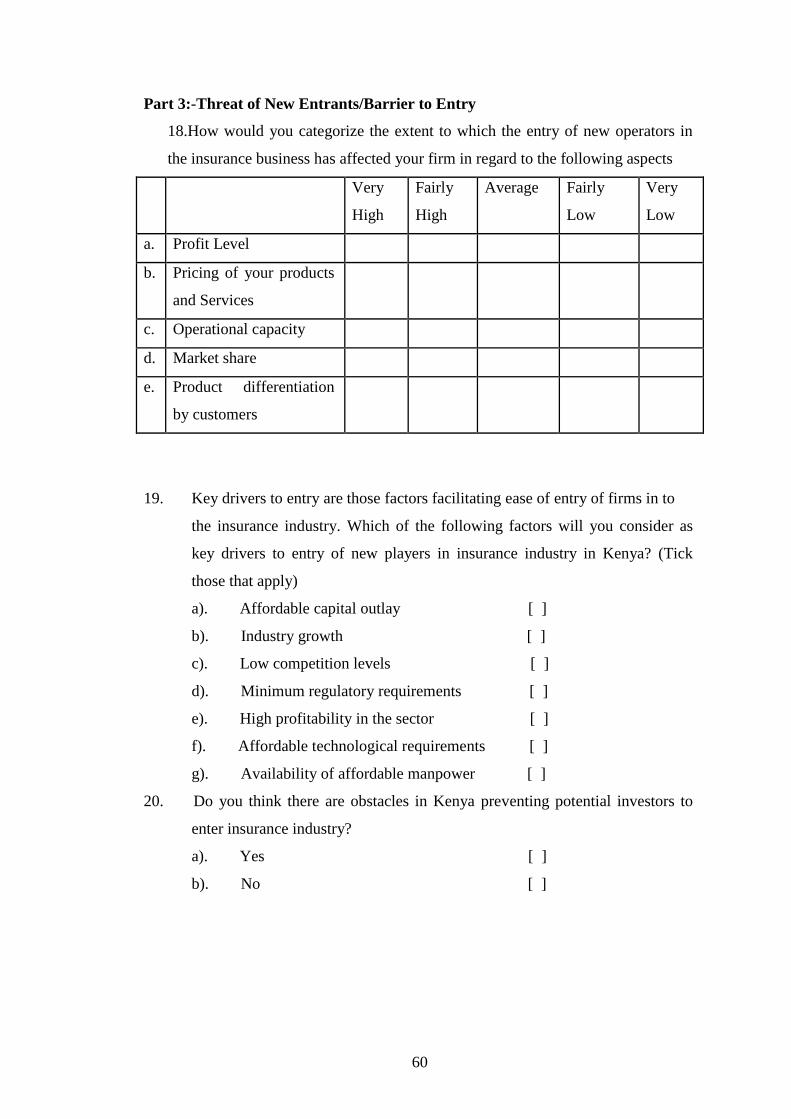
60
Part 3:-Threat of New Entrants/Barrier to Entry
18.How would you categorize the extent to which the entry of new operators in
the insurance business has affected your firm in regard to the following aspects
Very
High
Fairly
High
Average Fairly
Low
Very
Low
a. Profit Level
b. Pricing of your products
and Services
c. Operational capacity
d. Market share
e. Product differentiation
by customers
19. Key drivers to entry are those factors facilitating ease of entry of firms in to
the insurance industry. Which of the following factors will you consider as
key drivers to entry of new players in insurance industry in Kenya? (Tick
those that apply)
a). Affordable capital outlay [ ]
b). Industry growth [ ]
c). Low competition levels [ ]
d). Minimum regulatory requirements [ ]
e). High profitability in the sector [ ]
f). Affordable technological requirements [ ]
g). Availability of affordable manpower [ ]
20. Do you think there are obstacles in Kenya preventing potential investors to
enter insurance industry?
a). Yes [ ]
b). No [ ]
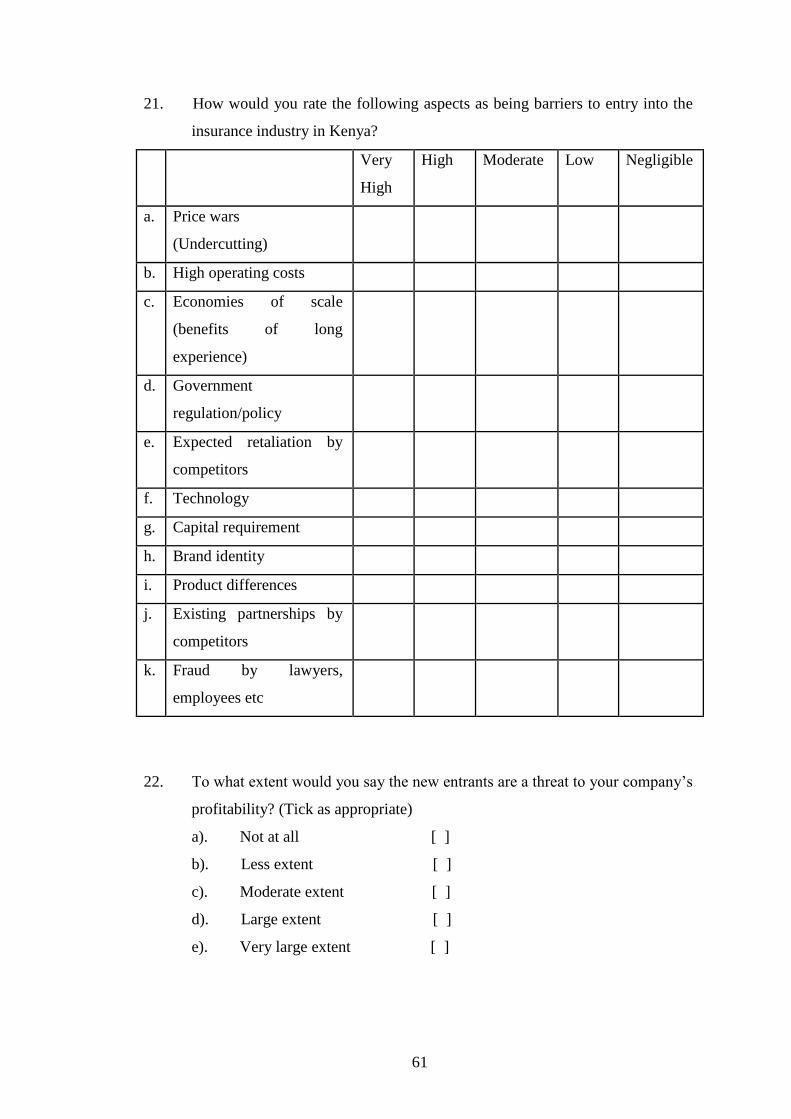
61
21. How would you rate the following aspects as being barriers to entry into the
insurance industry in Kenya?
Very
High
High Moderate Low Negligible
a. Price wars
(Undercutting)
b. High operating costs
c. Economies of scale
(benefits of long
experience)
d. Government
regulation/policy
e. Expected retaliation by
competitors
f. Technology
g. Capital requirement
h. Brand identity
i. Product differences
j. Existing partnerships by
competitors
k. Fraud by lawyers,
employees etc
22. To what extent would you say the new entrants are a threat to your company‟s
profitability? (Tick as appropriate)
a). Not at all [ ]
b). Less extent [ ]
c). Moderate extent [ ]
d). Large extent [ ]
e). Very large extent [ ]
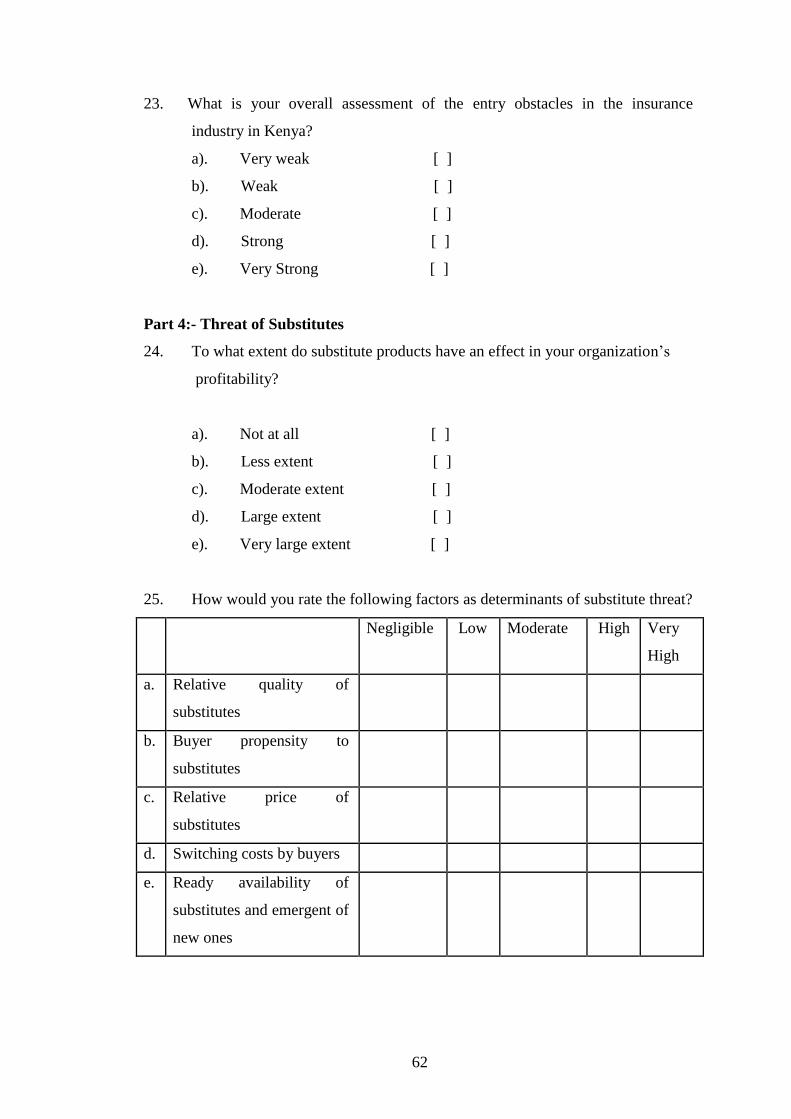
62
23. What is your overall assessment of the entry obstacles in the insurance
industry in Kenya?
a). Very weak [ ]
b). Weak [ ]
c). Moderate [ ]
d). Strong [ ]
e). Very Strong [ ]
Part 4:- Threat of Substitutes
24. To what extent do substitute products have an effect in your organization‟s
profitability?
a). Not at all [ ]
b). Less extent [ ]
c). Moderate extent [ ]
d). Large extent [ ]
e). Very large extent [ ]
25. How would you rate the following factors as determinants of substitute threat?
Negligible Low Moderate High Very
High
a. Relative quality of
substitutes
b. Buyer propensity to
substitutes
c. Relative price of
substitutes
d. Switching costs by buyers
e. Ready availability of
substitutes and emergent of
new ones
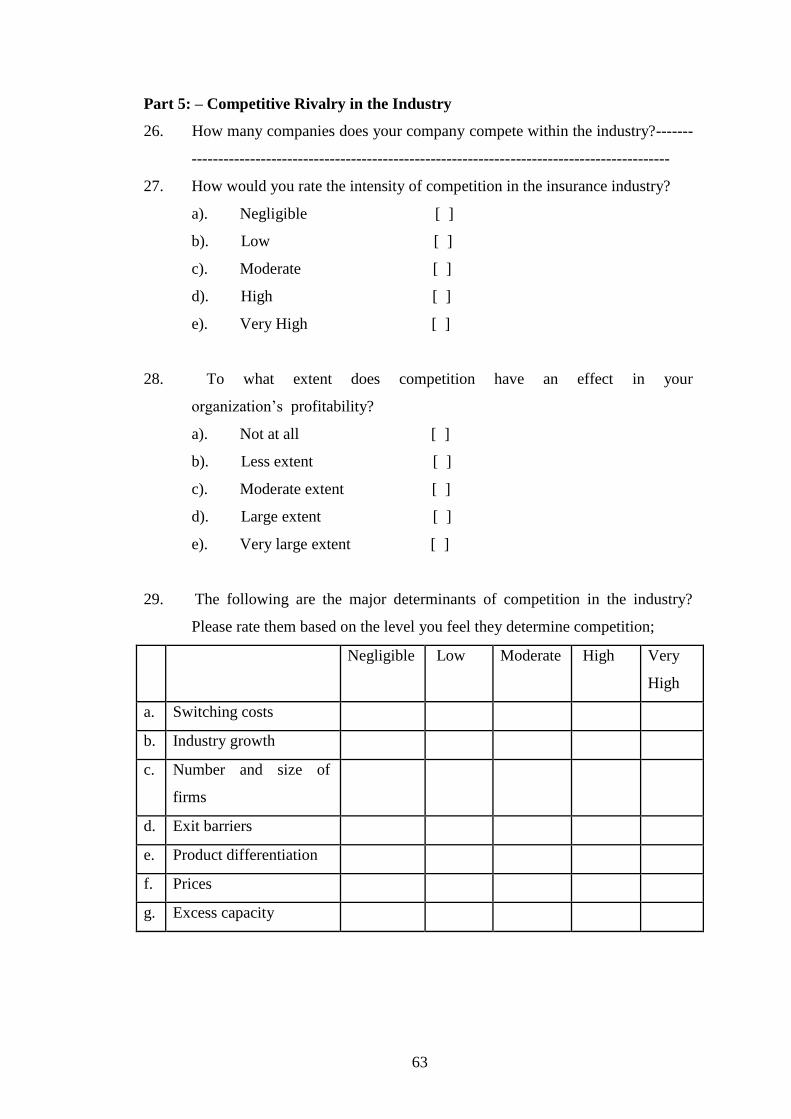
63
Part 5: – Competitive Rivalry in the Industry
26. How many companies does your company compete within the industry?-------
------------------------------------------------------------------------------------------
27. How would you rate the intensity of competition in the insurance industry?
a). Negligible [ ]
b). Low [ ]
c). Moderate [ ]
d). High [ ]
e). Very High [ ]
28. To what extent does competition have an effect in your
organization‟s profitability?
a). Not at all [ ]
b). Less extent [ ]
c). Moderate extent [ ]
d). Large extent [ ]
e). Very large extent [ ]
29. The following are the major determinants of competition in the industry?
Please rate them based on the level you feel they determine competition;
Negligible Low Moderate High Very
High
a. Switching costs
b. Industry growth
c. Number and size of
firms
d. Exit barriers
e. Product differentiation
f. Prices
g. Excess capacity
64
30. In what other ways does competitive rivalry in the industry influence
performance/growth of your firm?(Briefly explain) --------------------------------
----------------------------------------------------------------------------------------------
----------------------------------------------------------------------------------------------
31. What recommendations would you give to the insurance industry to make it
more attractive? --------------------------------------------------------------------------
----------------------------------------------------------------------------------------------
----------------------------------------------------------------------------------------------
----------------------------------------------------------------------------------------------
Part 6:– Politics/Government/Power of other stakeholder
32. Does your company staff subscribe to any trade unions?
a). Yes [ ]
b). No [ ]
33. How would you rate effects of trade union movement on your company‟s
performance?
a). No effect [ ]
b). Little effect [ ]
c). Moderate effect [ ]
d). Large effect [ ]
e). Very Large effect [ ]
34. Does politics of the day affect your company‟s performance?
a). Yes [ ]
b). No [ ]
35. If yes in 34 above then to what extent?
a). No effect [ ]
b). Less extent [ ]
c). Moderate extent [ ]
d). Large extent [ ]
e). Very Large extent [ ]
65
36. Does government policies have impact on your company‟s operations
a). Yes [ ]
b). No [ ]
37. If yes in 36 above then what is the nature of impact?
a). Positive [ ]
b). Negative [ ]
c). Both positive and negative [ ]
38. To what extent do you think the government‟s policies effect profit of your
company?
a). No effect [ ]
b). Less extent [ ]
c). Moderate extent [ ]
d). Large extent [ ]
e). Very Large extent [ ]
39. Which aspects of government‟s regulatory & supervisory roles affect your
company‟s profitability or operations? -----------------------------------------------
----------------------------------------------------------------------------------------------
----------------------------------------------------------------------------------------------
40. What recommendations would you make to the government of Kenya in
regard to improving the insurance industry? ----------------------------------------
----------------------------------------------------------------------------------------------
----------------------------------------------------------------------------------------------
----------------------------------------------------------------------------------------------
Thank you very much for your time and Patience. Be blessed

0