Application of metabolome data in functional genomics: A conceptual strategy
9
Metabolic Engineering 7 (2005) 302–310 Application of metabolome data in functional genomics: A conceptual strategy Liang Wu , Wouter A. van Winden, Walter M. van Gulik, Joseph J. Heijnen Department of Biotechnology, Delft University of Technology, Julianalaan 67, 2628 BC, Delft, The Netherlands Received 19 October 2004; received in revised form 11 May 2005; accepted 17 May 2005 Available online 25 July 2005 Abstract A gene with yet unknown physiological function can be studied by changing its expression level followed by analysis of the resulting phenotype. This type of functional genomics study can be complicated by the occurrence of ‘silent mutations’, the phenotypes of which are not easily observable in terms of metabolic fluxes (e.g., the growth rate). Nevertheless, genetic alteration may give rise to significant yet complicated changes in the metabolome. We propose here a conceptual functional genomics strategy based on microbial metabolome data, which identifies changes in in vivo enzyme activities in the mutants. These predicted changes are used to formulate hypotheses to infer unknown gene functions. The required metabolome data can be obtained solely from high- throughput mass spectrometry analysis, which provides the following in vivo information: (1) the metabolite concentrations in the reference and the mutant strain; (2) the metabolic fluxes in both strains and (3) the enzyme kinetic parameters of the reference strain. We demonstrate in silico that changes in enzyme activities can be accurately predicted by this approach, even in ‘silent mutants’. r 2005 Elsevier Inc. All rights reserved. Keywords: Functional genomics; Metabolome; Silent mutations; Lin-log kinetics; Mass spectrometry; Flux analysis; Elasticity 1. Introduction The increasing availability of whole-genome data is paralleled by an ever increasing number of genes with unknown function, urging both the development and integration of functional genomics strategies (Oliver et al., 1998). Gene functions can be inferred from a variety of data sources, obtained at the level of genome, transcriptome, proteome and metabolome (Castrillo and Oliver, 2004). Among these ‘omics’-approaches, metabolomics aims at the comprehensive analysis of all metabolites (Fiehn, 2002). The metabolome possesses the advantages of being closely related to phenotypes and being more context-dependent. Furthermore, metabolome analysis can be easily extended to different organisms, since a metabolite has the same chemical structure across all species (Goodacre et al., 2004). The application of metabolome data in functional genomics was initiated by the FANCY approach (Raamsdonk et al., 2001), based on the idea that genetic alterations often lead to significant changes in metabolite concentrations, even in ‘silent mutations’ with no clear flux-phenotypes (e.g., the growth rate). Thus, FANCY suggests gene functions by comparing metabolome profiles of strains deleted for known and unknown genes with multivariate analysis, hereby making use of the ‘guilt by association’ assump- tion. In a similar way, metabolite profiling combined with multivariate statistics has been successfully applied to genotype differentiation in plants and fungi (Allen et al., 2003; Fiehn et al., 2000; Smedsgaard and Nielsen, 2005). Next to multivariate data analysis, Foster et al. (2002) proposed a framework to identify gene functions in single deletion mutants by combining metabolome data with in silico pathway analysis. One of the major disadvantages of applying metabo- lome data in functional genomics is that multiple ARTICLE IN PRESS www.elsevier.com/locate/ymben 1096-7176/$ - see front matter r 2005 Elsevier Inc. All rights reserved. doi:10.1016/j.ymben.2005.05.003 Corresponding author. E-mail address: [email protected] (L. Wu).
Transcript of Application of metabolome data in functional genomics: A conceptual strategy
ARTICLE IN PRESS
1096-7176/$ - se
doi:10.1016/j.ym
�CorrespondE-mail addr
Metabolic Engineering 7 (2005) 302–310
www.elsevier.com/locate/ymben
Application of metabolome data in functional genomics:A conceptual strategy
Liang Wu�, Wouter A. van Winden, Walter M. van Gulik, Joseph J. Heijnen
Department of Biotechnology, Delft University of Technology, Julianalaan 67, 2628 BC, Delft, The Netherlands
Received 19 October 2004; received in revised form 11 May 2005; accepted 17 May 2005
Available online 25 July 2005
Abstract
A gene with yet unknown physiological function can be studied by changing its expression level followed by analysis of the
resulting phenotype. This type of functional genomics study can be complicated by the occurrence of ‘silent mutations’, the
phenotypes of which are not easily observable in terms of metabolic fluxes (e.g., the growth rate). Nevertheless, genetic alteration
may give rise to significant yet complicated changes in the metabolome. We propose here a conceptual functional genomics strategy
based on microbial metabolome data, which identifies changes in in vivo enzyme activities in the mutants. These predicted changes
are used to formulate hypotheses to infer unknown gene functions. The required metabolome data can be obtained solely from high-
throughput mass spectrometry analysis, which provides the following in vivo information: (1) the metabolite concentrations in the
reference and the mutant strain; (2) the metabolic fluxes in both strains and (3) the enzyme kinetic parameters of the reference strain.
We demonstrate in silico that changes in enzyme activities can be accurately predicted by this approach, even in ‘silent mutants’.
r 2005 Elsevier Inc. All rights reserved.
Keywords: Functional genomics; Metabolome; Silent mutations; Lin-log kinetics; Mass spectrometry; Flux analysis; Elasticity
1. Introduction
The increasing availability of whole-genome data isparalleled by an ever increasing number of genes withunknown function, urging both the development andintegration of functional genomics strategies (Oliveret al., 1998). Gene functions can be inferred from avariety of data sources, obtained at the level of genome,transcriptome, proteome and metabolome (Castrilloand Oliver, 2004).Among these ‘omics’-approaches, metabolomics aims
at the comprehensive analysis of all metabolites (Fiehn,2002). The metabolome possesses the advantages ofbeing closely related to phenotypes and being morecontext-dependent. Furthermore, metabolome analysiscan be easily extended to different organisms, since ametabolite has the same chemical structure across all
e front matter r 2005 Elsevier Inc. All rights reserved.
ben.2005.05.003
ing author.
ess: [email protected] (L. Wu).
species (Goodacre et al., 2004). The application ofmetabolome data in functional genomics was initiatedby the FANCY approach (Raamsdonk et al., 2001),based on the idea that genetic alterations often lead tosignificant changes in metabolite concentrations, even in‘silent mutations’ with no clear flux-phenotypes (e.g., thegrowth rate). Thus, FANCY suggests gene functions bycomparing metabolome profiles of strains deleted forknown and unknown genes with multivariate analysis,hereby making use of the ‘guilt by association’ assump-tion. In a similar way, metabolite profiling combinedwith multivariate statistics has been successfully appliedto genotype differentiation in plants and fungi (Allenet al., 2003; Fiehn et al., 2000; Smedsgaard and Nielsen,2005). Next to multivariate data analysis, Foster et al.(2002) proposed a framework to identify gene functionsin single deletion mutants by combining metabolomedata with in silico pathway analysis.One of the major disadvantages of applying metabo-
lome data in functional genomics is that multiple
ARTICLE IN PRESSL. Wu et al. / Metabolic Engineering 7 (2005) 302–310 303
changes in the metabolome are only indirectly related togenetic alterations. Instead, they arise directly due tochanges in enzyme activity (i.e., the in vivo maximumcatalytic capacity of an enzyme) and kinetic enzyme–metabolite interactions, the latter often extremelycomplex. Hence, metabolome data as such do notprovide a straightforward insight in gene function,which necessitates data-driven approaches, such asFANCY. To enable an abductive and more focusedanalysis, it would be desirable to access enzyme activitychanges, which are indicative of either direct or indirect,regulatory effects of the altered gene and bear a closerlink to its function. Quantitative proteome analysis hasindeed been an integral part of functional genomicsinvestigations in perturbed metabolic networks (Baligaet al., 2002; Dainese et al., 1997; Haurie et al., 2001;Ideker et al., 2001; Knowles et al., 2003). However, theapplied techniques focus primarily on protein abun-dance instead of enzyme activities in vivo; hence, theyoverlook possible intracellular regulatory mechanisms(Kobe and Kemp, 1999).In this paper, we develop a conceptual functional
genomics strategy, which uses metabolome data only.Unlike the FANCY approach that compares themetabolome data of different strains and suggestsunknown gene functions following the ‘guilt by associa-tion’ principle, our approach utilizes metabolome datato calculate the relative changes in in vivo enzymeactivities in the mutant relative to a reference (e.g., awild type), thereby making use of a quantitative kineticmodel. These predicted changes reveal the site(s) ofaction of the altered gene and are essential to generatesound hypotheses regarding its function, which can bedelineated with further experimental investigation. Themerit of this strategy is demonstrated with an in silicocase study.
2. Concept of the approach
To calculate in vivo enzyme activity changes, weexploit enzyme kinetics that defines the flux (vi) throughan enzyme i as a nonlinear function of enzyme activity(ei) and metabolite concentrations (x):
vi ¼ f iðei;x;PÞ. (1)
The in vivo enzyme activity can be thus calculatedfrom Eq. (1) when metabolite concentrations, fluxes anda set of kinetic parameters P are obtained in vivo, in asuitable kinetic format given by fi.The kinetic format can be mechanistic enzyme rate
laws, i.e., based on detailed knowledge of catalyticmechanisms, such as the well-known Michaelis–Mentenkinetics. In addition, a number of non-mechanistic,approximative kinetic formats have been developed,such as the linear approximation (which has been the
basis of Metabolic Control Analysis, Delgado and Liao,1992; Heinrich and Rapoport, 1977; Kascar and Burns,1973), the log-linear approximation (Hatzimanikatisand Bailey, 1996), the power-law approximation (Sava-geau, 1976; Voit, 2000), the thermokinetic approach(Nielsen, 1997; Westerhoff and Van Dam, 1987) and therecently developed linear-logarithmic (lin-log) approx-imation (Heijnen et al., 2004; Visser and Heijnen, 2003;Wu et al., 2004). The approximative kinetic formatshave the advantage of containing much fewer para-meters, a uniform structure and universal applicability,also when the catalytic mechanism is unknown. Theseproperties reduce the efforts for model building andparameter estimation. Another desirable property for asuitable kinetic format is good approximative capacityover a large range of metabolite concentrations andfluxes. Hence, nonlinear kinetic formats are preferredabove (semi-)linear kinetics defined close to a referencepoint.Here, we employ the lin-log kinetics to illustrate
our conceptual strategy. Both in silico and experi-mental studies have shown a satisfactory approximativeperformance of this nonlinear kinetic format uponlarge changes in metabolite concentrations, enzymeactivities and fluxes (Heijnen et al., 2004; Visser andHeijnen, 2003; Wu et al., 2004). The lin-log kinetics isgiven by
v
v0¼
e
e0
h i� iþ Ex0 � ln
x
x0
� �� �, (2)
where the metabolic fluxes, enzyme activities andmetabolite concentrations are expressed relative to areference state (e.g., the wild-type strain, denoted by 0).Relative changes in metabolic fluxes (v/v0) are consid-ered proportional to relative changes in the activities ofthe corresponding enzymes (e/e0). The nonlinear effectsof metabolite concentrations on reaction rates areincorporated in lin-log kinetics as the sum of logarithmsof relative changes in metabolite concentrations (x/x0).The matrix Ex0 contains elasticities, which serve as thekinetic parameters. They are defined as the scaledsensitivities of reaction rates toward metabolite concen-trations at the reference state:
�x0ik ¼
x0kv0i
�@vi
@xk
� �0
. (3)
Thus, one single elasticity parameter per metabolite isinvolved in each reaction, thereby largely reduce thenumber of parameters to be identified. Calculation ofrelative changes in in vivo enzyme activities (e/e0) fromEq. (2) therefore requires: (1) the metabolite concentra-tions in the mutant (x) and reference state (x0); (2) themetabolic fluxes in the mutant (v) and reference state(v0) and (3) the elasticities (Ex0) in the referencestate only.
ARTICLE IN PRESSL. Wu et al. / Metabolic Engineering 7 (2005) 302–310304
All the required information can be obtained solelyfrom mass spectrometry (MS) analysis of the metabo-lome.To obtain in vivo metabolite concentrations (x and
x0), cells are rapidly sampled (Lange et al., 2001;Schaefer et al., 1999; Theobald et al., 1993) andimmediately quenched to prevent further turnover ofthe metabolites (de Koning and van Dam, 1992;Mashego et al., 2003). Cells are subsequently disruptedto release intracellular metabolites (de Koning and vanDam, 1992; Gonzalez et al., 1997; Theobald et al., 1997).The obtained cell-free extracts containing intracellularmetabolites can be analyzed by, e.g., LC-MS (Buchholzet al., 2001; van Dam et al., 2002). Compared togenome-wide transcriptome analysis, spatial and tem-poral profiling of the metabolome by MS is still in anearly stage of development. However, promising ad-vances have been made to improve the precision of LC-ESI-MS analysis by incorporating metabolome-widefully U- 13C-labeled internal standards (Wu et al., 2005)and portions of the total metabolome can now beidentified and quantified (Goodacre et al., 2004; Sogaet al., 2002).To obtain in vivo (quasi-)steady-state fluxes (v0) in a
metabolic sub-network with known stoichiometry,isotopic tracer experiments (e.g., with 13C-labeledmolecules) are required (Wiechert, 2001). Cells are fedwith labeled metabolites to reach an isotopic (quasi-)stationary state. The mass isotopomer distributions ofthe 13C-metabolome, e.g., the proteinogenic aminoacids (Fischer and Sauer, 2003; Gombert et al., 2001),excreted metabolites (Wittmann and Heinzle, 2001) orfree intracellular metabolites (Kromer et al., 2004; vanWinden et al., 2005), are determined by MS. These dataare subsequently applied to estimate in vivo fluxes usingwell-established computational tools (Wiechert et al.,2001).To obtain the kinetic parameters (Ex0), stimulus
response experiments are required. In such experiments,the metabolism of intact cells in a reference (quasi-)steady state is perturbed by external stimuli (e.g., asubstrate pulse) (Chassagnole et al., 2002; Rizzi et al.,1997; Vaseghi et al., 1999; Visser et al., 2004). Thesubsequent metabolome responses are followed in ashort time window, employing the experimental proce-dures described above to obtain in vivo metaboliteconcentrations. By limiting the observation time win-dow, it can be assumed that the metabolome responsesare primarily triggered by kinetic interactions and thatenzyme activities are essentially constant (i.e., e(t)/e0Ei)(Theobald et al., 1997). The measured temporal evolu-tion of metabolite concentrations (x(t)) is combinedwith the measured x0 to estimate the elasticitieswith available mathematical procedures (Haunschildet al., 2005; Kresnowati et al., 2005; Rizzi et al.,1997).
Summarizing, an MS-based metabolomics platformin principle suffices to provide the required informationto calculate e/e0. Unlike the well-established and widelyapplied 13C flux analysis, the unbiased quantification ofa large number of intracellular metabolites and theconstruction of kinetic models are more challenging(Wiechert, 2002). The latter not only requires high-throughput metabolome analysis, but also a prioriknowledge of existing in vivo (allosteric) interactionsbetween enzymes and metabolites. Despite decades of invitro biochemical research, this information is yet farfrom complete. Hence, the development and validationof in vivo kinetic models of metabolic sub-networks ofinterest is crucial to the practical implementation of theproposed approach.
3. The in silico model
We performed an in silico case study to test whetherchanges in enzyme activities can be correctly calculated,when the required information is available for areference wild-type strain and silent or non-silentmutants. The in silico ‘wild type’ (in a Saccharomyces
cerevisiae background) was adapted from Teusink et al.(1998) and consisted of seven (lumped) enzymatic stepsin glycolysis converting glucose to glycerol and ethanol(Fig. 1). Each step was assigned a mechanistic rateequation, representing the ‘true’ enzyme kinetics (seeAppendix A).Three different genes of S. cerevisiae were chosen and
assumed here to have as yet unknown functions. Hence,we consider three different single-gene mutants toillustrate our approach.
(1)
The PFK27 gene encoding 6-phosphofructo-2-kinase(6PF-2-K) (Kretschmer and Fraenkel, 1991) wasassumed to have yet unknown function. 6PF-2-Kconverts fructose-6-phosphate (F6P) into fructose-2,6-bisphosphate (F2,6bP), an activator of 6-phos-phofructo-1-kinase (6PF-1-K) (Nissler et al., 1983).In the pfk27+ mutant, PFK27 is overexpressed,leading to a 50% increase of the F2,6bP concentra-tion.(2)
The GPD1 gene encoding an isoenzyme of glycerolphosphate dehydrogenase (GPD) (Albertyn et al.,1994) was assumed to have yet unknown function.In its deletion mutant (Dgpd1), the abundance ofGPD is at 30% of its wild-type level (the remainingGPD activity is provided by the isoenzyme Gpd2pEriksson et al., 1995). The in silico responses of thefirst two mutants have been previously described byTeusink et al. (1998).(3)
The X gene encoding a regulator of the GPD1 andGPP2 gene expression. The GPP1 and GPP2 genesencode two glycerol-3-phosphatase isoenzymes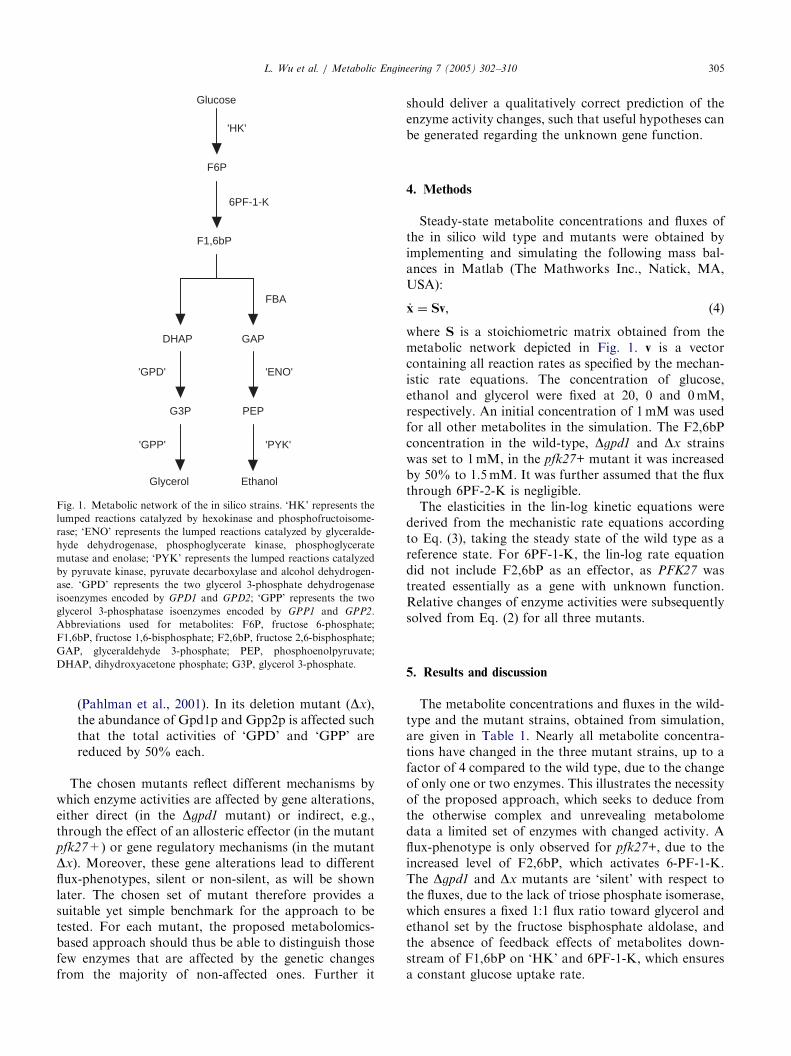
ARTICLE IN PRESS
Glucose
'HK'
F1,6bP
6PF-1-K
F6P
FBA
DHAP GAP
G3P PEP
EthanolGlycerol
'ENO'
'PYK'
'GPD'
'GPP'
Fig. 1. Metabolic network of the in silico strains. ‘HK’ represents the
lumped reactions catalyzed by hexokinase and phosphofructoisome-
rase; ‘ENO’ represents the lumped reactions catalyzed by glyceralde-
hyde dehydrogenase, phosphoglycerate kinase, phosphoglycerate
mutase and enolase; ‘PYK’ represents the lumped reactions catalyzed
by pyruvate kinase, pyruvate decarboxylase and alcohol dehydrogen-
ase. ‘GPD’ represents the two glycerol 3-phosphate dehydrogenase
isoenzymes encoded by GPD1 and GPD2; ‘GPP’ represents the two
glycerol 3-phosphatase isoenzymes encoded by GPP1 and GPP2.
Abbreviations used for metabolites: F6P, fructose 6-phosphate;
F1,6bP, fructose 1,6-bisphosphate; F2,6bP, fructose 2,6-bisphosphate;
GAP, glyceraldehyde 3-phosphate; PEP, phosphoenolpyruvate;
DHAP, dihydroxyacetone phosphate; G3P, glycerol 3-phosphate.
L. Wu et al. / Metabolic Engineering 7 (2005) 302–310 305
(Pahlman et al., 2001). In its deletion mutant (Dx),the abundance of Gpd1p and Gpp2p is affected suchthat the total activities of ‘GPD’ and ‘GPP’ arereduced by 50% each.
The chosen mutants reflect different mechanisms bywhich enzyme activities are affected by gene alterations,either direct (in the Dgpd1 mutant) or indirect, e.g.,through the effect of an allosteric effector (in the mutantpfk27+) or gene regulatory mechanisms (in the mutantDx). Moreover, these gene alterations lead to differentflux-phenotypes, silent or non-silent, as will be shownlater. The chosen set of mutant therefore provides asuitable yet simple benchmark for the approach to betested. For each mutant, the proposed metabolomics-based approach should thus be able to distinguish thosefew enzymes that are affected by the genetic changesfrom the majority of non-affected ones. Further it
should deliver a qualitatively correct prediction of theenzyme activity changes, such that useful hypotheses canbe generated regarding the unknown gene function.
4. Methods
Steady-state metabolite concentrations and fluxes ofthe in silico wild type and mutants were obtained byimplementing and simulating the following mass bal-ances in Matlab (The Mathworks Inc., Natick, MA,USA):
_x ¼ Sv, (4)
where S is a stoichiometric matrix obtained from themetabolic network depicted in Fig. 1. v is a vectorcontaining all reaction rates as specified by the mechan-istic rate equations. The concentration of glucose,ethanol and glycerol were fixed at 20, 0 and 0mM,respectively. An initial concentration of 1mM was usedfor all other metabolites in the simulation. The F2,6bPconcentration in the wild-type, Dgpd1 and Dx strainswas set to 1mM, in the pfk27+ mutant it was increasedby 50% to 1.5mM. It was further assumed that the fluxthrough 6PF-2-K is negligible.The elasticities in the lin-log kinetic equations were
derived from the mechanistic rate equations accordingto Eq. (3), taking the steady state of the wild type as areference state. For 6PF-1-K, the lin-log rate equationdid not include F2,6bP as an effector, as PFK27 wastreated essentially as a gene with unknown function.Relative changes of enzyme activities were subsequentlysolved from Eq. (2) for all three mutants.
5. Results and discussion
The metabolite concentrations and fluxes in the wild-type and the mutant strains, obtained from simulation,are given in Table 1. Nearly all metabolite concentra-tions have changed in the three mutant strains, up to afactor of 4 compared to the wild type, due to the changeof only one or two enzymes. This illustrates the necessityof the proposed approach, which seeks to deduce fromthe otherwise complex and unrevealing metabolomedata a limited set of enzymes with changed activity. Aflux-phenotype is only observed for pfk27+, due to theincreased level of F2,6bP, which activates 6-PF-1-K.The Dgpd1 and Dx mutants are ‘silent’ with respect tothe fluxes, due to the lack of triose phosphate isomerase,which ensures a fixed 1:1 flux ratio toward glycerol andethanol set by the fructose bisphosphate aldolase, andthe absence of feedback effects of metabolites down-stream of F1,6bP on ‘HK’ and 6PF-1-K, which ensuresa constant glucose uptake rate.
ARTICLE IN PRESS
Table 1
Simulated steady-state metabolite concentrations (mM) and flux
(mmol/L/min) for the in silico wild-type and mutant strains
Metabolites WT pfk27+ Dgpd1 Dx
F6P 3.22 1.74 3.22 3.22
F1,6bP 3.07 3.82 6.55 5.56
GAP 0.53 0.51 0.30 0.32
PEP 0.28 0.23 0.10 0.12
DHAP 0.37 0.46 1.30 1.06
G3P 0.16 0.19 0.16 0.38
v’HK’a 0.69 0.80 0.69 0.69
aThe flux through ‘HK’, which is identical to the fluxes through
6PF-1-K and FBA and two times the fluxes through ‘GPD’, ‘GPP’,
‘ENO’ and ‘PYK’, due to the stoichiometric constraint.
Table 2
Calculated elasticities for the in silico wild-type strain as a reference
state
Ex0 Glc F6P F1,6bP GAP PEP DHAP G3P
‘HK’ 0.37 �0.32 0 0 0 0 0
6PF-1-K 0 0.79 0 0 0 0 0
FBA 0 0 2.10 �2.13 0 �2.05 0
‘ENO’ 0 0 0 1.82 �1.27 0 0
‘PYK’ 0 0 2.06 0 1.38 0 0
‘GPD’ 0 0 0 0 0 1.51 �0.86
‘GPP’ 0 0 0 0 0 0 0.86
′HK′ PFK FBA ′ENO′ ′PYK′ ′GPD′ ′GPP′
′HK′ PFK FBA ′ENO′ ′PYK′ ′GPD′ ′GPP′
′HK′ PFK FBA ′ENO′ ′PYK′ ′GPD′ ′GPP′
0
1
2
0
1
2
pfk27+
∆gpd1
0
1
2
∆x
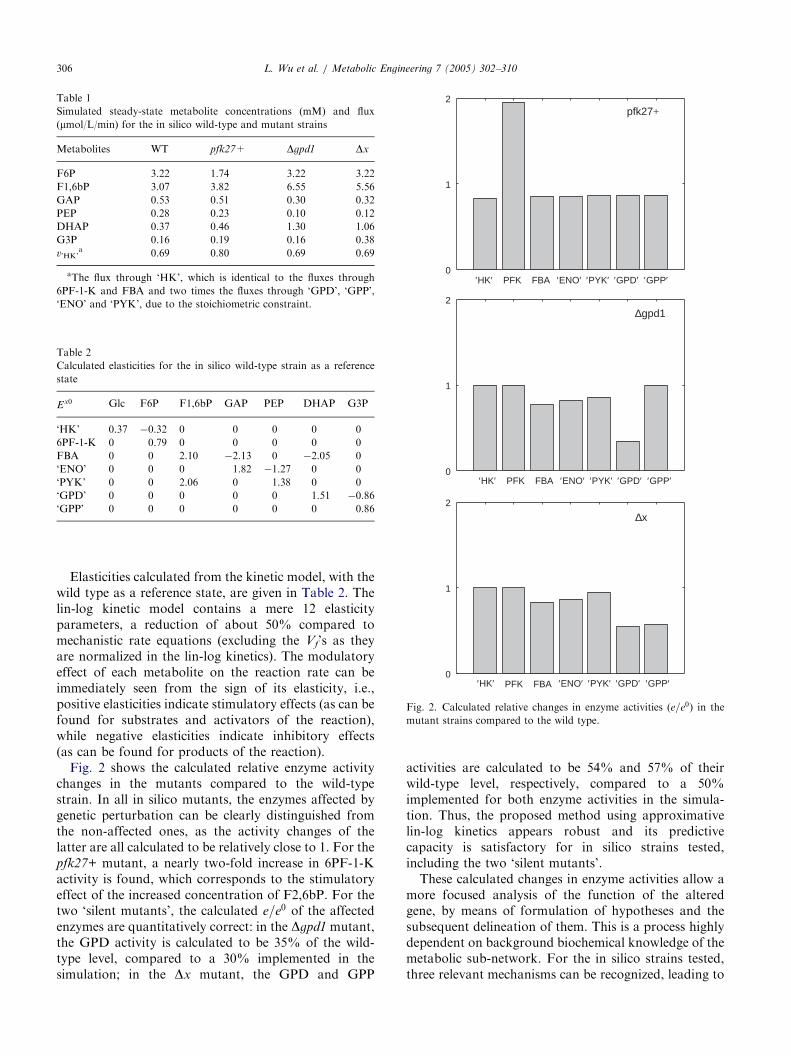
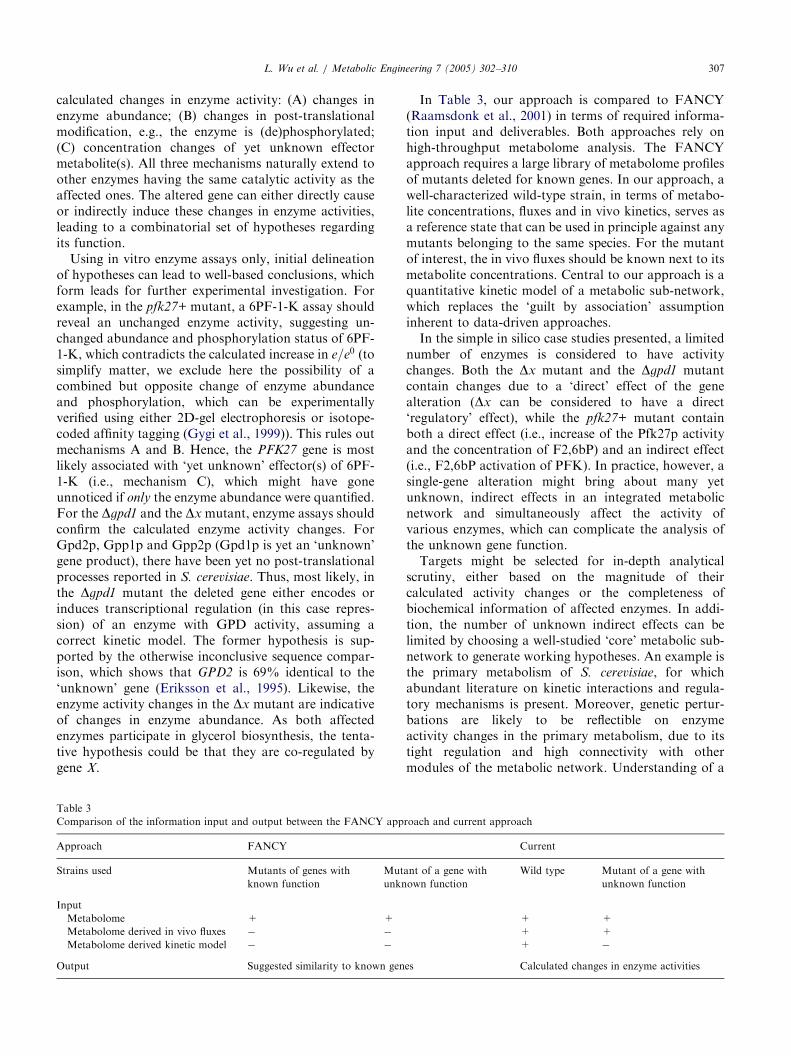
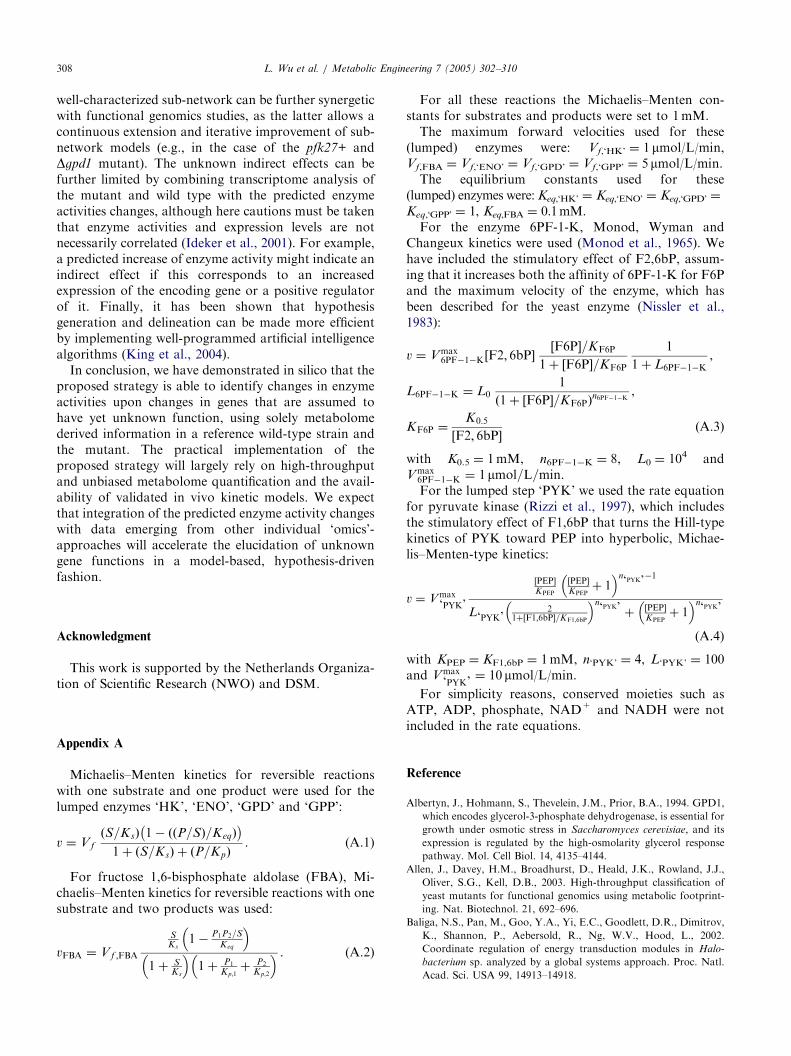
Fig. 2. Calculated relative changes in enzyme activities (e=e0) in the
mutant strains compared to the wild type.
L. Wu et al. / Metabolic Engineering 7 (2005) 302–310306
Elasticities calculated from the kinetic model, with thewild type as a reference state, are given in Table 2. Thelin-log kinetic model contains a mere 12 elasticityparameters, a reduction of about 50% compared tomechanistic rate equations (excluding the Vf’s as theyare normalized in the lin-log kinetics). The modulatoryeffect of each metabolite on the reaction rate can beimmediately seen from the sign of its elasticity, i.e.,positive elasticities indicate stimulatory effects (as can befound for substrates and activators of the reaction),while negative elasticities indicate inhibitory effects(as can be found for products of the reaction).Fig. 2 shows the calculated relative enzyme activity
changes in the mutants compared to the wild-typestrain. In all in silico mutants, the enzymes affected bygenetic perturbation can be clearly distinguished fromthe non-affected ones, as the activity changes of thelatter are all calculated to be relatively close to 1. For thepfk27+ mutant, a nearly two-fold increase in 6PF-1-Kactivity is found, which corresponds to the stimulatoryeffect of the increased concentration of F2,6bP. For thetwo ‘silent mutants’, the calculated e=e0 of the affectedenzymes are quantitatively correct: in the Dgpd1 mutant,the GPD activity is calculated to be 35% of the wild-type level, compared to a 30% implemented in thesimulation; in the Dx mutant, the GPD and GPP
activities are calculated to be 54% and 57% of theirwild-type level, respectively, compared to a 50%implemented for both enzyme activities in the simula-tion. Thus, the proposed method using approximativelin-log kinetics appears robust and its predictivecapacity is satisfactory for in silico strains tested,including the two ‘silent mutants’.These calculated changes in enzyme activities allow a
more focused analysis of the function of the alteredgene, by means of formulation of hypotheses and thesubsequent delineation of them. This is a process highlydependent on background biochemical knowledge of themetabolic sub-network. For the in silico strains tested,three relevant mechanisms can be recognized, leading to
ARTICLE IN PRESSL. Wu et al. / Metabolic Engineering 7 (2005) 302–310 307
calculated changes in enzyme activity: (A) changes inenzyme abundance; (B) changes in post-translationalmodification, e.g., the enzyme is (de)phosphorylated;(C) concentration changes of yet unknown effectormetabolite(s). All three mechanisms naturally extend toother enzymes having the same catalytic activity as theaffected ones. The altered gene can either directly causeor indirectly induce these changes in enzyme activities,leading to a combinatorial set of hypotheses regardingits function.Using in vitro enzyme assays only, initial delineation
of hypotheses can lead to well-based conclusions, whichform leads for further experimental investigation. Forexample, in the pfk27+ mutant, a 6PF-1-K assay shouldreveal an unchanged enzyme activity, suggesting un-changed abundance and phosphorylation status of 6PF-1-K, which contradicts the calculated increase in e=e0 (tosimplify matter, we exclude here the possibility of acombined but opposite change of enzyme abundanceand phosphorylation, which can be experimentallyverified using either 2D-gel electrophoresis or isotope-coded affinity tagging (Gygi et al., 1999)). This rules outmechanisms A and B. Hence, the PFK27 gene is mostlikely associated with ‘yet unknown’ effector(s) of 6PF-1-K (i.e., mechanism C), which might have goneunnoticed if only the enzyme abundance were quantified.For the Dgpd1 and the Dx mutant, enzyme assays shouldconfirm the calculated enzyme activity changes. ForGpd2p, Gpp1p and Gpp2p (Gpd1p is yet an ‘unknown’gene product), there have been yet no post-translationalprocesses reported in S. cerevisiae. Thus, most likely, inthe Dgpd1 mutant the deleted gene either encodes orinduces transcriptional regulation (in this case repres-sion) of an enzyme with GPD activity, assuming acorrect kinetic model. The former hypothesis is sup-ported by the otherwise inconclusive sequence compar-ison, which shows that GPD2 is 69% identical to the‘unknown’ gene (Eriksson et al., 1995). Likewise, theenzyme activity changes in the Dx mutant are indicativeof changes in enzyme abundance. As both affectedenzymes participate in glycerol biosynthesis, the tenta-tive hypothesis could be that they are co-regulated bygene X.
Table 3
Comparison of the information input and output between the FANCY app
Approach FANCY
Strains used Mutants of genes with
known function
Mut
unkn
Input
Metabolome + +
Metabolome derived in vivo fluxes � �
Metabolome derived kinetic model � �
Output Suggested similarity to known gen
In Table 3, our approach is compared to FANCY(Raamsdonk et al., 2001) in terms of required informa-tion input and deliverables. Both approaches rely onhigh-throughput metabolome analysis. The FANCYapproach requires a large library of metabolome profilesof mutants deleted for known genes. In our approach, awell-characterized wild-type strain, in terms of metabo-lite concentrations, fluxes and in vivo kinetics, serves asa reference state that can be used in principle against anymutants belonging to the same species. For the mutantof interest, the in vivo fluxes should be known next to itsmetabolite concentrations. Central to our approach is aquantitative kinetic model of a metabolic sub-network,which replaces the ‘guilt by association’ assumptioninherent to data-driven approaches.In the simple in silico case studies presented, a limited
number of enzymes is considered to have activitychanges. Both the Dx mutant and the Dgpd1 mutantcontain changes due to a ‘direct’ effect of the genealteration (Dx can be considered to have a direct‘regulatory’ effect), while the pfk27+ mutant containboth a direct effect (i.e., increase of the Pfk27p activityand the concentration of F2,6bP) and an indirect effect(i.e., F2,6bP activation of PFK). In practice, however, asingle-gene alteration might bring about many yetunknown, indirect effects in an integrated metabolicnetwork and simultaneously affect the activity ofvarious enzymes, which can complicate the analysis ofthe unknown gene function.Targets might be selected for in-depth analytical
scrutiny, either based on the magnitude of theircalculated activity changes or the completeness ofbiochemical information of affected enzymes. In addi-tion, the number of unknown indirect effects can belimited by choosing a well-studied ‘core’ metabolic sub-network to generate working hypotheses. An example isthe primary metabolism of S. cerevisiae, for whichabundant literature on kinetic interactions and regula-tory mechanisms is present. Moreover, genetic pertur-bations are likely to be reflectible on enzymeactivity changes in the primary metabolism, due to itstight regulation and high connectivity with othermodules of the metabolic network. Understanding of a
roach and current approach
Current
ant of a gene with
own function
Wild type Mutant of a gene with
unknown function
+ +
+ +
+ �
es Calculated changes in enzyme activities
ARTICLE IN PRESSL. Wu et al. / Metabolic Engineering 7 (2005) 302–310308
well-characterized sub-network can be further synergeticwith functional genomics studies, as the latter allows acontinuous extension and iterative improvement of sub-network models (e.g., in the case of the pfk27+ andDgpd1 mutant). The unknown indirect effects can befurther limited by combining transcriptome analysis ofthe mutant and wild type with the predicted enzymeactivities changes, although here cautions must be takenthat enzyme activities and expression levels are notnecessarily correlated (Ideker et al., 2001). For example,a predicted increase of enzyme activity might indicate anindirect effect if this corresponds to an increasedexpression of the encoding gene or a positive regulatorof it. Finally, it has been shown that hypothesisgeneration and delineation can be made more efficientby implementing well-programmed artificial intelligencealgorithms (King et al., 2004).In conclusion, we have demonstrated in silico that the
proposed strategy is able to identify changes in enzymeactivities upon changes in genes that are assumed tohave yet unknown function, using solely metabolomederived information in a reference wild-type strain andthe mutant. The practical implementation of theproposed strategy will largely rely on high-throughputand unbiased metabolome quantification and the avail-ability of validated in vivo kinetic models. We expectthat integration of the predicted enzyme activity changeswith data emerging from other individual ‘omics’-approaches will accelerate the elucidation of unknowngene functions in a model-based, hypothesis-drivenfashion.
Acknowledgment
This work is supported by the Netherlands Organiza-tion of Scientific Research (NWO) and DSM.
Appendix A
Michaelis–Menten kinetics for reversible reactionswith one substrate and one product were used for thelumped enzymes ‘HK’, ‘ENO’, ‘GPD’ and ‘GPP’:
v ¼ V f
ðS=KsÞ 1� ððP=SÞ=KeqÞ� �
1þ ðS=KsÞ þ ðP=KpÞ. (A.1)
For fructose 1,6-bisphosphate aldolase (FBA), Mi-chaelis–Menten kinetics for reversible reactions with onesubstrate and two products was used:
vFBA ¼ V f ;FBA
SKs
1� P1P2=SKeq
� �
1þ SKs
� �1þ P1
Kp;1þ P2
Kp;2
� � . (A.2)
For all these reactions the Michaelis–Menten con-stants for substrates and products were set to 1mM.The maximum forward velocities used for these
(lumped) enzymes were: Vf,‘HK’ ¼ 1 mmol/L/min,Vf,FBA ¼ Vf,‘ENO’ ¼ Vf,‘GPD’ ¼ Vf,‘GPP’ ¼ 5 mmol/L/min.The equilibrium constants used for these
(lumped) enzymes were:Keq,‘HK’ ¼ Keq,‘ENO’ ¼ Keq,‘GPD’ ¼
Keq,‘GPP’ ¼ 1, Keq,FBA ¼ 0.1mM.For the enzyme 6PF-1-K, Monod, Wyman and
Changeux kinetics were used (Monod et al., 1965). Wehave included the stimulatory effect of F2,6bP, assum-ing that it increases both the affinity of 6PF-1-K for F6Pand the maximum velocity of the enzyme, which hasbeen described for the yeast enzyme (Nissler et al.,1983):
v ¼ Vmax6PF�1�K½F2; 6bP�
½F6P�=KF6P
1þ ½F6P�=KF6P
1
1þ L6PF�1�K,
L6PF�1�K ¼ L01
ð1þ ½F6P�=KF6PÞn6PF�1�K
,
KF6P ¼K0:5
½F2; 6bP�ðA:3Þ
with K0.5 ¼ 1mM, n6PF�1�K ¼ 8, L0 ¼ 104 andVmax6PF�1�K ¼ 1mmol=L=min.For the lumped step ‘PYK’ we used the rate equation
for pyruvate kinase (Rizzi et al., 1997), which includesthe stimulatory effect of F1,6bP that turns the Hill-typekinetics of PYK toward PEP into hyperbolic, Michae-lis–Menten-type kinetics:
v ¼ Vmax
‘PYK’
½PEP�KPEP
½PEP�KPEP
þ 1� �n‘PYK’�1
L‘PYK’2
1þ½F1;6bP�=KF1;6bP
� �n‘PYK’ þ ½PEP�KPEP
þ 1� �n‘PYK’
(A.4)
with KPEP ¼ KF1,6bP ¼ 1mM, n‘PYK’ ¼ 4, L‘PYK’ ¼ 100and Vmax
‘PYK’ ¼ 10 mmol/L/min.For simplicity reasons, conserved moieties such as
ATP, ADP, phosphate, NAD+ and NADH were notincluded in the rate equations.
Reference
Albertyn, J., Hohmann, S., Thevelein, J.M., Prior, B.A., 1994. GPD1,
which encodes glycerol-3-phosphate dehydrogenase, is essential for
growth under osmotic stress in Saccharomyces cerevisiae, and its
expression is regulated by the high-osmolarity glycerol response
pathway. Mol. Cell Biol. 14, 4135–4144.
Allen, J., Davey, H.M., Broadhurst, D., Heald, J.K., Rowland, J.J.,
Oliver, S.G., Kell, D.B., 2003. High-throughput classification of
yeast mutants for functional genomics using metabolic footprint-
ing. Nat. Biotechnol. 21, 692–696.
Baliga, N.S., Pan, M., Goo, Y.A., Yi, E.C., Goodlett, D.R., Dimitrov,
K., Shannon, P., Aebersold, R., Ng, W.V., Hood, L., 2002.
Coordinate regulation of energy transduction modules in Halo-
bacterium sp. analyzed by a global systems approach. Proc. Natl.
Acad. Sci. USA 99, 14913–14918.
ARTICLE IN PRESSL. Wu et al. / Metabolic Engineering 7 (2005) 302–310 309
Buchholz, A., Takors, R., Wandrey, C., 2001. Quantification of
intracellular metabolites in Escherichia coli K12 using liquid
chromatographic-electrospray ionization tandem mass spectro-
metric techniques. Anal. Biochem. 295, 129–137.
Castrillo, J.I., Oliver, S.G., 2004. Yeast as a touchstone in post-
genomic research: strategies for integrative analysis in functional
genomics. J. Biochem. Mol. Biol. 37, 93–106.
Chassagnole, C., Noisommit-Rizzi, N., Schmid, J.W., Mauch, K.,
Reuss, M., 2002. Dynamic modeling of the central carbon
metabolism of Escherichia coli. Biotechnol. Bioeng. 79, 53–73.
Dainese, P., Staudenmann, W., Quadroni, M., Korostensky, C.,
Gonnet, G., Kertesz, M., James, P., 1997. Probing protein function
using a combination of gene knockout and proteome analysis by
mass spectrometry. Electrophoresis 18, 432–442.
de Koning, W., van Dam, K., 1992. A method for the determination of
changes of glycolytic metabolites in yeast on a subsecond time scale
using extraction at neutral pH. Anal. Biochem. 204, 118–123.
Delgado, J., Liao, J.C., 1992. Metabolic control analysis using
transient metabolite concentrations. Determination of metabolite
concentration control coefficients. Biochem. J. 285 (Part 3),
965–972.
Eriksson, P., Andre, L., Ansell, R., Blomberg, A., Adler, L., 1995.
Cloning and characterization of GPD2, a second gene encoding sn-
glycerol 3-phosphate dehydrogenase (NAD+) in Saccharomyces
cerevisiae, and its comparison with GPD1. Mol. Microbiol. 17,
95–107.
Fiehn, O., 2002. Metabolomics—the link between genotypes and
phenotypes. Plant Mol. Biol. 48, 155–171.
Fiehn, O., Kopka, J., Dormann, P., Altmann, T., Trethewey, R.N.,
Willmitzer, L., 2000. Metabolite profiling for plant functional
genomics. Nat. Biotechnol. 18, 1157–1161.
Fischer, E., Sauer, U., 2003. Metabolic flux profiling of Escherichia coli
mutants in central carbon metabolism using GC-MS. Eur. J.
Biochem. 270, 880–891.
Foster, J., Gombert, A.K., Nielsen, J., 2002. A functional genomics
approach using metabolomics and in silico pathway analysis.
Biotechnol. Bioeng. 79, 703–712.
Gombert, A.K., Moreira dos Santos, M., Christensen, B., Nielsen, J.,
2001. Network identification and flux quantification in the central
metabolism of Saccharomyces cerevisiae under different conditions
of glucose repression. J. Bacteriol. 183, 1441–1451.
Gonzalez, B., Francois, J., Renaud, M., 1997. A rapid and reliable
method for metabolite extraction in yeast using boiling buffered
ethanol. Yeast 13, 1347–1355.
Goodacre, R., Vaidyanathan, S., Dunn, W.B., Harrigan, G.G., Kell,
D.B., 2004. Metabolomics by numbers: acquiring and under-
standing global metabolite data. Trends Biotechnol. 22, 245–252.
Gygi, S.P., Rist, B., Gerber, S.A., Turecek, F., Gelb, M.H., Aebersold,
R., 1999. Quantitative analysis of complex protein mixtures using
isotope-coded affinity tags. Nat. Biotechnol. 17, 994–999.
Hatzimanikatis, V., Bailey, J.E., 1996. Effects of spatiotemporal
variations on metabolic control: approximate analysis using (log)
linear kinetic models. Biotechnol. Bioeng. 54.
Haunschild, M.D., Freisleben, B., Takors, R., Wiechert, W., 2005.
Investigating the dynamic behavior of biochemical networks using
model families. Bioinformatics 21, 1617–1625.
Haurie, V., Perrot, M., Mini, T., Jeno, P., Sagliocco, F., Boucherie, H.,
2001. The transcriptional activator Cat8p provides a major
contribution to the reprogramming of carbon metabolism during
the diauxic shift in Saccharomyces cerevisiae. J. Biol. Chem. 276,
76–85.
Heijnen, J.J., Van Gulik, W.M., Shimizu, H., Stephanopoulos, G.,
2004. Metabolic flux control analysis of branch points: an
improved approach to obtain flux control coefficients from large
perturbation data. Metab. Eng. 6, 391–400.
Heinrich, R., Rapoport, S.M., 1977. Metabolic regulation and
mathematical models. Prog. Biophys. Mol. Biol. 32, 1–82.
Ideker, T., Thorsson, V., Ranish, J.A., Christmas, R., Buhler, J., Eng,
J.K., Bumgarner, R., Goodlett, D.R., Aebersold, R., Hood, L.,
2001. Integrated genomic and proteomic analyses of a system-
atically perturbed metabolic network. Science 292, 929–934.
Kascar, H., Burns, J.A., 1973. The control of flux. Symp. Soc. Exp.
Biol. 27.
King, R.D., Whelan, K.E., Jones, F.M., Reiser, P.G., Bryant, C.H.,
Muggleton, S.H., Kell, D.B., Oliver, S.G., 2004. Functional
genomic hypothesis generation and experimentation by a robot
scientist. Nature 427, 247–252.
Knowles, M.R., Cervino, S., Skynner, H.A., Hunt, S.P., de Felipe, C.,
Salim, K., Meneses-Lorente, G., McAllister, G., Guest, P.C., 2003.
Multiplex proteomic analysis by two-dimensional differential in-gel
electrophoresis. Proteomics 3, 1162–1171.
Kobe, B., Kemp, B.E., 1999. Active site-directed protein regulation.
Nature 402, 373–376.
Kresnowati, M.T., van Winden, W.A., Heijnen, J.J., 2005. Determina-
tion of elasticities, concentration and flux control coefficients from
transient metabolite data using linlog kinetics. Metab. Eng. 7,
142–153.
Kretschmer, M., Fraenkel, D.G., 1991. Yeast 6-phosphofructo-2-
kinase: sequence and mutant. Biochemistry 30, 10663–10672.
Kromer, J.O., Sorgenfrei, O., Klopprogge, K., Heinzle, E., Wittmann,
C., 2004. In-depth profiling of lysine-producing Corynebacterium
glutamicum by combined analysis of the transcriptome, metabo-
lome, and fluxome. J. Bacteriol. 186, 1769–1784.
Lange, H.C., Eman, M., van Zuijlen, G., Visser, D., van Dam, J.C.,
Frank, J., de Mattos, M.J., Heijnen, J.J., 2001. Improved rapid
sampling for in vivo kinetics of intracellular metabolites in
Saccharomyces cerevisiae. Biotechnol. Bioeng. 75, 406–415.
Mashego, M.R., van Gulik, W.M., Vinke, J.L., Heijnen, J.J., 2003.
Critical evaluation of sampling techniques for residual glucose
determination in carbon-limited chemostat culture of Saccharo-
myces cerevisiae. Biotechnol. Bioeng. 83, 395–399.
Monod, J., Wyman, J., Changeux, J.P., 1965. On the nature of
allosteric transitions: a plausible model. J. Mol. Biol. 12, 88–118.
Nielsen, J., 1997. Metabolic control analysis of biochemical pathways
based on a thermokinetic description of reaction rates. Biochem.
J. 321 (Part 1), 133–138.
Nissler, K., Otto, A., Schellenberger, W., Hofmann, E., 1983.
Similarity of activation of yeast phosphofructokinase by AMP
and fructose-2,6-bisphosphate. Biochem. Biophys. Res. Commun.
111, 294–300.
Oliver, S.G., Winson, M.K., Kell, D.B., Baganz, F., 1998. Systematic
functional analysis of the yeast genome. Trends Biotechnol. 16,
373–378.
Pahlman, A.K., Granath, K., Ansell, R., Hohmann, S., Adler, L.,
2001. The yeast glycerol 3-phosphatases Gpp1p and Gpp2p are
required for glycerol biosynthesis and differentially involved in the
cellular responses to osmotic, anaerobic, and oxidative stress.
J. Biol. Chem. 276, 3555–3563.
Raamsdonk, L.M., Teusink, B., Broadhurst, D., Zhang, N., Hayes, A.,
Walsh, M.C., Berden, J.A., Brindle, K.M., Kell, D.B., Rowland,
J.J., Westerhoff, H.V., van Dam, K., Oliver, S.G., 2001. A
functional genomics strategy that uses metabolome data to reveal
the phenotype of silent mutations. Nat. Biotechnol. 19, 45–50.
Rizzi, M., Baltes, M., Theobald, U., Reuss, M., 1997. In vivo analysis
of metabolic dynamics in Saccharomyces cerevisiae: II. Mathema-
tical model. Biotechnol. Bioeng. 55, 592–608.
Savageau, M.A., 1976. Biochemical Systems Analysis. Addison-
Wesley, Reading, MA.
Schaefer, U., Boos, W., Takors, R., Weuster-Botz, D., 1999.
Automated sampling device for monitoring intracellular metabolite
dynamics. Anal. Biochem. 270, 88–96.
ARTICLE IN PRESSL. Wu et al. / Metabolic Engineering 7 (2005) 302–310310
Smedsgaard, J., Nielsen, J., 2005. Metabolite profiling of fungi and
yeast: from phenotype to metabolome by MS and informatics.
J. Exp. Bot. 56, 273–286.
Soga, T., Ueno, Y., Naraoka, H., Ohashi, Y., Tomita, M., Nishioka,
T., 2002. Simultaneous determination of anionic intermediates for
Bacillus subtilis metabolic pathways by capillary electrophoresis
electrospray ionization mass spectrometry. Anal. Chem. 74,
2233–2239.
Teusink, B., Baganz, F., Westerhoff, H.V., Oliver, S.G., 1998.
Metabolic control analysis as a tool in the elucidation of the
function of novel genes. Methods Microbiol. 26, 297–336.
Theobald, U., Mailinger, W., Reuss, M., Rizzi, M., 1993. In vivo
analysis of glucose-induced fast changes in yeast adenine nucleotide
pool applying a rapid sampling technique. Anal. Biochem. 214,
31–37.
Theobald, U., Mailinger, W., Baltes, M., Reuss, M., Rizzi, M., 1997.
In vivo analysis of metabolic dynamics in Saccharomyces cerevisiae:
I. Experimental observations. Biotechnol. Bioeng. 55, 305–316.
van Dam, J.C., Eman, M., Frank, J., Lange, H.C., van Dedem,
G.W.K., Heijnen, J.J., 2002. Analysis of glycolytic intermediates in
Saccharomyces cerevisiae using anion exchange chromatography
and electrospray ionization with tandem mass spectrometric
detection. Anal. Chim. Acta 460, 209–218.
van Winden, W.A., van Dam, J.C., Ras, C., Kleijn, R.J., Vinke, J.L.,
van Gulik, W.M., Heijnen, J.J., 2005. Metabolic-flux analysis of
Saccharomyces cerevisiae CEN.PK113-7D based on mass isotopo-
mer measurements of 13C-labeled primary metabolites. FEMS
Yeast Res. 5, 559–568.
Vaseghi, S., Baumeister, A., Rizzi, M., Reuss, M., 1999. In vivo
dynamics of the pentose phosphate pathway in Saccharomyces
cerevisiae. Metab. Eng. 1, 128–140.
Visser, D., Heijnen, J.J., 2003. Dynamic simulation and metabolic re-
design of a branched pathway using linlog kinetics. Metab. Eng. 5,
164–176.
Visser, D., van Zuylen, G.A., van Dam, J.C., Eman, M.R., Proll, A.,
Ras, C., Wu, L., van Gulik, W.M., Heijnen, J.J., 2004. Analysis of
in vivo kinetics of glycolysis in aerobic Saccharomyces cerevisiae by
application of glucose and ethanol pulses. Biotechnol. Bioeng. 88,
157–167.
Voit, E.O., 2000. Computational Analysis of Biochemical Systems: a
Practical Guide for Biochemists and Molecular Biologists. Cam-
bridge University Press, Cambridge.
Westerhoff, H.V., Van Dam, K., 1987. Thermodynamics and Control
of Biological Free-Energy Transduction. Elsevier, Amsterdam.
Wiechert, W., 2001. 13C metabolic flux analysis. Metab. Eng. 3,
195–206.
Wiechert, W., 2002. Modeling and simulation: tools for metabolic
engineering. J. Biotechnol. 94, 37–63.
Wiechert, W., Mollney, M., Petersen, S., de Graaf, A.A., 2001. A
universal framework for 13C metabolic flux analysis. Metab. Eng.
3, 265–283.
Wittmann, C., Heinzle, E., 2001. Application of MALDI-TOF MS to
lysine-producing Corynebacterium glutamicum: a novel approach
for metabolic flux analysis. Eur. J. Biochem. 268, 2441–2455.
Wu, L., Wang, W., van Gulik, W.M., Heijnen, J.J., 2004. A new
framework for the estimation of control parameters in metabolic
pathways using lin-log kinetics. Eur. J. Biochem. 271, 3348–3359.
Wu, L., Mashego, M.R., van Dam, J.C., Proell, A.M., Vinke, J.L.,
Ras, C., van Winden, W.A., van Gulik, W.M., Heijnen, J.J., 2005.
Quantitative analysis of the microbial metabolome by isotope
dilution mass spectrometry using uniformly 13C-labeled cell
extracts as internal standards. Anal. Biochem. 336, 164–171.