Application of Laser Doppler Velocimeter to … of Laser Doppler Velocimeter to Chemical Vapor Laser...
24
NASA Technical Memorandum 4409 Application of Laser Doppler Velocimeter to Chemical Vapor Laser System (NASA-TM-4409) APPLICATInN OF LASER DOPPLER VELOCIMETER TO CHEMICAL VAPOR LASER SYSTEM (NASA) 22 p N93-18068 Unclas Luther R. Gartrell Langley Research Center Hampton, Virginia Bagher M. Tabibi Hampton University Hampton, Virginia William W. Hunter, Jr., Ja H. Lee, and Mark T. Fletcher Langley Research Center Hampton, Virginia National Aeronautics and Space Administration Office of Management Scientific and Technical Information Program 1993 H1/36 0145558 https://ntrs.nasa.gov/search.jsp?R=19930008879 2018-06-26T11:27:43+00:00Z
Transcript of Application of Laser Doppler Velocimeter to … of Laser Doppler Velocimeter to Chemical Vapor Laser...

NASA Technical Memorandum 4409
Application of Laser Doppler
Velocimeter to Chemical Vapor
Laser System
(NASA-TM-4409) APPLICATInN OF
LASER DOPPLER VELOCIMETER TO
CHEMICAL VAPOR LASER SYSTEM (NASA)
22 p
N93-18068
Unclas
Luther R. Gartrell
Langley Research Center
Hampton, Virginia
Bagher M. Tabibi
Hampton University
Hampton, Virginia
William W. Hunter, Jr., Ja H. Lee,
and Mark T. Fletcher
Langley Research Center
Hampton, Virginia
National Aeronautics andSpace Administration
Office of Management
Scientific and Technical
Information Program
1993
H1/36 0145558
https://ntrs.nasa.gov/search.jsp?R=19930008879 2018-06-26T11:27:43+00:00Z

Acknowledgment
The authors wish to acknowledge R. C. Costen and W. E. Meador
of tile Space Systems Division for suggesting and initiating the
application of laser velocimetry for this work. In addition,
the authors acknowledge C. g. Nichols, Jr., of the Facilities
Engineering Division for his assistance with the design of tile
seeding system.
Use of Trademarks
The use of trademarks or names of manufacturers in this
report is for accurate reporting and does not constitute an
official endorsement, either expressed or implied, of such
products or manufacturers by tile National Aeronautics and
Space Administration.

Summary
A laser Doppler velocimeter (LDV) system has been used to measure iodide vapor flow fieldswithin 20- and 36-ram-inside diameter (id) laser tubes used for a solar-simulated, pumped laser
system. The velocity profiles across the laser tubes were obtained with an estimated +l-percentbias and ±0.3- to 0.5-percent random uncertainty in the mean values and ±2.3-percent random
uncertainty in the turbulence-intensity values. For the velocity profile measurements in the
20-mm-id laser tube, the centerline velocities and turbulence intensities for various longitudinal
locations ranged from 13 to 17.5 m/see and 6 to 20 percent, respectively. These measurementsshowed that the level of turbulence was higher than generally anticipated. Therefore, modelingof tile flow field should include considerations for the effects of turbulence. For the 36-mm-id
tube, the centerline velocity at the length/diameter (l/d) = 24 location was 11 m/see with an
8-percent turbulence-intensity level. The LDV system provided calibration data for pressure
and mass flow systems used routinely to monitor the chemical laser gas flow velocity. When
the estimated average velocity values derived from the LDV mean centerline velocities and the"pipe factor" were compared with pressure and mass flow measurements, agreement was within
6 percent. The LDV system has provided flow velocity data for use in calibrating the installed
instrumentation and for analyzing the flow characteristics of perftuoroalkyl iodide (n-C3FTI)
vapor inside various laser tubes.
Introduction
Feasibility studies of high-power laser systems for space applications are being conducted at
the Langley Research Center (LaRC). The focus of the present activity is a solar-simulated,
pumped gas laser that can deliver continuous wave (cw) power of about 10 W using ttlermallydriven normal perfiuoroalkyl iodide (n-C3F7I) vapor (ref. 1). The photodissoeiation of the
flowing iodide vapor inside a transparent quartz laser tube is produced by a "vortex-stabilized"
argon arc light source. Vapor flow studies were needed to assess the impact of flow-fieldcharacteristics on laser operating efficiency and for validation of a numerical model formulated
for the laser system.
A laser Doppler velocimeter (LDV) was selected to measure the vapor flow-field characteristicsbecause it is nonintrusive and has been successfully applied to a variety of fuid dynamics
applications (rcfs. 2 to 5). The LDV measures particle velocities in the moving fluid. Throughselective control of particle size to reduce particle lag, particle velocity can be equated with the
fluid velocity within tile accuracy of the LDV system. Real-time absolute LDV measurements
are obtained independent of local fluid conditions except for the dependence of particle dynamic
response on local flow-field temperature and pressure.
This paper describes the LDV experiments conducted to determine flow characteristics in
two different sizes of transparcnt laser tubes. The pipe flow experiments also provided data to
assess the performance of the pressure and mass flowmetering systems that are used routinely tomonitor the research laser system. The LDV measurement technique, test apparatus, procedure,and results are described.
Symbols
A
b
d
F
fc
laser tube cross-sectional area, cm 2
linear regression intercept
laser tube inside diameter, em
mass flow rate, SCCM
reference clock frequency, Hz

fD
l
m
P
q
SCCM
V
V
½
Vm
x
AV
AO
c_
_v
t_
)_
O-
Urn
G_
Doppler frequency, Hz
longitudinal distance, mm
slope of linear regression curve fit
laser tube pressure, torr
defined nondimensional quantity, equation (6)
standard cubic centimeters per minute
velocity, m/sec
estimated average velocity, m/see
calculated velocity, m/sec
measured velocity, m/sec
radial distance, figures 8 and 9
turbulence intensity, a/V
velocity uncertainty, m/see
measured crossbeam angle uncertainty, rad
error in turbulence intensity
error in mean velocity
angle between intersecting laser beams, deg
laser wavelength, nm
standard deviation of velocity, m/sec
standard error of statistical mean, m/sec
standard error of standard deviation, m/sec
Laser Doppler Velocimeter Technique
The underlying principles of the LDV technique are embodied in Maxwell's equations and the
Doppler effect. A solution for Maxwell's equations was developed by Mie (discussed in ref. 6)that describes the properties of electromagnetic fields scattered from a homogeneous sphere,denoted Mie scattering. The Doppler frequency shift of the scattered radiation is shown in
figure 1, where a pair of laser beams cross to form a sample volume. Particles passing through
that volume will scatter light at a Doppler-shifted frequency that is proportional to the velocityof the scattering particle normal to the crossbeam angle bisector. The Doppler frequency isgivcn by
2Vsin (_)
fD -- /k (1)
where V is the velocity of the particle, 8 is the angle between the intersecting beams, and _ isthe wavelength of the laser light.
Apparatus
Laser Doppler Velocimeter System
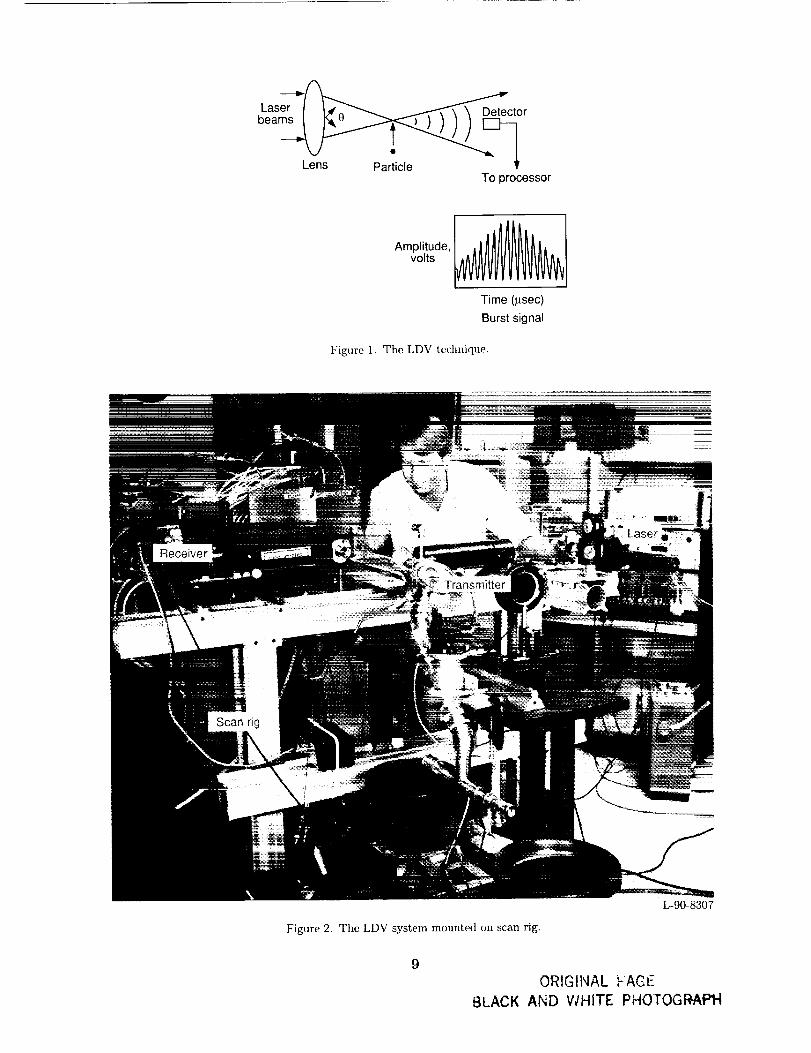
The LDV was a single-component, conventional crossbeam system configured to operate in theforward-scattering mode. A helium-neon laser operating in the TEM00 mode provided 15 mW
2

of continuouspowerat 623.8nm. Thetransmittingopticsconsistedof a 50:50beamsplitteranda 2.27xbeamexpanderthat formedtwo2.27-ram-diameter,50-mmspacedparallelbeams.Thetwoparallelbeamspassedthrougha 105-mmfocallengthlensandproduceda focusedcrossoverpoint shapinga36-#m-diameterby 100-#m-longellipticalmeasurementvolume.Thecrossbeamanglewas26.78°. Scatteredlight wascollectedby theobjectivelensof a 2.27xopticalexpanderidenticalto that usedin thetransmittersystem.Theexpanderformeda collimatedbeamof thecollectedlight, passedit throughthe40-mmapertureof a200-mmfocallengthlens,andfocusedit ona 200-#m-diameterpin holesetbeforeaphotomultiplier.Thetransmitandreceiveopticalsystemsweremountedon a scanrig that had a 1.0-/lmpositioningresolution.(Seefig. 2.) Inthefinalopticalarrangement,themeasurementvolumewaspositionedin a horizontalplanethatpassedthroughthe axisof the cylindricMresearchlasertube.
The electronicssystemthat is shownin figure 3 consistedof a frequency-burstcounter,microcomputer,printer, andmiscellaneouselectronics.Thefrequency-burstcounter,areal-timeprocessorthat measuresthe periodof Dopplerfrequencywith 1.0-nsresolution,hasan inputfrequencyrangecapabilityof 1kHzto 150MHz. It wasequippedwith bandp_s flters, double-thresholdzero-crossingdetectors,andcomparisoncircuitry for extraneousnoiserejection.Thissignalprocessorprovidesa digitizedoutput of the measuredfrequency,whichis processedwiththe microcomputer.Theresultingvelocityinformationis storedona disk.
Perfluoroalkyl Iodide Vapor System
The experimentalsetupfor the cw perfluoroalkyliodidelasersystemwith continuousflowis shownin figure4. To maintainanefficientoperatingsystem,the quenchingproductsthatformedbecauseof photodissociationof the iodide vaporin the pumpingregionwerepurgedfrom thelasertube. Thevaporflowwasmaintainedby a pressuredifferentialbetweena heatedevaporatorthat containsliquid iodideand a liquid nitrogen-cooledcondenser.Perfluoroalkyliodideis in a liquid stateat roomtemperatureandhasa vaporpressureof 350torr; to ensureasufficientflowrate of iodide,theevaporatorwasimmersedin a tub of heatedwaterandstirredwith a magneticstirrer. The temperatureof the waterwaskept constantat 40°Cto providean initial vaporpressureof about 101kPa. Beforethe lasantchemicalswereinserted,the lasertube,evaporator,andcondenserwereevacuatedwith a diffusionpumpthat wasequippedwitha liquid nitrogentrap. A massflowmeter,connectedbetweentheevaporatorandthe lasertube,wasusedto monitorthe iodidevaporflowrate,whichwascontrolledbyan in-linevalvebetweenthe flowmeterandtheevaporator.Theaveragedflowvelocitywascalculatedby
FV = 0.127-- (2)
AP
where F is the mass flow rate in standard cubic centimeters per minute (SCCM), A is the laser
tube cross-sectional area in centimeters squared, P is the laser tube iodide vapor pressure in
torr, and V is the velocity in meters per second. The numerical constant (0.127) is the result ofunit conversion. When the valve opening is left fixed, the mass flow rate of the iodide vapor is a
linear function of the laser tube pressure. This linear progression indicates that the velocity of
the vapor in the laser tube remained constant for different flow rates. Therefore, the flow velocity
was varied by another valve located downstream between the laser tube and the condenser.
Two different Suprasil-grade quartz laser tubes were used in these experiments; they measured
20 and 36 mm inside diameter (id) by 900 mm long. Stainless steel tubes were used in the flowlines between the laser tube ends, evaporator, and condenser. These flow line tubes were 900 mm
long by 12.7 mm id and were connected to the laser tube at approximately 45 ° to the flow axis.
This arrangement" was used to achieve nearly axial flow.
3

SeedingSystem
During the lasing process, iodide particles are formed in the vapor flow. In initial experiments,we attempted to use these naturally occurring particles as tile light-scattering media for the LDV
measurements. However, this scheme failed because not enough scattering material of a sufficient
size was present for the LDV to operate.
Adequate signals for flow velocity measurements required the iodide vapor flow to beartificially seeded. The seeding system that is shown in figure 5 consists of two micromesh
sieve sections, a seed material reservoir, and a control valve. Aluminum oxide (A12Oa) particles
were used as the seeding material. The supplier classifies the size of the material based on its
crystal structure; the 0.3-#m material used in these tests was hexagonal.
The seeder was evacuated to about l0 tort by an external vacuum-pumping system. After
the evacuation, the seeder valve was closed to maintain the reduced pressure inside the seeder.
Next, the seeder was connected to the iodide vapor flow lille, and the iodide flow was brought to
the needed pressure by adjustments to the valves in the flow line. When the operating pressurewas established and the flow conditions were recorded, tile seeder valve was opened and A1203
particles were gravity fed into the flow. The electromechanical vibrator was used to maintain a
constant feed of particles.
Error Analysis
Because the LDV measures the velocity of individual particles, the accuracy of the measure-
ment depends on how well these particles track the flow. The severity of the particle lag depends
on the particle mass density, size, and local flow conditions. Because the velocities were low, the
lag error was assumed to be negligible.
Other error sources were derived from tile optical system, the electronics system, and themeasurement fincertainties due to the statistics of the velocity ensemble. The principal error
source in the optical system is from tile crossbeam angle measurement uncertainty. This
uncertainty yields a bias error that can be expressed as
V - cot A0 (3)
where 0 is the angle between the intersecting beams along the optical axis in degrees and A0 is the
uncertainty of the measured angle expressed in radians. For a crossbeam angle of 26.78°-t - 0.13 °the bias error in velocity attributed to tile uncertainty in angle is =kl.0 percent.
An additional, potentially significant optical system error occurs when the crossover and
focal points of the beams do not converge at the same location. This optical error results in a
negative bias in tile final mean velocity value (ref. 7). Based on tile method given in reference 7
and assuming a worst case situation where the pair of beam focal points and the crossover pointare displaced 10 mm, the estimated bias error is -0.6 percent.
For the electronics system, two other significant error sources (refs. 8 and 9) must be con-
sidered. These errors are frequency dependent, are associated with the electronic burst-counter
signal processor, and are attributable to counter clock synchronization and quantizing. Clock
synchronization error occurs when the randomly occurring Doppler frequency is mismatched tothe start cycle of the counter internal "free-running" reference clock. This bias error is caused by
a 1-clock-count uncertainty in the total measured period of the input Doppler frequency. Quan-
tizing errors occur because the digitizing process of the period for a fixed number of Doppler

cycles has an uncertainty of 1 clock count. An estimate of velocity c, and turbulence-intensity
errors e_ from these sources is given by
c, = 2(1 +'_2)+ _(1 + 3_ 3) (4)
q2---- q(1 - .y2) + (5)
6_/---_
where
fD (6)q--Nfc
N
fc
fD
turbulence intensity
number of Doppler cycles
reference clock frequency
Doppler frequency
For example, consider a flow condition encountered during these tests; that is, tile mean
velocity flow was 16.5 m/see with a 5- to 20-percent turbulence-intensity range. This condition
produces a 12.2-MHz mean Doppler frequency. The test system had a signal-processing
counter operating with a 1-GHz reference clock and an 8-Doppler-cycle count requirement. The
estimated errors for this test situation are eu = 0.08 percent and e_ = 0.09 percent.
The measurement results were based on the statistical mean and the standard deviation of an
ensemble of individual scattering events, where each velocity ensemble consists of 1000 scattering
events. The standard error of the velocity mean and the standard deviation provide a measure
of the uncertainty in the given results. A typical ensemble gave the following standard errors of
the mean and standard deviation:
For the 20-mm-id laser tube with lid = 35,
crm = 0.2 to 0.4 percent
as = 2.2 percent
For the 36-mm-id laser tube with lid = 24,
am = 0.2 to 0.8 percent
as = 2.2 percent
In summary, the mean velocity values have an estimated +0.4 to -1.6 percent bias and
=t=0.3 to 0.9 percent random uncertainties. The turbulence-intensity values have an estimated
=t=2.3 percent uncertainty.
Results and Discussion
Flow Velocity Profile Measurements
Velocity and turbulence-intensity profile measurements were made in the 36- and 20-mm-id
tubes at operating pressures of 5.0 + 0.1 and 9.7 + 0.2 torr, respectively. Because access to the

36-mm-id laser tube was limited, velocity profile data were obtained at one axial location,
I/d -- 24, which is referenced to the iodide vapor inlet (fig. 6). For the 20-mm-id laser tube,LDV measurements were made at various axial locations, as shown in figure 7. Because of the
flow system characteristics, the iodide vapor that entered the laser tube expanded, which caused
tile flow to separate from the tube wall and to form eddies. During that process, the local flow
velocity was abruptly reduced and the resulting flow velocity profile became asymmetric andhighly turbulent. This effect is evident in the profiles in figure 8. Velocity measurements at the
downstream location I/d = 4.5 near tile wall opposite the iodide vapor inlet (+0.75-cm position
in fig. 7(a)) were not obtained because the flow was separated and no particles were entrainedthere. However, complete flow velocity profiles at 4-0.75 cm about the centerline were obtainedfl_rther downstream as the flow became more structured and less turbulent.
Typical histograms of the velocity data for the 36- and 20-mm-id laser tubes are shown in
figures 8 and 9. These histograms show tile statistical nature of the LDV data. In general, the
histograms have an approximately normal distribution with a slight skew to the low-velocity side.
The increasing width of the histograms shows an increasing level of turbulence as the side wallsare approached. The reported mean velocities were derived from the statistical means of the
histograms, and the estimated turbulence levels are based on the statistical standard deviations
of the histograms.
Comparison of Pressure and Mass Flow Systems
The pressure and mass flow systems, typically used to estiinate the average iodide vapor
flow velocity, were compared with the estimated average velocity across the laser tube. (Sce
fig. 10.) The estimated average velocities (tables I and II) were based on the corresponding"pipe factor" multiplied by the LDV mean axial centerline velocities. The "pipe factor" is
defined as the average velocity value for the radial distribution of the mean axial velocities
divided by the centerline velocity (fig. 11). For the 20- and 36-mm-id laser tubes, the pipe
factors were estimated as 0.86 and 0.85, respectively. A linear regression analysis of the results(fig. 10) uscd
V = mVc + b (7)
where V is the estimated average velocity, Vc is the calculated value using pressure and flowmcter
data, m is the slope of the regression analysis, and b is the intercept to show the following:
For the 20-mm-id laser tube,
rn = 1.00
b = 0.33
CorrcIation coefficient = 0.999
For the 36-mm-id laser tut)e,
rn = 1.06
b = 0.00
Correlation coefficient = 0.990
The correlation coefficients show that data gave a good straight-line fit. However, the slope
of the analysis shows a 6-percent bias between the measured and the calculated values for the
36-mm-id laser tube. In most cases, the calculated velocities were higher than the estimated
6

average velocities. These differences are attributed mostly to the way that tile average velocity
was estimated that is, on an assumed pipe factor and on the LDV mean axial centerline velocity
measurements. In summary, estimated average velocities and velocities derived from pressure
and mass flow measurements agreed within 6 percent.
Conclusion
Perfluoroalkyl iodide vapor flow-field measurements were made in a continuous wave (cw),
solar-simulated, pumped chemical laser system that featured a laser Doppler velocimeter (LDV)
system. The measurements were obtained for 20- and 36-mm-id laser tubes under nonlasing
conditions. The mean velocity and turbulence-intensity profiles across the laser tube diameter
were obtained at different locations. The mean and turbulence-intensity values ranged from 7
to 17 m/see and 6 to 30 percent, respectively. This study showed that the level of turbulence was
higher than generally anticipated. Therefore, modeling of the flow field should include consider-
ations for the effects of turbulence. Findings from the pressure and mass flow instrumentation,
normally used to monitor the vapor flow velocity, were compared with data from the LDV. Es-
timated average velocities, based on LDV mean axial centerline velocities and a corresponding
pipe factor, showed that the calculated values for the pressure and mass flow systems agreed
within 6 percent. The LDV has provided flow velocity data for calibrating the installed instru-
mentation and for analyzing the flow characteristics of perfluoroalkyl iodide (n-C3F7I) vapor
inside variously sized laser tubes.
NASA Langley Research Center
Hampton, VA 23681-0001
October 22, 1992
References
1. Lec, Ja H.; Lee, Min H.; and Wcaver, Willard R.: High Power CW Iodine Laser Pumped by Solar Simulator.
Proceedings of the International Conference on Lasers "86, R. W. McMillan, cd., Soc. for Optical & Quantum
Electronics, 1987, pp. 150 156.
2. Thompson, H. Doyle; and Stevenson, V_arren H.: Laser Veloeimetry and Particle Sizing. Hcmisphere Publ.
Corp, c. 1979.
3. Gartrell, Luthcr R.; and Rhodes, David B.: A Scanning Laser-Vcloeimcter Technique for Measuring Two-
Dimensional Wake- Vortex Velocity Distributions. NASA TP-166I, 1980.
4. Gartrell, Luther R.; and Jordan, Frank L., Jr.: Demonstration of Rapid-Scan Two-Dimensional Laser Velocimetry
in the Langley Vortex Research Facility for Research m Aerial Applications. NASA TM-74081, 1977.
5. Young, Warren H., Jr.; Meyers, James F.; and Hcpner, Timothy E.: Laser Vclocimeter Systems Analysis Applied
to a Flow Survey Above a Stalled Wing. NASA TN D-8408, 1977.
6. Van de Hulst, H. C.: L_ght Scattering By Small Particles. John Wiley & Sons, Inc., c.1957.
7. Hanson, Steen: Broadening of the Measured Frequency Spectrum in a Differential I.m_er Anemometer Due to
Interference Plane Gradients. Y. Phys. D: AppI. Phys., vol. 6, no. 2, Jan. 1973, pp. 164171.
8. Wang, J. C. F.: Measurement Accuracy of Flow Velocity Via a Digital-Frequency-Countcr Laser Vclocimeter
Processor. The Accuracy of Flow Measurements by Laser Doppler Methods: Proceedings LDA-Symposium
(Copenhagen), Technical Univ. of Denmark, 1976, pp. 151-175.
9. Gartrell, Luther R.; Gooderum, Paul B.; Hunter, William W., Jr.; and Meyers, James F.: Laser VeIocimetry
Technique Applied to the Langley 0.3-Meter Transonic Cryogenic Tunnel. NASA TM-81913, 1981.

Table I. Data for Flow System Calibration Using 36-mm-id Laser Tube and n-C3F7I
Flowmeter
reading3000028 5O01700030007000
1300O2200025 00032000
Flow rate,SCCM
540051003000
540I2602340396045005760
Pressure,torr
7.57.57.57.54.05.06.06.27.8
Calculated
velocity, m/see9.08.55.1
.93.95.88.29.19.2
Measured
mean
velocity, m/scc10.8
9.75.21.24.66.68.9
10.010.4
Estimated
averagcvelocity, m/sec
9.38.34.51.04.05.77.78.68.9
Table II. Data for Flow System Calibration Using 20-mm-id Laser Tube and n-CaF7I
Flowmeter
reading
22 2001920013 50012000lll00
9 70072004 200
Flow rate,SCCM
Pressure,torr
Calculated
velocity, m/see3996 11.13456 11.12430 11.12160 11.21998 11.21746 ll.11296 11.1
756 13.0
14.612.68.97.87.26.44.72.3
Measuredmean
velocity, m/sec15.913.99.58.78.07.15.42.9
Estimated
averagevelocity, m/sec
I3.511.8
8.17.46.86.04.62.5
8
,aser_A_'--.._
Lens ParticleTo processor
Amp"tude'l Ivo,tsTime (psec)
Burst signal
Figure 1. The LDV technique.
L-90-8307
Figure 2. The LDV system mounted on scan rig.
9
BLACK
ORIGINAL F AG t:.
AND WHITE PHOTOGRAPH

High-speed i Wide-band i- Pho nburst counter _1-" I amplifier _ ,..to
| , ', mumpller
tube
I micro32or_puter _4_ Storage [
Figure 3. The LDV electronics system.
L-90-4846
10
8LACK
ORIGINAL FAGE
AND WHITE P,HOTOQI_API-I

Mirror
Detector
To vacuum
Jim:
Water jI[out
ssure
H output
I--'} _ Liquid
I //_.,] nitrogen
n-C3F71Condenser
,_1 Arc lamp
_11 -,,11
' IfElliptical Ireflector
Waterin
Eval
Mirror
:::1 Seeder I
::_ Pressure (input)
Flowmeter
To vacuum --_
_]-_ Water
n-C3F71
)orator
Figure 4. Continuous flow solar-pumped iodide l_er system.
L-90-9059
Figure 5. The seeding apparatus.
ORIGINAl: FAGE
13LACK AND WHITE PHOTOGRAPH11

12
11
10t_)
E 9
8
7
6. 2
o
o Test 1Test 2
,> Test 3•, Test 4
0
Radial distance, cm
(a) Velocity profile.
2° I
10L
2_51-
8
0
i o Test 1; o Test 2! ,> Test 3
" Test 4
8
_e_ _o°
!i
Oz_O
I I I-1 0 1 2
Radial distance, cm
(b) Longitudinal turbulence intensity.
Figure 6. Mcasurements of LDV in 36-mm-id laser tube at 5 tort and l/d = 24.
12

17
16
o 15
E
13-
12-1
18-
17-
o 16
E
14
t3-
m • f/d = 6.5I/d = "fO
I0
Radial distance, cm
(a) Velocity profile.
3O
£qJa. 20
¢.or--
810
0
m I/d= 4.5•l/d = 6.5
l/d= 10l0
Radial distance, cm
('b) Longitudinal turbulence intensity.
I0 "-J
1Radial distance, cm
16
• l/d= 21_ _ • l/d = 28
_12 =
g
6
-1 0
Radial distance, cm
['c) Velocity profile. (b) Longitudinal turbulence intensity.
Figure 7. Measurements or" LDV in 20-mm-id laser tube at I0 torr.
13

G).o
0_
5.00
3.75
2.50
1.25
4 8 12Velocity, m/sec
(a) x= 1.5cm.
_J16 20
oO-
5.00 I
1.25
0 4 8 12 16Velocity, m/sec
(b) x = -1.2 cm.
20
5.00 5.00
13_
3.75
2.50
1.25
3.75
1.25
_J4 8 12 16 20 0 4 8 12
Velocity, m/sec Velocity, mlsec
(c) x = -0.9 cm. (d) x = -0.6 cm.
Figurc 8. Typical velocity histogram plots for 36-mm-id laser tube at 5 tort and lid = 24.
16 20
14

t,-
8G)
13_
5.00 -
3.75 -
2.50 -
1.25 -
0 4 8 12 16 20Velocity, m/sec
E
1.25 _
0 4 8 12 16 2OVelocity, m/sec
(e) x= -0.3 cm. (f) x = 0.0 cm.
5.00 I
3.75 _-
2.50
1.25
0 4 8 12 16 20Velocity, m/sec
E
.oq0
13-
1.25
0 4 8 12 16 20Velocity, m/sec
(g) x=0.3 cm. (h) x = 0.6 cm.
Figure 8. Concluded.
15

5.00- 5.00 -
a)
G)o_
3.75
2.50
1.25
0 5 10 15 20 25Velocity, m/sec
(a) x = -0.75 cm.
3.75 -
E
o 2.50-
"tjil1.25
1 I ,, .L
0 5 10 15 20Velocity, m/sec
(b) x = -0.5 cm.
I
25
5.00 5.00 f3.75 f 3.75
z1.25 1.25
0 5 10 15 20 25 0 5 10 15 20 25Velocity, m/sec Velocity, m/sec
(c) x = -0.25 cm. (d) x = 0.00 cm.
Figure 9. Typical velocity histogram plots for 20-mm-id laser tube at 10 torr and lid = 34.75.
16

5.00 - 5.00 -
E<D
11-
3.75
2.50
1.25
5
3.75
i 2.50
ne 1.25
10 15 20 25 0
Velocity, m/sec
(e) x = 0.25 cm.
5 10 15 20 25
Velocity, mlsec
(f) X = 0.50 cm.
_E
.o13.
5 10 15 20 25
Velocity, m/sec
(g) x = 0.75 cm.
Figure 9. Concluded.
17

15--
10
5
15--
10
5
[2 4 6 8 10 0
Vc, m/sec
5 10 15
Vc, m/sec
(a) _7 = 0.86 I').; 36 mm id. (b) V = 0.85 l<_n; 20 mm id.
Figure 10. Estimated versus calculated velocity for flowmeter calibration.
E
15
10 ¸
20-
15
OQ)
El0
$
I I 1 I I I ]0 .01 .02 .03 .04 0
Position, m
.005 .010 .015 .020
Position, rn
(a) 36 mm id. (b) 20 mm id.
Figure 11. Curve-fit plots of LDV mean axial velocity distributions for estimating pipe factor in laser tubes.
18


REPORT DOCUMENTATION PAGE Form Approved
OMB No. 0704-0188
Public reporting burden for this collection of information is estimated to average 1 hour per response, including the time for reviewing instructions, searching existing data sourcesgathering and maintalning the data needed, and completing and reviewing the collection of information Send comments regarding this burden est mate or any other aspect of th scollection of information, including suggestions for reducing this burden, to Washington Headquarters Services Directorate for Information Operations and Reports 1215 JeffersonDavis Highway, Suite 1204, Arlington. VA 22202-4302, and to the Office of Management and Budget, Paperwork Reduction Project (0704-0188), Washington, DC 20503,
1. AGENCY USE ONLY(Leave blank) 2. REPORT DATE 3. REPORT TYPE AND DATES COVERED
February 1993 Technical Memorandum
4. TITLE AND SUBTITLE 5. FUNDING NUMBERS
Application of Laser Doppler Vclocimeter to Chemical VaporLaser System WU 505-59-54-03
6. AUTHOR(S)
Luther R. Gartrell, Bagher M. Tabibi, VVilliam W. tIunter, Jr.,Ja H. Lee, and Mark T. Fletcher
7. PERFORMING ORGANIZATION NAME(S) AND ADDRESS(ES)
NASA Langley Research CenterHampton, VA 23681-0001
9. SPONSORING/MONITORING AGENCY NAME(S) AND ADDRESS(ES)
National Aeronautics and Space AdnlinistrationV_Tashington, DC 20546-0001
8. PERFORMING ORGANIZATION
REPORT NUMBER
L-17072
10. SPONSORING/MONITORING
AGENCY REPORT NUMBER
11. SUPPLEMENTARY NOTES
Gartrell, Hunter, Lee, and Fletcher: Langley Research Center, Hampton, VA; Tabibi: Hampton University,Hantpton, VA.
12a. DISTRIBUTION/AVAILABILITY STATEMENT
Unclassified Unlimited
Subject Category 36
12b. DISTRIBUTION CODE
13.°ABSTRACT (Maximum 200 words)
A laser Doppler velocimeter (LDV) system has been used to measure iodide vapor flow fields inside two different-sized laser tubes. Typical velocity profiles across tile laser tubes were obtained with an estimated +1 percentbias and ±0.3 to 0.5 percent random uncertainty in the mean values and ±2.5 percent random uncertaintyin the turbulence-intensity values. Centerline velocities and turbulence intensities for various longitudinallocations ranged from 13 to 17.5 m/see and 6 to 20 percent, respectively. In view of these findings, the effectsof turbulence should be considered for flow field modeling. The LDV system provided calibration data forpressure and mass flow sytems used routinely to monitor the research laser gas flow velocity.
14. SUBJECT TERMS
Laser velocimeter; Flow velocity measurenlent; Lasers
17. SECURITY CLASSIFICATION
OF REPORT
Unclassified
_ISN 7540-01-280-5500
18. SECURITY CLASSIFICATIOI_
OF THIS PAGE
Unclassified
19. SECURITY CLASSIFICATION
OF ABSTRACT
15. NUMBER OF PAGES
19
16. PRICE CODE
A0320. LIMITATION
OF ABSTRACT
Standard Form 298(Rev. 2-89)Prescribed by ANSI Std Z3g-18298-102
NASA-Langley, 1993