
Application of integrated data mining techniques in stock market forecasting … · Application of...
18
Page 1 of 18 RESEARCH ARTICLE Application of integrated data mining techniques in stock market forecasting Chin-Yin Huang and Philip K.P. Lin Cogent Economics & Finance (2014), 2: 929505
Transcript of Application of integrated data mining techniques in stock market forecasting … · Application of...

Page 1 of 18
ReseaRch aRticle
Application of integrated data mining techniques in stock market forecastingChin-Yin Huang and Philip K.P. Lin
Cogent Economics & Finance (2014), 2: 929505

Huang & Lin, Cogent Economics & Finance (2014), 2: 929505http://dx.doi.org/10.1080/23322039.2014.929505
ReseaRch aRticle
Application of integrated data mining techniques in stock market forecasting Chin-Yin Huang1* and Philip K.P. Lin1
abstract: Stock market is considered too uncertain to be predictable. Many individuals have developed methodologies or models to increase the probability of making a profit in their stock investment. The overall hit rates of these methodologies and models are generally too low to be practical for real-world application. One of the major reasons is the huge fluctuation of the market. Therefore, the current research focuses in the stock forecasting area is to improve the accuracy of stock trading forecast. This paper intro-duces a system that addresses the particular need. The system integrates various data mining techniques and supports the decision-making for stock trades. The proposed system embeds the top-down trading theory, artificial neural network theory, technical analysis, dynamic time series theory, and Bayesian probability theory. To experimen-tally examine the trading return of the presented system, two examples are studied. The first uses the Taiwan Semiconductor Manufacturing Company (TSMC) data-set that covers an investment horizon of 240 trading days from 16 February 2011 to 23 January 2013. Eighty four transactions were made using the proposed approach and the investment return of the portfolio was 54% with an 80.4% hit rate during a 12-month period in which the TSMC stock price increased by 25% (from $NT 78.5 to $NT 101.5). The second example examines the stock data of Evergreen Marine Corporation, an international marine shipping company. Sixty four transactions were made and the in-vestment return of the portfolio was 128% in 12 months. Given the remarkable invest-ment returns in trading the example TSMC and Evergreen stocks, the proposed system demonstrates promising potentials as a viable tool for stock market forecasting.
Keywords: forecasting, decision-making, top-down trading, artificial neural network, dynamic time series, Bayesian probability
*Corresponding author: Chin-Yin Huang, Department of Industrial Engineering and Enterprise Information, Tunghai University, Taichung 407, Taiwan E-mail: [email protected]
Reviewing Editor:David McMillan, University of Stirling
Further author, article and funding information is available at the end of the article
AuTHOr BiOGrAPHYChin-Yin Huang is professor in the Department of industrial Engineering & Enterprise information at Tunghai university, Taichung, Taiwan. Meanwhile, he serves as the Chairman of international Foundation for Production research in Asia-Pacific region. He had a PhD from Purdue university, uSA. His research interests include agent-based integrated systems, distributed production planning, and big data analysis. His publications appear in international Journal of Production research, Computers in industry, Computers and industrial Engineering, robotics and Computer-integrated Manufacturing, Epilepsy research, and international Journal of Production Economics, Engineering Computations, and Production Engineering. He also co-authored chapters for Handbooks of industrial Engineering, Handbook of industrial robotics, and Handbook of Automation.
PuBLiC iNTErEST STATEMENTThis paper introduces insightful knowledge about using integrated data mining techniques for stock market forecasting. The integrated approach is not only novel but also effective, because its high hit rate in stock forecasting is rarely seen in literature. By taking two stocks, Taiwan Semiconductor Manufacturing Company (TSMC) and Evergreen Marine Corporation, for an investigation during a 12-month period, the results showed that the investment returns of the portfolio were 54 and 128% for TSMC and Evergreen, respectively. Note, the stock prices changed by +25% and −7.7% for TSMC and Evergreen, respectively. Given the remarkable investment returns in trading the example TSMC and Evergreen stocks, the proposed system demonstrates promising potentials as a viable tool for stock market forecasting.
Received: 19 November 2013Accepted: 22 May 2014Published: 03 July 2014
© 2014 The Author(s). This open access article is distributed under a Creative Commons Attribution (CC-BY) 3.0 license.
Page 2 of 18

Page 3 of 18
Huang & Lin, Cogent Economics & Finance (2014), 2: 929505http://dx.doi.org/10.1080/23322039.2014.929505
1. introductionForecasting stock investment return is an important financial issue that has been given a lot of at-tentions (Matías & reboredo, 2012). in the last decade, a number of intelligent systems and hybrid models have been proposed for making trading decisions in an attempt to outperform the main market and be profitable in stock investment (Atsalakis & Valavanis, 2009b). The nature of stock market prediction requires the combining of several computing techniques synergistically rather than exclusively (Jang, Sun, & Mizutani, 1997). it is essential to clarify as predicting the “stock mar-ket trend.” in reality, it is impossible to predict the future absolute value of the stocks on a daily basis. However, based on the assumption that is largely supported by real case studies that with appropriate training over any (uptrend, down-trend, and flat) horizon one could have enough indica-tors to forecast the trend with significant accuracy. Future trends may be predicted to some extent based on some key indicators and past behaviors.
Forecasting requires the knowledge of the dominant market variables that “explain” stock market behavior which is both dynamic and volatile. Due to system uncertainties and other unknown (random) factors, every stock market model is approximate. Thus, once model uncertainty is acknowledged, soft computing techniques emerge as the best candidates chosen over standard benchmark linear models to deal with such problems (Atsalakis, Dimitrakakis, & Zopounidis, 2011). One of the best ways to model the market value is the use of expert systems with artificial neural networks (ANN), which is void of standard formulas and can easily adapt the changes of the market. in literature, many ANN models are evaluated against statistical models for forecasting the market value. it is observed that in most of the cases ANN models give better results than other methods (Guresen, Kayakutlu, & Daim, 2011). The proposed system in this research is a hybrid intelligent forecast system combined with ANN. it may predict with significant accuracy stock price trends using historical stock market prices from the Taiwan Stock Exchange (TSE) and gives very encouraging results. The trend of the Taiwan Semiconductor Manufacturing Company (TSMC) stock and the Evergreen Marine Corporation stock were predicted with an 80.4% or higher accuracy. This percentage of accuracy corresponds to a ratio 4:1 (80.4/19.6) of making a 54% profitable stock transaction in a year-long window in which the global recession was at its height and most trading was non-profitable. All case studies performed on the returns of the TSE stocks result in 80% or higher accuracy. in the sections that follow, we propose a system that integrates various data mining techniques to support the stock trading decision-making. The system also incorporates the theory of top-down trading and tandem trading pioneered by Livermore (1940). The theory was found useful in stock forecasting. Analysis of top-down analysis in stock prediction is vital for two important reasons. One is the top-down analysis of the market direction. The investor must know the overall trend of the market before making a trade. This applies to the stock market, the industry group, and individual stocks. The method is to probe whether the market, the industrial group, or the stock is headed up, down or sideways (Leung, Daouk, & Chen, 2000). Then, the individual stock is investigated by the system integrated with data mining techniques including technical analysis, Bayesian probability theory, dynamic time series theory, and ANN.
in this research, we start with checking the main market. The step is to know which way the over-all market is headed: up, down, or sideways. Secondly, we examine the specific industry group to make sure that the group is moving in the same direction in order to increase the chance of making a profit on the trade. Thirdly, we review the sister stocks to see if the stock is moving in the same direction. in the fourth step, all three factors are examined at the same time; that is, considering the overall market, the industry group and the sister stocks simultaneously. it can be clearly seen how the system works when all factors are in unison. Lastly, the system that integrated data mining techniques is employed to attain the stock up/down prediction.
The remaining sections of this paper are organized as follows. Section 2 gives the background of the related studies. Section 3 introduces the system of data mining techniques used in this study and Section 4 provides results of the approach using the daily TSE stock price. The final section gives

Page 4 of 18
Huang & Lin, Cogent Economics & Finance (2014), 2: 929505http://dx.doi.org/10.1080/23322039.2014.929505
the conclusion and recommendations for future research. This paper contributes to the study of in-telligence forecasting. it would also help to realize profitable stock transactions if properly implemented.
2. literature Review and Related WorkMany financial analysts and stock market investors seem convinced that they can make profits by employing one technical analysis approach or another to predict stock market. Some use time series models expressed by financial theories to forecast a series of stock price data. ANN is usually chosen as a stock prediction tool besides other methods. Yet, these approaches cannot be employed alone because they are not directly applicable to predict the market value which is always subject to external impact. The nature of the stock market is affected by system uncertainties and other unknown (random) factors. Prediction requires combining several computing techniques synergistically rather than exclusively (Chavarnakul & Enke, 2009; Zarandi, Hadavandi, & Turksen, 2012). Thus, it necessarily indicates the hybrid use of technical analysis, time series forecasting, and possibly ANN. in the following, a review is given to the recent development of hybrid approach for the prediction of the stock market.
Technical analysis and ANN were used by Mandziuk and Jaruszewicz (2011). They introduced an experimental evaluation of a neuro-genetic system for the prediction of the short-term stock index. The buy/sell signals generated by the technical analysis, MACD, Williams, Moving Averages (MA), and relative Strength indicator (rSi) are considered for stock trading. Their results showed that predic-tion based on the neuron-genetic model worked well during both uptrend and downtrend.
The approach developed by Tan, Quek, and Yow (2008) involves the use of technical analysis and neuro-fuzzy. Their intelligent stock trading system combines the superior predictive capability of a fuzzy neural network and the widely accepted MA and rSi trading rules. The system was able to identify and predict overbought/oversold trends in the stock counter and alert the investor to buy at the start of an uptrend and to sell off just before the trend reversed and the stock counter went into a decline.
Atsalakis et al. (2011) adopted the Elliot wave theory and a neuro-fuzzy approach. They presented the Wave Analysis Stock Prediction system, which was based on the neuro-fuzzy architecture that utilized the Elliott Wave Theory. The system showed a tendency to achieve hit rates in the 60% mark which was significantly better than forecasting with the help of a coin.
The approach by Abraham, Nath, and Mahanti (2001) incorporated the principal component anal-ysis and ANN. A hybridized soft computing technique for the automated stock market forecasting and trend analysis is used along with the principal component analysis to preprocess input data before they are fed to an ANN for stock forecasting.
Zuo and Kita (2012) presented a Bayesian network technique to predict the up/down analysis of the daily stock indexes and the result were compared with the psychological line and trend estima-tion technical analyses. The average correction rate of their algorithm was almost 60%, which is almost equal to or higher than the technical psychological line (50–59%) and the trend estimation (50–52%).
Chen, Su, Cheng, and Chiang (2011) explored pattern recognition and time series forecasting. Theirs was a novel price-pattern detection method that looked for certain price-patterns (“price trend” and “price variation”) contained in the time series variables that can be used to forecast the stock market.
3. the Proposed Methodology—integrated Data Mining techniquesThis paper presents a system that incorporates the top-down trading theory first introduced by Livermore (1940) and various data mining techniques. Livermore believed that stock trends follow a trend line that can be used to forecast both in the long- and short-term. He published this particular
Page 5 of 18
Huang & Lin, Cogent Economics & Finance (2014), 2: 929505http://dx.doi.org/10.1080/23322039.2014.929505
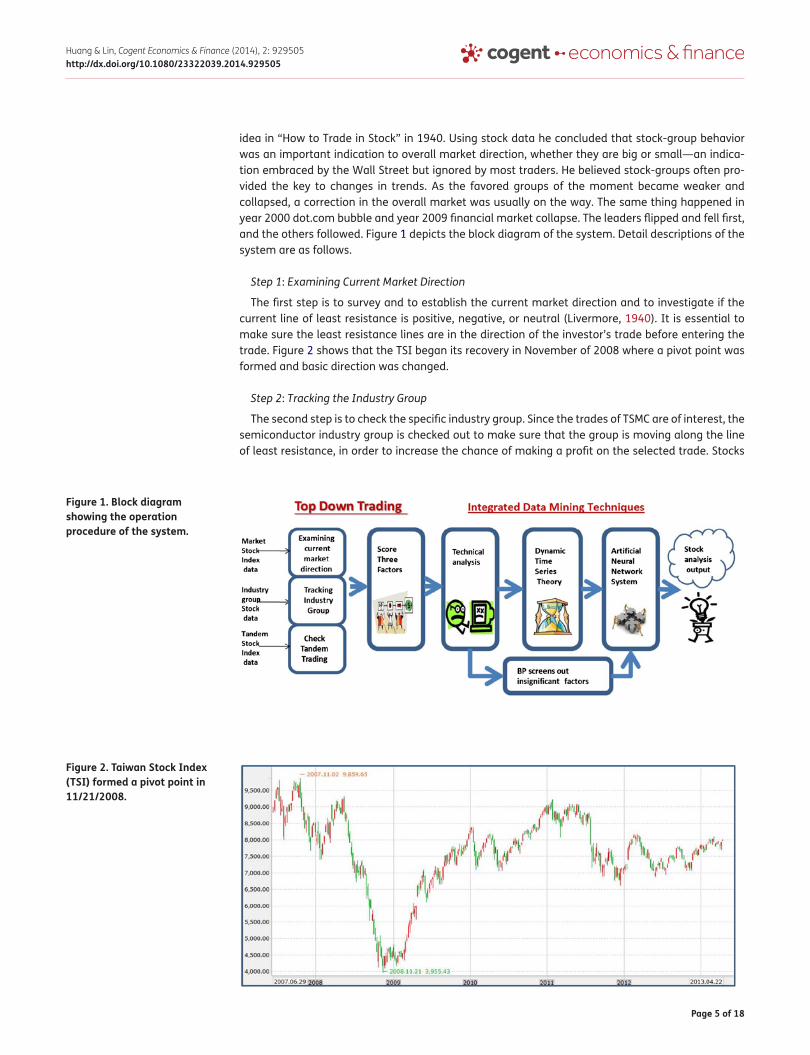
idea in “How to Trade in Stock” in 1940. using stock data he concluded that stock-group behavior was an important indication to overall market direction, whether they are big or small—an indica-tion embraced by the Wall Street but ignored by most traders. He believed stock-groups often pro-vided the key to changes in trends. As the favored groups of the moment became weaker and collapsed, a correction in the overall market was usually on the way. The same thing happened in year 2000 dot.com bubble and year 2009 financial market collapse. The leaders flipped and fell first, and the others followed. Figure 1 depicts the block diagram of the system. Detail descriptions of the system are as follows.
Step 1: Examining Current Market Direction
The first step is to survey and to establish the current market direction and to investigate if the current line of least resistance is positive, negative, or neutral (Livermore, 1940). it is essential to make sure the least resistance lines are in the direction of the investor’s trade before entering the trade. Figure 2 shows that the TSi began its recovery in November of 2008 where a pivot point was formed and basic direction was changed.
Step 2: Tracking the Industry Group
The second step is to check the specific industry group. Since the trades of TSMC are of interest, the semiconductor industry group is checked out to make sure that the group is moving along the line of least resistance, in order to increase the chance of making a profit on the selected trade. Stocks
Figure 1. Block diagram showing the operation procedure of the system.
Figure 2. taiwan stock index (tsi) formed a pivot point in 11/21/2008.

Page 6 of 18
Huang & Lin, Cogent Economics & Finance (2014), 2: 929505http://dx.doi.org/10.1080/23322039.2014.929505
do not move alone. When they move, they move in a group. The semiconductor industry group be-gan its recovery in November of 2008, the same time TSi began its recovery in Figure 2. in July/August, it gave a clear signal that the line of least resistance was upward. The signals confirmed that the trend was now heading to the upside.
Step 3: Checking Tandem Trading
Tandem trading involves comparing two stocks of the same group by comparing the stock of inter-est in trading with its sister stocks. To trade in TSMC, the Taiwan MediaTek is examined as a sister stock. Both stocks bottomed out in December of 2008 and gave a signal, by a pivotal point, that the line of least resistance was positive. Because the broker/dealers are also often an important bell-wether group for what the market may do in the future, this chart action was a precursor of what was to come in the overall market (see Figure 4).
Step 4: Scoring the Three Factors
in the fourth step, the previous three factors, namely the market, the industry group, and the Tandem stocks, are examined all together. it can be clearly seen in Figures 2–5 that all factors are in unison. All the signals in the figures show a bottoming out in November and a reversal in trend, clearly indicating that the line of least resistance was now upward in direction. The rules to score the three factors are described as follows.
Figure 3. semiconductor group gave a clear signal that the trend was upward in November of 2008.
Figure 4. Mediatek stock formed a pivot point in 12/12/2008.

Page 7 of 18
Huang & Lin, Cogent Economics & Finance (2014), 2: 929505http://dx.doi.org/10.1080/23322039.2014.929505
rule 1: if the TSi and individual stock value are the same (upward, downward, or flat), the score is 1 and −1 otherwise
rule 2: if the industry group and individual stock value are the same (upward, downward, or flat), the score is 1 and −1 otherwise
rule 3: if the tandem stock and individual stock value are the same (upward, downward, or flat), the score is 1 and −1 otherwise
rule 4: Sum up the scores of rules 1–3. The summed score is considered one of the key factors in ANN
Step 5: Integrated Data Mining Techniques for Stock Forecasting
Lastly, after all the trend lines are confirmed and the score is made, the next step is to make pre-diction of the future stock values. Our approach is to identify and predict the profits or losses in the next one day, two days, three days, and four days in the stock counter (Atsalakis & Valavanis, 2009a). The information is vital for the investor to buy at the start of an uptrend and to sell off just before the trend reverses. Since the stock market behaves dynamically, integrated data mining techniques can provide a suitable approach to figure the behavior patterns (uptrend, down-trend, and flat) of the stock price from the stock data-set (Han & Kamber, 2001; Jang et al., 1997). Since the stock data-set does not show the correlation with stock behavior patterns, the techniques including technical anal-ysis, Bayesian probability, dynamic time series, and ANN are integrated to figure the patterns, not necessary correlation only, from those massive and non-meaningful data. More details are elabo-rated in the following subsections.
3.1. Technical AnalysisTechnical analysis and fundamental analysis are two major stock market analyzing methods used to predict short-term and long-term stock trends, respectively. For most investors, it is valuable to accurately predict market trends and daily value movements because one would want to invest in the stock at the right time when the market is on the upward trend market (Ausloos & ivanova, 2002; Edwards, Magee, & Bassetti, 2007). Fundamental analysis considers commercial factors, such as financial statements, management ability, business competition, and market conditions, in order to determine the intrinsic value of a given stock. Technical analysis helps recognize the price pat-terns according to the extrapolations from historical price patterns. in technical analysis method, chart patterns and technical indicators are the two major analyzing tools. Charting patterns such as head-and-shoulder and flag use stock charts to study the movement of the stock prices. Technical indicators such as rSi and moving average are produced by specific equations to examine market signals and help investors make trading decisions. Technical analysts widely use market indicators
Figure 5. tsMc stock formed a pivot point in 11/21/2008.

Page 8 of 18
Huang & Lin, Cogent Economics & Finance (2014), 2: 929505http://dx.doi.org/10.1080/23322039.2014.929505
of many sorts, some of which are mathematical transformations of price, often including up and down volume, and advance/decline data. Popular technical indicators are usually classified into two major functions: trend and momentum (Liu & Lee, 1997). All the technical indicators utilized in this study are summarized in Table 1.
3.2. Bayesian ProbabilityBayesian probability is a method used to update the probability estimates for a hypothesis once additional evidence is learned. Bayesian inference is closely related to subjective probability, often called “Bayesian probability.” There are many useful functions in Bayesian probability. One is probabilistic learning. BP can calculate explicit probabilities for hypothesis, among the most practical approaches to certain types of learning problems. Each training example can gradually increase or decrease the probability when a hypothesis is correct. Prior knowledge can be combined with observed data. Even when Bayesian methods are computationally intractable, they can provide a standard of optimal decision-making against which other methods can be measured (Spiegelhalter, Dawid, Lauritzen, & Cowell, 1993; Tsai, Wang, & Zhu, 2010). The formula of BP is expressed as follows.
Given n mutually exclusive and exhaustive events E1, E2, En such that P(Ei) ≠ 0 for all i, we have for 1 ≦ i ≦ n;
where P(Ei) is the prior probability and P(Ei | F) is the posterior probability.
Table 2 tabulates several technical indicators calculated by BP. it also gives the result of prior probability and posterior probability. The value of each technical indicator stands for the perfor-mance accuracy of the individual stock according to the recent 300 trading days. The result can provide a standard of optimal decision-making for selecting significant technical indices. We then ignore the technical indicators with low values and select the significant ones. The values of the se-lected indictors become the inputs of the neural network in the next step. BP screens out the un-necessary technical indicators to prevent possible losing trades. From Table 2, we select MA, ADX and William as candidates of significant technical indicators for the ANN in this research.
(1)P(Ei|F)=
P(F|Ei)P(E
i)
P(F|E1)P(E
1)+P(F|E
2)P(E
2)+⋯+P(F|E
n)P(E
n)
table 1. summary of technical indicatorstechnical indicator Main type Function purposeStochastics KD Momentum Represent the position of the market on a percentage basis
versus its range over the previous n-period sessions
William %R Momentum Detect whether a stock is trading near the high or the low or in between of its recent trading range
RSI Momentum Measure the velocity and magnitude of directional price movements
PSY line Momentum Show the ratio of rising period to total which indicates control of buyers and sellers
Bias Momentum Detect the offset level between daily stock price and a period moving average line
ADX Trend Determined directional movement by comparing the difference between two consecutive lows with the difference between the highs
MA Trend Smooth the price movement so that the longer term trend becomes less volatile therefore obvious
MACD Trend Work as a filtered measure of the derivative of the stock price with respect to time

Page 9 of 18
Huang & Lin, Cogent Economics & Finance (2014), 2: 929505http://dx.doi.org/10.1080/23322039.2014.929505
3.3. Dynamic Time Series TheoryExponential smoothing is a technique that can be applied to time series data to either produce smoothed data or make forecast. Time series data themselves are a sequence of observations. The exponential smoothing model for forecasting does not eliminate any past information but ad-just the weights given to the past data that older data get increasingly less weight. Each new fore-cast is based on an average that is adjusted each time there is a new forecast error. The proportion of the error that will be incorporated into the forecast is called the exponential smoothing factor and is identified as α. The raw data sequence is often represented by Xt and the output of the exponential smoothing algorithm is commonly written as Equation 2, which may be regarded as the best esti-mate of what the next value of x will be. The simplest form of exponential smoothing is given by the formula below,
where α is the smoothing factor, and 0 < α < 1. in other words, the smoothed statistic St is a simple weighted average of the previous observation Xt − 1 and the previous smoothed statistic St − 1. Values of α close to one have less of a smoothing effect and give greater weight to recent changes in the data, while values of α close to zero have a greater smoothing effect and are less responsive to recent changes (Billah, King, Snyder, & Koehler, 2006).
Adaptive exponential smoothing methods allow a smoothing parameter to change over time, in order to adapt to changes in the characteristics of the time series. However, these methods tend to produce unstable forecasts and have performed poorly in empirical studies (Entorf, Gross, & Steiner, 2012; Taylor, 2004). We present a new adaptive method, which enables a smoothing parameter to be modeled as a linear combination function of the trading volume, trend, and momentum. Figure 6 illustrates the closed loop structure of the adaptive exponential smoothing method, where V(i) is the volume indicator of the ith day, T(i) is the trend indicator of the ith day, M(i) is the momentum indica-tor of ith day, and α(i) is the smoothing factor of the ith day. D(i) is the actual stock value of the ith day, F(i) is the forecast stock value at time i, and Z(i) is the deviation of the forecast value at time i. Note that only the smoothing factor of each day at its first processing step is controlled using the deviation between the predicted stock value at the final stage and actual value for the final stage (Ohama, Fukumura, & uno, 2005).
The simplest form of adaptive exponential smoothing is given by the formula below,
(2)S1=X
0
St=𝛼 ∗X
t−1+(1−𝛼) ∗S
t−1=S
t−1+𝛼 ∗
(Xt−1
−St−1
), t>1
table 2. Results of Prior Probability and Posterior Probability calculated by BPMa Bias MacD Rsi DMi aDX K-D William PsYP(stock up) P(stock up) P(stock up) P(stock up) P(stock up) P(stock up) P(stock up) P(stock up) P(stock up)
.23 .6 .3 .1 .1 .23 .42 .23 .05
P(stock down) P(stock down) P(stock down) P(stock down) P(stock down) P(stock down) P(stock down) P(stock down) P(stock down)
.43 .2 .2 .3 .1 .2 .41 .27 .06
P(non) P(non) P(non) P(non) P(non) P(non) P(non) P(non) P(non)
.35 .2 .5 .6 .8 .57 .17 .5 .9
P(up∣up) P(up∣up) P(up∣up) P(up∣up) P(up∣up) P(up∣up) P(up∣up) P(up∣up) P(up∣up)
.61 .48 .17 .5 .45 .51 .47 .62 .45
P(down∣down) P(down∣down) P(down∣down) P(down∣down) P(down∣down) P(down∣down) P(down∣down) P(down∣down) P(down∣down)
.48 .3 .3 .11 .27 .44 .41 .4 .17

Page 10 of 18
Huang & Lin, Cogent Economics & Finance (2014), 2: 929505http://dx.doi.org/10.1080/23322039.2014.929505
where �(i)=�(i−1)+� ∗ (V(i)+T(i)+M(i)) and β is a small coefficient value less than .05 and is used to fine tuning α(i) according to the following setting steps:
Step 1: V(i) is the volume indicator of the ith day.
• If the stock transaction volume of today is more than twice of yesterday’s volume, then V(i) = 1
• If the stock transaction volume of today is less than half of yesterday’s volume, then V(i) = −1
• Otherwise, V(i) = 0
Step 2: T(i) is the trend indicator of the ith day,
• If Bias (10) < −11%, then T(i) = 1
• Else, If Bias (20) > 7%, then T(i) = −1
• Otherwise, T(i) = 0
Step 3: M(i) is the momentum indicator of ith day
• If ADX ≥ 30, then M(i) = 1
• Otherwise, M(i) = 0
The adaptive exponential smoothing α is used to examine the performance of the exponential smoothing with fixed α. The investment horizon is 60 days, from September 2012 to November 2012. Figure 7 compares the performance of the adaptive exponential smooth α to those of three distinct α values at .3, .4, and .5. it shows that the adaptive α follows the actual stock up/down value much closely than the other three lines in Figure 7.
3.4. ANN TrainingMany ANN models have been evaluated against statistical models for market forecast. it is observed that in most cases ANN models give better result than other methods (Chen, Leung, & Daouk, 2003; Lee, 2004). The most commonly used neural network technique in pattern recognition is Multilayer Perceptron (MLP) for the classification problems. MLP architecture using back-propagation algorithm has gone into the application field of stock price prediction. Two important characteristics of the MLP are its non-linear processing elements (PEs, applying the sigmoid function in this research) and their massive interconnectivity. Sigmoid functions all share a similar S shape that is essentially linear in their center and non-linear toward their bounds that are approached asymptotically. To find the optimal neural weights by the back-propagation algorithm based on mathematically training a network in order to minimize the error of a cost function such as the Mean Square Error (MSE), it is
(3)F(i)=�(i) ∗D(i−1)+(1−�(i)) ∗F(i−1)
Figure 6. the closed-loop structure of adaptive exponential smoothing methods.

Page 11 of 18
Huang & Lin, Cogent Economics & Finance (2014), 2: 929505http://dx.doi.org/10.1080/23322039.2014.929505
required that the sigmoid function is easily differentiable, thus permitting the evaluation of increment of weights via the chain-rule for partial derivatives (Yonaba, Anctil, & Fortin, 2010). The back-propagation rule propagates the errors through the network and allows adaptation of the hidden PEs. The MLP is trained with error correction learning, which means that the desired response for the system must be known. Learning typically occurs by example through training, where the training algorithm iteratively adjusts the connection weights. When the network is adequately trained, it is able to generalize relevant output for a set of input data. Training automatically stops when generalization stops improving, as indicated by an increase in the MSE of the validation samples. MSE is the average squared difference between outputs and targets.
Since the forecasting problem has been converted to a classification problem (Hajizadeh, Ardakani, & Shahrabi, 2010), we develop a new target setting rules.
rule 1: As the stock value increases and the up value is over the stock transaction tax, the target value is identified as “Buy,” labeled as “1”
rule 2: “Sell,” labeled as “−1” if the stock value decreases and the down value is more than the stock transaction tax
rule 3: if not in the cases of the above, the target value is identified as “Hold,” labeled as “0”
The desired ANN response is the target value set to reflect the actual stock performance (Wang & Chan, 2007). in this study, the ANN input data include the top-down scores, selected key technical indicators and the forecasting value. Three output units are “Buy,” “Sell,” and “Hold,” respectively. The number of hidden neurons is 20. We set aside some samples for validation and testing. The percentage of training data is set 70%, validation is 15%, and 15% for testing data. The gate of MSE is set 3 × 10⁻². Figure 8 depicts the MSE decreasing after 57 epochs in TSMC.
The ANN system is trained to distinguish among “Buy,” “Sell,” and “Hold.” A confusion matrix sum-marizes the results of testing the algorithm for further inspection (Simon & Simon, 2010). Figure 9 shows the classification results for the whole testing period. it shows a sample set of 144 stock up/down values: 68 Buys, 66 Sells, and 40 Holds. Each column of the matrix represents the instances in a predicted class, while each row represents the instances in an actual class. All correct predictions are located in the diagonal of the table, so it is easy to visually inspect the table for errors, as they will be represented by any non-zero values outside the diagonal. Figure 9 shows the true positive rate of “Buy,” “Sell,” and “Hold” as 98.5, 97, and 97.5%, respectively. Overall, the true positive rate is 97.7%.
Figure 7. Performance comparisons between the adaptive α and the other α values.

Page 12 of 18
Huang & Lin, Cogent Economics & Finance (2014), 2: 929505http://dx.doi.org/10.1080/23322039.2014.929505
4. experimentation setup and test ResultsFor training and evaluating the performance of the presented approach, 240-trading-day stock data were considered. The system was retrained daily. A paper portfolio of NT$1,000,000 was the initial investment. Stocks were bought whenever the forecast was positive, and the position was closed when the forecast became negative. Transaction costs were taken into consideration and were amount to .6% of the individual stock trading price.
TSMC stock was tested first. Experiments were carried out on a personal computer. The system was coded in Microsoft VBA and the neural network analysis was run in MATLAB. it is noted that this period also includes the great recession, European debt crisis and the fiscal cliff of the united States in 2012.
4.1. One Year PeriodThe rate of accuracy of the proposed approach was 81%. The moving hit rate is illustrated in Figure 10 which shows the hit rate since the first day of this period. A hit rate is a term used to describe the success rate of an effort. This rate compares the number of times an initiative was a success against the number of times it was attempted. The moving hit rate of TSMC converges towards .8. The TSMC stock price began with NT$78.5 on 16 February 2012 and reached NT$101 on 23 January 2013. The
Figure 8. Mse decreases after a period of training in tsMc.
Figure 9. tsMc training confusion matrix has been trained to distinguish between “Buy”, “sell,” and “hold.”
Buy Sell Hold
Buy 67 1 0 68 98.50%
Sell 1 64 1 66 97.00%
Hold 0 1 39 40 97.50%
Target Class (Predicted) Total
True Positive
Rate
Output Class
(Actual)
Figure 10. the moving hit rate in the period of 240 trading days.

Page 13 of 18
Huang & Lin, Cogent Economics & Finance (2014), 2: 929505http://dx.doi.org/10.1080/23322039.2014.929505
corresponding stock price increasing rate over this period is 23%—an investment return of 53.6%! (see also Figure 11)
To compare the performances of different time periods, this period is broken into three sub-peri-ods; namely, one month, one quarter, and six months, respectively. in Section 4.6, the system is again applied to the Evergreen stock to compare the investment performance.
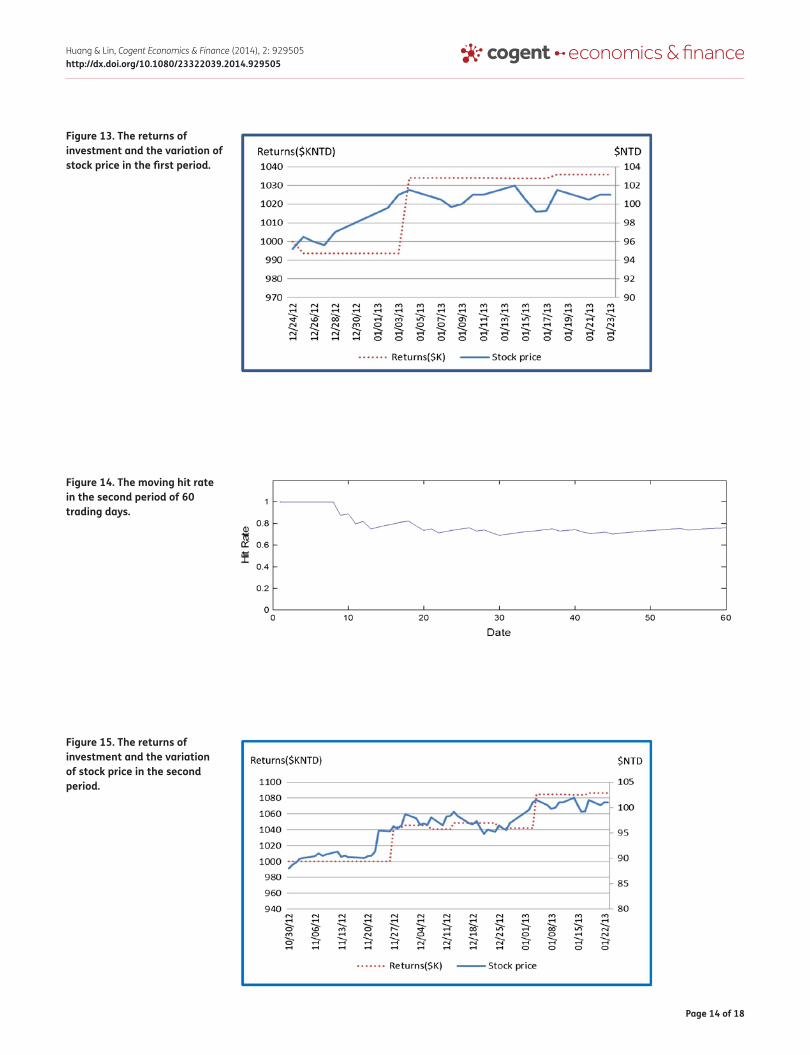
4.2. First Period: 12/24/2012–01/23/2013For each period, the result includes the portfolio return being compared to the initial investment of NT$1million. The moving hit rate is a diagram which shows the hit rate since the first day of this period. The return of investment is 3.6%. The accurate rate of this period is 70%. it can be seen in Figure 12 that the moving hit rate converges toward .8. The TSMC stock price rose from NT$95 to NT$101.5, the stock price increasing rate of the period is up 5% as shown in Figure 13.
4.3. Second Period: 10/30/2012–01/23/2013During this second period of 60 trading days, the results are even better. Again, the results include the portfolio return being compared to the initial investment of NT$1million. The return of invest-ment achieves 8.6%. The rate of accuracy of this period is 75%. it can be seen in Figure 14 that the moving hit rate converges toward the 81% region. The TSMC stock price increased from NT$88 to NT$101.5, the up rate of this period is up 12% as seen in Figure 15.
4.4. Third Period: 08/06/2012–01/23/2013The portfolio return as compared to the initial investment is again considered. The return of invest-ment achieves 18.7%. The rate of accuracy of this period is 77.5%. it is seen in Figure 16 that the
Figure 11. the returns of investment and the variation of stock price in a year.
Figure 12. the moving hit rate in the first period of 20 trading days in tsMc.
Page 14 of 18
Huang & Lin, Cogent Economics & Finance (2014), 2: 929505http://dx.doi.org/10.1080/23322039.2014.929505
Figure 13. the returns of investment and the variation of stock price in the first period.
Figure 14. the moving hit rate in the second period of 60 trading days.
Figure 15. the returns of investment and the variation of stock price in the second period.

Page 15 of 18
Huang & Lin, Cogent Economics & Finance (2014), 2: 929505http://dx.doi.org/10.1080/23322039.2014.929505
moving hit rate converges toward .8. The stock price began from NT$81 to NT$101.5, while the in-creasing rate of the stock price during this period is up 19% up, as indicated in Figure 17.
4.5. Summary of TSMC Stock PerformanceThe performances of different periods of TSMC are summarized in Table 3. The proposed system made 82 transactions in the stock market during this period of 240 trading days. This gave a rough average of 1 transaction for every three days. While the stock value increased by 23%, the return of the portfolio during the whole period was 53.6% with an 81% accuracy rate. The total trading period was also divided into three sub-periods that cover one month, one quarter, and six months, respec-tively. The result of each period is summarized as follows:
• The accurate rates achieved were 70, 75, and 77.5%, respectively.
• The rates of the stock price were 5% up, 12% up, and 19% up, respectively.
• The returns of investment were 3.6, 8.6, and 18.7%, respectively.
4.6. Application to the Evergreen StockThe approach is also applied to Evergreen the same as in TSMC. The Evergreen stock was tested with an initial paper portfolio of NT$1,000,000. Two hundred forty-trading-day Evergreen stock data were considered for training and evaluating the performance of the system which was retrained daily. Transaction costs were taken into consideration and were amount to .6% of the individual stock trading price.
Figure 16. the moving hit rate in the third period of 120 trading days.
Figure 17. the returns of investment and the variation of stock price in the third period.

Page 16 of 18
Huang & Lin, Cogent Economics & Finance (2014), 2: 929505http://dx.doi.org/10.1080/23322039.2014.929505
The proposed system made 64 Evergreen stock transactions in the market during this period of 240 trading days. This gave a rough average of one transaction for every four days. Although the stock value dropped by 7.7% in this period, the return of the portfolio during the whole period still made a 128.4% in profit with an 88% accuracy rate. To study the performance of different periods, we divide the periods into one month, one quarter, six months, and one year. The result of each pe-riod is summarized as follows (Table 4):
• The rates of the stock price were 6.6% down, 5% up, and 14.6% up, respectively.
• The returns of investment were 8.4, 26.7, and 53.3%, respectively.
• The accurate rates achieved were 88, 93 and 94%, respectively.
5. conclusionsThe proposed approach that integrated various data mining techniques has achieved remarkable re-sults. The investment returns of the TSMC and Evergreen stocks were 53.6 and 128.4% for the trading days considered. The system was retrained daily. As all sub-periods of the TSMC and Evergreen trading generated profits for various trading days, it is evident that the proposed system is highly effective for stock forecast. instead of giving a straight tool, this research proposes a methodological system to han-dle the stock forecast. Every stock may have different structures in the top-down theory, the dynamic time series, and ANN, and have different choices in the technical analysis and the Bayesian probability. Hence, applications of the methodological system are not limited to the TSMC and Evergreen stocks.
in our future work, we will apply the proposed system to the popular Nasdaq-100 index of Stock Market as well as some of the companies listed in the Nasdaq-100 index. Additionally, justifying the decision based on the proposed system by applying linguistic fuzzy-set approach to include experts’ opinions is also our future research.
table 3. the Performance comparison of investment in tsMcPerformance results of different phases in tsMc
Phase accurate rate (%) stock up/down (%) Returns (%)1st period (a month) 70 5 3.6
2nd period (a quarter) 75 12 8.6
3rd period (a half year) 77.5 19 18.7
One year period 81 23 53.6
table 4. the Performance comparison of investment in evergreenPerformance results of different phases in evergreen
Phase accurate rate (%) stock up/down (%) Returns (%)One month 88 −6.6 8.4
One quarter 93 5.0 26.7
A half year 94 14.6 30.0
One year 96 −7.7 128.4
FundingThe authors would like to acknowledge the support from the research projects NSC 101-2221-E-029-012 and NSC 102-2221-E-029-026 National Science Council of Taiwan.
author detailsChin-Yin Huang1
E-mail: [email protected]
Philip K.P. Lin1
E-mail: [email protected] Department of Industrial Engineering and Enterprise Information, Tunghai University, Taichung 407, Taiwan.
article informationCite this article as: Application of integrated data mining techniques in stock market forecasting, C.-Y. Huang & P.K.P. Lin, Cogent Economics & Finance (2014), 2: 929505.

Page 17 of 18
Huang & Lin, Cogent Economics & Finance (2014), 2: 929505http://dx.doi.org/10.1080/23322039.2014.929505
cover imageSource: Author
ReferencesAbraham, A., Nath, B., & Mahanti, P. K. (2001). Hybrid intelligent
systems for stock market analysis. in V. Alexandrov, J. Dongarra, B. Juliano, r. renner, & C. J. K. Tan (Eds.), Computational science—ICCS 2001 (Vol. 2074, pp. 337–345). Heidelberg: Springer.
Atsalakis, G. S., Dimitrakakis, E. M., & Zopounidis, C. D. (2011). Elliott wave theory and neuro-fuzzy systems, in stock market prediction: The WASP system. Expert Systems with Applications, 38, 9196–9206. doi:10.1016/j.eswa.2011.01.068
Atsalakis, G. S., & Valavanis, K. P. (2009a). Forecasting stock market short-term trends using a neuro-fuzzy based methodology. Expert Systems with Applications, 36, 10696–10707. doi:10.1016/j.eswa.2009.02.043
Atsalakis, G. S., & Valavanis, K. P. (2009b). Surveying stock market forecasting techniques—Part ii: Soft computing methods. Expert Systems with Applications, 36, 5932–5941. doi:10.1016/j.eswa.2008.07.006
Ausloos, M., & ivanova, K. (2002). Mechanistic approach to generalized technical analysis of share prices and stock market indices. European Physical Journal B, 27, 177–187. doi:10.1140/epjb/e20020144
Billah, B., King, M. L., Snyder, r. D., & Koehler, A. B. (2006). Exponential smoothing model selection for forecasting. International Journal of Forecasting, 22, 239–247. doi: 10.1016/j.ijforecast.2005.08.002
Chavarnakul, T., & Enke, D. (2009). A hybrid stock trading system for intelligent technical analysis-based equivolume charting. Neurocomputing, 72, 3517–3528. retrieved from http://dx.doi.org/10.1016/j.neucom.2008.11.030
Chen, A. S., Leung, M. T., & Daouk, H. (2003). Application of neural networks to an emerging financial market: Forecasting and trading the Taiwan Stock index. Computers & Operations Research, 30, 901–923. doi: 10.1016/s0305-0548(02)00037-0
Chen, T. L., Su, C. H., Cheng, C. H., & Chiang, H. H. (2011). A novel price-pattern detection method based on time series to forecast stock markets. African Journal of Business Management, 5, 5188–5198.
Edwards, r. D., Magee, J., & Bassetti, W. H. C. (2007). Technical analysis of stock trends (9th ed.). Boca raton, FL: CrC Press; New York, NY: AMACOM, American Management Association. http://dx.doi.org/10.1201/9781420013146
Entorf, H., Gross, A., & Steiner, C. (2012). Business cycle forecasts and their implications for high frequency stock market returns. Journal of Forecasting, 31(1), 1–14. doi: 10.1002/for.1206
Guresen, E., Kayakutlu, G., & Daim, T. u. (2011). using artificial neural network models in stock market index prediction. Expert Systems with Applications, 38, 10389–10397. retrieved from http://dx.doi.org/10.1016/j.eswa.2011.02.068
Hajizadeh, E., Ardakani, H. D., & Shahrabi, J. (2010). Application of data mining techniques in stock markets: A survey. Journal of Economics and International Finance, 2, 109–118.
Han, J., & Kamber, M. (2001). Data mining: Concepts and techniques. San Francisco, CA: Morgan Kaufmann.
Jang, J.-S. r., Sun, C.-T., & Mizutani, E. (1997). Neuro-fuzzy and soft computing: A computational approach to learning and machine intelligence. upper Saddle river, NJ: Prentice Hall.
Lee, r. S. T. (2004). iJADE stock advisor: An intelligent agent based stock prediction system using hybrid rBF recurrent network. IEEE Transactions on Systems, Man, and Cybernetics—Part A: Systems and Humans, 34, 421–428. doi:10.1109/tsmca.2004.824871
Leung, M. T., Daouk, H., & Chen, A. S. (2000). Forecasting stock indices: A comparison of classification and level estimation models. International Journal of Forecasting, 16, 173–190. doi:10.1016/s0169-2070(99)00048-5
Liu, N. K., & Lee, K. K. (1997). An intelligent business advisor system for stock investment. Expert Systems, 14, 129–139. doi:10.1111/1468-0394.00049
Livermore, J. L. (1940). How to trade in stocks; the Livermore formula for combining time element and price. New York, NY: Duel.
Mandziuk, J., & Jaruszewicz, M. (2011). Neuro-genetic system for stock index prediction. Journal of Intelligent & Fuzzy Systems, 22, 93–123. doi:10.3233/ifs-2011-0479
Matías, J. M., & reboredo, J. C. (2012). Forecasting performance of nonlinear models for intraday stock returns. Journal of Forecasting, 31, 172–188. doi:10.1002/for.1218
Ohama, Y., Fukumura, N., & uno, Y. (2005). A simplified forward-propagation learning rule applied to adaptive closed-loop control. in W. Duch, J. Kacprzyk, E. Oja, & S. Zadrozny (Eds.), Artificial neural networks: Formal models and their applications—ICANN 2005 (Vol. 3697, pp. 437–443). Heidelberg: Springer.
Simon, D., & Simon, D. L. (2010). Analytic confusion matrix bounds for fault detection and isolation using a sum-of-squared-residuals approach. IEEE Transactions on Reliability, 59, 287–296. doi:10.1109/tr.2010.2046772
Spiegelhalter, D. J., Dawid, A. P., Lauritzen, S. L., & Cowell, r. G. (1993). Bayesian-analysis in expert-systems. Statistical Science, 8, 219–247. doi:10.1214/ss/1177010888
Tan, A., Quek, C., & Yow, K. C. (2008). Maximizing winning trades using a novel rSPOP fuzzy neural network intelligent stock trading system. Applied Intelligence, 29, 116–128. doi:10.1007/s10489-007-0055-1
Taylor, J. W. (2004). Volatility forecasting with smooth transition exponential smoothing. International Journal of Forecasting, 20, 273–286. doi:10.1016/j.ijforecast.2004.09.010
Tsai, C. L., Wang, H. S., & Zhu, N. (2010). Does a Bayesian approach generate robust forecasts? Evidence from applications in portfolio investment decisions. Annals of the Institute of Statistical Mathematics, 62, 109–116. doi: 10.1007/s10463-009-0250-4
Wang, J. L., & Chan, S. H. (2007). Stock market trading rule discovery using pattern recognition and technical analysis. Expert Systems with Applications, 33, 304–315. doi:10.1016/j.eswa.2006.05.002
Yonaba, H., Anctil, F., & Fortin, V. (2010). Comparing sigmoid transfer functions for neural network multistep ahead streamflow forecasting. Journal of Hydrologic Engineering, 15, 275–283. doi:10.1061/(asce)he.1943-5584.0000188
Zarandi, M. H. F., Hadavandi, E., & Turksen, i. B. (2012). A hybrid fuzzy intelligent agent-based system for stock price prediction. International Journal of Intelligent Systems, 27, 947–969. doi:10.1002/int.21554
Zuo, Y., & Kita, E. (2012). up/down analysis of stock index by using Bayesian network. Engineering Management Research, 1, 46–52. doi:10.5539/emr.v1n2p46

Page 18 of 18
Huang & Lin, Cogent Economics & Finance (2014), 2: 929505http://dx.doi.org/10.1080/23322039.2014.929505
© 2014 The Author(s). This open access article is distributed under a Creative Commons Attribution (CC-BY) 3.0 license.You are free to: Share — copy and redistribute the material in any medium or format Adapt — remix, transform, and build upon the material for any purpose, even commercially.The licensor cannot revoke these freedoms as long as you follow the license terms.
Under the following terms:Attribution — You must give appropriate credit, provide a link to the license, and indicate if changes were made. You may do so in any reasonable manner, but not in any way that suggests the licensor endorses you or your use. No additional restrictions You may not apply legal terms or technological measures that legally restrict others from doing anything the license permits.
Cogent Economics & Finance (ISSN: 2332-2039) is published by Cogent OA, part of Taylor & Francis Group. Publishing with Cogent OA ensures:• Immediate, universal access to your article on publication• High visibility and discoverability via the Cogent OA website as well as Taylor & Francis Online• Download and citation statistics for your article• Rapid online publication• Input from, and dialog with, expert editors and editorial boards• Retention of full copyright of your article• Guaranteed legacy preservation of your article• Discounts and waivers for authors in developing regionsSubmit your manuscript to a Cogent OA journal at www.CogentOA.com

![Application of Data Mining techniques for Customer ......warehousing, data mining, and other customer relationship management (CRM) [2] techniques afford new opportunities for businesses](https://static.fdocuments.net/doc/165x107/5e4b2e49ec5a614d5c3751e0/application-of-data-mining-techniques-for-customer-warehousing-data-mining.jpg)


