Application of Industrial Heat Pumps · (HEN), i.e. we concentrate on the integration of heat pumps...
76
Application of Industrial Heat Pumps IEA Industrial Energy-related Systems and Technologies Annex 13 IEA Heat Pump Programme Annex 35 Task 2: Modeling calculation and economic models Final Report (20.06.2014) Prepared by Participants of Annex 35/13
Transcript of Application of Industrial Heat Pumps · (HEN), i.e. we concentrate on the integration of heat pumps...

Application of Industrial Heat Pumps
IEA Industrial Energy-related Systems and Technologies Annex 13
IEA Heat Pump Programme Annex 35
Task 2: Modeling calculation and economic models
Final Report (20.06.2014)
Prepared by Participants of Annex 35/13


Contents
1 Introduction ............................................................ 1-151
1.1 Integration of heat pumps into industrial processes: an outline of
theoretical methods ....................................................................... 1-151
1.1.1 Pinch analysis ..................................................................... 1-152 1.1.2 Optimization Models ......................................................... 1-154
1.2 Integration of Heat Pumps in Industrial Processes: general
principles ......................................................................................... 1-156
1.2.1 Introduction ....................................................................... 1-156 1.2.2 General Considerations and Principles of process
integration of heat pumps ................................................. 1-156
1.3 Analysis of the Annex 21 Screening Program .............................. 1-160
1.3.1 Introduction ....................................................................... 1-160 1.3.2 Conversion of the Annex 21 IHP screening program ......... 1-161 1.3.3 Analysis of the Annex 21 IHP screening program .............. 1-163
1.4 A modern concept for a screening program based on
pinch analysis .................................................................................. 1-164
1.4.1 The problem table algorithm formulated as mathematical optimization method .......................................................... 1-164
1.4.2 The transshipment model of Papoulias and Grossmann ... 1-166 1.4.3 A simple test program ....................................................... 1-167 1.4.4 The extension of the transshipment model to integrate
a heat pump ....................................................................... 1-169 1.4.5 The elements of the proposed modern concept for a
screening program based on pinch analysis ...................... 1-169 1.4.6 Summary ............................................................................ 1-171
1.5 Scoping analysis of existing software tools based on pinch
analysis ............................................................................................ 1-171
1.6 Conclusions .................................................................................. 1-172
1.7 References ................................................................................... 1-173
2 Austrian Team Report - Software ............................ 2-176
2.1 TOP Energy .................................................................................. 2-176
2.2 EINSTEIN ...................................................................................... 2-177
2.3 Literature ..................................................................................... 2-179
3 French Team Report - State of the Art Review on Analytical Tools based on the Pinch Method ........... 3-181
3.1 Introduction ................................................................................. 3-181
3.2 Methods of process energy integration ...................................... 3-181
3.2.1 Principle ............................................................................. 3-181 3.2.2 Required data .................................................................... 3-182 3.2.3 Results ................................................................................ 3-182 3.2.4 Benefits and drawbacks ..................................................... 3-184

3.3 Stakeholders ................................................................................ 3-185
3.3.1 ACADEMIC RESEARCH LABORATORIES .............................. 3-185 3.3.2 OTHER NON-ACADEMIC PLAYERS ...................................... 3-188
3.4 Tools ............................................................................................ 3-190
3.4.1 STAR and SPRINT ...................................................... 3-190 3.4.2 Pinchlight .................................................................. 3-191 3.4.3 OSMOSE .................................................................... 3-192 3.4.4 Thermoptim .............................................................. 3-193 3.4.5 CERES ........................................................................ 3-194 3.4.6 Pro_Pi........................................................................ 3-196 3.4.7 PinCH ........................................................................ 3-197 3.4.8 Hint ........................................................................... 3-199 3.4.9 Einstein ..................................................................... 3-199 3.4.10 SuperTarget .............................................................. 3-202 3.4.11 AspenEnergyAnalyzer ............................................... 3-203
3.5 Conclusions .................................................................................. 3-203
4 Dutch Team Report - Modeling in the Netherlands . 4-204
4.1 Industrial heat process optimization ........................................... 4-204
4.2 Available tools ............................................................................. 4-206
4.2.1 Consultancy tools ............................................................... 4-207 4.2.2 Methods for Visualisation & analyse ................................. 4-208
4.3 Which tool fits best?.................................................................... 4-212
4.4 EINSTEIN ...................................................................................... 4-215
4.5 Process tools and heat pumping technology .............................. 4-217
4.5.1 Mastering Heat Pumps Selection for Energy Efficient Distillation .......................................................................... 4-217
4.5.2 Heat pump models ............................................................. 4-219 4.5.3 Heat Pump Check ............................................................... 4-221
4.6 Literature ..................................................................................... 4-222

Task 2: Modeling calculation and economic models
Introduction
1-151
1 Introduction
Task 2 is intended to outline how the integration of industrial heat pumps (IHP) in pro-cesses is supported by computer software, i.e. by modeling. The legal text comprises four items: o Make SWOT analyses of available software and calculation procedures for applica-
tion for different sectors. o Analyze and update of existing models from Annex 21, where does the heat pump fit
and how does it fit. o Use the analysis of tools and findings of Task 1 to determine the gaps, needs and
possibilities for new model development. o Examine the possibilities to make software available.
During the execution of Task 2, the original legal text was slightly modified by a new activity plan: o Database/collection of information on manufacturers of large/industrial heat pumps
and their performance figures. o Overview of software for Process Integration (PI) of industrial heat pumps. o SWOT-analysis of integration of industrial heat pumps in industry. o Principles for the integration of heat pumps in industry.
Unfortunately, we cannot report a complete execution of Task 2. Although the Annex 35/13 project had been prolongated by one year (mainly because of missing results from Task 2), nearly none of the deliveries could be finished as foreseen. We attribute this low interest to two facts:
o Most participants are not concerned directly with modeling and software aspects. o The wide range of software tools with their very different scopes was largely under-
estimated.
Therefore, this Task 2 report expresses in some parts the Operating Agent’s/ Annex Manager’s view how Task 2 could be approached in a future project. The important con-sequence of this four years’ work is to carefully reconsider the goals based on the State of the Art as well as on industrial needs if a “new Task 2” team should be constituted.
1.1 Integration of heat pumps into industrial processes: an outline of theoretical methods
Process integration (PI) methods and software tools have been compiled in numerous publications, for instance in “Process Integration Implementing Agreement within the IEA”. One of its products is the comprehensive IEA Tutorial on Process Integration by T. Gundersen [1]. Software tools are discussed by the same author in Ref. [2]. Another source of general information on software tools for process integration, modeling and optimization is given by Hon Loong Lam et al. [3]. Further references are the book of L. Puigjaner and G. Heyen (eds.) [4], the overviews given by I.E. Grossmann, J.A. Caballero and H. Yeomans [5].

Task 2: Modeling calculation and economic models
Introduction
1-152
Design, integration and operation of industrial processes (more generally synthesis problems) have been developed since more than 3 decades starting in the early 70’s at the ETH Zürich and Leeds University by B. Linnhoff and J.R. Flower [6]1. This work and subsequent developments are known under the key words “pinch analysis”. A recent detailed overview is given by the book of I. C. Kemp “Pinch Analysis and Process Integra-tion” and the overview of F. Maréchal [8], which we use in subsequent chapters. Gener-ally, pinch analysis allows to determine the heat recovery potential by heat exchange in complex thermal processes, or in other words, to determine the minimum energy re-quirement of the process.
The general solution of synthesis problems employing all kind of optimization tech-niques has been developed by several researchers. Numerous contributions of I.E. Grossmann and coworkers have to be noticed. Their pioneering work dates as early as 1983 [9]. A concise overview of the mathematical programming approaches to the syn-thesis of chemical process systems is given by I.E. Grossmann, J.A. Caballero and H. Yeomans [5] and by the book of C. Floudas “Nonlinear and Mixed-Integer Optimization, Fundamentals and Applications”, see Ref. [10].
It is important to understand the difference between these general solutions and pinch analysis: In pinch analysis optimization is restricted to a simplified heat cascade model (see below), which largely reduces the optimization problem, whereas a general solution of synthesis problems means taking all process details (process units) into account. This leads to problem sizes orders of magnitude above pinch analysis. Consequently, we will briefly discuss the two groups of models, pinch analysis and (large) optimization meth-ods separately although these differences are more and more bridged in modern soft-ware tools.
A wealth of information is available and there is no need presenting all details. Rather, emphasis is given to the integration of heat pumps into processes. We dispense with any detailed presentation of software support for the design of the heat exchanger network (HEN), i.e. we concentrate on the integration of heat pumps into processes in the sense of a specific add-on, which programs may offer or not. Nevertheless, we are aware that the design of the HEN and the integration of a heat pump are closely related to each other.
1.1.1 Pinch analysis
Subsequently we follow the comprehensive review on pinch analysis given by F. Maréchal [8], which links pinch analysis to mathematical refined optimization meth-ods. Pinch analysis is performed in three steps:
o the definition of hot and cold streams, o the calculation of the minimum energy requirement (MER), the so-called targeting
step, in combination with a minimization of costs and o the design of the heat exchanger network (HEN), the synthesis step.
1 This reference stands for the many publication of B. Linnhoff and his co-workers
Task 2: Modeling calculation and economic models
Introduction
1-153
Before presenting some further details, the merits of pinch analysis should be ad-dressed: o Pinch analysis allows a deep insight into any process. Its development was driven by
detailed thermodynamic understanding of processes. Sometimes this is referred to as a holistic view. Minimum energy requirements or minimum costs are considered, as well as rules and guidelines for the design of the heat exchanger network. Never-theless, for step three detailed knowledge and engineering judgment is required, which is augmented or supported by specific software tools.
o Pinch analysis may be considered as a mature technology and most software tools available fall into this category.
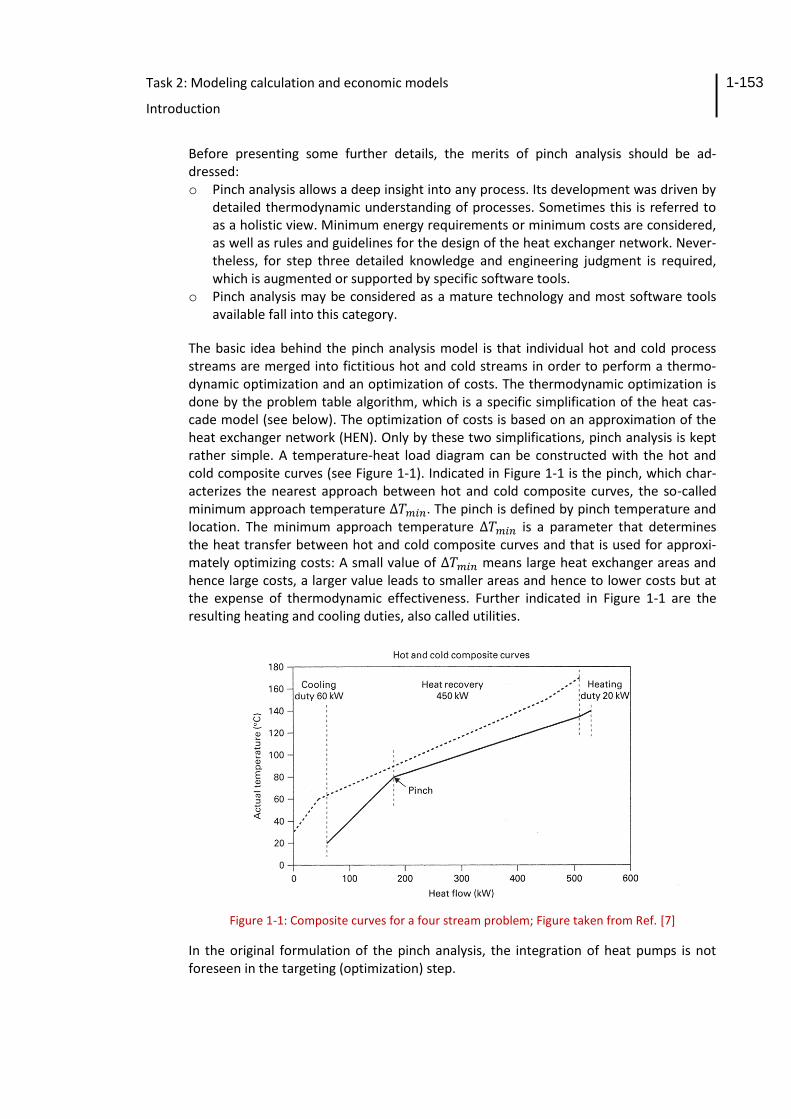
The basic idea behind the pinch analysis model is that individual hot and cold process streams are merged into fictitious hot and cold streams in order to perform a thermo-dynamic optimization and an optimization of costs. The thermodynamic optimization is done by the problem table algorithm, which is a specific simplification of the heat cas-cade model (see below). The optimization of costs is based on an approximation of the heat exchanger network (HEN). Only by these two simplifications, pinch analysis is kept rather simple. A temperature-heat load diagram can be constructed with the hot and cold composite curves (see Figure 1-1). Indicated in Figure 1-1 is the pinch, which char-acterizes the nearest approach between hot and cold composite curves, the so-called minimum approach temperature ∆𝑇𝑚𝑖𝑛. The pinch is defined by pinch temperature and location. The minimum approach temperature ∆𝑇𝑚𝑖𝑛 is a parameter that determines the heat transfer between hot and cold composite curves and that is used for approxi-mately optimizing costs: A small value of ∆𝑇𝑚𝑖𝑛 means large heat exchanger areas and hence large costs, a larger value leads to smaller areas and hence to lower costs but at the expense of thermodynamic effectiveness. Further indicated in Figure 1-1 are the resulting heating and cooling duties, also called utilities.
Figure 1-1: Composite curves for a four stream problem; Figure taken from Ref. [7]
In the original formulation of the pinch analysis, the integration of heat pumps is not foreseen in the targeting (optimization) step.

Task 2: Modeling calculation and economic models
Introduction
1-154
The design of the heat exchanger network, i.e. the synthesis step is by its nature combi-natorial with a huge number of matches [8, p 184]. Pinch analysis does not follow a mathematical optimization approach, which will be discussed below, but is a sequential method mainly based on the insight gained by the thermodynamic interpretation of the pinch. More detail will be given in section 1.2.
1.1.2 Optimization Models
As early as 1983, S.A. Papoulias and I.E. Grossmann presented an optimization approach for the synthesis of total processing systems [9]. Since then, these optimization tech-niques were developed taking advantage of the parallel development of computer sci-ence (computers as well as numerical techniques). Significant progress has been made in optimization theory, modeling complex systems and nonlinear control with the conse-quence that such tools are nowadays employed routinely (I.D.L. Bogle and B.E. Ydstie, Chapter 4 of Ref. [4], p. 383). These tools are sometimes labeled computer-aided pro-cess engineering tools (CAPE). As mentioned already, a detailed overview of the present state-of the-art is given by I.E. Grossmann, J.A. Caballero and H. Yeomans [5]. Further, the book of C. Floudas [10] gives a comprehensive description of the fundamentals and the applications of nonlinear and mixed-integer optimization.
Heat pump integration has been investigated by several researchers. We mention here only the F. Maréchal group at the Ecole Polytechnique Fédérale de Lausanne (EPFL), Switzerland, which published recently several papers on this specific subject (Refs. [11], [12] and [13]). Reference [13] refers to the thesis of H.C. Becker (directed by F. Maré-chal), in which a systematic methodology is presented, based on pinch analysis and pro-cess integration techniques to integrate heat pumps into industrial processes.
Generally speaking, today’s comprehensive optimization methods are mature enough that heat pumps can be integrated into any process. So where is the problem? It seems that most problems origin from the fact that the integration of heat pumps is only a part of a very complex “optimization machinery” encountering several problems:
Mathematical problems I
The mathematical models go far beyond simple linear programming. Problems may get nonlinear and discrete (binary) variables need to be introduced, leading to pro-grams as the mixed integer linear program (MILP) or the mixed integer nonlinear program (MINLIP). If we consider a MILP problem with m binary variables, which may take either the value 0 or 1, we have of 2𝑚 solutions of a linear programming prob-lem. If m is too large, combinatorial solutions are no longer feasible and specific techniques need to be applied. Nonlinear models generally suffer that convergence problems can never be excluded.
Mathematical problems II
Generally, an extremum (maximum or minimum point) can be either global (truly
the highest or lowest function value) or local (the highest or lowest in a finite
neighborhood). Only specific mathematical strategies, thermodynamic insight and
engineering judgment can enhance the likelihood that the result of an optimization

Task 2: Modeling calculation and economic models
Introduction
1-155
is a global minimum. This likelihood is reduced if the number of binary variables is
too large for a (complete) combinatorial solution.
Problems in setting up the optimization model
In order to apply a mathematical programming techniques to design and synthesis
problems, it is always necessary to postulate a superstructure of alternatives (Ref.
[5, p. 5]). Or expressed in simple words: Alternatives that are not foreseen cannot
be optimized. This means that the setup of superstructures is a tremendous work
that needs a high degree of engineering competence, knowledge and experience. It
is likely that several setups of the superstructure are needed to approach a tech-
nical solution. In addition, during the optimization it may turn out that some modi-
fication of process data (“super targeting”) could further improve the optimization.
Most likely, the global optimum can only be approached by an outer iteration pro-
cess covering modifications of the superstructure and of process data.
Uncertainties
The mathematics must not hide the many uncertainties involved, mainly originating
from estimations and predictions of costs and the definition of the optimization
target itself. The solution depends on such uncertainties. Variations of costs, the
optimization target or even process data enhance the possibility that several de-
signs fulfill the requirements, i.e. variations could turn a local minimum to a global
one and vice versa, especially if several local minima are close to the global mini-
mum.
Competence needed
It is obvious that any group performing this type of optimization needs high compe-
tence in optimization mathematics as well as thermodynamic engineering. Access
to large standard optimization computer programs is mandatory, which may need
some specific adaption.
We conclude that the application of general optimization methods is limited to a
fairly small number of research groups and highly specialized groups within large
companies. Energy consultants probably will prefer pinch analysis type models.
Integration of heat pumps
In principle, the integration of heat pumps is no particular problem. The important
question in our context is whether integration of heat pumps is already a standard
in process synthesis employing detailed optimization models.
We should clarify, which possibilities exist to consider various heat pump types in a
superstructure. We should elaborate whether heat pump databases are in use.
However, it seems that a general heat pump database is missing and its develop-
ment could be a major contribution.

Task 2: Modeling calculation and economic models
Introduction
1-156
1.2 Integration of Heat Pumps in Industrial Processes: general principles
1.2.1 Introduction
In this section general principles for process integration of industrial heat pumps are discussed. The text is partly based on the one presented in the IEA work “Industrial Heat Pumps Experiences, Potential and Global Environmental Benefits”, Annex 21, 1995 (Ref. [14]).
There are some parameters that are of major importance when integrating a heat pump into an industrial process:
o The industrial process. Each process is unique and consists, from an energy point of view, of heat sources and heat sinks. In order to process integrate the heat pump, applying for instance pinch analyze, it is necessary to have a good knowledge of these sources and sinks. The load and temperatures are then crucial but also other aspects as location and type of load are important from a practical point of view.
o The heat pump type. Heat pump types have different characteristics which will make them suitable in various situations. Operation temperature limitations will re-strict heat pumps installations and also the choice between different types. Efficien-cy and type of drive energy are also crucial decision parameters.
o Energy costs. The cost of drive energy to the heat pump and the cost of the heat that is replaced determine the operation cost which is a large part of the annual cost.
o Capital costs. The investment costs associated with an installation of a heat pump derive from several parts. The heat pump itself (including auxiliaries) and the cost to install it is normally the largest part of the investment. However other parts may well be significant. The heat to the heat pump must be extracted and possibly a heat collecting system must be constructed. On the hot side of the heat pump also a dis-tribution system might be necessary. Furthermore other changes and supplements often are necessary e.g. changes in the heat exchanger network (see below), drive energy supply and control system.
1.2.2 General Considerations and Principles of process integration of heat pumps
1.2.2.1 Basic pinch analysis concepts
In order to integrate a heat pump properly in an industrial process a good knowledge of the process is necessary. In this respect, pinch analysis is a very powerful tool, because the pinch temperature has an important physical meaning: It divides the heat sinks and sources into two separate parts, see Figure 1-2. In the part above the pinch, there is a net heat deficit, and heat must be added to the system by a hot utility. If a cold utility is applied above the pinch, it follows that the demand for the hot utility will increase by the same amount. Thus, valuable heat is just off-set by the amount of cooling added. On the other hand, in the part below the pinch, there is an excess of heat that must be re-moved from the system by a cold utility. Any heat added below the pinch must also be removed. Hence, in a well designed process, no cold utility should be used above the pinch and no hot utility below the pinch.

Task 2: Modeling calculation and economic models
Introduction
1-157
From these facts three fundamental rules can be stated:
o Do not cool a stream by utility above the pinch; o Do not heat a stream by utility below the pinch; o Do not transfer heat from a stream above the pinch to a stream below the pinch.
Pinch violations are said to exist if these rules are not fulfilled. Thus there are three types of pinch violations: o Heat extraction from a heat sources above the pinch, i.e. a cooler above the pinch o Heat supply to a heat sink below the pinch, i.e. a heater below the pinch o Heat exchange between a heat source above the pinch and a heat sink below the
pinch, i.e. heat exchanging across the pinch
Figure 1-2: The pinch rules
1.2.2.2 Principal consequences in a theoretical situation
In a theoretical situation in an industrial process the minimum heating and cooling re-quirements are equal to the theoretical ones, i.e. there are no pinch violations. In this situation Figure 1-3 shows the consequences of the three principle alternatives of inte-grating a heat pump.
A heat pump should be integrated in such a way that the heat source is situated where there is an excess of heat (i.e., below the pinch), and the heat sink where there is a need for heat above the pinch. The heat pump is thus integrated across the pinch and both the hot and cold utility is reduced.
If the heat is extracted below the pinch and also delivered back below the pinch the consequence will be a larger cooling demand due to the net input of drive energy to the heat pump.
The third possibility is to extract heat above the pinch and also deliver it back above the pinch the hot utility will decrease by the drive energy to the heat pump. In this way hot utility can be replaced by drive energy which could be beneficial in a situation where the utility is limited of some reason.

Task 2: Modeling calculation and economic models
Introduction
1-158
In practice, technical and economic constraints of course limit the actual potential for heat pumping even if there are no pinch violations.
Figure 1-3: Consequences of integrating a heat pump in process without pinch violations
1.2.2.3 Principal consequences in realistic situations
In practice pinch violation exist in most processes due to various reasons, e.g. economic and practical. In these cases integration of a heat pump not necessarily has to be across the pinch in order to save energy. In principal a heat pump can eliminate pinch viola-tions and thus reduce the energy used. Two main possibilities can be identified:
o A heat pump which utilizes the pinch violations cooling above and/or heat across the pinch (or part of them) and delivers the heat above the pinch will save hot utili-ty. The amount is equal to the sum of the heat flow into the heat pump and the heat pump driving energy. The heat pump driving energy should of course be taken into account when a total energy balance is established. In Figure 1-4 the situation with a cooler above the pinch is shown.

Task 2: Modeling calculation and economic models
Introduction
1-159
Figure 1-4: Consequences of integrating a heat pump in process in a process with a cooler above the pinch
o A heat pump, in a process with the pinch violation heating below the pinch, which extract heat and replaces this violation or part of it also saves hot utility. The amount is also in this case equal to heat flow to the heat pump and the heat pump drive energy. However in this case the drive energy needs to be cooled away. This situation is illustrated in Figure 1-5.
Figure 1-5: Consequences of integrating a heat pump in process in a process with a heater below the pinch

Task 2: Modeling calculation and economic models
Introduction
1-160
These principles show that also heat pumps not places across the pinch can save energy if pinch violations in the process exist which is the normal situation. This is in contrast to most previous published statements and opens up for more successful implementations.
1.2.2.4 Consequences on the process heat exchanger network
The consequences of integrating a heat pump into a process on the heat exchanger network can be extensive. When extracting heat to the heat pump below the pinch, the heat available for process heat exchanging might decrease. This also means that the driving force for heat exchanging decreases below the starting temperature of the heat source stream(s). This decrease in driving force means that the area needed for process heat exchanging in many cases becomes larger, and possibly that more heat exchanger units must be added. The same principals also hold for the situation above the pinch. Generally speaking, the closer in size the sink and/or source is to the theoretically maxi-mum size at given temperature levels, the more heat exchanger network changes are necessary. The degree of these changes, however, is also dependent on the actual lay-out of the heat exchanger network (the location geographically and in terms of heater and cooler temperatures).
By process integrating the heat pump instead of using it from the cold utility tempera-ture to the hot utility one, the heat pump will, in most cases, by necessity become smaller, On the other hand, this configuration may be economic as a result of the small-er temperature lift and hence higher COP.
1.3 Analysis of the Annex 21 Screening Program
1.3.1 Introduction
It has been mentioned above that the majority of software tools available for process integration fall into the pinch analysis category. Amongst these programs is the Industri-al Heat Pump (IHP) screening program with the explicit objective to screen the technical and economic potential of heat pumps in various industrial processes without perform-ing extensive and time-consuming case studies employing optimization models. The Industrial Heat Pump (IHP) screening program has been developed in the mid nineties by a group of the Chalmers Industriteknik Energiteknisk Analys (CIT-ETA) headed by T. Berntsson. Since this IHP screening program constituted a major (if not the most im-portant) contribution to the Annex 21 Report [14, April 1995] it will be labeled subse-quently as Annex 21 IHP screening program (in short screening program where not am-biguous). This model will be the starting point of our analysis of software models availa-ble.
A detailed description of the program is found in the Annex A of Ref. [14]. The intended purpose (see Ref. [14], p 41) is given as:
“The main purpose of the Annex 21 IHP screening program is to serve as a tool to allow for preliminary screening of the technical and economic potential of heat pumps in vari-ous industrial processes, based on proper integration into the process. To fulfill this pur-pose, a number of functions have been built into the program. These functions also make it possible to use the program as o a database for process data

Task 2: Modeling calculation and economic models
Introduction
1-161
o a database for heat pump performance data o a calculation tool to establish heat pump performance”
The pioneering idea behind the Annex 21 IHP screening program as well as its very ambi-tious goals and its uniqueness raised the question of today’s relevance and hence lead directly to the item in the legal text of Task 2 of this Annex:
“Analyze and update of existing models from Annex 21, where does the heat pump fit and how does it fit”.
Authors of the Annex 21 IHP screening program are not named explicitly. However, the presentation of the screening program within Annex 21 closely follows the publication of Wallin and Berntsson in 1994 [15], which outlines the main concept only but does not allow to fully understand the details of the screening program. Reference is made to two (at that time unpublished Papers, Refs. [16] and [17]), which were published in 1996 within the Ph. D. thesis of E. Wallin [18] as Appendices 2-5. Obviously, the original inten-tion of the author, to publish the Appendices 2-5 in a journal has been abandoned.
Although the Annex 21 IHP screening program has been offered as an important tool for the integration of a heat pump into a process employing the pinch analysis technique, it has not been advertised or commercialized by CIT-ETA [19]. It has been made available through the IEA Heat Pump Centre (HPC) since the finalization of Annex 21 in 1997.
The Annex 21 IHP screening program has been used by several organizations but this usage is not reflected in subsequent publications. Since its finalization in 1997 the Annex 21 IHP screening program has never been modified or updated.
1.3.2 Conversion of the Annex 21 IHP screening program
During the First Annex 35/13 Meeting in 2011 [20] the update of the Annex 21 IHP screening program was discussed. The participants came to the conclusion that an up-date might be too lavish, expensive and time-consuming. It was agreed to check possible minor improvements and to concentrate on improved input data. Weak points were summarized by R. Nordman [21]:
o Requires detailed knowledge of both process integration and heat pump o Outdated refrigerants’ data (R12, R22, R114, HC, Steam (open type) o Not possible to add new refrigerants (thermophysical data) o No automatic screening possibility, user must test number of options by hand o No transparent interaction possibility with other software (data export) o Separate help files o Graphical system user unfriendly o Need new implementation which would need lots of coding although basic code is
available
The new implementation suggested in the last item of the list shown above was done by the Information Center on Heat Pumps and Refrigeration (IZW): The complete Annex 21 IHP screening program (with only a few minor items missing) was converted from an outdated Visual Basic version to the latest Visual Basic version employing the .NET framework. Details of this work are documented in two internal IZW notes [22]and [23].

Task 2: Modeling calculation and economic models
Introduction
1-162
Both versions, i.e. the original version from 1997 and the converted version from 2011 give in almost all situations identical results. Differences found in specific situations may be attributed to an error detected in the original screening program. Another reason for disagreements in specific situations could be a possible inconsistency between the source code used to build the executable of the original screening program and the source programs provided to IZW. This possible discrepancy could never be clarified. Two examples of the converted version are shown in Figure 1-6 and Figure 1-7. All re-sults (numbers) in the figures are identical with the original Annex 21 IHP screening pro-gram.
The conclusion from this conversion is obvious: The new, converted version is ready for any modifications, updates of data and models as well as for extensions. Parts of the screening program, for instance the database, could be easily extracted and modernized for other purposes.
Figure 1-6: Menu item “Economic opportunities-part 1” of the revised Annex 21 IHP Screening Program (Refs. [22] and [23]); all results (numbers) are identical with the original Annex 21 IHP
screening program

Task 2: Modeling calculation and economic models
Introduction
1-163
Figure 1-7: Menu item “Economic opportunities-part 2” of the revised Annex 21 IHP Screening Program (Refs. [22] and [23]); the graphs are identical with those from the original Annex 21
IHP screening program.
1.3.3 Analysis of the Annex 21 IHP screening program
Two problems make any critical analysis rather difficult, if not impossible: o A systematic verification of the Annex 21 IHP screening program has never been
published. Especially any comparison between the screening program and more so-phisticated models is missing.
o The work of E. Wallin [18] gives a vast amount of details, various approximations and approaches. It is obvious that only selected models or approaches have been implemented in the screening program. Unfortunately, the information what de-tailed approaches have been implemented is missing. In view of the statement made above, that the screening program has not been advertised or commercialized by CIT-ETA, such a detailed description has never been intended. What is available must be considered as fair enough.
The work of Wallin is based on a very detailed thermodynamic and technical under-standing of processes and heat pumps. Such a detailed understanding is also mandatory if a heat pump is to be integrated in a process employing the screening program. Its usage is a step by step optimization, guided by the experience and knowledge of the user. Besides the standard pinch analysis optimization there is no support given by fur-ther optimization methods. This approach makes the usage of the screening program rather complex and time-consuming.
It seems that the difficult usage of the screening program was one major obstacle for any updating of data and models. However, there is one compelling and convincing ar-

Task 2: Modeling calculation and economic models
Introduction
1-164
gument against any update of the screening program in its original form: during the execution of Task 2 it became obvious that the authors (and owners) consider this par-ticular approach as a dead-end and the screening program as obsolete. Since 1997 no further work on this program has been done and the authors decline any further devel-opments. We criticise that the formulation of the corresponding item in the legal text did not take this situation into account.
Nevertheless, we should not loose sight of the database for heat pump performance data, included in the screening program. Since we have worked through all details of the screening program, we know that this database is one the largest part of the screening program. It consists of rather general parts, which need only minor modifications and of input data for heat pumps which must completely be updated (for more details see be-low).
1.4 A modern concept for a screening program based on pinch analysis
The proposed modern concept for a screening program based on pinch analysis consid-ers the work of F. Maréchal and S.A. Papoulias & I.G. Grossmann. Chapter 1.4.1, “The problem table algorithm” follows closely F. Maréchal (Ref. [8]), whereas chapter 1.4.2 “The transshipment model of Papoulias and Grossmann” is a short description of this model directly taken from S.A. Papoulias and I.G. Grossmann [9, p. 709]). From these two references the concept for a new screening program based on pinch analysis has been developed. The kernel of this model has been tested through a preliminary test program (see chapter 1.4.3 “A simple test program”).
Although many details are incorporated in the test program it is not necessary present-ing all equations. Rather emphasis is put on a more general understanding of the math-ematical concept. It will be shown that the resulting equations of linear programming (linear optimization) are more or less as simple as solving a linear system of equations.
As mentioned in previous chapters, the general solution of integrating heat pumps into a problem has been discussed in all aspects and has been solved for several case studies by H.C. Becker [13]. Here we analyze an approximate solution for the simultaneous op-timization of heat pump, utilities and heat exchanger network (in an approximate form) by substituting the problem table algorithm of the classical pinch analysis by a simple optimization model.
1.4.1 The problem table algorithm formulated as mathematical optimization
method
The original (classical) pinch analysis is using the problem table algorithm as optimiza-tion technique, which is extremely simple but also unnecessarily limiting. The problem table algorithm stands for a specific heat balance model (heat cascade model), to obtain the minimum energy requirement. The heat cascade is represented by temperature intervals obtained by the construction of composite curves, in which energy balances are performed. The standard procedures for partitioning the entire temperature range account for thermodynamic constraints in the transfer of heat, i.e. it guarantees that the

Task 2: Modeling calculation and economic models
Introduction
1-165
second law of thermodynamics is taken into account. Temperatures of hot streams are corrected by −∆𝑇𝑚𝑖𝑛/2 whereas cold streams are corrected by +∆𝑇𝑚𝑖𝑛/2. The heat cascade model of the classical pinch analysis is visualized in Figure 1-8. The vector 𝑹 represents the heat cascaded from higher to lower temperatures, 𝑅1 is the cold and 𝑅𝑛+1 the hot utility, i.e. the minimum energy requirement.
Figure 1-8: Heat cascade model underlying the classical pinch analysis; for explanations see text; corrected temperatures are labeled as 𝑇𝑖
∗; the specific notation is given in the text
From Figure 1-8 we see that only two utilities are considered: one hot (≡ 𝑅𝑛+1) and one cold (≡ 𝑅1) utility. The reason for this restriction is quite simple: This particular form of the optimization problem to obtain the minimum energy required can be carried out by hand. However, this simplicity has its prize: Only for these restrictions the optimization problem can be solved without employing optimization methods such as linear pro-gramming (linear optimization) methods. This would already be necessary if utilities in more general configurations are to be considered. In pinch analysis these restrictions are overcome by use of the grand composite curve and performing this optimization by hand, which restricts this optimization to manageable situations only.
The mathematical form of the problem table algorithm is as follows: For the independ-ent variables 𝑅1, … , 𝑅𝑛+1 (the heat cascaded from higher to lower temperatures), we need to maximize the function
(1) 𝑧 = −𝑅𝑛+1
subject to primary constraints
(2) 𝑅𝑘 ≥ 0 𝑘 = 1, … , 𝑛 + 1
and simultaneously subject to the additional constraints (balance of heat)
(3) 𝑅𝑘+1 + ∑ �̇�
ℎ𝑜𝑡 𝑠𝑡𝑟𝑒𝑎𝑚𝑠
𝑐𝑝 ∆ 𝑇𝐾 − 𝑅𝑘 − ∑ �̇�
𝑐𝑜𝑙𝑑 𝑠𝑡𝑟𝑒𝑎𝑚𝑠
𝑐𝑝 ∆ 𝑇𝐾 = 0

Task 2: Modeling calculation and economic models
Introduction
1-166
with �̇� = mass flow rate
𝑐𝑝 = specific heat at constant pressure
∆𝑇𝑘 = 𝑇𝑘+1∗ − 𝑇𝑘
∗
For the sake of simplicity the individual stream indices have been omitted in Eq. (3). These equations formulate a rather simple problem which can be solved by standard solvers of linear programming (linear optimization).
1.4.2 The transshipment model of Papoulias and Grossmann
A transshipment model may be considered as an extension of Equations (1)-(3) in order to consider utilities in a more flexible form. Its basis is also a heat cascade model similar to the one shown in Figure 1-8. Papoulias and Grossmann write:
“The transhipment model for the heat recovery network has the hot streams and the heating utilities as sources, the temperature intervals as the immediately nodes and the cold streams and the cold utilities as the destinations. The heat flow pattern, and thus the extended equations compared with the equations (1)-(3), is as follows:
o Heat flows into a particular interval from all hot streams and heating utilities whose temperature range includes the temperature interval.
o Heat flows out of a particular interval to the cold streams and cooling utilities whose temperature range includes the temperature interval.
o Heat flows out of a particular interval to the next lower temperature interval. This heat is the residual (excess) heat that cannot be utilized in the present interval, and consequently has to flow to a lower temperature interval.
o Heat flows into a particular temperature interval from the previous interval that is at a higher temperature. This heat is the residual (excess) heat that cannot be utilized in the higher temperature interval.”
The main advantage of the transshipment model in comparison to the problem table algorithm is the significantly increased flexibility to optimize complex utility configura-tions with arbitrary cost structures.
The authors also show how this transshipment model could be extended to treat re-stricted matches, i.e. pairs of hot and cold stream that are not allowed to exchange heat. Such a case cannot be treated by the classical pinch analysis.
The statement presented at the beginning of this chapter, i.e. that a transshipment model may be considered as an extension of Equations (1)-(3) can also be reversed: The problem table algorithm is included in the transhipment model as special case. This leads immediately to the question whether the substitution of the problem table algo-rithm by the transhipment model as a more or less general optimization method offers advantages in a modern pinch analysis programs.
One advantage is obvious: The optimization of utilities could be done by the code if the necessary information concerning utilities (temperature, mass flow rates, costs etc.) is provided to the code by a specific “Utility Window”. Of course, the user could modify this optimization of utilities of the code by using the standard approach, namely by em-ploying the grand composite curve.

Task 2: Modeling calculation and economic models
Introduction
1-167
We would expect that such modifications of the classic pinch analysis approach has al-ready be realised in one or the other pinch analysis code.
The second advantage is also obvious: by a further minor extension of the classical tran-shipment model (see chapter 1.4.4 “The extension of the transshipment model to inte-grate a heat pump”), a heat pump could be included in the process by a simultaneous optimization of utilities and heat pump. This will be discussed below.
The fundamental requirements of the substitution of the problem table algorithm by a transshipment model are applicability, numerical accuracy and reliability as well as rea-sonable computational times. In other words, would this substitution eventually annihi-late the simplicity of pinch analysis models? We would expect that the numerical effort of the optimization is negligible, since the heat cascade model itself is a thermodynamic simplification of complicated processes.
Since the transshipment model plays a dominant role in the proposed ‘modern’ pinch analysis program and since all numerical aspects need to be known in principle before a major code development is started, a numerical model was written in form of a simple test program.
1.4.3 A simple test program
A simple test program has been programmed in a rather flexible form: Up to 500 tem-perature intervals are allowed and ‘arbitrary’ utilities may be considered. The optimiza-tion goal can be either minimum of energy or minimum of costs. It has to be stressed that this version of the transshipment model is a test version only, which does not in-clude a Graphical User Interface. It has been used for various very specific situations by directly modifying the code.
When applied to appropriate situations (and only for such specific situations a direct comparison can be made; see Figure 1-8), the agreement between the results of the classical pinch analysis with the problem table algorithm and the transshipment model is perfect. Compared were 4 quantities for 14 very different cases taken from the process data base included in the Annex 21 IHP screening program: pinch temperature, pinch location, hot utility and cold utility (see Figure 1-9). The computational cost of both algo-rithms is hardly to be measured on a modern PC.

Task 2: Modeling calculation and economic models
Introduction
1-168
Figure 1-9: Comparison between the solution of the heat cascade model according to the classical pinch analysis based on the problem table algorithm and an optimization technique for 14 differ-
ent processes; the agreement is perfect
Our proposal that that optimization of utilities could be done by a transhipment model within a pinch analysis code if the necessary information concerning utilities (tempera-ture, mass flow rates, costs etc.) is provided to the code by a specific “Utility Window” can be realized more or less without any restrictions.
We therefore expect that such or similar extensions of the classical pinch analysis are employed in several software tools.
The further tests confirmed applicability, numerical accuracy and reliability of the trans-shipment algorithm as well as short computational times. These tests included rather complicated situations of utilities and their different costs, in which we doubt that an optimization performed by hand is trivial.
Consequently there are no obstacles to further follow this approach for a modern con-cept for a screening program based on pinch analysis
1
10
100
1000
1 10 100 1000 10000
pinch temperature
pinch location
hot utility
cold utility
Classical Pinch Analysis (Problem Table)
Mo
de
rn P
inch
An
aly
sis
(o
ptim
iza
tio
n o
f h
ea
t ca
sca
de
)

Task 2: Modeling calculation and economic models
Introduction
1-169
1.4.4 The extension of the transshipment model to integrate a heat pump
The consequences of integrating a heat pump into a process on the heat exchanger network have already been discussed in chapter 1.2 “Integration of Heat Pumps in In-dustrial Processes: general principles”. In a heat pump heat is lifted from a low tempera-ture level (heat source) to a higher temperature level (heat sink). For integrating a heat pump into a process both terms must additionally be taken into account in the trans-shipment model, i.e. in the heat cascade. The consequence of integrating a heat pump has not only been extensively discussed in the Annex 21 report, but also visualized in Figure 3.4 of Ref. [14], p. 31. As already discussed in chapter 1.2, the modification of hot and cold composite curves lead to a decrease of driving forces for heat exchanging be-low heat source temperatures and above heat sink temperatures, which implies that larger heat exchange areas are necessary.
For modeling it is important to recognize that the model gets nonlinear, i.e. not only the driving forces for heat exchange are affected but also the location of the pinch point.
1.4.5 The elements of the proposed modern concept for a screening program based
on pinch analysis
Let us consider the heat balance equations in the form of the heat cascade as the first element of the proposed modern concept for a screening program based on pinch anal-ysis.
The second element is the heat exchanger network. As long as we aim at developing a ‘modern’ screening program based on pinch analysis, we must assume that - analogous to the standard pinch analysis- the heat exchanger network is approximated by an artifi-cial heat exchanger area 𝐴𝑒𝑥, which depends on the minimum approach tempera-ture ∆𝑇𝑚𝑖𝑛. As above in the case of the heat cascade we indicate the type of mathemati-cal dependencies only.
For a cold stream to be heated up from an initial temperature 𝑇𝑐𝑜𝑙𝑑,𝑖𝑛 to a target tem-
perature 𝑇𝑐𝑜𝑙𝑑,𝑡𝑎𝑟𝑔𝑒𝑡 and one hot stream to be cooled down from 𝑇ℎ𝑜𝑡,𝑖𝑛 to 𝑇ℎ𝑜𝑡,𝑡𝑎𝑟𝑔𝑒𝑡,
F. Maréchal gives the solution from which one can see the typical dependencies [8, p 167ff]:
(4) 𝐴𝑒𝑥(∆𝑇𝑚𝑖𝑛) = �̇�ℎ𝑜𝑡 𝑐𝑝,ℎ𝑜𝑡
(1 − 𝜅)𝑈𝑒𝑥 [ ln {
(1 − 𝜅) (𝑇ℎ𝑜𝑡,𝑖𝑛 − 𝑇𝑐𝑜𝑙𝑑,𝑖𝑛) + 𝜅 ∆𝑇𝑚𝑖𝑛
∆𝑇𝑚𝑖𝑛} ]
with 𝜅 =�̇�ℎ𝑜𝑡 𝑐𝑝,ℎ𝑜𝑡
�̇�ℎ𝑜𝑡 𝑐𝑝,𝑐𝑜𝑙𝑑 and
1
𝑈𝑒𝑥=
1
𝛼𝑐𝑜𝑙𝑑+
𝑒
𝜆+
1
𝑎ℎ𝑜𝑡
�̇� is the mass flow rate, 𝑐𝑝 is the specific heat at constant pressure, 𝑈𝑒𝑥 is the overall
heat transfer coefficient of the heat exchanger, 𝛼 is the heat transfer coefficient, 𝑒 the thickness of the tubes. Eq. (4) allows estimating the costs of the heat exchanger network and can easily be refined.
Clearly, this approach is an approximation. Unfortunately, we cannot say how good this approximation is since we are not aware of any systematic comparison between the costs estimated by pin analysis and from analyses based on detailed optimization. It is obvious that this approximation is only meaningful for those situations, in which the

Task 2: Modeling calculation and economic models
Introduction
1-170
error of the approximation is far less than the actual potential of incorporating a heat pump.
Further elements of the model are:
o Development of a heat pump database to be used within the optimization process. Typical information to the database are not only source and sink temperature as well as size of heat pump but also further details of the selected hot and cold streams to which the heat pump is selected which allow to select a specific heat pump type. It has been mentioned in chapter 1.3.3 that the data base of the original Annex 21 IHP screening program is one the largest part of this program. It consists of rather general parts, which need only minor modifications. Most importantly, the input data for heat pumps must be updated.
o Development of an algorithm for selecting of a hot and cold stream (may be the selection of several hot and cold streams) to which the heat pump could be con-nected. This algorithm is not really clear in Wallin’s thesis [18]. No attempt has been made to look deeper into this problem.
o The nonlinearity mentioned above requires an iteration that converges towards the solution. Generally, convergence can never be guaranteed per se, but in this case it is even worse since the nonlinearity has a rather nasty characteristic: Some of the functions are or get discontinuous. For instance the pinch point itself, or the size and price of a specific heat pump with a specific power range, where the full power range is realized by overlapping of individual heat pump models. In view of the ex-tremely short computational costs in the range far below seconds per analysis, we have had in mind to apply a Monte Carlo technique with quasi-random sequences. This technique would have allowed obtaining results in a reasonable time. Of course there would have been the need (with the help of experts!) to replace this Monte Carlo technique by a more appropriate technique used in process integration later on.
The proposal to substitute the problem table algorithm by a modified transshipment model in pinch analysis in order to integrate a heat pump into a process is supported by the approach taken by K. Holiastos and V. Manousiouthakis [25] for the optimal integra-tion of heat pumps and engines in heat exchanger networks. Heat pumps and heat en-gines are considered as components of the heat exchange network. Analogous to pinch analysis, which does not deal with single heat exchangers (at least not in the targeting step), individual units (e.g. heat pumps) are not dealt with. Rather, a thermodynamic approach is considered, enabling the solution of the global optimum over all network configurations. Two subnetworks are considered, whose interaction produce the opti-mal network: a heat exchanger subnetwork, representing the aggregate action of heat exchangers, and a heat engine and heat pump subnetwork, representing the aggregate action of power units. The heat exchanger network is modeled by a modified equation (4) taking into account that only a fraction of the hot composite stream enthalpy will be transferred to the cold composite stream. The heat engine and heat pump network is modeled by the work available (first law) and the second law: it is necessary to ensure that the total stream enthalpy change due to aggregate heat pump/engine action in the subnetwork is zero (Ref. [25], p. 8).

Task 2: Modeling calculation and economic models
Introduction
1-171
1.4.6 Summary
A modern concept for a screening program based on pinch analysis can be developed by substituting the original problem table algorithm of the pinch analysis by a modified transshipment model. Numerical aspects and principal feasibility have been analyzed. However, some details of this model need to be developed:
o Development of an algorithm for selecting of a hot and cold stream (may be of sev-eral hot and cold streams) to which the heat pump could be connected.
o Development of a heat pump data base. o Development of an iteration algorithm to cope with the specific type of nonlinearity.
In principle this analysis should be very similar to the “engineering” procedure of inte-grating a heat pump. However, we must be aware that the approximation of the net of heat exchangers may jeopardize the whole approach if its error is too large.
1.5 Scoping analysis of existing software tools based on pinch analysis
This chapter is called ‘Scoping Analysis’ since neither a detailed mathematical analysis nor any detailed analysis of functionalities, user support or user friendliness can be given within this Task 2 report. However, experiences with one of the major tools, the Einstein code, and the models used for the choice of a heat pump will be reported below.
A comprehensive State of the Art review on analytical tools based on the pinch method, is given by Y. Beucher, J.-L. Peureux and A. Vuillermoz (see chapter 3). Methods of pro-cess energy integration with emphasis on pinch analysis are discussed and stakeholders from academic research laboratories and other non-academic players are listed. Alt-hough this compilation has been carried out over several years, it does not claim to be an exhaustive list, as numerous pinch analysis tools exist and new tools are released every year. Some of the tools presented in this report may even now be obsolete. Here, we only list the names of the programs treated in more detail in the report: STAR and SPRINT, Pinchlight, OSMOSE, Thermoptim, CERES, Pro_Pi, PinCH, Hint, Einstein, Super-Target, AspenEnergyAnalyzer. The compilation is rather descriptive and more oriented towards giving potential users a first orientation. Although mathematical details have been omitted in the overview, the authors indicate what is to be expected from the the-oretical point of view with regard to the integration of heat pumps:
OSMOSE: Developed by the group “energy integration of heating systems” headed by F. Maréchal of the Ecole Polytechnique Fédérale de Lausanne (EPFL). Calculation models and procedures have been developed to integrate heat pumps into an industrial process. OSMOSE is an optimisation plat-form, rather than a tool based on the pinch method. OSMOSE uses the mathematical programming formulation of the heat cascade and aims at calculating the flows in the utility system. This approach is the only practi-cal approach for the heat pump integration since the flows of the hot and cold streams of the heat pump are interacting with the other heat pumps and with the other utility streams like combustion gases, cogeneration and steam cycle models. It has to be highlighted that although pinch anal-

Task 2: Modeling calculation and economic models
Introduction
1-172
ysis gives an explanation of the principle of the heat pumping integration, the pinch analysis is mainly targeting the heat recovery and therefore can be hardly used when it comes to calculate the optimal integration of a heat pumping systems [26].
CERES: developed by the CES (Centre d’Eco-efficacité des Systèmes or Centre for Systems Eco-Efficiency) of the Ecole Nationale Supérieure des Mines de Paris (Mines Paristech). CERES enables the pinch method, but has been further enhanced with optimisation algorithms designed to select among a number of utilities (heat pumps, turbines, etc.).
Einstein: The pinch method is involved only when designing the exchanger net-work, and not in the choice of utilities: the tool does not really allow for determining which utilities or combinations thereof would be optimum; it only provides the possibility for testing various energy supply scenarios and to compare them based on energy, economic or environmental crite-ria. The module designed for heat pump integration is not easy to use, and – at least in V2.1 – had some bugs.
1.6 Conclusions
Although the Annex 35/13 project had been prolongated by one year, mainly because of missing results from Task 2, nearly none of the deliveries could be finished as foreseen. We attribute this low interest to two facts:
o Most participants are not concerned directly with modeling and software aspects. o The wide range of software tools with their very different scopes was largely under-
estimated.
The Annex 21 IHP screening program has been analyzed and converted from an outdat-ed Visual Basic version to the latest Visual Basic version employing the .NET framework. This new, converted version would in principle be ready for any modifications, updates of data and models as well as for extensions. However, during the execution of Task 2 it became obvious that the authors (and owners) consider this approach as a dead-end and the screening program as obsolete. Since 1997 no further work on this program has been done and the authors decline any further developments. We simply notice that the formulation of the corresponding item in the legal text did not take this situation into account. However, parts of the screening program, for instance the database, could be easily extracted and modernized for other purposes.
In order to ‘update’ the Annex 21 IHP screening program in the sense of a ‘modern’ de-velopment taking the original goals into account a proposal is made that allows a con-sistent integration of a heat pump into a process based on pinch analysis. The basic ele-ments of this concept are:
o Substitution of the problem table algorithm by an extended transshipment model which allows a simultaneous optimization of utilities and heat pump.
o Approximation of the heat exchanger network as in the standard pinch analysis. o Development of an algorithm for selecting of a hot and cold stream (may be of sev-
eral hot and cold streams) to which the heat pump could be connected.

Task 2: Modeling calculation and economic models
Introduction
1-173
o Development of a heat pump data base to be used within the simultaneous optimi-zation. Since this optimization is nonlinear a special algorithm needs to be devel-oped that enables convergence.
This concept of integrating a heat pump into a process is ‘below’ the sophisticated methods given by H.E. Becker [13]. Presently it is impossible to state whether such a development is unprecedented, relevant and needed.
The scoping analysis of existing models shows that the difference between ‘pure’ pinch models and sophisticated mathematical optimization models has been bridged in mod-ern software tools. Regarding the integration of heat pumps into a process, codes like OSMOSE or CERES (amongst may be others) look promising.
Independent of any software tools, approaches and optimizations, a general heat pump data base should come more into the focus. Such a data base is needed for many pur-poses. Typical information to the database are not only source and sink temperature as well as size of heat pump etc. but also further details of the selected hot and cold streams to which the heat pump is selected, because this would allow to select a specific heat pump type.
The goals of Task 2 should be carefully reconsidered if a “new Task 2” team should be constituted. The State of the Art as well as industrial needs of research organizations, large companies as well as of energy consultants should be critically reviewed. We con-clude that the application of general optimization methods is limited to a fairly small number of research groups and highly specialized groups within large companies. Energy consultants probably will prefer pinch analysis type models. This is the main reason why we propose to develop a ‘modern’ screening program ‘below’ the sophisticated meth-ods given by H.E. Becker [13], which may be considered as a specific add-on for standard pinch analysis codes for integration of heat pumps. Nevertheless, in the whole context we consider the thesis of H.C. Becker (directed by F. Maréchal) as key reference due to the systematic methodology, based on pinch analysis and process integration tech-niques, to integrate heat pumps into industrial processes.
More detailed information of the programme and work on Task 2 of the Operating Agent see the IZW Internal Reports
01/2011: Analysis of the Annex 21 IHP Screening program [22]
02/2011: Upgrade of the Annex 21 IHP Screening program [23]
11/2012: Some thoughts regarding Annex 35/13 Task 2 report [26]
12/2012: Integration of heat pumps into chemical processes: An outline of theoretical methods [27].
1.7 References
[1] T. Gundersen, A Process Integration Primer, SINTEF Energy Research, Trondheim, Norway, 10 May 2000, available from the Internet under “PI_Primer_0005.pdf”
[2] T. Gundersen, A Survey on Process Integration Methods and Software, SINTEF Energy Research, Trondheim, Norway, September 2000
[3] Hon Loong Lam et al., Software tools overview: process integration, modeling and optimization for energy saving and pollution reduction, ASIA PACIFIC JOURNAL OF

Task 2: Modeling calculation and economic models
Introduction
1-174
CHEMICAL ENGINEERING, Asia Pac. J. Chem. Eng. 2011, 6: 696-712; Published online 2 September 2010 in Wiley Online Library
[4] L. Puigjaner and G. Heyen (eds.), Computer Aided Process and Product Engineer-ing, Volume 1, ISBN:3-527-30804-0, Wiley-VCH Verlag GmbH & Co. KGaA, 2006; Chapter 3 we refer to has been written by F. Maréchal and B. Kalitventzeff.
[5] I.E. Grossmann, J.A. Caballero and H. Yeomans, Mathematical Programming Ap-proaches to the Synthesis of Chemical Process Systems, Korean J. Chem. Eng., 16(4) (1999), p. 407-426
[6] B. Linnhoff and J. R. Flower, Synthesis of heat exchanger networks. Part I: System-atic generation of energy optimal networks, AIChEJ. 24(4) (1978), p. 633-642. Part II: Evolutionary generation of networks with various criteria of optimality, AIChEJ, 24(4) (1978), p. 642-654
[7] I.C. Kemp, Pinch Analysis and Process Integration, Elsevier, Second edition (2007) [8] F. Maréchal, Pinch Analysis, contribution to Exergy, Energy System Analysis and
Optimization – Vol 1, Exergy and Thermodynamic by C. A. Frangopoulos, Oxford Eolss Publishers Co Ltd, 2009, 978-1-8482-6614-8 pages 166-197
[9] S.A. Papoulias and I.G. Grossmann, A Structural Optimization Approach in Process Synthesis, Computers and Chemical Engineering Vol. 7, No. 6, pp. 695-734 , 1983 (three parts)
[10] C.A. Floudas, Nonlinear and Mixed-Integer Optimization, Fundamentals and Appli-cations, Oxford University Press (1995), ISBN 0-19-510056-5
[11] G. Spinato (Author), F. Maréchal (Supervisor), H. Becker (Assistant), Heat Pump Integration in Industrial Processes-II, Semester Project, École Polytechnique Fédérale de Lausanne, January 7, 2011
[12] H. Becker, F. Maréchal and A. Vuillermoz, Process Integration and Opportunities for Heat Pumps in Industrial Processes, International Journal of Thermodynamics, Vol. 14 (No. 2), pp. 59-70, 2011
[13] Helen Carla Becker, Methodology and Thermo-Economic Optimization for Integra-tion of Industrial Heat Pumps, THÈSE NO 5341 (2012), ÉCOLE POLYTECHNIQUE FÉDÉRALE DE LAUSANNE, Suisse, 2012
[14] Industrial Heat Pumps, Experiences, Potential and Global Environmental Benefits, Annex 21, Report No. HPP-AN21-1 (1995)
[15] E.Wallin and T. Berntsson, Integration of Heat Pumps in Industrial Processes, Heat Recovery Systems & CHP, Vol. 14 (3), pp. 287-296, 1994
[16] E. Wallin and T. Berntsson, Heat Exchanger Network Consequences by Combined Heat Pumping and Improved Heat Exchanging, to be published
[17] E. Wallin and T. Berntsson, Process Integration of Heat Pumps in Retrofitting Situ-ations, to be published
[18] E. Wallin, Process Integration of Industrial Heat Pumps in Grass-Root and Retrofit Situations, Chalmers University of Technology, Göteborg, Sweden, Ph. D. Thesis 1996
[19] T. Berntsson, personal communication, Feb. 2012 [20] Minutes, First Meeting 2011, IEA HPP / IETS Annex 35/13, “Application of Indus-
trial Heat Pumps”, 16.6.2011, EdF-R&D, Les Renardière, Moret-sur-Loing, France [21] see reference above, Attachment 11 [22] K. Lassmann and H.-J. Laue, Analysis of the Annex 21 IHP Screening program, IZW
internal report 01 (2011), IEA HPP – IETS Annex 35 /13, Application of Industrial Heat Pumps

Task 2: Modeling calculation and economic models
Introduction
1-175
[23] K. Lassmann and H.-J. Laue, Upgrade of the Annex 21 IHP Screening program, IZW internal report 02 (2011), IEA HPP – IETS Annex 35 /13, Application of Industrial Heat Pumps
[24] K. Lassmann and H.-J. Laue, Upgrade of the Annex 21 IHP Screening program, IZW internal note 2 (2011), IEA HPP – IETS Annex 35 /13, Application of Industrial Heat Pumps
[25] K. Holiastos and V. Manousiouthakis, Minimum hot/cold/electric utility cost for heat exchange networks, Computers and Chemical Engineering 26 (2002) 3-16
[26] F. Maréchal, personal communication [27] K. Lassmann, H.J. Laue, Some thoughts regarding Annex 35/13 Task Report
IZW Internal Report 11(2012), IEA HPP-IETS Annex 35 / 13, Application of Industri-al Heat Pumps
[28] K. Lassmann, H.J. Laue, Integration of heat pumps into chemical processes: An outline of theoretical methods. IZW Internal report 12 (2012), IEA HPP-IETS Annex 35/13 Application of Industrial Heat Pumps

Task 2: Modeling calculation and economic models
Austrian Team Report - Software
2-176
2 Austrian Team Report - Software
Within the Task 2 of the IEA HPP-IETS Annex 35/13 different software tools regarding the integration of heat pumps in production processes and there energetic and econom-ical savings have been analysed. Due to the lack of the availability of measurement data the tools are only described theoretically without validation.
An investigation concerning available programs for the calculation and interpretation of large heat pumps and their integration into complex systems has been carried out, fo-cusing on software solutions that can be used by industrial companies: No time-consuming model development is necessary, technical and economic aspects might be considered, relatively simple data entry, data are easy and inexpensive to collect, etc. Since the financing of the national project does not provide costs for the purchase of software licenses, the search was limited to free software. An attempt was made to obtain demo versions of the software to analyze the applicability. From this analysis a qualitative evaluation of the available software can be carried out to prove if the tools can be used for research and as well for industry. The analysis will include, among oth-ers, the following:
For what purposes is the software suitable?
Which heat pump technologies can be simulated?
How flexible is the software in terms of system design?
Is the software suitable rather for research or for planning and calculation of re-al systems?
Based on the experience gained, the need for the development of new or the adaptation of existing tools and models have been evaluated. In this regard also the simulation tools EES, ASPEN Plus and CoolPack have been analysed concerning the ability for prov-ing suitable system integrations. EES (2010), ASPEN Plus (2009) and CoolPack (2014) are tools for a theoretical analysis of different heat pump cycles by means of thermodynam-ics, but they are not the optimum tools for the analysis of the integration of heat pumps in complex systems, as e.g. production processes by the end users or planers concerning ecological and economical criteria.
As part of this project two software tools "TOP-Energy" (2013) & "EINSTEIN" (2013) for the analysis and optimization of energy systems including the possibility of integrating heat pumps have been traced and described in more detail.
2.1 TOP Energy
The “TOP energy” (2013) software was devel-oped by the Department of Technical Thermo-dynamics - RWTH Aachen University to support the analysis and optimization of energy sys-tems. The software consists of several modules, which are attached to a common framework. The framework provides basic functionalities, such as Open / Save Project / Export, while the modules satisfy a specific engineering task.

Task 2: Modeling calculation and economic models
Austrian Team Report - Software
2-177
Currently the modules eNtry for initial analysis, eSim for the simulation of Energy sys-tems and eVariant for the comparison of different variants exist.
The TOP energy framework is a software tool, which specifies a specific application structure to carry out projects for the analysis and optimization of power engineering problems in industry. The execution of tasks is supported by implemented application modules that are controlled and monitored by the framework.
The energy oriented analyses are performed by eNtry - initial analysis and use specific questionnaires for data collection. The module checks the entered data for plausibility, calculates a number of operational energy figures and compares them with typical in-dustry values. The results of the evaluation are presented clearly in diagrams and tables and can be exported to a report.
The optimization of energy use in the industry is determined by the simulation module eSim and the flow diagram editor, while energetic as well as economic and ecological characteristics are worked out. A comparative economic analysis for energy applications is realized with the module eValuate - variant comparison.
Two types of heat pump models are available:
A compression heat pump is given as a component template. It is used in TOP energy as model description of a heat pump process, which is driven mechani-cally respectively electrically. Apart from the technical input data it is also possi-ble to use economic data which indicate the capital- bound or the operational costs of the components. This information is used to compare the efficiency of energy system variants with the TOP Energy eValuate Module.
The Model of an absorption chiller describes the thermal behaviour of a ther-mally driven heat pump. Electric auxiliary drives, for example for the solvent pump between drain and desorber are not modelled and are not included in the calculations. User input concerning capacity is required, which includes the nominal cooling capacity, power consumption (thermal) and electricity. Fur-thermore temperature levels can be specified for cooling, re-cooling and the thermal input. The dependencies between the temperature levels and the be-haviour of the chillers are not yet implemented in this component. With an in-put file the characteristic of a part load behaviour for the absorption chiller can be specified, in the simplest case, there is a linear curve from 0 to 100 % of the rated power.
2.2 EINSTEIN
EINSTEIN (Expert System for an Intelligent Supply of Thermal Energy in Industry and other large-scale appli-cations, 2013) is a tool-kit for fast and high quality thermal energy audits in industry, composed by an
audit guide describing the thermal energy audit methodology and by a software tool that guides the auditor through all the audit steps.

Task 2: Modeling calculation and economic models
Austrian Team Report - Software
2-178
The free, open-source software tool EINSTEIN enables the development of strategies to reduce energy consumption and operating costs in the company. In contrast to standard measures for reducing the electrical consumption in industry such as by pumps, motors, lighting achieving good results, the optimization of the thermal energy requirements is technically quite complex (Schweiger et al., 2011). The “eye of EINSTEIN” (see takes into account heat recovery, process integration and a smart combination of economic heat-ing and cooling supply technologies.
Figure 2-1: “The eye of EINSTEIN” – holistic approach for audits of the thermal energy supply of processes (Schweiger et al., 2011)
The software results from the Intelligent Energy Europe (IEE ) project EINSTEIN with the collaboration partners: Joanneum Research (Austria), Sapienza University of Rome (Italy) and energyXperts.NET (Spain) in the framework of the IEA (International Energy Agency) - Solar Heating and Cooling and SolarPACES Programs, task 33 (Brunner et al., 2010)
EINSTEIN is a method of introducing a holistic and integrated approach to thermal ener-gy audits for both, industrial applications as well as hospitals, office buildings and sports halls. Einstein calculates the thermal energy demand, rates savings by heat exchange using pinch analysis, points out technical alternatives for the integration of energy effi-cient and renewable energy systems and evaluates them. The user is guided through the entire audit process, from data collection through to the development of alternative technological solutions. The tool is aimed in particular sectors with a high proportion of low and medium temperature levels of heat, such as the food or the paper industry.

Task 2: Modeling calculation and economic models
Austrian Team Report - Software
2-179
Figure 2-2: Elements of EINSTEIN`s audit instruments (EINSTEIN, 2013)
The software tool shows concrete results for energy and economic savings that can be achieved through a restructured or optimized heat supply system. The alternatives in-clude all major energy- efficiency technologies (e.g. heat recovery, cogeneration, heat pumps, solar thermal and biomass).
2.3 Literature
Aspen Plus, 2009 “Aspen Plus v 7.0”, Aspen Technology, Inc., Cambridge, Massa-chusetts
Brunner, C., Muster-Slawitsch, B., Heigl, E., Schweiger, H., Vannoni, C., 2010:
„EINSTEIN – EXPERT SYSTEM FOR AN INTELLIGENT SUPPLY OF
THERMAL ENERGY IN INDUSTRY - AUDIT METHODOLOGY AND
SOFTWARE TOOL“ - Proceedings Eurosun, October 2010
CoolPack, 2013: „ CoolPack software- a collection of simulation tools for refriger-
ation: "Refrigeration Utilities", "EESCoolTools" and "Dynamic”” - Department of Mechanical Engineering (MEK), Section of Energy Engineering (ET) at the Technical University of Denmark (DTU), www.et.dtu.dk/CoolPack
EES, 2010: “Engineering Equation Solver”, © 1992-2010 S.A. Klein and F .L. Alvarado, Academic Professional, V8.659-3D (09/1/10), F-Chart Software, Madison, Wisconsin
EINSTEIN, 2013: Technical Description EINSTEIN, https://www.einstein-ener-gy.net/media/static_pages/4%20EINSTEIN%20Documentation/EINSTEIN%20Documentation.html (07.11.2013)
Schweiger, H., Vannoni, C., Brunner, C., Muster-Slawitsch, B., Kulterer, K., Bertrand, A., Minette, F., Danov, S., Facci, E., Kranjc, D., Bouquet, T., Craenen, S., 2010:

Task 2: Modeling calculation and economic models
Austrian Team Report - Software
2-180
„Leitfaden für EINSTEIN Audits für thermischeEnergie“ - Intelligent Energy Europe (Project: EINSTEIN, EIE/07/210/SI2.466708) and kli-ma:aktiv programm: „energieeffiziente Betriebe“, der Klimaschutzinitia-tive des Lebensministeriums, Version: 2.0, Letzte Überarbeitung: 03/02/2011 http://www.aee-intec.at/0uploads/dateien937.pdf (18.03.2014)

Task 2: Modeling calculation and economic models
French Team Report - State of the Art Review on Analytical Tools based on the Pinch Method
3-181
3 French Team Report - State of the Art Review on Analytical Tools based on the Pinch Method
3.1 Introduction
Process energy integration is intended to identify potential sources of energy recovery via heat exchange and integration of utilities in an industrial process. Historically, it has relied on the concept of Pinch Analysis.
The Pinch Method enables among other to identify potentials for the positioning of heat pumps by evaluating the operating powers and temperatures.
This review inventories tools identified as based on the Pinch Method. It does not claim to be an exhaustive list, as numerous pinch analysis tools exist and new tools are re-leased every year. Some of the tools presented in this report may now be obsolete, since this state of the art review was carried out over several years.
3.2 Methods of process energy integration
3.2.1 Principle
The pinch analysis relies on a thermodynamic approach of the process. It involves identi-fying the energy flows of the process, considering only the real requirements linked to product conversion, and hence disregarding the means implemented by the industrial manufacturer to meet these needs. Once the list of streams is established, some math-ematical tools can be used to identify sources of process inefficiencies and to propose corresponding upgrades.
The successive steps of the method are detailed below:
1. Definition of hot flows and cold flows. This involves defining the unitary process operations and quantifying their energy requirements. These requirements may be determined according to nature of the fluid (and specific heat), its tempera-ture at input and output of the unit operation. A heat source (or hot flow) quali-fies a fluid containing a certain amount of recoverable energy or that must be cooled to meet the process needs, and a heat sink (or cold flow) refers to a fluid that must be heated before being used in the process.
2. Construction of composite curves. Composite curves are used to establish target values of minimum energy consumption. They represent the profile of available heat sources (cold composite curve) and the profile of heating needs of the pro-cess (hot composite curve). To build these curves, the total heat availability and demand values are cumulated at various temperature intervals in the system (based on the formula ΔH = mCpΔT) and these enthalpy results are plotted on a diagram (T,H).
3. Identification of the pinch. The cold and hot composite curves are plotted on the same diagram (in such a way that they do not overlap). The lowest vertical gap ΔTmin is identified, corresponding to the minimum allowable temperature dif-

Task 2: Modeling calculation and economic models
French Team Report - State of the Art Review on Analytical Tools based on the Pinch Method
3-182
ference between the two fluids in a heat exchanger: this is the pinch point. The pinch ΔTmin arises from a trade-off between the cost of an exchanger providing for heat recovery internally and the cost of utilities required to meet the heating and cooling requirements of the process.
The region above the pinch (right-hand side of the graph) requires only a heat input (Qhmin) to meet the process needs, while the region below the pinch (left-hand side of the curve) only requires cooling (Qcmin). Thus the process should be built in such a way as to avoid any heat transfers from a hot flow above the pinch towards a cold flow below the pinch. Otherwise, the energy consumed would need to be offset by an input from a utility (hot or cold).
4. Calculation of minimum energy requirement (MER) for the process. Once the composite curves are calibrated with the pinch point, the MER corresponds to the requirements in utilities (hot and cold) not supplied by the process itself.
3.2.2 Required data
The data necessary for a pinch analysis correspond to the characteristics of the streams needing to be heated, cooled or where there is a phase change. These data generally include:
- mass flow (kg/s) - calorific power (kJ/(kg.°C) - temperature of available flow and temperature that it needs to reach in the
process (°C) - latent heat for phase-changing flows (kJ/kg)
3.2.3 Results
3.2.3.1 Composite curve (CC)
Building the composite curves (Figure 3-1) enables the identification of the pinch point along with a technical and economic optimisation of the potential for heat recovery via exchangers. By shifting the cold flow curve to the left or to the right, the temperature gap between the two curves (and therefore the pinch) decreases or increases respec-tively, which reflects that heating or cooling energy requirements decrease or increase respectively. Consequently, the energy consumption, i.e. operating costs (opex) of the facility, is proportional to the pinch. Conversely, the exchange surface area of the ex-changers, i.e. capital spending costs (capex), is inversely proportional to the pinch.
Thus, depending on the selected criteria, the proposed solutions may differ.

Task 2: Modeling calculation and economic models
French Team Report - State of the Art Review on Analytical Tools based on the Pinch Method
3-183
Figure 3-1: Composite curves2
3.2.3.2 Grand Composite Curve (GCC)
Instead of superimposing the two composite curves, it is possible to plot, for each tem-perature interval, the enthalpic balance, net of the interval, which provides the “grand composite curve” or GCC representing the gap between the hold and cold fluids (Figure 3-2).
The GCC is used primarily to optimise the utilities. Such optimisation is applied when several temperature levels are possible for the heating or cooling energy inputs into the process. Thus, the GCC enables an identification of opportunities for positioning heat pumps.
Figure 3-2: Example of Grand Composite Curve3
2 Erik WALLIN & Thore BERNTSSON, Integration of heat pumps in industrial processes, Heat Recovery Sys-
tems & CHP, vol 14, No 3, pp. 287-296, 1994

Task 2: Modeling calculation and economic models
French Team Report - State of the Art Review on Analytical Tools based on the Pinch Method
3-184
3.2.3.3 Positioning of heat pumps
Based on the pinch method, and via the data supplied by the grand composite curve, it is thus possible to optimise the positioning of utilities, and heat pumps in particular. A heat pump should be positioned through the pinch in such a way that the heat source is located below the pinch and the sink above the pinch. The presence of a pinch automat-ically implies the thermodynamic feasibility of a heat pump; and based on a reading of the grand composite curve, the theoretical COP of the system can be evaluated (via the condensation and evaporation temperatures). The technical and economic feasibility is however not automatic, and some tools incorporate these parameters into their calcula-tions.
3.2.4 Benefits and drawbacks
The pinch analysis presents a number of benefits useful to enhance the energy efficiency of industrial processes.
- It provides an overall view of the industrial site under study, by optimising the re-covery of often-lost energy and thus minimising energy losses in non-cooled hot flows.
- It helps adapt the utilities energy consumptions to the process requirements, unlike traditional methods which primarily address the utilities by segregating them from the manufacturing process.
- It relies on a simple graphic representation that enables the energy consumptions to be visualised and helps both the energy expert and the industrial manager to view the potential gains and the actual gains achieved in the study, thereby delivering ob-jective analytical data.
The method however also presents a few limitations, among which the following, most frequently reported drawbacks:
- Loss of geographic information: the layout of (hot and cold) flows in the industrial site may dictate some constraints to their integration. For instance, some flows identified on the utilities side may be very remote from the production shop, which requires a very long exchanger network, thereby generating potentially non-negligible losses, or even losses higher than the energy gains identified via the pinch method. In order to remedy this problem, specific requirements (or prohibitions) should be applied when pairing some streams.
- Temporal disparity of the flow: this would be the case for instance with irregular power demands on the flows (hot and cold). This problem is frequently encountered for batch processes where energy streams are not available simultaneously and re-quire heat storage systems to be installed. Although in some cases this difficulty may be overcome by reorganising the work schedule, this solution is however not always easy to implement for industrial managers.
3 Erik WALLIN & Thore BERNTSSON, Integration of heat pumps in industrial processes, Heat
Recovery Systems & CHP, vol 14, No 3, pp. 287-296, 1994
Task 2: Modeling calculation and economic models
French Team Report - State of the Art Review on Analytical Tools based on the Pinch Method
3-185
- Technological difficulties linked to the process: such difficulties may be encountered in the food industry for instance where health security and bacteriological require-ments are substantial. Exchanges between the various energy streams are then dif-ficult to achieve with simple heat exchangers only.
- Lastly, the technical constraints may be compounded by economic constraints. In compliance with the IPPC (Integrated Pollution Prevention and Control) Directive, the application of process energy integration methods may prove very costly, due primarily to the substantial amount of data to be collected.
3.3 Stakeholders
A number of private companies offer off-the-shelf software programs, but research la-boratories are also very actively involved in developing such tools for research purposes.
3.3.1 ACADEMIC RESEARCH LABORATORIES
3.3.1.1 University of Manchester (UK)
Presentation of research laboratory:
The University of Manchester (UMIST) and more specifically the Centre for Process Inte-gration (CPI), is positioned as a benchmark in the field of process energy integration. Professor Bodo Linnhoff, creator of the Pinch Analysis, had developed his method within this university.
UMIST proposes several tools focussed on energy integration distributed via the Process Integration Research Consortium (PIRC). The consortium is a partnership between the University of Manchester (UMIST, School of Chemical Engineering & Analytical Science), industries (primarily from the oil industry, e.g. BP, Total, etc.) and other academic insti-tutions.
PIRC operates on the basis of annual memberships granting access to the tools devel-oped and to training sessions and exchange workshops.
UMIST has developed two software tools linked to the pinch method:
o SPRINT (focused on optimizing the heat exchanger network) – a detailed description is provided on page 3-44.
o STAR (focused on optimizing the utilities system of complex processes, such as pet-rochemical) – its major functionalities are described on page 3-44.
3.3.1.2 EPFL (Switzerland)
Presentation of the research laboratory:
EPFL or Ecole Polytechnique Fédérale de Lausanne is one of the prime engineering schools in Switzerland based in Lausanne. EPFL is the co-founder of the European Center Laboratories for Energy Efficiency Research (ECLEER), jointly with EDF and the Ecole des Mines de Paris engineering school.
Within EPFL, the Laboratoire d'Energétique Industrielle (LENI, or Laboratory of Industry Energy Engineering) headed by Professor Daniel Favrat, is an internationally recognized

Task 2: Modeling calculation and economic models
French Team Report - State of the Art Review on Analytical Tools based on the Pinch Method
3-186
benchmark in the field of energy conversion systems (heat pumps, organic Rankine cy-cles, fuel cells) and of energy integration of heating systems; this latter research topic is headed by François Maréchal based on several methods, and the pinch method in par-ticular, along with other environmental assessment methods such as LCA (life cycle analysis).
Following the retirement of Professor Favrat in the summer 2013, the LENI research teams have been reorganised. Activities related to energy integration are nevertheless continuing in a research group under the leadership of François Maréchal.
The LENI lab has developed three tools based on the pinch method:
OSMOSE: presented on page 3-192 of this review.
Pinchlight: web interface with the “basic” functionalities of OSMOSE, presented on page 3-191.
PinchLENI: this tool was adapted and converted by the Hochschule Luzern to de-sign the PinCH software; see presentation of the Hochschule Luzern for more details on page 8.
3.3.1.3 Mines Paristech (France)
Presentation of the research laboratory:
The Ecole Nationale Supérieure des Mines de Paris (Mines Paristech) is one of the most prestigious French engineering schools. Its CES (Centre d’Eco-efficacité des Systèmes) or Centre for Systems Eco-Efficiency, formerly CEP (Centre Energétique et Procédés), is a research laboratory dedicated to energy engineering, both on the generation and the consumption sides.
The CES has developed two tools based on the pinch method:
- CERES platform, presented on page 3-194. - Thermoptim, presented on page 3-193.
3.3.1.4 Chalmers University of Technology (Sweden)
Presentation of research laboratory:
Chalmers University of Technology is one of the most renowned universities in Sweden.
The university has outsourced its corporate services via the engineering consulting firm CIT (or Chalmers Industriteknik) consisting of five subsidiaries, including in particular CIT Industriell Energi with expertise in the field of industrial process energy integration.
This subsidiary has developed and uses a tool called Pro_Pi presented on page 3-196.
3.3.1.5 Hochschule Luzern / Lucerne University of Applied Science & Arts (Switzer-land)
Presentation of research laboratory:
The University of Lucerne is a recently founded Swiss university (1997). Among its facul-ties, the School of Engineering & Architecture is involved in developing the "PinCH" tool designed for applications of the pinch method and supported by Office Fédéral de l’Energie (OFEN).

Task 2: Modeling calculation and economic models
French Team Report - State of the Art Review on Analytical Tools based on the Pinch Method
3-187
PinCH uses the PinchLENI tool as a starting point, an open-source software for pinch analysis designed by the LENI lab at EPFL in the 1990s. PinCH has however been largely upgraded since then and is now entirely different from PinchLENI.
The PinCH tool developed by this university is presented on page 3-197.
3.3.1.6 Universidad de Valladolid (Spain)
Presentation of research laboratory:
The department of Ingeniería Química y Tecnología del Medio Ambiente of the Universi-ty of Valladolid in Spain offers a curriculum in energy integration teaching the pinch method. However, this university does not seem to be recognized as a benchmark in the field.
The university has designed a tool called Hint, downloadable on line free of charge, pre-sented on page 3-199.
3.3.1.7 University of Aalto (Finland)
Presentation of research laboratory:
Formally named Helsinki University of Technology (TKK), the University of Aalto is con-ducting research on energy integration within its Department of Energy Technology.
Their research activities focus on energy integration in paper-making sites, in particular integrated sites (simultaneous production of pulp and paper). Apart from the pinch method, they also use other methods of process analysis.
The university is developing a tool to visualise heat exchanger networks, called HeVi. The specific feature of this tool is to combine the conventional representation of flows in a Grid Diagram with a representation in Sankey diagrams.
This tool does not use the pinch method strictly speaking since it does not provide for modelling the exchanger network, but merely its graphic representation (although this representation is of great interest in itself). However, the tool version available on their web site dates back to 2008 and the web page has not been updated since then. Its de-velopment appears to have been stopped and the tool has no explicit documentation.
3.3.1.8 University of Waikato (New Zealand)
Presentation of research laboratory:
The University of Waikato in New Zealand has a dedicated laboratory called Industrial Energy Efficiency Division looking at the pinch method and the integration of discontin-uous processes. The research work is carried out in close partnership with industries (dairy industry in particular) and involves both lab-scale and field-scale experimental trials.
The lab researchers publish frequent articles at the PRES conference (Conference on Process Integration, Modelling and Optimisation for Energy Saving and Pollution Reduc-tion).
In the context of research on the pinch method, the University of Waikato has devel-oped an in-house application of the method; this tool has however not been released

Task 2: Modeling calculation and economic models
French Team Report - State of the Art Review on Analytical Tools based on the Pinch Method
3-188
outside the university and its functionalities remain unknown (only a few screenshots are available in some of their publications).
3.3.1.9 Instituto Superior Técnico (IST) of Lisbon (Portugal)
The Technical Institute of Lisbon includes a department called Integration and Optimisa-tion of Processes with teaching and research activities on the pinch method.
The IST is involved in the development of tools such as BatchHeat, or more recently FI2EPI on behalf of Ferramenta Informática para Integração Energética de Processos Industriais, developed in partnership with the Portuguese Energy Agency (ADENE). The tool exists only in a Portuguese version and we were unable to test it.
3.3.2 OTHER NON-ACADEMIC PLAYERS
3.3.2.1 AEE-Intec (Austria)
Presentation of research laboratory:
AEE – Institute for Sustainable Technologies (or AEE-Intec) is an independent Austrian research institute working in three main areas: solar heating, low-energy buildings and energy efficiency of industrial processes.
Their research focuses on energy integration of discontinuous processes (particularly in the brewery industry), size design of heat storage systems and integration of solar heat-ing in industries.
AEE Intec develops numerous auditing tools, most of which involve the pinch method for analysis; this is the case of Einstein, a process thermal auditing tool containing a pinch method application module. Einstein is presented on page 3-199.
3.3.2.2 KBC Advanced Technology (UK)
Presentation of the company:
KBC Advanced Technology, founded in 1979, is a consulting and engineering firm dedi-cated to industrial processes. KBC is specialised more specifically in the oil industry but covers all energy areas (refinery, petrochemical, power generation, biofuels, etc.).
In 2002, KBC acquired Linnhoff March Ltd., an independent engineering firm created in 1983 by Professor B. Linnhoff, the founder of the pinch analysis method.
Further to the acquisition of Linnhoff March Ltd, KBC inherited the sequel tools of SuperTarget, the benchmark for applications of the pinch method that follows the Linnhoff concept to the letter. This tool is presented on page 3-202.
3.3.2.3 Aspentech (USA)
Presentation of the company:
Aspentech (abbreviated from Aspen Technology Inc.), a start-up created in 1981 at the Massachusetts Institute of Technology (MIT), has become a leader of software applica-tions dedicated to industrial process optimisation (particularly in the chemical and pet-rochemical industries) and offers an extensive range of applications covering all sectors

Task 2: Modeling calculation and economic models
French Team Report - State of the Art Review on Analytical Tools based on the Pinch Method
3-189
and all issues (modelling, simulation, logistics, equipment design, etc.). Their solutions address primarily the petrochemical, fine chemistry and pharmaceutical industries, but over time they tend to extend to other industrial sectors as well.
Aspentech offers an extensive range of software programs combined in the AspenONE V8 software suite, split into five categories:
o Engineering o Petroleum Supply Chain o Supply Chain Management o Advanced Process Control o Manufacturing Execution System.
The AspenEnergyAnalyzer tool (formerly known as Aspen HX-Net) fits in the first of the above software categories. This tool is presented on page 3-203.
3.3.2.4 Canmet ENERGIE (Canada)
Presentation of research laboratory:
Canmet ENERGIE is a laboratory affiliated to the Canadian Ministry of Natural Resources, specialised in technology development and research on clean energies. Its staff includes over 450 scientists, engineers and technicians.
The lab works in all fields related to energy – renewable energy sources, fossil fuels, energy consumption in buildings, etc. – in close collaboration with the industrial sphere. It includes among other a department dedicated to process energy integration.
In the field of process integration, Canmet ENERGIE has developed an Integration tool for applications of the pinch method as well as energy modelling and analysis of utilities (boilers, cooling units, air compressors, etc.).
3.3.2.5 ProSim (France)
Presentation of the company:
ProSim is a leader in the field of chemical engineering software, providing process simu-lation software programs and design & engineering services in the following industries: oil and gas, chemistry, pharmaceuticals, energy and other process industries.
The company was created in 1989, backed by a flowsheeting tool developed at Ensiacet in Toulouse (formerly called ENSIGC).
ProSim offers several software programs, among which ProSimPlus (for process model-ling and simulation) and Simulis Thermodynamics (to calculate the properties of fluids and fluid mixes).
In 2010, this tool was limited to plotting composite curves, while ProSim’s short-term goal was to develop a library of utilities models along with an algorithm for optimising exchanger networks. ProSim is currently developing a tool designed for energy integra-tion, in partnership with Veolia under an ANR project (COOPERE). Their approach ap-pears to be oriented to energy analysis, although they use the pinch method for basic analysis.

Task 2: Modeling calculation and economic models
French Team Report - State of the Art Review on Analytical Tools based on the Pinch Method
3-190
3.4 Tools
3.4.1 STAR and SPRINT
Star and Sprint are very similar and complementary tools, but used independently of each other. Figure 3-3 below shows their respective interfaces.
Figure 3-3: Comparison of interfaces in Star and Sprint
They share the basic functionalities of the pinch analysis, such as optimisation of ΔTmin, or graphic representation of composite curves and grand composite curves (“Target” menu of the interface on Figure 3-3). The curves are calculated from the chart of process flows presented in Figure 3-4) below, and their data can be exported from one tool to the other.
Figure 3-4: Chart of process flows in Star and Sprint
Beyond this, their functionalities differ: - Sprint is designed for simulating and optimising the exchanger network between
the process flows or between the process and the utilities.

Task 2: Modeling calculation and economic models
French Team Report - State of the Art Review on Analytical Tools based on the Pinch Method
3-191
- Star is designed for selecting the utilities most suitable for the process (boilers, cooling units, etc.), and conducting the analysis on a site-wide scale (design of steam network and CHP systems if any).
Both tools were developed more specifically for the oil and chemical industries, and do not include the integration of heat pumps among their functionalities.
3.4.2 Pinchlight
Pinchlight is a web interface designed to carry out a pinch analysis using a remote serv-er. This server communicates with a multifunctional optimisation platform called Os-mose which applies the pinch method to the user’s data.
Figure 3-5 below shows the Pinchlight interface.
Figure 3-5: Pinchlight interface
There are 5 levels of data to be entered:
1) “General” tab to enter the general data of the analysis, e.g. cost of ex-changers, of commercial energy supply, climate conditions, etc.
2) “Resources” tab to enter data on commercial energy consumptions (fuels, water).
3) “Energy Distributions” tab to list the process energy demands, e.g. steam, hot water, cooling water, etc. You can for instance define the heat requirement even if the details of the consuming process are miss-ing.
4) “Process” tab to define the hot and cold flows of the process. A data-base of predefined modules facilitates the definition of flows, as shown in Figure 3-6, with the example of a pasteurisation process.
5) “Utilities” tab to list the utilities existing on the site (boiler, cooling unit, compressed air...) and their performance levels. Similarly to the Process tab, predefined modules can be used to facilitate data entry (single-stage cooling cycle, CHP with combustion turbine, etc.).
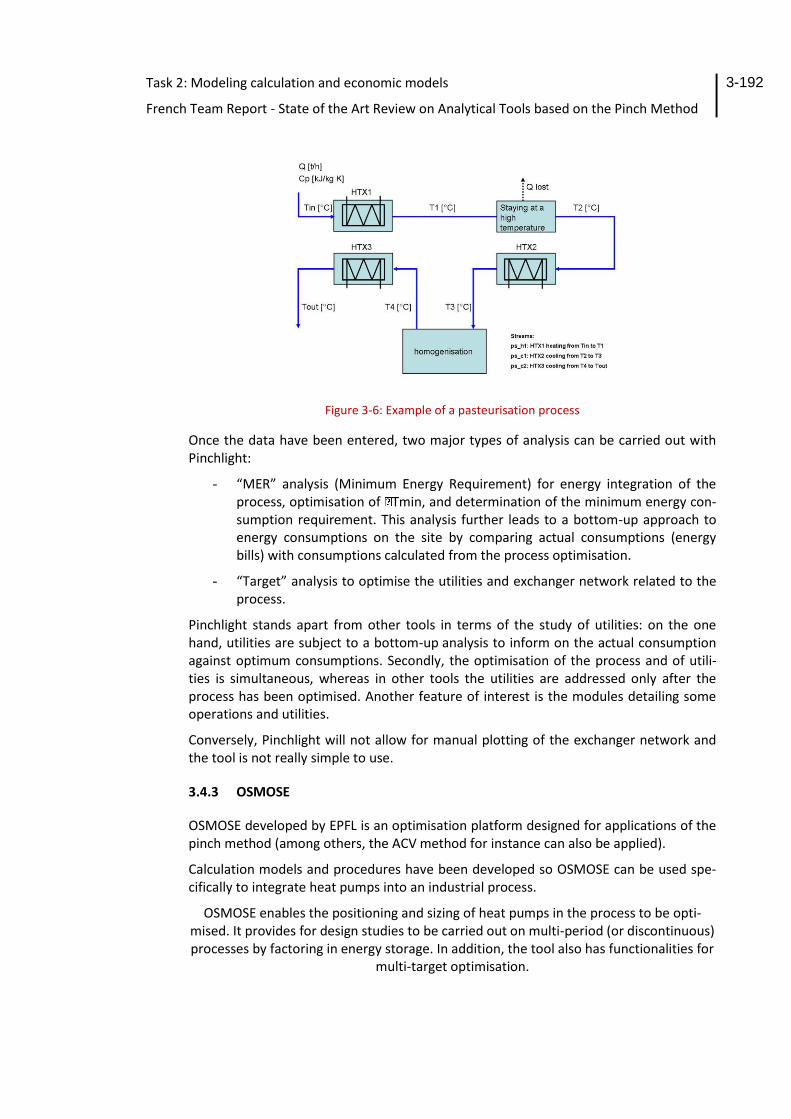
Task 2: Modeling calculation and economic models
French Team Report - State of the Art Review on Analytical Tools based on the Pinch Method
3-192
Figure 3-6: Example of a pasteurisation process
Once the data have been entered, two major types of analysis can be carried out with Pinchlight:
- “MER” analysis (Minimum Energy Requirement) for energy integration of the process, optimisation of Tmin, and determination of the minimum energy con-sumption requirement. This analysis further leads to a bottom-up approach to energy consumptions on the site by comparing actual consumptions (energy bills) with consumptions calculated from the process optimisation.
- “Target” analysis to optimise the utilities and exchanger network related to the process.
Pinchlight stands apart from other tools in terms of the study of utilities: on the one hand, utilities are subject to a bottom-up analysis to inform on the actual consumption against optimum consumptions. Secondly, the optimisation of the process and of utili-ties is simultaneous, whereas in other tools the utilities are addressed only after the process has been optimised. Another feature of interest is the modules detailing some operations and utilities.
Conversely, Pinchlight will not allow for manual plotting of the exchanger network and the tool is not really simple to use.
3.4.3 OSMOSE
OSMOSE developed by EPFL is an optimisation platform designed for applications of the pinch method (among others, the ACV method for instance can also be applied).
Calculation models and procedures have been developed so OSMOSE can be used spe-cifically to integrate heat pumps into an industrial process.
OSMOSE enables the positioning and sizing of heat pumps in the process to be opti-mised. It provides for design studies to be carried out on multi-period (or discontinuous) processes by factoring in energy storage. In addition, the tool also has functionalities for
multi-target optimisation.

Task 2: Modeling calculation and economic models
French Team Report - State of the Art Review on Analytical Tools based on the Pinch Method
3-193
Figure 3-7: OSMOSE operating workflow
The OSMOSE platform enables discontinuous processes to be factored in and, via the multi-target optimisation function, determines the powers and temperature levels of the heat pumps to be integrated into the process. This is a highly efficient tool offering functionalities that do not exist in any other available tools.
OSMOSE however has several flaws that mitigate its qualities. Firstly, this is an optimisa-tion platform, rather than a tool based on the pinch method; consequently, the tool is not user-friendly and learning to use it requires lengthy and complex training. In addi-tion, it is based on many proprietary software applications (MATLAB, Belsim VALI…) whose user licensing costs are expensive.
3.4.4 Thermoptim
Thermoptim is a software package developed for the design and simulation of thermo-dynamic systems, in particular energy conversion processes. It consists of a dia-gram/flowchart editor and a simulation engine.
It provides for both an analytical and systemic approach:
- Each functional component is represented by an appropriate Thermoptim “primitive type” (vessel, process point, conversion, node, exchanger...) having its own modifiable characteristics and coupling variables.
- The full system is then modelled by assembling these primitive types via an in-teractive visual interface (Figure 3-8).
Once the various conversions are represented, the pinch method can be applied to the modelled system and the tool guides the user in building the exchanger network.
The primary goal of this tool is educational, hence its use is somewhat unwieldy. In addi-tion, it is primarily suitable for energy generation systems (gas cycle turbines, Rankine cycle, etc.): while this may be overcome by building libraries of customised physical and chemical properties, it however becomes very time-consuming.

Task 2: Modeling calculation and economic models
French Team Report - State of the Art Review on Analytical Tools based on the Pinch Method
3-194
Figure 3-8: Example of modelling of a milk pasteurisation/skimming process
3.4.5 CERES
CERES is developed in the context of the ANR [French National Research Agency] project entitled “Chemins Energétiques pour la Récupération d’Energie dans les Systèmes indus-triels” involving eleven academic and industrial partners under the leadership of EDF. Its purpose is to identify strategies for the recovery and reuse of waste heat in industrial processes, and to foster the reach of innovative technologies contributing to rational energy uses.
It consists of:
- a platform designed to conduct energy integration studies, - a library of models of industrial processes and utilities developed in Modelica
language under a Dymola environment.
Note: The models library is currently developed under the Dymola environment which is a proprietary software (owned by Dassault Systems). CERES can however also operate with models developed under the free open-source OpenModelica environment.
CERES platform
The CERES platform enables pinch method-based studies to be carried out on energy integration. The method has been further enhanced with optimisation algorithms de-signed to select among a number of utilities (heat pumps, turbines, etc.) those that will minimise energy consumption, while factoring in the capex costs necessary to install heat exchangers, along with some environmental data.
Thus, for a given set of processes, the CERES platform allows for:
- determining the heat recovery potential and the minimum energy requirements, based on the pinch method (Figure 3-9),
- optimising the size design of utilities and exchanger network to be implement-ed, while minimising energy consumption and capex costs (Figure 3-10).

Task 2: Modeling calculation and economic models
French Team Report - State of the Art Review on Analytical Tools based on the Pinch Method
3-195
Figure 3-9: CERES platform – Composite curves and minimum energy requirement
Figure 3-10: CERES platform – Optimisation and construction of utilities and exchanger network
Models library
A library of utilities and process models is currently under development in the context of the project (example shown on Figure 3-11). Table 3-1 below lists the models already developed and integrated into the platform.
Table 3-1: List of process and utilities models developed in the CERES-2 project
Industrial processes Utilities
Modelica models
Agri-food industry: Milk processing Pulp & Paper: Production of pulp and paper Metals: Cold machining
Exchangers and storage Compression heat pump Sorption heat pump Thermoelectricity ORC

Task 2: Modeling calculation and economic models
French Team Report - State of the Art Review on Analytical Tools based on the Pinch Method
3-196
Figure 3-11: CERES library – Example of an absorption heat pump
This database of industrial processes and energy recovery and reuse technologies will be further enriched via updates and additions of new models by the users.
The CERES platform and the models library under Modelica will be available in open access once the project is completed, i.e. in mid-2014. The tool will then be free of charge with open access to everyone.
3.4.6 Pro_Pi
Pro_Pi is a tool dedicated to the pinch analysis and the construction of exchanger net-works. It is formatted as a simple Excel macro (file .xls) to which are added pinch-specific functionalities (framed in red on Figure 3-12 below).
Figure 3-12: Pro_Pi interface
It also includes an interface for plotting heat exchangers.
Pro_Pi is a light-weight educational tool, usable directly under Excel. It contains the ba-sics of pinch analysis and provides for manual plotting of an exchanger network. Model-ling of utilities is rather rudimentary (quantity of heat at a given temperature), and the interface is not very user-friendly.

Task 2: Modeling calculation and economic models
French Team Report - State of the Art Review on Analytical Tools based on the Pinch Method
3-197
3.4.7 PinCH
PinCH is a tool developed by the University of Lucerne in Switzerland with support from the Office Fédéral de l’Energie (OFEN).
It enables the pinch method to be applied to a process or a set of processes. For each stream identified, it is possible to set the operating time frame (Figure 3-13). A Gantt diagram can thus be plotted for the process and the time parameters of the various production steps can be factored in. Based on the pinch analysis, the composite curves can then be plotted based on the Time Average Method (TAM, Figure 3-14) or based on the Time Slice Method (TSM) to account for discontinuous processes. Lastly, the tool provides the possibility for building the exchanger network for each time slice (Figure 3-15).
Figure 3-13: Entering flow data into PinCH
Figure 3-14: TAM analysis in PinCH

Task 2: Modeling calculation and economic models
French Team Report - State of the Art Review on Analytical Tools based on the Pinch Method
3-198
Figure 3-15: Building the exchanger network in PinCH
This software program may be ordered via a dedicated web site for a charge. The price of a single-station license is 2700 Swiss francs, i.e. EUR 2250 (in November 2012). A 10% discount is offered starting at 2 licenses and up to 25% for 5 licenses and over. It seems possible also to get lower prices if the tool is intended for research or learning purposes.
The tested version is V1.0.8.1542. This is an evaluation version where the number of flows is limited to eight. Our evaluation has however enabled us to identify the main benefits and drawbacks of this tool.
Benefits:
- Possibility for a TAM and TSM analysis. - The exchanger cost functions can be easily parameterized. - The license price is relatively low. - Possibility of integrating heat pumps, MVC and motors with direct viewing on
the grand composite curve. - Parameters programmable for calculation of utilities costs. - Where the fluid used is water, the tool automatically factors in the phase
change and separates the stream accordingly.
Drawbacks:
- Non-intuitive ergonomics (subjective). - Necessity to create a hot and cold utility meeting the MER before launching the
analysis. - In practice, it is necessary to determine a flow beyond and below the maximum
and minimum temperature respectively, with enough power to meet the heat-ing or cooling requirement respectively.
- No help function (tips, default values, etc.) to position the utilities (heat pump, motor, MVC).
- No possibility of installing an ORC or a heating/cooling pump.
PinCH provides the possibility of factoring in the timing of processes, and ultimately the developers intend to integrate the multi-period function taking storage into account.

Task 2: Modeling calculation and economic models
French Team Report - State of the Art Review on Analytical Tools based on the Pinch Method
3-199
3.4.8 Hint
Hint – for Heat INTtegration – is an educational tool directed at students and dedicated to the pinch analysis and construction of exchanger networks. Figure 3-16 shows the interface. The tool was developed at the University of Valladolid in Spain.
Apart from the composite curves and grand composite curve, HINT enables the ex-changer network to be plotted and modified.
Figure 3-16: HINT interface
The HINT tool is downloadable on line free of charge. It includes the basic functionalities referring to the Linnhoff concepts, and constitutes a good resource to get familiar with the pinch method and start conducting simple studies, with a relatively easy to use in-terface. However, the development and related maintenance of this tool seem to have been stopped. In addition, the on-line help is very poor and a single article was pub-lished in 2008 in the journal Education for Chemical Engineers introducing the function-alities of the tool.
3.4.9 Einstein
Einstein means “Expert System for an Intelligent Supply of Thermal Energy in Industry and other Large-Scale Applications”.
Einstein is primarily a tool designed for thermal audits of industrial processes offering among other functionalities an application of the pinch analysis and design of exchanger networks.
The tool is the outcome of two consecutive projects funded by the program “Intelligent Energy Europe”:
- Einstein I (September 2007 - August 2009) - Einstein II (July 2010 - June 2012)
Einstein provides for a methodology applied to thermal audits of processes, comprising the following steps:

Task 2: Modeling calculation and economic models
French Team Report - State of the Art Review on Analytical Tools based on the Pinch Method
3-200
- Data acquisition and process modelling: all processes must be modelled ac-cording to a generic standard model (ref. Figure 3-17) including temperature rise, steady state and cooling with possible counter-flow exchange with the in-flow.
- Validation of data consistency (consistency check). - Reduction of energy demand via process optimisation. - Heat recovery via exchangers: this is the step that uses the pinch method
(ref. Figure 3-18). Einstein plots the composite curves, the grand composite curve, and offers a choice between manual or automatic design of the ex-changer network.
- Integration of new utilities and/or renewable energy sources, in particular: o solar heating o heat pumps o CHP o high-efficiency boilers
It should be noted that the pinch method is involved only when designing the exchanger network, and not in the choice of utilities: the tool does not really allow for determining which utilities or combinations thereof would be optimum; it only provides the possibil-ity for testing various energy supply scenarios and to compare them based on energy, economic or environmental criteria (ref. Figure 3-19).
Figure 3-17: Standard model of a process

Task 2: Modeling calculation and economic models
French Team Report - State of the Art Review on Analytical Tools based on the Pinch Method
3-201
Figure 3-18: Optimisation of heat recovery via direct exchange
Figure 3-19: Comparison of various scenarios depending on primary energy consumption (top graph) and environmental impacts - CO2, nuclear waste, water consumption (bottom
graph)
Task 2: Modeling calculation and economic models
French Team Report - State of the Art Review on Analytical Tools based on the Pinch Method
3-202
The software is downloadable in free access on the Internet. The most recent available version is the V2.2; however, we tested version 2.1.
Einstein was developed jointly by several partners, among whom the following were most closely involved:
- Energy Experts: a German/Spanish network of engineers and energy con-sultants.
- AEE Intec: an Austrian research centre on sustainable technologies, in par-ticular solar heating and process energy integration. AEE Intec supplied the optimisation algorithm used for automatic design of the exchanger network.
Benefits:
- This is an audit tool that is not limited only to a pinch analysis and also includes other functionalities of interest, in particular the overall consistency check.
- Manual and automatic design of the exchanger network can be easily combined. - The representation of the exchanger network in chart format is much more legi-
ble than a “grid diagram” representation. - All economic analyses can be customized, and it is also possible to add specific
pieces of equipment (e.g. heat pumps) in the database. - It is free of charge.
Drawbacks:
- Due to its numerous functionalities, the tool is relatively complex and requires some adaptation time.
- Hot and cold flows cannot be entered directly: the standard model must neces-sarily be followed in order to model a process operation, which is restrictive.
- No analysis can be launched until the “consistency check” is validated, but this can be time consuming since the tool is highly sensitive and errors are relatively difficult to decipher.
- The module designed for heat pump integration is not easy to use, and – at least in V2.1 – had some bugs.
- Since European funding has now expired, this raises the issue of the viability of the tool: i.e. who will fund developments, maintenance or training?
3.4.10 SuperTarget
SuperTarget claims to be the leading tool for industrial process energy integration and exchanger network design. Its advanced data processing functionalities provide for easy application of the pinch analysis. It is split into three specific modules:
- A “Process” module to carry out a pinch analysis on a process (direct exchange is allowed between all flows).
Among other, this module provides for thermal and economic optimisation of the mini-mum pinch (ΔTmin) and for the design of an exchange network. Its functionalities adjust to situations of new design and facility renovation, and its “case study manager” enables easy comparisons between several scenarios. Lastly, it is fitted with a simulator to test the sensitivity of the network in response to certain changes.

Task 2: Modeling calculation and economic models
French Team Report - State of the Art Review on Analytical Tools based on the Pinch Method
3-203
- A “Column” module to apply the pinch method to the optimisation of distillation columns.
- A “Site” module for energy integration on a site (indirect exchange between several processes via the utilities network).
This latter module provides the possibility of selecting the desired process data in the Process module. Several aggregation options may be selected, depending on whether exchanges are authorized between all flows in all processes, or only via the utilities net-work. In addition, this module enables an exergetic analysis to study the integration of energy generation systems (cogeneration).
It was not possible to test the Supertarget tool.
SuperTarget was developed by the founder of the pinch method and is regarded as a benchmark in the field. It is however still highly oriented to the chemical and petro-chemical industries, hence its functionalities are too sophisticated, particularly for de-signing the exchanger network. Similarly, the utilities are unsuitable, and in particular SuperTarget does not seem to offer any heat pump integration.
3.4.11 AspenEnergyAnalyzer
AspenEnergyAnalyzer belongs to the AspenONE software suite. It is designed for appli-cations of the pinch method in accordance with the rules defined by Linnhoff.
AspenEnergyAnalyzer provides for either manual or automatic design of the exchanger network: in the latter case, up to 5 different designs are possible, indicating that the tool most likely uses a heuristic or meta-heuristic resolution mode, and does not use any linear deterministic method.
In addition, it can differentiate between a new design and a retrofit of the exchanger network, where the purpose is to optimise only the new exchangers to be added to an existing network.
This tool proved to be very similar to SuperTarget in terms of sophisticated functionali-ties of optimisation and modification of the exchanger network.
3.5 Conclusions
Numerous pinch analysis tools exist for energy integration of a site, based on an analysis of composite curves and grand composite curves.
However, few among these tools enable a calculation of the economic and energy bene-fits of installing a heat pump. The user’s expertise is therefore required. Some tools evaluate the benefit of heat pumps and recommend their positioning and number based on energy and economic criteria.

Task 2: Modeling calculation and economic models
Dutch Team Report - Modeling in the Netherlands
4-204
4 Dutch Team Report - Modeling in the Netherlands
Between 1992 and 1996 the IEA HPP Annex 21 generated an overview of potential industrial heat pump applications and also developed an "Industrial Heat Pump Screening Program to determine how industrial heat pumps could be used in different applications [Geelen, 2013]. The computer program should assist potential users in assessing the opportunities to integrate industrial heat pumps (IHP) into different types of industrial processes. The program has also been designed to determine the economics of heat pumps, at least on a preliminary basis. The computer program has been developed based on pinch technology concepts. It aims to identify IHP opportunities that are consistent with fully optimized plant heat exchange systems to provide the most economic IHP designs and the lowest possible plant-wide energy consumption.
The screening program contains data on more than 100 industrial processes in five main industries: food, chemicals, petroleum refining, pulp and paper, and textiles. These data can be used directly, or modified by the user as needed, to assess site-specific IHP op-portunities. The computer program also contains data on more than 50 types of IHPs. Recent analyses by the Operating Agent of Annex 13/35 concluded that an update of the screening program is not advisable as since 1997 no further work has been done on the program and the software seems to be outdated. An analysis by the Operating Agent of existing software process optimization models shows that the difference between ‘pure’ pinch models and sophisticated mathematical optimization models has been bridged in modern software tools. Independent of any software tools, approaches and optimiza-tions, a general heat pump data base should come more into the focus. Such a data base is needed for many purposes. Typical information to the database are not only source and sink temperature as well as size of heat pump etc. but also further details of the selected hot and cold streams to which the heat pump is selected, because this would allow to select a specific heat pump type.
Several of these specific heat pump models and databases have become available in the Netherlands during the work on the Annex. In order to integrate a heat pump properly in an industrial process a good knowledge of the process is necessary. In this respect, pinch analysis is a very powerful tool. Although broadly introduced into the market in the nineties in Netherlands, the use of models for process integration (i.e. pinch) and general process optimization is still limited to a fairly small number of research groups and highly specialized groups within large companies.
4.1 Industrial heat process optimization
Many tools are available to optimize industrial processes where depending on the situa-tion there is no univocal answer to the question which tool is the best to use. It is im-portant to be aware of the fact that the costs for measures for energy conservation are often more expensive when they are further from the core of the process. Still it is amazing that under the past decade of Multi-Year Agreements in Netherlands often cogeneration was installed as energy conservation measure, which in the end has to do with the fact that interfering with the core of the process is often considered as ‘dan-gerous and risky’ and with the fact that the Multi-Year Agreements within the policy of

Task 2: Modeling calculation and economic models
Dutch Team Report - Modeling in the Netherlands
4-205
RVO 2014
Reaction
Separation
Heat Pumps
Utilities
Heat exchangers net
Waste heat
participating companies was a responsibility of the energy manager of the company, i.e. the utility manager, and not of the process manager.
Figure 4-1: Onion model for process approach
A systematic approach in improving the energy efficiency of industrial processes is the onion-model a translation of the TRIAS-Energetica where the pre-assumption is that one should first save on energy by optimising the process and then go into thinking about the way in which the energy is exchanged within the process and then generated at the outside of the process.
The model is explained for a chemical distillation process where in the first shell the processes occurring in reactors and separators (Process) are optimized. In practice this is done by an economic optimization in which energy and other operating cost are bal-anced with annualized investment cost for the equipment. In distillation “Process” refers to molecular improvements such as extractive distillation as well as optimization of in-ternals, trays and column compartments. Energy consumption can be reduced further by heat integration using heat exchangers (HEX). As heat exchangers need a driving force there is a limit to what can be achieved by heat integration. Optimization of the heat exchanger networks is done using pinch technology leading to the rule of thumb: “Do not transfer heat across the pinch temperature”. In addition the “grand composite curve” (enthalpy flow rate versus temperature) provides the minimum total cooling and heating power required for the plant. Now the temperature difference at the pinch temperature, ΔTpinch, is optimized by the economy: a higher value leads to smaller investment cost in heat exchanger area but also to increased utility cost. After heat inte-gration has been optimized, further reduction of energy consumption can be achieved in the third shell: the heat pump (HP).
Process integration, modeling and optimization problems in chemical engineering are generally complex tasks of a considerable scale and comprehensive interactions. The application of information technology (IT) and computer software tools is essential for providing fast and, as much as possible, accurate solutions with a user-friendly interface. General purpose optimization and modeling tools overviews have been available through the years. A number of computer-based systems have been developed to support process engineers in the energy and mass balance calculations. However, due to the substantial ongoing funding needed for the continuous development, only a limited

Task 2: Modeling calculation and economic models
Dutch Team Report - Modeling in the Netherlands
4-206
number have remained on the market. They have only been secured by a substantial number of continuous sales.
Figure 4-2: Technologies for process design in chemical industry (source TKI)
There have been a variety of efficient tools available. Each provider mainly stresses their advantages. Klemeš et all presented a comprehensive list of software tools that are available for the simulation of material and energy balances of chemical processing plants, which includes: (1) Aspen HYSYS (2) CHEMCAD; (3) GAMS; (4) gPROMS; (5) HEXTRAN; (6) OpenModelica; (7) PNS Solutions and S-Graph Studio; (8) PRO/II; (9) SPRINT STAR, WORK and WATER; (10) SuperTarget and (11) UniSim Design.
Computers have been changed substantially the practice of chemical engineering, allow-ing large advances in process modeling and simulation. The chemical engineering com-munity has generated a rich literature about rigorous unit operation models and effi-cient algorithms to solve them, employing rising computational resources. Several prob-lems, which in the past demanded a considerable occupation of engineering manpower, now can be solved by a single engineer in a fast and accurate way. Simultaneously, plant automation developments can provide a large amount of information about the process behavior in real time.
These two factors: the availability of plant data and the capacity to handle these using adequate models have opened a large field of improvements in process engineering. In a globalized world, characterized by an intensive business competition, these opportuni-ties assume a special importance.
4.2 Available tools
By [Grift, 2011]
Tools for complex industrial processes are developed to visualize and analyze heat flows in processes to support with software the consultant in their advice on process im-

Task 2: Modeling calculation and economic models
Dutch Team Report - Modeling in the Netherlands
4-207
provements. Many of the available tools are based on graphs, diagrams and figures to easy the process of design and/or communication between experts and client.
4.2.1 Consultancy tools
Under the now long running policy of Multi-Year Agreements between industrial sectors and the Ministry of Economic Affairs, companies are benchmarked on an Energy Effi-ciency Index and have to make an Energy Efficiency Plan (EEP), done by an external con-sultant, every three years. Based upon Environmental Legislation companies, which do not participate in the program of Multi-Year Agreements, have to invest in energy effi-ciency measures with pay back times shorter than 5 years.
In this approach for energy conservation in industry the Netherlands Enterprise Agency (and its predecessors) have developed and used tools to facilitate the consultancy and to increase the impact by translating difficult process decisions into clearly understand-able reports on management level. Some of these are:
o Energy screening o Energy Potential Scan o Procesintegration analyses and thermal audit (Einstein) o Renewable energy scan
Energy analyses
An Energy Analyses which is part of the EEP consists of an energy balance, proposed measures, costs and economy and a consultancy report for decisions and an Energy Effi-ciency Plan for three years.
In a good Energy Analyses the heat flows and waste heat flows are mapped, not only the chimneys but also the locations in the process where the products a cooled and heated. Important to notify is the location of cooling towers and or condensers in the process. These two technologies are easily detected.
Energy Potential Scan
Energy Potential Scan is a form of participative model. Unlike traditional energy audit approach, in EPS, company and energy consultants work together to see the possibility to conserve energy. This method has been developed by Philips in Eindhoven together with Novem. There are two keys in EPS, quality and acceptance.
Figure 4-3: Energy Potential Scan

Task 2: Modeling calculation and economic models
Dutch Team Report - Modeling in the Netherlands
4-208
A key word is acceptance which created by something different from traditional energy audit where in the phase of the Energy Efficiency Scan (after the process analyses) it involves brain storming, thinking about the ideas to improve efficiency, and possible application both financially and technically. This creates commitment from management and participation of key personnel of the company.
From this very structured approach a large number of ideas are listed and discussed. The options for energy conservation a preferably developed by the company itself in an En-ergy Efficiency Plan.
Processintegration analyses
In a Processintegration analyses approach all heat flows for a process are mapped. For simple processes with a maximum of 20 heat flows a simple spreadsheet and pinch visu-alization are sufficient to develop an arrow and block diagram to engineer a heat ex-changer network. For larger processes like in chemicals specialized software is needed to be able to optimize energy and economy at the same time. Based upon distances in the process between coordinates for heat, costs data and data for materials the software can propose a set of technical choices. Next to the right fit for heat exchangers the right fit for a heat pump can be calculated if the data for heat pumps are available to the pro-gram. This last boundary condition seems at this moment to be the largest problem for heat pumping technologies.
At European level it was noticed that a lot of software available for process integration analyses was not used for smaller processes as the software is often too complex or too expensive for small consultancies. Even worse is the fact that although Dutch Govern-ment thinks that process integration broadly introduced in the nineties is an accepted tool, this is not the case anymore for the larger part of industry, with exception of course for chemical industry.
In a European project a simple to use thermal audit has been developed under the name of “Einstein”. It is a freeware software tool with a report generator in Open Office.
Companies with relatively simple processes can be scanned in a few days on the poten-tial heat integration, the internal use of waste heat, heat pumps, cogeneration and re-newables like solar heat and bio-energy. The Einstein tool is still fully under develop-ment and needs as well as other software tools the right and objective information on heat pumping technologies.
Renewable Energy Scan
The Renewable Energy Scan has been developed by the Netherlands Enterprise Agency (and its predecessors) to make companies aware of the potential for applying renewable energy. This methodology is especially of interest for companies which do not have large process heat flows and can be found on many mixed industrial areas in the Netherlands.
4.2.2 Methods for Visualisation & analyse
For optimizing heat flows and to get process integration with heat exchangers and heat pumps in the first two levels of the onion the availability waste heat flows should be charted. If no data are available or if the design of the process is dated it is advised to execute when possible an extensive monitoring on the process over a certain period of

Task 2: Modeling calculation and economic models
Dutch Team Report - Modeling in the Netherlands
4-209
time, since it is the experience (often painful) that no process runs optimally according to the design.Several methods are available for visualization of (waste) heat flows.
o Sankey diagram o Arrows diagram o Block diagram o Pinch diagram o Grassmann diagram
Figure 4-4: Sankeydiagram
A Sankey diagram can give insight in the energy balance on parts of the process or the complete process. The width of the arrows is a measure of the capacity of the energy flow.
Figure 4-5: Arrows diagram
An Arrows diagram gives the heat flows at with the temperature levels. Together with the heat capacity of the flow in not too complex processes the right position for heat
elektriciteit
0,7 MW
recirculatielucht
2,0 MW
Sankey diagram
product uit
0,6 MW
afzuiging&
verliezen
0,7 MW
rookgas
8,0 MW
koellucht
0,9 MW
aardgas
9,5 MW
10 30 60 70 150 600 oC
100 kW
360 kW 540 kW
34 kW 51 kW 17 kW
1.143 kW 1714 kW 571 kW 4.571 kW
322 kW 483 kW 61 kW 1.288 kW 7.245 kW
afzuiging
molen
koellucht
product
afzuiging
elevator
schoorsteen
opwarming
drogerlucht
Pijlendiagram

Task 2: Modeling calculation and economic models
Dutch Team Report - Modeling in the Netherlands
4-210
exchangers can be proposed. The green arrows give the potential heat exchanger be-tween red (=hot) and cold (=blue) to be heated flows.
Figure 4-6: Block diagram
A block diagram is a tool to give the optimal lay out of a system of heat exchangers in a simple process. With this tool the capacity of heating and cooling can in theory be calcu-lated. The figures in the blocks give the amount of heat residue which is available in the given temperature segment. These segments have to be placed in order to make the exchange of heat possible. The flows to be heated (blue) have to have a lower tempera-ture than the waste heat flows (red). The block in the lowest temperature segment has to cooled by external energy. In this example only heat has to be supplied in the highest temperature segment.
Figure 4-7: Pinch diagram
A pinch diagram gives capacities and temperatures. The process data are ‘verwerkt’ into a hot and cold composite curve. The hot composite curve gives all the process streams to be cooled including waste heat and the cold composite curve gives the stream to be
10 30 60 90 120 150 oC
10 30 60 90 120 600 oC
Blokjesdiagram
1,636 1.982 1.248 1.231 -7.729
koeling
7.329
kW
aardgas
7.729
kW
1.231
5.693 3.710 2.462 1.231 0 kW
0
100
200
300
400
500
600
700
0 2.000 4.000 6.000 8.000 10.000 12.000 14.000 16.000 18.000
Tem
pera
tuu
rniv
eau
[o
C]
Vermogen [kW]
Pinch diagram
30 K
7.729 kW
1.770 kW
7.329 kW

Task 2: Modeling calculation and economic models
Dutch Team Report - Modeling in the Netherlands
4-211
heated. The art of engineering the process is to combine these streams in order to re-duce the final heating and cooling demand of the overall process. Where the curves are closest together, i.e. the smallest temperature difference, is the so called ‘pinch’ (insnoering). A heat pump is only functional if the heat pump crosses this pinch. In the given example in the diagram a theoretical minimum heat is required of 7,729 kW’s and cooling of 7,329 kW’s, while 1,770 kW’s of waste heat can be re-used in the process.
Figure 4-8: Heat exchanger Network
If the pinch temperature is known a heat exchanger plan can be engineered. For com-plex processes software is available to design this. For simple processes an arrows dia-gram can be configure the basic design of the network.
Figure 4-9: Grassman diagram
10 30 60 90 120 150 oC0 30 60 90 120 600 oC
warmtewisselaarnetwerk
C = 5,0 kW/K
C = 18,0 kW/K
C = 1,7 kW/K
C = 57,1 kW/K
C = 16,1 kW/K
322 kW
483 kW 483 kW 483 kW
7.729 kW
afzuiging
molen
koellucht
product
afzuiging
elevator
schoorsteen
opwarming
drogerlucht
aardgas na brander na molen schoorsteenna menging na droger
Grassmann diagram
recirculatielucht

Task 2: Modeling calculation and economic models
Dutch Team Report - Modeling in the Netherlands
4-212
A Grassman diagram gives the exergy flows in the process. The exergy of a heat flow is a standard for the quality (temperature level) of the energy flow and a benchmark for the amount of electricity which can be generated from the flow. This is often used to ana-lyze the optimal use of cogeneration.
4.3 Which tool fits best?
Many tools are available to optimize industrial processes where depending on the situa-tion there is no univocal answer to the question which tool is the best to use. Several approaches for process optimisation in industry can be met with based upon the onion model as in Figure 4-1. In order of ranking:
o Process optimisation o Process intigration o Optimisation of Utlities o Heat exchange with surrounding energy users
Figure 4-10: Flow diagram Improvement Process
Projects for reducing the energy use through process optimization go beyond the re-sponsibility of the energy or utility manager alone and often have to have additional profits than only energy, like a better product or a higher yield of the production. If the project only gives reduced energy costs, the profitability is often lower than competing investments. In these kinds of projects it is of importance to create support and trust with the decision making management first, before even considering starting the pro-ject. The first phase of the project will have to focus on process mapping a improve-ments of the process as it is.
From the core of the original process questions can be raised as:

Task 2: Modeling calculation and economic models
Dutch Team Report - Modeling in the Netherlands
4-213
o Are the setpoints optimally adjusted? o Is heat recovery already installed and optimal according to the pinch principles? o Can temperatures be used at lower levels? Often for the easiness of installation and
transport cheap steam systems are installed where only low grade heat is needed. o Can drying processes be used by mechanical drying? o Are heat flows mixed with degradation of heat?
Often the process (as mentioned earlier) does not run according to original design due to changes and small improvements over the years. (an interesting example is given in the factsheet on the Lips project with Doorgeest NL-18). Monitoring of the process can often already lead to large costs savings before even starting the more complex task of process integration. When it is assured that the process is optimized the task of process integration can start.
The flow diagram of the improvement process makes it clear that support and ac-ceptance starts at management level and if the challenge can be translated to the man-agement and board in clear and simple to understand messages the project can start. The next phase is to get participation at operational level. The Energy Potential Scan is an excellent methodology to get that result.
When the process have been basically optimized the potential for process integration can be analyzed. When not all data of the process are not already gathered in the first phase of the project, the task of data gathering must be undertaken. Monitoring of the process getting to know all mass balances, temperature levels, enthalpy levels seems to be a costly effort in time and money but will be worth every penny in the end result. The next step is to translate the data into energy-balance with costs attached (Sanky) and analyze the complexity of the process.
Figure 4-11: Flow diagram Integration Process
The question then raised is how many processes are suitable for process integration? In day to day practice often installers in medium sized industries are responsable for a part of the project. For cooling a refrigeration engineer is asked for. This misconception has

Task 2: Modeling calculation and economic models
Dutch Team Report - Modeling in the Netherlands
4-214
for a long time been dominant in industry. However there are of course still a lot of smaller industrial companies can be supported with a simple block or arrow diagram. The flow diagram makes this distinction between simple and complex processes. For more complex situations Pinch software is needed to bale to calculate and design the optimal process integration. As mentioned before process integration has been broadly introduced in the nineties as tool, however it is not broadly used anymore in the larger part of industry, with exception of course for chemical industry. Therefore RVO has started togethet with the Federation of Energy Consultants (FEDEC) a series of training courses with the pinch model of ‘Einstein’ (see paragraph 4.4). In more complex pro-cesses a specialized consultant with advanced software steps in.
When all rational heat exchangers within the first inner circles of the process are estab-lished, the question is to optimize the utilities and to find a use for the waste heat of the process. A heat pump can be used to upgrade the waste heat over the pinch a part of the heat demand of the process. With newly developed heat pump technologies the temperature rise can be larger than originally was the case. Other possible use can be steam expansion or absorption cooling, both for the heat and cold demand of the origi-nal process. Eventually an ORC can make electricity from the waste heat if the tempera-ture is at an acceptable level.
Figure 4-12: Utility Flow diagram
When there is still a constant and fair amount of heat needed for a larger part of the year cogeneration can be a serious option. However at the moment of writing the spark spread is negative, thus cogen will in almost all case be no economical option. Renewa-ble energy options are decided on at that level where the Renewable Energy Scan as has been developed by RVO can be used. Cogeneration can also be based upon bio-energy.

Task 2: Modeling calculation and economic models
Dutch Team Report - Modeling in the Netherlands
4-215
When still waste heat is available a survey can be done on possible users of heat in the neighboring area where it must be closely watched that heat is not transported over too long distances with too high temperatures and transported to a heat demand with a stable demand over the year, especially in summer periods when process cooling is at its most critical. The best exergetic option for waste heat is to generate electricity with an ORC. This can be put into the grid.
Figure 4-13: Flow diagram for area survey
4.4 EINSTEIN
The EINSTEIN methodology for thermal energy audit has been developed in the frame-work of the European (Intelligent Energy Europe - IEE).
In the follow up under EINSTEIN-II project aims to contribute to a widespread implemen-tation of integrated energy-efficient solutions for thermal energy supply in industrial companies with a high fraction of low and medium temperature heat demand and for non-industrial users of similar demand profiles, such as hospitals, commercial centres, large office buildings, district heating and cooling networks, etc. To further optimize thermal energy supply, a holistic integral approach is required that includes the possibili-ties of demand reduction by heat recovery and process integration, and by an intelligent combination of existing affordable heat (and cold) supply technologies, under the given economic constraints. The follow up builds on the EINSTEIN tool kit for thermal energy auditing. This tool kit, based on an expert system software tool, guides the user through the whole procedure from auditing (preparation of visit and data acquisition), to data processing, to the elaboration, design and quantitative (energetic and economic) evalua-tion of alternative solutions. The tool kit, together with complementary databases, has been developed as a free and open source software project available in all the IEE pro-ject partners' languages. It uses pinch analyses as the basis is open-source software and

Task 2: Modeling calculation and economic models
Dutch Team Report - Modeling in the Netherlands
4-216
provides the possibility for thermal energy efficiency improvements and the implemen-tation of renewable energy within industrial processes, in different industry sectors.
The Einstein website and information (www.einstein-energy.net) claim that the meth-odology and Software Tool has proven in Auditing Practice (72 energy audits) that:
o The EINSTEIN methodology and tool has been successfully consolidated within the project. It has been proven that it can be applied in a great variety of different appli-cations.
o The application of EINSTEIN compared to conventional auditing is a big help for the auditor for organizing information in a systematic and structured way and in carry-ing out fast feasibility analysis for a large number of possible alternative
Large Potential for Energy Efficiency An average primary energy saving potential of close to 20 %, and in some companies up to more than 60 % has been detected even under the constraint that has been applied in most audits that pay-back times should not be higher than 4 years (although this limit varied from company to company from below 2 year up to 8 years in some specific cases). If the primary energy consumption for ther-mal uses only is used as a reference (without electricity for lighting,
By many companies there was a positive take-up of the proposals presented (at the end of the project out of 72 companies 20 had initiated some further detail planning steps and out of them 5 already had implemented (some of) the proposed measures. The development and presentation of an attractive proposal to the company was in many other cases in-sufficient for triggering action towards a further development of detail technical issues with the objective of a real implementation of the measures.
Einstein Approach in Netherlands
In the Netherlands as in Europe it is noticable that although process integration based upon pinch analyses was broadly introduced in the nineties and should be an accepted tool, that this is not the case anymore for the larger part of industry, with exception for chemical industry. Consultants as well as energy managers within companies should therefore be trained and educated in process analyses based upon the approach de-scribed in paragraph 4.3 starting with an Energy Potential Scan and further worked out as described in the flow diagrams in Fig. 4-11.
Dependent on the complexity of the process a tool like Einstein is used or more complex tools. RVO has ordered Energy Matters after their study on which tools to use [Grift, 2011] to develop a training program together with FEDEC (Federation of Energy Con-sultants in Industry) based upon Einstein. The focus is to improve the availability of skilled energy auditors and energy managers and the diffusion of energy management systems and best practices. A next step will be to develop instruments to ensure availa-bility of updated, comprehensive and usable information on energy efficiency relevant for industries. Heat pumps are one of the key technologies in this approach with models developed and described under the next paragraph.
During the process of training with Einstein bugs and small problems were discovered and are now discussed with the developers of the Einstein tool kit.

Task 2: Modeling calculation and economic models
Dutch Team Report - Modeling in the Netherlands
4-217
4.5 Process tools and heat pumping technology
Most of the tools discussed are focusing on heat integration and with these tools the right position and choice for a heat pump can be made. In general experienced process designers working with pinch software can easily see from the grand composite curves where heat pumps can be applied, also from the ‘nose’ of the curve they in general know which type of heat pump. The main problem is that it is difficult to select the right size and brand of heat pump as there is scarce information that can be directly used. A lot of information can be found on the Internet but a consultant (often highly paid) doesn’t have the time available to sort out this information.
Independent of any software tools, approaches and optimizations, a general heat pump data base should come more into the focus. Such a data base is needed for many pur-poses. Typical information to the database are not only source and sink temperature as well as size of heat pump etc. but also further details of the selected hot and cold streams to which the heat pump is selected, because this would allow to select a specific heat pump type.
For a heat pump to be effective there are a number issues to be considered:
o The pinch temperature and the flexibility of the plant o The thermodynamic cycle and the heat pump efficiency o The temperature lift required o The enthalpy balance o The selection and constraints of heat pump equipment o The configuration of the system o The available utilities o The economy or the annualized capital cost versus the utility cost
As the target group for heat pumps is a large variety of industrial sectors several heat pump selection models have been developed and are becoming available. Three of these are discussed in the next paragraphs.
4.5.1 Mastering Heat Pumps Selection for Energy Efficient Distillation4
By [Kiss, 2012]
An overview on application criteria for practical systems is given in [Landolina, 2012].
Distillation still remains the most popular separation technology, in spite of claiming about 40 % of the operational costs from chemical and refining plants. Distillation has a relative low thermodynamic efficiency, requiring the input of high quality energy in the reboiler to perform the separation task. At the same time, a similar amount of heat at lower temperature is rejected in the condenser. Several heat pump concepts have been proposed to upgrade that discharged energy and reduce the consumption of valuable utilities. For example, vapor compression (VC) uses work to increase the temperature of
4 Kiss, Flores Landaetaa, Infante Ferreirac (Mastering Heat Pumps Selection for Energy Efficient Distillation)

Task 2: Modeling calculation and economic models
Dutch Team Report - Modeling in the Netherlands
4-218
a fluid heat transfer media in a closed loop. Mechanical or thermal vapor recompression (MVR or TVR) use the top product as working fluid in an open cycle, reducing further the investment costs. Similarly, the structure of an internally heat integrated distillation column (HIDiC) lowers the required temperature lift, reducing the compressor work. Meanwhile compression-resorption heat pumps (CRHP) use absorption processes to enhance the heat transfer, allowing higher efficiency and wider applicability range. Av-erage energy savings when using any of the heat pump systems in distillation range from 20 to 50%.
Figure 4-14: Structure
However, the energy efficient systems described in literature were evaluated for differ-ent separation tasks. Thus, their performance comparison is difficult, complicating the technology selection for other applications. To solve this problem, we developed a prac-tical selection scheme of energy efficient distillation technologies, with a special focus on heat pumps.
Only the most promising technologies in terms of actual implementation were selected for this study: vapor compression, mechanical or thermal vapor recompression, com-pression-resorption and thermo-acoustic (TAHP) heat pumps, heat integrated distillation column (HIDiC), cyclic distillation (CyDist), dividing-wall column (DWC) and Kaibel distilla-tion column. The selection criteria include the type of separation tasks, the products flow and purity specifications, the boiling point differences (ΔTb), the reboiler duty (Qreb) and its temperature level (Treb).

Task 2: Modeling calculation and economic models
Dutch Team Report - Modeling in the Netherlands
4-219
Figure 4-15:
The straight-forward selection scheme presented in this work allows the quick selection of the most suitable technology for any distillation task. Thus, the application of the proposed scheme allows considerable savings in time and resources allocated for the selection of eco-efficient separation technologies. The ultimate goal of this work is to facilitate significantly the design of energy efficient chemical processes, thus becoming a valuable tool for enhancing the sustainability of the chemical industry.
4.5.2 Heat pump models
A more general model that can be used has been developed under the Task 2 of the Annex by KWA for RVO. The challenges arose during the meetings on Annex 35 with the Dutch market consisting of consultants and institutes. The main consultants for process industries advised not to focus on process integration tools but to develop a model that could be used as an add-on to existing tools. Integrating this basic heat pump model into software models would make this model dependent on the tools. No specific new pro-cess analyses tool was deemed necessary.
The heat pump model based upon Excel would idealy be available on the Internet and could further be developed as a WIKI-approach where the market itself would fill in fur-ther details in the model and in the end applications could be hinged as factsheets to the model. This stage of development is not reached yet during the process of the An-nex.
In a step by step approach the user is lead through the process filling in data from his own process.

Task 2: Modeling calculation and economic models
Dutch Team Report - Modeling in the Netherlands
4-220
o Find source heat with a high as possible temperature, below the pinch-temperature in the process. Determine the amount of heat available with corresponding temper-ature. Find out what will be the impact on the process and the existing heat integra-tion. Determine whether it is possible to adapt the process to increase the amount and/or temperature of the source heat.
o Find process heat with a low as possible temperature but higher than the pinch-temperature. Determine the amount of process heat and temperature required.
o Determine which type of heat pump fits the process conditions that are investigated in step 1 and step 2. Heat source and heat sink temperature, power and type of pro-cess medium should be considered.
o To determine the feasibility of a heat pump, the performance of the heat pump at given process conditions should be calculated.
o When the performance of the heat pump is calculated, an indicative calculation of energy and cost savings can be performed.
Figure 4-16: RVO - Heat pump model selection screen
Figure 4-17: Quickscan analysis
Introduction
High temperature compression heat pump
Compression-resorption heat pump
Thermo acoustic heat pump (electric)
Thermo acoustic heat pump (fuel)
Content of the tool
Click to start from begin
Content of the tool Click to directly navigate to:
General description of working principle of heat pumps
Roadmap for application of industrial heat pumps
Types of industrial heat pumps (novel & existing technologies)
Quick scan to determine techno-economic feasibility
Background information and suppliers & additional calc. sheets
Thermal vapour recompression
Closed
Closed
Type
Novel
Mechanical vapour recompression
Hybrid heat pump (ECN)
Status
Novel
Existing
Novel/existing
Novel
High temperature heat pumps - Information & Calculation tool
This tool is developed by KWA Bedrijfsadviseurs B.V., commissioned by AgentschapNL. It contains information and calculation tools to determine the technical possibilities and
economical benefits of applying high temperature heat pumps in industrial processes. The following heat pumps are addressed:
System
This tool can be used by engineers, consultants or others that are interested in the possibilities and yields of upgrading residual heat. It gives first insights in the technical
possibilities of different types of high temperature heat pumps, and in the energetic and economic savings that can be achieved.
Open
Existing
Existing
Existing
Open
Closed
Closed
Closed
ClosedAbsorption heat pump
HEAT PUMP PRINCIPLE
ROADMAP FOR APPLICATION
QUICK SCAN
INFORMATION & SUPPLIERS
START
TYPES OF HEAT PUMPS
1. Inputs to determine applicability of heat pump Input field
Output field
1 Is the system open or closed?
2 Which temperature is required for the heat sink ˚C For mechanical vapour recompression:
3 What is the temperature of the medium leaving the heat sink? ˚C 9 What is the inlet steam pressure? Bar ˚C
4 What is the source temperature ˚C 10 Which pressure is required in the process? Bar ˚C
5 The source heat will be cooled down to: ˚C 11 Net temperature lift of MVR ˚C
6 The temperature differences at the heat exchanger outlet K For thermal vapour recompression:
7 Net temperature lift of the heat pump K 12 What is the motive steam pressure? Bar ˚C
˚C ˚C 13 What is the suction steam pressure? Bar ˚C
∆Tdf 5 K 14 What is the discharge pressure? Bar ˚C
15 Net temperature lift of TVR ˚C
16 Suction flow (see calculation motive steam) kg/hr
˚C ˚C 17 Motive steam consumption (see calculation motive steam) kg/hr
120
80
Open
70
Answer question 9-17
'Closed system'
60
100
5
-
-
1 99,6
2 120,2
120
10060
OPEN SYSTEM
Quickscan analysis to determine applicable heat pump
20,6
-
-
80
Click here to calculate motive steam consumption
Eva
po
rato
r
Co
nd
en
ser
Heat sinkHeat source
Pelectric/heat
HOME

Task 2: Modeling calculation and economic models
Dutch Team Report - Modeling in the Netherlands
4-221
The further development of this model will be taken up in 2014 – 2015 under a new Task 2.
4.5.3 Heat Pump Check
The Heat Pump Check is another on-line calculation tool which is developed by De Kleijn Energy Consultants & Engineers from Druten (www.industrialheatpumps.nl). The tool can help industrial companies to determine the feasibility of heat pumps for their pro-cesses. it gives a global indication of the applicability and feasibility of a heat pump. The result is a good starting point to determine if further investigation, for example by an external consultant, is useful.
Figure 4-18: report generated by Heat Pump Check
SUMMARY HEAT PUMP CHECK
Input
Waste heat source
Heat source : Refrigeration system
Purpose installation : Cooling+freezing
Refrigerant : Other
Condensation temperature : 30 °C
Cooling capacity : 1000 kW
Process
Process : Pasteuriser
Heated flow : Product
Temperature in : 50 °C
Temperature out : 70 °C
Heat demand : 1000 kW
Other data
Current heat source : Direct gas-fired
Generation efficiency : 85%
Running hours : 6000 hours/year
Simultaneity : 70%
Electricity costs : € 0.08 / kWh
Fuel costs : € 0.35 / Nm3
Selection heat pump : Largest savints
Refrigerant : Only natural
Specifications heat pump
Heat pump type : Mechanical heat pump with natural refrigerant Ammonia (R717)
Capacity : 1000 kW
Electric power : 196 kW
COPh : 5.1
Waste heat in
Waste heat out
196 kW
30.0 °C
75 °C
70.0 °C
804 kW
Evaporator
Condenser
1000 kW
30.0 °C
28 °C
50.0 °C
Flow out
Flow in
Costs and savings
Energy savings
Reduction fuel consumption : 562800 Nm3 per year
Extra electricity
consumption : 823200 kWh per year
Primary energy savings : 10404 GJ per year
Financial savings
Fuel savings : € 197000 per year
Electricity costs : € 65900 per year
Financial savings : € 131100 per year
Investment costs
Heat pump : € 370000
Payback period
Investment costs : € 432100

Task 2: Modeling calculation and economic models
Dutch Team Report - Modeling in the Netherlands
4-222
4.6 Literature
Geelen, 2013 Monitoring van (energetische) prestaties en knelpuntenanalyse WKO-systemen in de glastuinbouw, ir. C.P.J.M. Geelen en ir. K.J. Braber; Arnhem, December 2013
Grift, 2011 Warmtetools industrie, Jan Grift, Allan Hart (Energy Matters), april 2011, Projectnumber: 11.450
Kiss, 2012 Mastering heat pumps selection for energy efficient distillation, Kiss A. A., Flores Landaeta S. J. and Infante Ferreira C. A., (2012), Chemical Engineering Transactions, 29, 397-402
Landolina, 2012 Strategic Research Priorities for Renewable Heating & Cooling, Cross-Cutting Technology European Technology Platform on Re-newable Heating and Cooling; Many authors edited by Simone Landolina – European Renewable Energy Research Centres Agency, Manuscript completed in April 2012. Brussels, © Euro-pean Union, 2012