Application of GIS and Spatial Analysis of Golden Eagle ...
152
Portland State University Portland State University PDXScholar PDXScholar Dissertations and Theses Dissertations and Theses Winter 4-21-2013 Application of GIS and Spatial Analysis of Golden Application of GIS and Spatial Analysis of Golden Eagle Fatalities Caused by Wind Turbines at the Eagle Fatalities Caused by Wind Turbines at the Altamont Pass Wind Resource Altamont Pass Wind Resource Andrew James Pinger Portland State University Follow this and additional works at: https://pdxscholar.library.pdx.edu/open_access_etds Part of the Environmental Indicators and Impact Assessment Commons, Oil, Gas, and Energy Commons, and the Poultry or Avian Science Commons Let us know how access to this document benefits you. Recommended Citation Recommended Citation Pinger, Andrew James, "Application of GIS and Spatial Analysis of Golden Eagle Fatalities Caused by Wind Turbines at the Altamont Pass Wind Resource" (2013). Dissertations and Theses. Paper 197. https://doi.org/10.15760/etd.197 This Thesis is brought to you for free and open access. It has been accepted for inclusion in Dissertations and Theses by an authorized administrator of PDXScholar. Please contact us if we can make this document more accessible: [email protected].
Transcript of Application of GIS and Spatial Analysis of Golden Eagle ...

Portland State University Portland State University
PDXScholar PDXScholar
Dissertations and Theses Dissertations and Theses
Winter 4-21-2013
Application of GIS and Spatial Analysis of Golden Application of GIS and Spatial Analysis of Golden
Eagle Fatalities Caused by Wind Turbines at the Eagle Fatalities Caused by Wind Turbines at the
Altamont Pass Wind Resource Altamont Pass Wind Resource
Andrew James Pinger Portland State University
Follow this and additional works at httpspdxscholarlibrarypdxeduopen_access_etds
Part of the Environmental Indicators and Impact Assessment Commons Oil Gas and Energy
Commons and the Poultry or Avian Science Commons
Let us know how access to this document benefits you
Recommended Citation Recommended Citation Pinger Andrew James Application of GIS and Spatial Analysis of Golden Eagle Fatalities Caused by Wind Turbines at the Altamont Pass Wind Resource (2013) Dissertations and Theses Paper 197 httpsdoiorg1015760etd197
This Thesis is brought to you for free and open access It has been accepted for inclusion in Dissertations and Theses by an authorized administrator of PDXScholar Please contact us if we can make this document more accessible pdxscholarpdxedu
Application of GIS and Spatial Analysis of Golden Eagle Fatalities
Caused by Wind Turbines at the Altamont Pass Wind Resource Area CA
by
Andrew James Pinger
A thesis submitted in partial fulfillment of the requirements for the degree of
Master of Science
in Biology
Thesis Committee Luis A Ruedas Chair Deborah A Duffield Michael T Murphy
Portland State University 2013
A b s t r a c t i
Abstract
The Altamont Pass Wind Resource Area (Altamont) near Livermore California is
the oldest and largest wind farm in the United States It is known as a location of high avian
mortality especially for diurnal raptors such as the Golden Eagle (Aquila chrysaetos) Using
the avian monitoring data collected at Altamont for over thirteen years (1998-2003 2005-
2011) records were analyzed of 134 golden eagle deaths caused by wind turbine collisions
All wind turbines present during the same temporal range were characterized according to
turbine variables and geographic placement characteristics Values of turbines that killed
golden eagles were compared to values of turbines that did not It was discovered that
turbines that have killed golden eagles (kill turbines) share characteristics that are
significantly different from those that have not Kill turbines are more often situated on
lattice structure towers have larger rotor blade-swept areas are placed in less dense turbine
arrays are further away from the next nearest turbine and are less often placed on top of
ridgelines compared to nonkill turbines Finally kill turbines are more often situated at the
end of a turbine row than are nonkill turbines The differences between kill and nonkill
turbine model hill slope tower height generating capacity array diversity row count of
turbines and placement in a hill saddle were found to be not significant These findings
support in part earlier turbine studies at Altamont but do not concur with all previous
findings The methods used in this study can be applied to any bird species at Altamont and
at any wind resource area throughout the world As the wind industry continues to grow
techniques used in studies such as this are an important tool that can be used to direct
wildlife conservation policies
T a b l e o f C o n t e n t s i i
Table of Contents
Section Page Number
Abstract i
Table of Contents ii
List of Tables iii
List of Figures iv
Introduction 1
Methods 17
Results 46
Discussion 94
Conclusions 103
Acknowledgments 105
Photo Credits 106
References 107
Appendix A List of Fields in the SRC Fatalities Table 112
Appendix B Fatality Detection Form 116
Appendix C M11 Determination of Cause of Death (Adapted) 117
Appendix D List of Fields in the SRC Turbine Table 119
Appendix E List of Fields in the SRC Transects Table 121
Appendix F Use of Circular Package in R to Calculate Aspect Statistics 123
Appendix G Calculations of Hilltop Ridgelines 125
Appendix H Fishnet Square Turbine Count Table 128
Appendix I Abridged Records of Status Id 1 Golden Eagle Fatalities 135
Appendix J Additional Fields Calculated for Turbine Table 143
L i s t o f T a b l e s i i i
List of Tables
Table Title Page Number
I-1 Turbine Models in the Historic Array 15
I-2 Morphometric Characteristics of Golden Eagles 16
I-3 Composition of Golden Eagle Diet 16
M-1 Given and Calculated Turbine Table Variables 44
R-1 All Fatality Records by Status Id 52
R-2 Top 10 Species of Turbine Caused Bird Fatalities at Altamont 1998-2011 53
R-3 Golden Eagle Fatality Records by Status ID 54
R-4 Presence Count by Year and Turbine Model 55
R-5 Monitored Count by Year and Turbine Model 56
R-6 Monitored Turbines as a Proportion of Total Annual Monitoring Effort 57
R-7 Summary Table - Turbine Presence and Monitored Count Totals 58
R-8 Kill Turbines with Golden Eagle Fatality Census 59
R-9 Count of Golden Eagle Fatalities by Year and Turbine Model 63
R-10 Target Species Annual Fatality Count Totals 64
R-11 Search Effort Required per Golden Eagle Fatality 78
R-12 Summary Table of Test Findings 79
R-13 Summary Statistics for Turbine Characteristics 80
R-14 End Row Status by Golden Eagle Age Class 92
R-15 Tower Type by Golden Eagle Age Class 92
R-16 Rotor Swept Area by Golden Eagle Age Class 92
R-17 Ridgetop Status by Golden Eagle Age Class 93
R-18 Nearest Turbine Distance by Golden Eagle Age Class 93
R-19 Sex Ratio of Golden Eagle Fatalities 93
L i s t o f F i g u r e s i v
List of Figures
Figure Title Page Number
I-1 Map of Altamont Pass Wind Resource Area CA 12
I-2 Map of Historic Turbine Array Altamont Pass Wind Resource Area 13
I-3 Aquila chrysaetos Range Map 14
M-1 Wind Turbine Tower Types 42
M-2 Historic Turbine Array and Fishnet Grid 43
R-1 Golden Eagle Fatalities and Monitored Turbines at the
Altamont Pass Wind Resource Area 1998 65
R-2 Golden Eagle Fatalities and Monitored Turbines at the
Altamont Pass Wind Resource Area 1999 66
R-3 Golden Eagle Fatalities and Monitored Turbines at the
Altamont Pass Wind Resource Area 2000 67
R-4 Golden Eagle Fatalities and Monitored Turbines at the
Altamont Pass Wind Resource Area 2001 68
R-5 Golden Eagle Fatalities and Monitored Turbines at the
Altamont Pass Wind Resource Area 2002 69
R-6 Golden Eagle Fatalities and Monitored Turbines at the
Altamont Pass Wind Resource Area 2003 70
R-7 Golden Eagle Fatalities and Monitored Turbines at the
Altamont Pass Wind Resource Area 2005 71
R-8 Golden Eagle Fatalities and Monitored Turbines at the
Altamont Pass Wind Resource Area 2006 72
R-9 Golden Eagle Fatalities and Monitored Turbines at the
Altamont Pass Wind Resource Area 2007 73
R-10 Golden Eagle Fatalities and Monitored Turbines at the
Altamont Pass Wind Resource Area 2008 74
R-11 Golden Eagle Fatalities and Monitored Turbines at the
Altamont Pass Wind Resource Area 2009 75
R-12 Golden Eagle Fatalities and Monitored Turbines at the
Altamont Pass Wind Resource Area 2010 76
R-13 Golden Eagle Fatalities and Monitored Turbines at the
Altamont Pass Wind Resource Area 2011 77
L i s t o f F i g u r e s v
R-14 Golden Eagle Fatalities by Turbine Model and Total Search Count 79
R-15 Golden Eagle Fatalities and Search Totals 80
R-16 Circular Aspect Histogram of Nonkill Turbines 84
R-17 Circular Aspect Histogram of Kill Turbines 85
R-18 Golden Eagle Fatalities by Quarter of Death Date 86
R-19 Golden Eagle Fatalities by Month of Death Date 87
R-20 Radar Chart of Golden Eagle Fatalities with Known Death Dates 88
R-21 Age Class and Death Dates of Golden Eagle Fatalities 89
R-22 Golden Eagle Fatalities by Age 90
I n t r o d u c t i o n 1
Introduction
The wind resources in North America have the potential to provide massive
amounts of clean energy without emissions of greenhouse gases or harmful toxins (US
Government Accountability Office 2005) The US Department of Energy calculated that
land in the United States has an annual potential for 385 million gigawatt hours (GWh) of
wind energy production (NREL 2010) Wind is a growing domestic industry In 2012 13124
megawatts of new wind power capacity was installed in the United States bringing the US
total to 60007 MW This energy is generated by over 45000 individual wind turbines
throughout the nation (AWEA 2012) In 2008 the US Department of Energy released 20
Wind Energy by 2030 a report that details realistic strategies for how US energy demand
can be met with increasing wind power supply (US Department of Energy 2008) It is
reasonable to expect that many more wind turbines will become a regular part of the nationrsquos
skylines
Although wind energy is a plentiful domestic product that does not pollute the air or
water it does come with a biological cost New constructions of turbine arrays and
distribution systems including transmission lines have the potential to disturb or destroy
crucial wildlife habitats (GAO 2005) The costs of developing wind energy are more
concrete when you consider the direct conflicts between wind turbines and the animals that
also use the wind
Many birds have adapted to use winds for soaring and as an aid in migratory flight
This suite of adaptations has developed over deep time however these animals have had far
less time to adapt to sharing airspace with the spinning blades of wind turbine propellers
Unfortunately this nascent competition for winds often brings birds into lethal contact with
I n t r o d u c t i o n 2
tower structures and turbine blades Ground zero for this conflict lies in a rural setting fifty
miles east of San Francisco CA
The Altamont Pass Wind Resource Area (Altamont) near Livermore California
serves as an example of the conflict between wind energy and birds No wind farm in the
world has done more to solidify the idea that energy-generating wind turbines are dangerous
to wildlife (Erickson 2002) Altamont was developed in the 1980rsquos as the nationrsquos first large-
scale wind farm With over 5000 towers the skies over Altamont are a deadly place for
birds Altamont lies in the northeast corner of Alameda County with a small portion of the
array occupying and area in the south east corner of Contra Costa County (Fig I-1)
Altamontrsquos terrain consists of rolling hills of mostly open grassland with gradual
elevation changes and dispersed patches of deciduous hardwood trees including oaks
California buckeye and eucalyptus (Hunt 1999 Orloff and Flannery 1991) Much of the land
continues to be used for grazing by local ranchers
The wind resource area at Altamont covers between 141 Km2 (Hunt 1999) ndash 189
Km2 (Hoover 2002) depending upon what properties are included in the calculation There
are eight companies that operate wind farms in twenty-five project sites and a total of 5463
individual wind turbines have been a part of the historic array at Altamont For the
purposes of this research ldquohistoric arrayrdquo refers to all turbines that have been present at
Altamont between the years 1998 and 2011 (Fig I-2) The number of turbines in the historic
array is 5463 but at no time were that number of turbines all present Due to turbine
removals and installations throughout the temporal range of this study the array fluctuates
annually Tables R-4 and R-7 in the Results section provide counts of turbines per year for
those present (R-4) and those that were monitored (R-7)
I n t r o d u c t i o n 3
Due in part to the diversity of companies operating turbines there is a broad
diversity of wind turbine models within the array There have been 16 different turbine
models present in the time of this study (Table I-1)
Unlike most contemporary wind farms in the United States that do not have a
history of large bird fatalities (Erickson 2001) the turbines at Altamont are known to have
caused numerous bird fatalities including federally protected raptor species (Orloff 1992)
Although studies have identified ways in which new wind farms may reduce conflicts
with birds through alternative tower design and better siting strategies (Erickson 2001)
uncommonly high fatality numbers remain significant among raptor species (Smallwood amp
Thelander 2004) The species that top Altamontrsquos list of raptor fatalities are the red-tailed
hawk (Buteo jamaicensis) American kestrel (Falco parverius) barn owl (Tyto alba) burrowing owl
(Athene cunicularia) and golden eagle (Aquila chrysaetos) (Leslie 2012) Estimates of annual
golden eagles fatalities at Altamont range between 30-70 (Smallwood 2005 Leslie 2012) The
only wind farm in the country that compares with Altamont for golden eagle presence is the
facility at Foot Creek Rim WY where golden eagle deaths are reported far less frequently
(Strickland 2001)
Altamont settlement
Reports of large numbers of raptors being killed by wind turbines at Altamont
activated the San Francisco Bay area conservation community By January 2006 a number of
local Audubon Society chapters together with the group Californians for Renewable Energy
brought suit against wind farm operators and Alameda County to stop the killings of
federally protected bird species A number of wind farm operators chose to settle the suit
outside of court and agreed to take measures to decrease bird fatalities The settlement goal
I n t r o d u c t i o n 4
was a 50 reduction in annual fatalities for target species This reduction goal was based on
a calculated baseline estimate of annual fatalities prior to the agreement (Golden Gate
Audubon Society 2007) The target species were four among the raptor species listed above
red-tailed hawk American kestrel burrowing owl and golden eagle
The settlement agreement also chartered a Scientific Review Committee (SRC) to
oversee the progress of the fatality reduction goal The committeersquos composition is
ldquohellip five members each of whom is appointed by one of the following interests permittees (ie wind
farm companies) environmental community County Planning Department California state agency
(California Energy Commission or Department of Fish amp Game) and federal resources agency
(US Fish amp Wildlife Service) ldquo
The SRC commissioned consulting groups to undertake the bird fatality monitoring
work at Altamont The current contract is with ICF International (ICFI) Staffers of ICFI
conduct the field monitoring and post search data analysis The work of ICFI is to determine
and verify whether the settling parties have achieved the 50 fatality reduction goal Annual
reports that track the status of the 50 reduction goal are published but those reports are
not the only product that results from all of the monitoring programrsquos data collection A
publicly accessible multi-year fatality data set that can be analyzed for trends in bird
mortalities now exists Specifically an investigation of all the wind turbine-caused fatalities of
any single species may reveal patterns or variables that are important in turbines that killed
those birds The bird fatalities at Altamont that have gained the most attention are those of
golden eagles hence golden eagles are the focus of the present investigation
Study organism
I n t r o d u c t i o n 5
The Golden Eagle Aquila chrysaetos is North Americarsquos largest bird of prey and has a
global range in the northern hemisphere (Kochert 2002b) Aquila chrysaetos has a Holarctic
distribution with populations throughout Europe North Africa and Asia Six subspecies are
currently recognized including Ac kamtschatica distributed in Siberia from the Altai
Mountains in the west to the Kamchatka peninsula in the east Aquila c chrysaetos is found in
Europe from the British Islands as far east as the Altai Mountains Aquila chrysaetos daphanea
is found from Turkestan through India Pakistan and into China Aquila chrysaetos homeyeri is
limited to the Iberian Peninsula and coastal areas around the Mediterranean Sea including
North Africa Aquila chrysaetos japonica is limited to the Japanese archipelago and Korean
peninsula (Kochert 2002b) Aquila chrysaetos canadensis is the only subspecies of golden eagle
recognized in North America (Fig I-3) and is the taxon that occurs in the Altamont Pass
Wind Resource Area
The golden eagle is a long-lived species Banded individuals in North America have
lived as long as 31 years although in California the record is 20 years (Lutmerding 2013)
They display sexual dimorphism with the females being larger in measurements (Bortolotti
1984)
Golden eagles are known to prey on a diversity of terrestrial wildlife as well as avian
prey It has a highly adaptable diet that consisting mainly of small mammals Drawing from
primary sources throughout North America a 1976 survey of faunal remains in golden
eagles nests recorded a diet heavily weighted toward mammals
Larger mammals and birds donrsquot make up a large proportion of the golden eagle diet
so it is remarkable when these events are recorded There are published accounts of golden
eagles preying on island foxes (Urocyon littoralis littoralis) (Coonan 2005) pronghorn antelope
I n t r o d u c t i o n 6
(Antilocapra americana) (Tigner 1973) calves of domestic cattle (Bos taurus) (Phillips 1996)
mule deer (Odocoileus hemionus) (Olendorff 1976) and birds such as the red-tailed hawk (Buteo
jamaicensis) great horned owl (Bubo virginianus) and American coot (Fulica americana) (Dixon
1937) They are not known to regularly pursue fish like the bald eagle but as opportunistic
scavengers may consume fish as carrion (Ollendorff 1976)
Golden eagles near the Altamont Pass Wind Resource area feed predominantly on
California ground squirrels (Spermophilus beechyii) which account for 69 of prey items found
at golden eagle nests in the area (Hunt 1999) The rolling hills and open grassland of the
wind resource area seem to be very good habitat for ground squirrels and so it is likewise an
equally good hunting ground for golden eagles The abundant presence of ground squirrels
may help to explain the high golden eagles presence in the area
Mating amp reproduction
After maturity golden eagles form mating pairs that occupy and defend a territory
They usually breed every year and their brood is typically one or two chicks (sometimes
three) with facultative fratricide not uncommon in the nest (Edwards 1983) Individuals
appear to prefer nest sites high on cliff faces or when rocky outcrops are not available in
large trees (Menkens 1987)
Fledgling eagles leave the nest after an incubation period of 45 days and a fledging
period of ten to eleven weeks (Hunt 1999) Until this time both male and female parents
provision the young with food Once the juvenile birds leave the nest they remain in the
area for approximately two months with increasing independence from their parents Soon
thereafter the mating pair is known to chase juvenile birds away from their nest and
breeding territory At this point the juvenile birds are on their own with respect to feeding
I n t r o d u c t i o n 7
Survival probability estimates for juvenile golden eagles have been made on the central
California and Denali National Park populations These estimates show a probability of
survival between 78 in Denali (McIntyre 2006) and 84 in central California (Hunt 2002)
in the months following fledging
Population composition
The golden eagle population in the lands surrounding Altamont has been well
studied A 1995 survey found 44 breeding pairs occupying territories in the 820 Km2 area
surrounding Altamont This is one of the highest recorded population densities of golden
eagles and the figure is considered by many to underestimate real numbers (Hunt 1995)
A typical population of golden eagles is composed of four groups Adult eagles form
breeding pairs when breeding territories become available Juvenile are volant up to one year
old They do not breed and do not control territory Sub-adults are immature and range in
age between 1-3 years old Sub-adults do not breed and do not control a home territory
Finally there are mature adult eagles that do not possess or defend territories These non-
breeding adults are referred to as floaters (Hunt 1995) Floaters serve as a reserve in a
population for when breeding adult birds are eliminated (Hunt 1999)
Flight
Golden eagles display a number of flying styles including flapping gliding soaring
stooping and undulating flight (Kochert 2002b) Observations of golden eagles at Altamont
reveal that two types of flight are used primarily These consist of thermal soaring and
gliding (Hoover 2002) Thermal soaring helps eagles to gain elevation above the hunting
grounds after which they employ gliding to gradually move into position to pounce on prey
I n t r o d u c t i o n 8
While actively hunting the characteristic flight pattern of these eagles is referred to as
contour hunting and is characterized by low elevation flight 1-5 meters above the ground
during which the ridges and contours of the hillsides are followed (Carnie 1954 Collopy
1983) It is thought that this low profile flying allows eagles to get within close proximity to
their prey without the latter having much advance notice This low elevation contour flight
brings golden eagles into close proximity with the height of wind turbine blades and is
thought to be the primary reason why golden eagles are struck by turbine blades
Migration
The ecology of golden eagle migration has been well studied in several parts of the
United States and Canada (Applegate 1987 Omland 1996 Yates 2001 McIntyre 2006 Good
2007) but migratory tendencies of the Altamont golden eagles are less known The Coast
Range of California hosts resident golden eagles (Carnie 1954) and it is assumed that the
same holds for Altamont Whether or not golden eagles that are killed by turbines at
Altamont are resident eagles or are rather migrating or dispersing individuals is a question
that is important to pursue because it may explain how the population of golden eagles
around Altamont remains so seemingly stable in spite of the annual fatality estimates that 30-
70 golden eagles are killed at Altamont annually (Hunt 2002 Smallwood 2005 Leslie 2012)
No studies so far have provided answers to these questions so they remain unexplained
Federal Protection
In 1918 the Migratory Bird Treaty Act was signed by the United States and Great
Britain on behalf of Canada The act created criminal penalties for the taking or harming of
an extensive list of native migratory and resident birds in North America The law was
I n t r o d u c t i o n 9
initiated as a corrective measure to alleviate the damage to bird populations by market
hunters in the previous years The MBTA protects all native North American birds with the
exception of certain game birds In 1962 the golden eagle gained added protection when it
was added to the 1940 Bald Eagle Protection Act which was then renamed the Bald and
Golden Eagle Protection Act This act prohibits the taking of any eagle or eagle part without
a permit and it provides increased penalties for violations of the act
Threats
As the largest raptor in North America the golden eagle has few predators (Hunt
2002) besides humans Although the Bald and Golden Eagle Protection Act has outlawed
hunting of these birds eagles do still suffer indirectly from of human hunting activity There
are over 125 million deer hunters in the United States (Aiken 2011) Not every hunter
successfully kills a deer and of those that do many do not recover the deer they shoot
Unrecovered deer carcasses and discarded gut piles of deer that were shot by hunters using
jacketed and unjacketed lead bullets or slugs are a source of microscopic lead fragments that
are easily ingested by scavenging animals (Hunt 2006) As opportunistic scavengers golden
eagles may feed on these carcasses and can ingest large quantities of lead particles Surveys
conducted in Montana and California have shown between 35 and 85 of golden eagles
have elevated blood lead levels (Harmata 1995 Pattee 1992)
Other causes of golden eagle deaths come from a variety of human related sources
A 1995 survey of golden eagle carcasses conducted by the National Wildlife Health Center
showed that electrocutions claimed 25 and gunshots were responsible for 15 Poisoning
accounted for 6 of deaths and accidental trauma was responsible for 27 of the deaths of
specimens in the survey The remaining 27 were not described (Franson 1995) Accidental
I n t r o d u c t i o n 1 0
trauma included birds killed by collisions with cars buildings structures and wind turbines
Among these causes of unnatural deaths of golden eagles deaths caused by wind turbines
are the subject of the present study
With Altamontrsquos thirteen years of bird fatality data being available to the public
unique opportunities for research exist Investigations can now be conducted to better
understand the factors contributing to bird deaths at Altamont The goal of the present
study is to determine whether there are unique spatial factors and turbine characteristics that
contribute to golden eagle turbine collisions
I hypothesized that a turbinersquos physical attributes or its placement in the landscape or
within an array of turbines will lead to a relative increase or decrease in golden eagle
fatalities In particular I was interested to discover what differences existed between turbines
that displayed relatively increased fatalities versus turbines that had relatively reduced
fatalities To test for this difference every record of a golden eagle fatality at Altamont
between 1998 and 2011 was examined and filtered to establish those killed by turbine
collisions and from these a roster of fatal turbines was established
A comprehensive survey of every turbine at Altamont was undertaken and each
turbine described according to a set of characteristics These wind turbine attributes can be
divided into two categories Innate turbine characteristics are those that would be the same
no matter where the turbine was placed This includes tower height turbine model tower
type rated energy generating capacity and rotor swept area Placement characteristics are
those that are dependent upon where in the landscape or within a turbine array a turbine is
erected These characteristics include base elevation at placement the number of other
turbines that are in the same row aspect and slope of the ground on which the turbine
I n t r o d u c t i o n 1 1
stands density of turbines diversity of local turbines whether or not an individual turbine is
in a saddle of a hilltop ridge as well as the distance to the next nearest turbine Much of this
information is readily available through the SRC website but a portion of the placement data
must be calculated Once the turbine survey was complete the attributes of turbines that
killed golden eagles were compared to the characteristics of turbines that did not produce
kills If spatial factors or turbine characteristics do not appear in a significantly higher
frequency in turbines that have killed golden eagles than in those turbines that have not
killed golden eagles the hypothesis that innate or placement characteristics contribute to
eagle fatalities from wind turbines will be rejected
To investigate how demographic characteristics and temporal variation may
influence wind turbine-caused fatalities I examined age class and sex designations as well as
calculated death dates of golden eagle fatalities at Altamont A demographic analysis is
important to determine whether or not any age class is being disproportionately killed by
turbines Further analysis illustrates which temporal intervals are most deadly for each age
class and sex of golden eagle
I n t r o d u c t i o n 1 2
Figure I-1 Map of Altamont Pass Wind Resource Area CA
All maps created by Andrew Pinger in ArcMap 100 2011-2012
I n t r o d u c t i o n 1 3
Figure I-2 Historic Turbine Array Altamont Pass Wind Resource Area
Interstat
e
580
I n t r o d u c t i o n 1 4
Figure I-3 Aquila chrysaetos Range Map
Map data provided by NatureServe in collaboration with Robert Ridgely James
Zook The Nature Conservancy Migratory Bird Program Conservation International
Center for Applied Biodiversity Science World Wildlife Fund US and Environmental
Canada and WILDSPACE
I n t r o d u c t i o n 1 5
Table I-1 Turbine Models in the Historic Array
Turbine Model n Tower
Type(s) Tower Height
(m) Generating
Capacity (kWh)
Rotor Swept Area (m2)
250KW 20 Tubular 80 250 4906
Bonus 536 Tubular 60-80 65-150 1971 ndash 4212
Danwin 39 Tubular 80 110-160 2831 - 4212
Enertech 170 Lattice 60-80 40-60 1413
Flowind 169 Vertical
Axis 92-102 150-250 2288 - 2805
Howden 86 Tubular 112 330-750 na
Kenetech 56-100 3400 Lattice 60-140 100 2539
KVS 33 41 Lattice amp Tubular
80-120 400 8553
Micon 221 Tubular 80 65 1973
Mitsubishi 1000A 38 Tubular 60 1000 2538
Nordtank 371 Tubular 78-80 65-150 1971 - 4212
Polenko 12 Tubular 80 100 2540
V-47 31 Tubular 164-180 660 17304
Vestas 202 Tubular 45-80 95 2264-2600
Windmaster 101 Tubular 23 50-250 2940
Windmatic 26 Lattice 60 65 1682
Total 5463
I n t r o d u c t i o n 1 6
Table I-2 Morphometric Characteristics of Golden Eagles
Trait Female Male Source
Mass (grams) 3374-6124 2495-4281 Edwards 1986
Mean Wing Chord (mm) 6404 5950
Bortolotti 1984
Wing Chord Range (mm) 601 - 674 569 - 619
Table I-3 Composition of Golden Eagle Diet
Animal Group Percent
Rabbits and hares 541
Marmots prairie dogs and ground squirrels 218
Game birds 80
Hoofed animals 44
Passerine birds 32
Deer 19
Domestic Livestock 14
Mammalian predators 12
Avian predators 09
Waterfowl 05
Method s 17
Methods
Rather than undertake a novel study that would likely be limited in scope and
breadth to what a single researcher could collect in one or two seasons publicly available
data including thirteen years of observations fatality searches and geographic data were
accessed and used The Altamont Pass Wind Resource Arearsquos Scientific Review Committee
(SRC) provided these data on their websitersquos avian monitoring data portal This portal was
created and is maintained by the Portland OR staff of ICF International a Virginia-based
company that was contracted by the SRC to conduct bird monitoring and analysis of
fatalities at Altamont
The available data can be manipulated in standard publicly available software such as
Microsoft Excel Three tables in particular were used to calculate and analyze bird fatality
information The first is a fatalities table that includes all fatality records from 1998 to
present The second is a turbine table that holds information of the wind turbine array at
Altamont Finally there is a transect table that consists of records of searches dates and
protocols of the Altamont bird monitoring program The following section contains details
of each of these tables and the most pertinent fields from each table are described
SRC Fatalities Table
This table includes every record of a bird or bat fatality recorded at Altamont since
May 1998 There are 7560 records between May 1998 and December 2011 Each record
has 73 fields including such characters as species discovery date carcass condition
searchersrsquo initials etc A full listing of the 73 fields can be seen in Appendix A including
metadata for each field
Method s 18
Biologists conducting monitoring surveys at Altamont completed a fatality report for
each detection of a bird or bat fatality they found Each fatality report appears as a record in
the fatality table A copy of a fatality report completed in the field appears as Appendix B
Protocols for detecting bird fatalities at Altamont have evolved over many years
Current protocols include search transects walked by field biologists along a predefined
route (SRC 2007) The distances between transect routes in a search area is 6 - 8 meters This
distance accounts for a 3-4 m sightline on either side of the searcher The searched area
surrounding a turbine in Alameda County continues to a 50 m radius from the turbine base
For some turbines in Contra Costa County the radius extends to 60 and 75 m depending
upon the height of the turbine The taller turbines are afforded a larger search radius because
it is reasoned that a taller turbine with longer blades may throw a bird carcass further than
the smaller bladed turbine
The array of turbines monitored at Altamont (Fig I-2) is divided in two by Altamont
Pass Road with approximately half of the array on the north side of the road and half on the
south Turbines are grouped into plots which may contain multiple strings Each string
contains numerous turbines Each turbine is searched once a month according to a
predetermined transect schedule
When a dead bird is discovered biologists complete a fatality report by collecting
information about location of the body relative to the nearest turbine or other structures
Global Positioning System (GPS) coordinates of the carcass are recorded using a handheld
GPS device Also recorded at the time of detection are the plot string number and the
turbine label or turbine id
Method s 19
Valid detections of a bird fatality do not require a complete or even a partial carcass
Due to the presence of numerous bird and mammal scavenging species at Altamont it is
clear that a bird could be killed by a turbine and completely removed by an animal such as a
badger or coyote When this happens few traces of the bird may remain The M1 protocol
indicates that discovery of either 5tail feathers or 2 primaries or any combination of 10 total
feathers all can be considered a valid turbine-related fatality A detection such as this is
referred to as a ldquofeather spotrdquo The discovery of a feather spot suggests the presence of a
scavenger in the area and that this scavenger may have removed the remainder of the
carcass (SRC 2007)
Carcasses or remains are identified to the species and the age and sex of the bird is
determined if possible Plumage patterns carcass size and beak foot or other morphological
feature may be used to determine the taxonomic identity of a given fatality
The condition of the carcass is described in the detection form Through the notes
and body parts fields the monitoring team describes what was found This will include
descriptions of feathers parts of a carcass or a complete carcass Given the description and
details regarding stage of decomposition an estimate may be made of time since death and
cause of death Evidence of scavenging can also be assessed by presence of insects gnawed
bones or feathers or absence of body parts
A bird fatality may be discovered the day it was killed or months after its death It is
because of this temporal uncertainty that the date of discovery must be recorded in order to
estimate the date of death Estimates take into account carcass condition or state of decay of
the carcass and amount of time elapsed since the last search was performed at that site For
Method s 20
this study the specific day or month of death is not used Only the year of the birdrsquos death
was used to create annual fatality counts
Causes of death for bird fatalities are determined using protocols in the M11
determination of cause of death manual (SRC 2008a) Any golden eagle that is found within
the search area and does not show signs of electrocution is considered to have been killed by
a turbine collision unless the condition of the carcass is so scattered or deteriorated that the
cause of death is considered Unknown The unknown designation may be used when only
bone fragments or loose feathers remain The M11 cause of death protocol is available as
Appendix C
Following the initial collection of fatality data in the field fatality records were given
unique identifying numbers They were then filtered and given a status id that indicated how
the record would be considered for future analysis For example it may be determined that a
single dead bird was detected more than one time andor on more than one day When
multiple fatality records refer to the same bird then detections after the first one are given a
status id of 11 which is a duplicate detection of a known fatality If a bird is found more
than 125 meters from the closest turbine it is given a status id of 4 and is excluded from
this study Excluding records of birds found outside of the turbine search radius ensures that
extraneous non-wind turbine caused fatalities are not added into fatality estimates All
records were graded according to the M26 decision tree for Altamont bird fatality data
filtering protocol (SRC 2008b) Only golden eagle records with a status ID of 1 - valid
turbine related fatality - were used in this study
Method s 21
The first step in working with the fatality table was to filter records at the species
level and remove all records that were not golden eagles The second step was to filter the
table by status id and remove all records that had a status id other than 1
Among the most important fields in the fatality table is the turbine label field The
turbine label is an identifier that appears on the wind turbine tower When a biologist finds a
bird fatality he identifies the nearest turbine to the fatality and records its turbine label This
creates the initial pairing of a fatality to a specific turbine hence to that turbinersquos attributes
This leads to one of the assumptions of this work It is assumed that the turbine
closest to a bird fatality is the turbine that killed that bird This is potentially problematic for
several reasons It is possible that a scavenger could have moved a birdrsquos body Alternatively
birds injured by turbine strikes that did not die right away may have sufficient mobility to
cross from one search area into another If an injured bird then died in the adjacent search
area a non-offending turbine would be credited with the birdrsquos death In fact Hunt found
that five of 42 blade-stuck golden eagles his study were able to live through the initial trauma
long enough to wander away from the turbinersquos search radius (2002)
Because there are rarely if ever eyewitnesses to bird collisions with wind turbines this
assumption must be made The work of the SRC is to verify annual fatality counts for target
species in accordance with the settlement agreement (Golden Gate Audubon Society 2007)
Because this charge is narrowly focused on counting and calculating fatalities there have not
been efforts introduced to verify the relationship between a carcass location and the identity
of the turbine that was responsible for killing it As Huntrsquos findings demonstrate there is
clearly room for error but no estimate has been suggested
SRC Turbine Table
Method s 22
The turbine data table available from the SRC bird monitoring data portal includes
ownership and operator information as well as location and model details for each of the
5463 turbines that have operated at Altamont between 1998 and 2011 the temporal range
of the present study These data come from wind farm operators and includes X and Y
coordinates for each turbine A listing of the 27 fields in the turbine table can be seen in
Appendix D including metadata for each field
The turbine table was used to join fatality data to turbine data By matching turbine
labels with string ids turbine ids were assigned to fatality records Once this process was
completed a new variable and field was created denoting whether a turbine is a golden eagle
killer or not Turbines that have fatalities connected to them were considered ldquokill turbinesrdquo
while those that had no golden eagle fatalities connected to them were considered ldquononkillrdquo
turbines
Two of the most important fields in the turbine table are ldquodate installedrdquo and ldquodate
removedrdquo fields The values in these fields give calendar dates for when the turbine was
installed and when or whether a turbine has been uninstalled With these data an annual
census of the turbine array was calculated Turbines have been removed from Altamont for a
number of reasons including repair disuse or repowering a strategy of removing many
smaller turbines and replacing them with fewer larger more efficient turbines
The presence census is just an initial step in describing the turbine array Because not
every turbine is monitored every year by the field biologists it is important to determine
what turbines were searched and how often they were monitored This is done by
incorporating the transect table from the SRC data portal
SRC Transect Table
Method s 23
The transect table is a document that consists of 20 fields and 26601 transect
records A transect is a record of when the turbines of a given string were searched Initially
the string number referred to a unique set of wind turbines that were geographically grouped
together in a line or string on the landscape Over the years with additions and removals of
turbines the geographic cohesiveness of the turbines in any given string has been
inconsistent Because of this string numbers became anachronistic and data managers had
to code each turbine with a string number and create a string id field that would be constant
Because neither the string number nor string ID fields currently reflect cohesive consistent
or accurate geographic relationships of turbines I created a new field called screen id that
does capture accurate geographic relationships among turbines More about screen ids will
be described in the next section
The two most valuable fields in the transect table are the string number and the
monitoring year fields Each transect can be joined to the turbine table through the string
number This allows one to tally the number of times each turbine was searched each year
The number of times a turbine was monitored each year was calculated and added as a new
field to the turbine table
This introduces the second major assumption of this research When a string number
appears in the transect table there is a corresponding field called ldquonumber of turbinesrdquo This
refers to the count of turbines in that string number group When the transect table shows a
string number searched on a particular date it is assumed that all of the turbines on that
string are searched on that date This assumption is made because the transect table is not
detailed enough to display a list of transects for every turbine for every occasion that it is
searched The turbines are grouped into strings and only the string number is listed The
Method s 24
transect table is simply the document of record and does not indicate partial string searches
so it must be assumed that all turbines were searched A listing of the 20 fields in the transect
table is provided in Appendix E including metadata for each field
Data Production
In this section I describe how I generated new data by manipulating the data from
the three tables described above and how I created new information using Microsoft Excel
tools and Esrirsquos ArcGIS programs Table M-1 lists each turbine variable a brief description
and an indication of the origin of the data Many of the data come directly from the SRC
monitoring data tables but a significant portion of it was calculated using the tools
mentioned above What follows is a description of each variable and what was done to
calculate its values
The first step in calculating and analyzing data was to ensure that all of the provided
information was error checked and corrected Fields that included NA values or spelling
errors had to be rectified and any numerical field values with supernumerary digits fixed
Many of the variables in Table M-1 required the use of a GIS program to calculate I used
ESRIrsquos ArcGIS software suite including ArcMap version 100 and ArcCatalog version 100
to import data and geographic files to compute these values
Once the downloaded turbine fatalities and transect tables were cleaned up and
error checked they were combined into a single Excel file From this point forward all new
calculations were added as fields into a singular table In the following descriptions of this
process I will make distinctions between the original provided data tables by prefacing them
with SRC for example SRC turbine table
Method s 25
Using X Y and Z (elevation) coordinates I imported turbine data into ArcMap to
establish the historic array geographically Once the historic array was mapped sequential
annual map layers were created according to whether each turbine from the historic array
was present or not To undertake this step I referred to annual presence fields detailed on
the next page I added an elevation raster dataset from the United States Geological Surveyrsquos
National Elevation Dataset (NED) The N38122W dataset has 13 arc-second resolution
with the following bounding coordinates West -12200056 East -12099944 North
3800056 and South 3699944 I converted the raster set into a shape file and used the clip
tool to reduce its size to an area just larger than that covered by the Altamont turbine array
Clipping the elevation layer made data calculations and rendering more manageable and
nimble This clipped NED layer was used throughout this study and provides the foundation
for many thousands of calculations
Kill Turbine
This is the response variable in this study and refers to whether or not a turbine has
been responsible for killing a golden eagle This binomial variable was calculated through
Excel vertical lookup formulas that combined the turbine label and string number fields
from the SRC fatalities table to the string number and turbine id fields of the SRC turbines
table The new binomial field was populated as true for those turbine records that were
linked to golden eagle fatalities records or false for those turbines that were not associated
with any golden eagle deaths
Number of dead golden eagles
Method s 26
This variable represents the number of golden eagle fatalities per turbine per year A
ldquodead eaglesrdquo field was created in the turbine table for each year of the study and a field for
total dead eagles was included Filtering the turbine table for kill turbines populated these
fields Golden eagle records from the fatalities table were then put into a pivot table that
produced an accounting of how many eagles per year were killed The number of dead
golden eagles was then entered into the appropriate field for each turbine
The SRC fatality table includes fields for sex and age but the data collected by the
biologists at the time of discovery are not complete Fig R-3 in the results section shows the
distribution of age class for golden eagle fatalities The sex of an eagle carcass must be
difficult to establish because among the records used for this study only 2 were identified as
female and the rest were unidentified Age class can more easily be established through
feather molt sequence and patterns of color that change over the course of an eaglersquos age
(Liguori 2004 Ellis 2004) This may account for why the age records are more complete
Presence
For the purposes of this study it is necessary to determine what turbines were
present each year The SRC turbine table has installation and removal dates for many of the
records but not all of them There are no installation data for 2145 of 5463 records I
therefore assume that they were present at the beginning of the study in 1998 The remaining
3318 records were counted as present according to the published installation date The SRC
table has no removal data for 3468 records so I assumed that these 3468 turbines continued
to be present through the end of the study period 2011 Using this information annual
presence fields were added to the turbine table and were named PRE98-PRE03 PRE05-
PRE11
Method s 27
These presence fields were populated by the binomial variables true and false When
the turbine table was later imported into ArcMap for rendering these annual presence fields
were used as the source for creating presence turbine shape files in ArcMap This allowed
me to create maps of turbines present for each year Details on how these maps are created
appear in the screen id section These generated maps are critical in calculating other
variables such as end row status screen count nearest turbine model nearest turbine
distance density diversity index etc An annual presence summary table appears in the
Results section as Table R-4
Monitored amp Monitored Count
Annual presence of turbines is important in calculating numerous variables but
before testing can begin another filter must be created to account for what turbines were
monitored or not Because the array at Altamont is so large it is both financially and
logistically prohibitive to monitor or search every turbine Biologists and statisticians along
with the Scientific Review Committee have designed a monitoring protocol in which
turbines are search every 4-6 weeks There are however some turbines in the annual array
that are never monitored And there are some turbines that are monitored some years but
not others Therefore annual monitored fields were calculated
Merging the SRC turbine and transect tables produced this variable Using the
transect table as a source an Excel pivot table was created that displayed the sum of
transects for each string id for every year These data were then referenced back into the
turbine table through a vertical lookup formula using sting id as a lookup value This was
done per turbine per year The result was the creation of ldquoyearly monitored countrdquo fields for
each turbine
Method s 28
The yearly monitored count fields were copied and pasted onto the end of the
turbines table to be converted into binomial variables so that data manipulation was more
efficient Rather than monitored counts each value was converted to true or false If the
monitored count was greater than zero it was converted to True If it was zero the value
was changed to False This step provided new ways to sort and manipulate the data and
allowed for more calculations It also provided the definitive list of what turbines were
monitored for each year A summary table of annual monitored turbine counts is included in
the results section as Table R-5
An important correction was necessary before this dataset was ready to analyze
having to do with presence vs monitored status As new turbines were added into the array
they often were included into previously established turbine strings Because the monitoring
count calculations were made using the string id on the historic array table some turbines
were given credit for being monitored even before they were present This was corrected by
using the AND function formula in Excel the yearly monitored fields were checked to see if
they were getting credit for monitoring when they were not present
=AND(AE16=FALSEAS16=TRUE)
This formula checks to see whether the value in the presence was false and if the
value in the monitored field was true When cells with incorrect values were found each was
corrected in both the yearly monitored and yearly monitored count fields Once the turbine
table included yearly monitored fields it was possible to import it into ArcMap to create
turbine array maps of only monitored turbines
Turbine ID
Method s 29
As mentioned in the sections above this is a unique value for each wind turbine that
has ever been placed at the Altamont Pass Wind Resource Area Through joining the turbine
table to the SRC transect table golden eagle fatalities were permanently linked to the
characteristics of turbines that are considered responsible for each birdrsquos death
Turbine Model
The turbine model field is populated directly from the SRC turbine data table There
are 16 different models that have been present at Altamont The list of turbine models
appears in Table I-1 as well as in several tables in the results section
Elevation Slope and Aspect
These are the first three geographic placement variables considered Elevation is
height above sea level at the base of the wind turbine tower measured in meters It is
important to know if a wind turbinersquos elevation plays any role in golden eagle deaths because
the widely varying landscape throughout Altamont provides opportunities for diverse
placements of towers
Most turbines at Altamont are placed somewhere on a hillside Slope is a
measurement of prevailing pitch of the hill under which the turbine tower stands It is
measured as a proportion of the amount of elevation gain over a measured distance
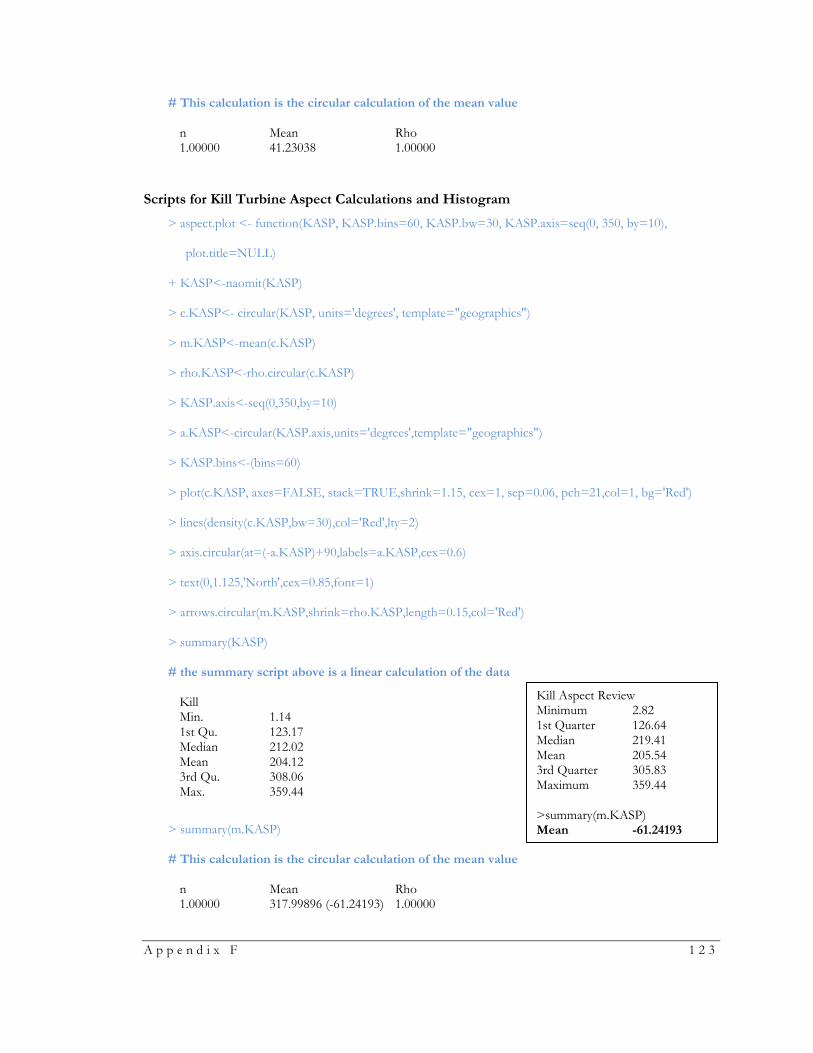
Aspect is a measurement of the prevailing direction that the hillside faces and is
measured in degrees Because it is measured in degrees it is circular data and is analyzed as
such There is a package available for R named lsquocircularrsquo that calculates circular statistics and
creates graphic displays of data It was used to analyze all aspect data for this study
Appendix F includes the R scripts and explanations for how the lsquocircularrsquo package is used
Method s 30
The majority of elevation slope and aspect values were already populated in the SRC
table but some of the more recently installed turbines had incomplete records and were
calculated using ArcMap
To calculate missing values a turbine table was imported into ArcMap and converted
into an object-oriented shape file using the X and Y coordinates for turbines placements
The 13 arc-second resolution National Elevation Dataset (NED) raster file previously
mentioned was added as a layer into the document With the NED file and turbine locations
assembled together each turbine with missing slope elevation or aspect was selected and the
missing information was displayed in the objectrsquos attribute table The data were manually
entered into the turbines table for analysis
Tower Type
This variable refers to the type of structure that elevates the actual turbine
mechanism to heights where it harnesses wind to generate electricity There are three tower
types that prevail in the Altamont array (Fig I-3) - lattice tubular and vertical axis Lattice
towers have an open architecture that somewhat resembles of the Eiffel Tower with
exposed rails and girders These types of towers may also include guy wires for additional
support Tubular towers resemble solid columns from the ground to the turbine and include
internal ladders for maintenance workers to access turbines Finally vertical axis turbines
(also known as egg-beater turbines) are a novel design They typically have two curved blades
that emanate from the base and reconnect to the top of the axis Guy wires are incorporated
for additional support Most of the records in the SRC turbine table were complete for this
field but some were calculated using other turbine records as references
Method s 31
Tower Height
The height of the tower is measured in meters from the base to the turbine axis in
horizontal axis models In vertical axis models this measurement is from the base to the top
of the axis This variable was provided in the SRC turbine table Higher tower height was
found to be linked with increased bat fatalities but not with increased bird fatalities (Barclay
2007 Thelander 2003) Due to the golden eaglersquos low elevation contour flight pattern
investigating tower height was seen as important to this study
Rotor Swept Area
Rotor swept area refers to the total space swept by wind turbine blades as they
operate This is a value that was given in the SRC turbine table for most turbines and was
converted from square feet into square meters For the towers in which the value was not
given rotor swept area was calculated by using the blade length (given in the SRC table) as
the radius in the following formula
πr2 = Area of a circle
Generating Capacity
This variable was given in the SRC turbines table and refers to the rated energy
generating capacity measured in kilowatts per turbine Generating capacity is one measure of
the size of a turbine There is a question of whether or not a smaller turbine is more
dangerous to birds If the turbine is less conspicuous or has faster spinning blades perhaps
birds would not notice the turbinersquos presence before they were struck By comparing the
generating capacity of fatal turbines to those that have not killed golden eagles one may be
able to begin finding evidence for or against some of these concepts The Altamont
Method s 32
settlement parties measure biological costs of energy production in the form of
fatalitiesmegawatthouryear and the industry uses this same metric to compare bird and
bat fatality rates of one wind farm to another
Settling Party
This is a binomial variable calculated using the SRC turbine table Preceding the
settlement agreement seasonal experimental shutdowns of some wind turbines had been
practiced Following the 2007 settlement those wind operators identified as Settling Parties
commenced a regimented seasonal shutdown program A list of turbines that were shutdown
was not available but the turbine table includes ownership information AES Seawest
Altamont Power Altamont Winds enXco and NextEra are the wind operators that are
considered settling parties so all turbines owned by those companies were marked as true
Those owned by other companies were marked false
Ridge Top Turbines
To calculate whether a turbine exists on or near a hilltop ridgeline a series of
calculations were made according to the steps outlined on ESRIrsquos support page (Article
39093 October 2011) Using the Digital Elevation raster (DEM) along with the map algebra
and hydrology toolsets line features were created that represent continual high point ridges
throughout the APWRA Briefly the hydrology toolset can be used along with a DEM to
discover watershed features and low points throughout a map This is helpful in determining
where a stream is or should be and predicting which direction water flow will occur Using
the map algebra tool all of the values in the DEM layer were multiplied by -1 This step
Method s 33
inverted the elevation layer turning the high points at Altamont into low points so the
hydrology tools could be used
The hydrology toolset picked out the lowest points and probable stream channels
Inverted these were the ridgelines or complete opposites (-1) of streambeds Ridgelines
were then exported as a separate line feature layer and added to the map The complete
sequence of steps in this calculation is available in Appendix G
Next the near tool in the analysis tools toolbox was used to calculate what turbines
in the historic array are located within 10 m of previously calculated ridgelines The historic
turbine array table was used as the input for this calculation because it is the complete list
and because the turbines never moved from the locations in that table The ridgelines shape
file was used as the near feature and a search radius of 10 m was selected This calculation
returned distance values for every turbine that was at or within 10 m of a ridgeline These
data were then joined to the turbines table as a single binomial field named RDGTP with
values of either true for those at or within the 10 m radius or false for those that were
outside of the 10 m radius
End Row Turbines
As a bird approaches a row of turbines on an intersecting path it may consider the
row as a single entity on the landscape rather than a collection of individual turbines With
the turbines as densely arrayed as they are at Altamont this idea merits consideration If a
bird attempts to fly around the turbine row rather than through it it may instead be in close
proximity to the turbines at the end of the row If this does occur then end row turbines
should have more opportunities to kill birds and should have a higher fatality count to
support this hypothesis
Method s 34
Like screen count end row turbines are determined on an annual basis Using the
annual turbine presence layers described above a visual survey of every turbine screen was
performed to determine end row turbines Standalone turbines were not considered to be in
a row and were given a value of false
Saddle
A saddle refers to a dip in ridgeline on a hill or mountain From ground level it will
appear as a depressed area between two peaks of higher elevations Another name used by
mountaineers for this feature is col With elevations between zero and 650 m above sea level
the terrain at Altamont does not offer the most dramatic examples of hill saddles but they
are present Hill saddles are of particular interest in this study because they represent
probable flight paths for birds that are intent on overcoming a ridgeline by using the lowest
elevation passage possible Turbines placed in a hill saddle would then be close to more birds
passing by therefor theoretically having an increased chance at making contact
Turbines in hill saddles were located using ArcMap Unfortunately I was not aware
of any single tool 3rd party package SQL script or formula that can easily identify hill saddles
from an elevation profile or dataset Therefore the calculations for whether or not a turbine
stands in a hill saddle are a mix of new mapping technologies and old map reading
techniques as described below
I used the contour tool in the spatial analyst toolbox The 13 arc-second resolution
NED raster was once again used as the input raster and a contour interval of 10 meters was
selected This produced a tidy polyline feature that was incorporated into the base map Hill
shades were created using the 3D analyst hillshade tool to make the map easier to read and
understand I then loaded the historic turbine array shape file and displayed the turbines
Method s 35
according to their X and Y coordinates Then I examined each of the 5463 turbines of the
historic array and characterized each as being in a hill saddle or not Turbines that were
obviously not saddle turbines due to the character of the contour lines I marked as false
For those turbines that were closer to obvious saddles I used a distance-measuring tool in
ArcMap If a turbine was within 25 m of the center of a hill saddle I marked it as true I
used 25 m as a measurement to include those turbines that were not centered in the saddle
path of which there were few Because the contour line interval was set to 10 m the
resolution is not very high Hill saddles are typically not narrow avenues Most at Altamont
were 30 - 50 meters wide measured from one contour line to the same contour line on the
other side of the saddle so a 25 m radius is reasonable
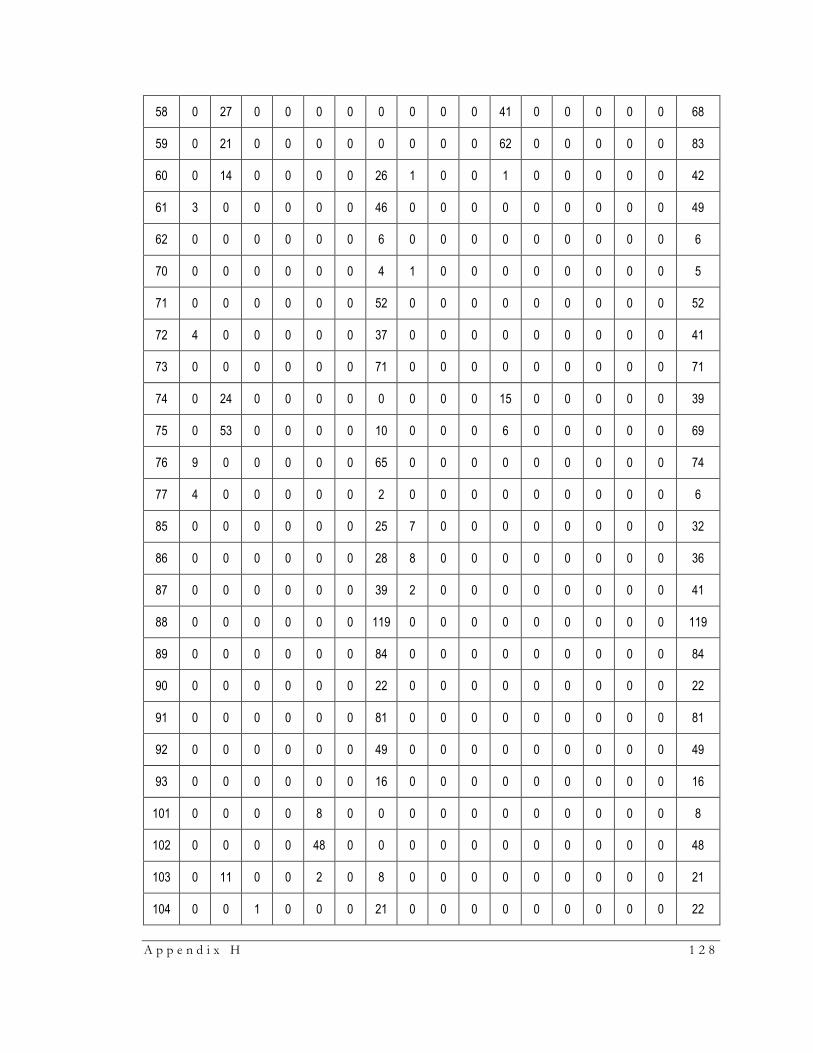
Fishnet ID
Both the turbine density and Shannon diversity index variables rely on the creation
of a parameter that defines a geographic space This was done in several steps by creating a
grid that overlays the full extent of the Altamont Pass Wind Resource Area First the buffer
tool in the proximity toolkit was used to create 100 m buffers around each turbine of the
historic array This step was done to increase the footprint of the array The buffer tool was
set to dissolve all of buffers into several large polygons in a single shape file
The next step was to run the create fishnet tool in the data management toolkit and
use the previously created footprint shape file as the extent input By using this input the
fishnet that was produced would be confined to the smallest area that would cover the entire
array Ideally the fishnet would consist of squares that were each 1000 m by 1000 m but
because of some limitations of the tool and the size and shape of the array the finalized
fishnets were not exactly that size
Method s 36
The finished fishnet grid consists of 19 rows and 16 columns (Fig M-2) Each
fishnet square measures 101176 m long by 98125 m wide This equals 99279541 m2 per
fishnet square or 0993 Km2 per fishnet square The finished fishnet grid was saved as a
polygon shapefile Using the spatial join tool in the analysis toolkit the turbine table shape
file and the fishnet polygon shape file were joined This step added new fields to the turbines
shape file attribute table that included the name of the fishnet id for every turbine record
The updated turbine attribute table with the new relationship between turbine ids and
fishnet ids was exported back into Excel for further manipulation including calculations of
fishnet diversity and density
Density
The density of the turbine array is an important variable to consider The array at
Altamont was established well before many of the best practices for wildlife collision
avoidance were created Altamontrsquos turbine towers were placed in close proximity to each
other and turbine rows are sometimes established so closely to each other that they create a
ldquowind wallrdquo It is thought that a less dense array could provide birds with more space to
maneuver through the three dimensional landscape without making contact with a turbine
Density is calculated using the turbine table with the fishnet id field and Excel pivot
tables and formulae The first step in calculating turbine density per fishnet square was to
determine which fishnet polygons contained turbines and which did not This was done with
Excel pivot tables using the updated turbine table as a data source Pivot tables were created
and filtered for turbine presence for each year These tables calculated the count of turbines
by turbine model for each fishnet id and provided a grand total of turbines per fishnet
square Fishnet squares with zero turbines were dismissed The count of turbines present per
Method s 37
fishnet id was then divided by 0993 Km2 the area of each fishnet sq This gave each fishnet
id a measure of turbines per square kilometer per year These density values were then
added to the turbines table by way of the fishnet id
Shannon Diversity Index
Because this is a biological study of a complex system the diversity of actors within
that system is an important variable to consider As I calculated a measure of diversity in this
study turbines were treated as organisms (species) within the landscape and each species
being designated by its turbine model There are or have been 16 different turbine models
present at Altamont so species richness for the full historic array is 16 The turbines
however are not evenly distributed throughout the array and turbine models have varying
levels of dominance within designated smaller plots which changes annually
The question is whether or not the response variable (dead golden eagles) has a
relationship with the measure of diversity that is calculated Will the turbines that have killed
eagles be more often members of a monoculture of just one turbine model or the turbine be
a member of a more diverse array of turbine models
To calculate a measure of turbine diversity the fishnet squares shape file and the
turbine table were used Excel pivot tables were used extensively to produce output tables
that described each fishnet square and the count of each turbine model within it An
example of this pivot table is the table for 1999 shown in Appendix H Once tables were
created for each year of the study they were merged together to produce a Shannon diversity
index
The Shannon index is a widely used measure in biology and ecology although it was
originally developed in the telecommunications industry It is considered a suitable measure
Method s 38
of habitat diversity (Brower 1997) as it accounts for both evenness of species presence as
well as overall abundance The formula is
where H is the Shannon diversity index (Shannon 1948) and pi is the proportion of total
number of species in the community made up of the ith species
The final calculation expresses the Shannon index as eH This calculation was
completed for every fishnet square that contained at least one turbine and for every year of
the study The Shannon index values were then joined to the turbines table through the
fishnet id field
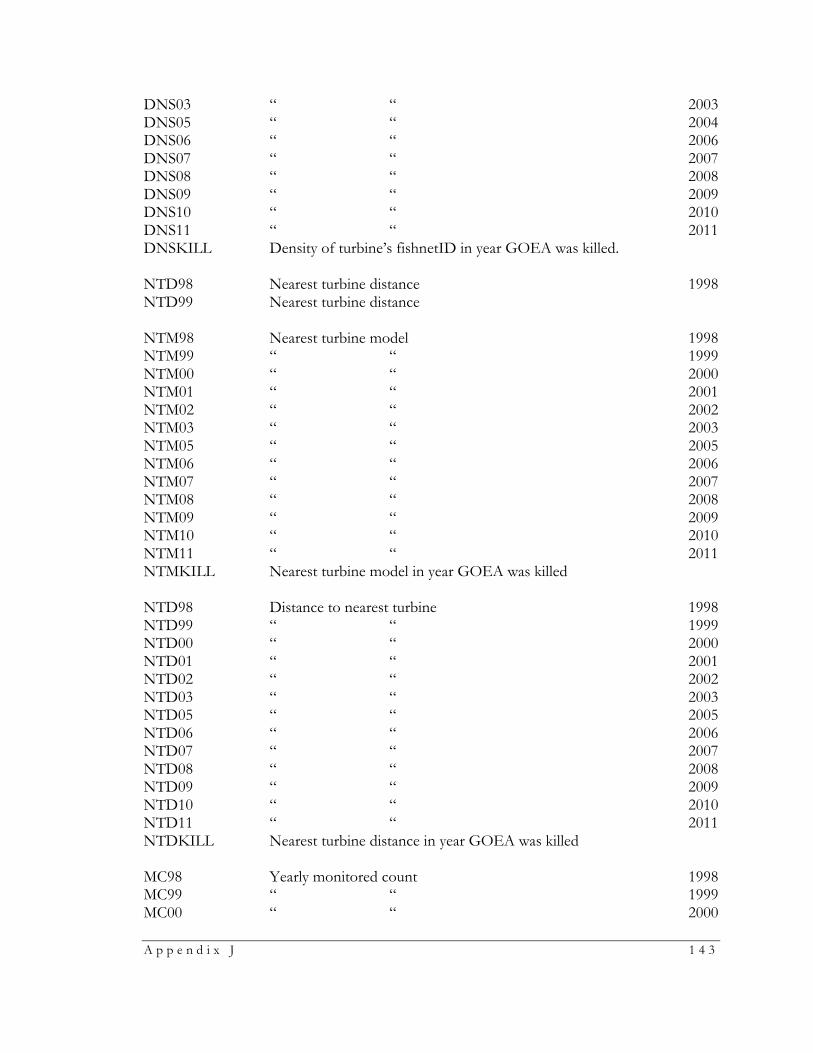
Nearest Turbine Distance
The proximity of the nearest turbine may be a factor in bird collisions with wind
turbines The array at Altamont is in some places quite densely arranged with turbines as
close as eleven meters from one another Using the ldquonearrdquo tool in ArcMaprsquos proximity
toolkit the distance was calculated between a turbine and the turbine closest to it It was
necessary to calculate this for every year of the study The near tool adds new fields into the
turbine attribute table including the object id of the nearest turbine and the calculated
distance The attribute tables were exported back into Excel and the vertical lookup formula
was used to populate the turbine table with these new nearest turbine distance field values
Screen ID and Screen Count
In efforts to simplify monitoring efforts at Altamont turbines were organized by
project sites and strings Project sites were operated by individual companies and strings
were rows of contiguous turbines After many turbine removals and new installations some
Method s 39
of these classifications were not appropriate measures for geographic analysis To investigate
how a line of contiguous turbines might affect the response variable new fields were created
as required
Turbine screens refer to landscape-level entities composed of a consecutive
unbroken line of turbines As turbines were added to or removed from the array turbine
screens would lengthen shorten or dissolve entirely so screen ids and screen counts were
calculated for each of the thirteen years of this study
To do this the historic arrayrsquos attribute table was sorted through a structured query
language (SQL) formula selecting only the turbines present in 1998 This new subset of
turbines present in 1998 was exported as a data table into the same ArcMap document The
1998 presence turbine file underwent previously described conversions and was added as a
shape file named Pre98 This sequence of creating turbine presence shape files was
completed for each year of the study
Turbine counts for each screen were determined through visual inspection of the
annual presence layers created in ArcMap When a screen appeared to have a gap in the
middle (due to removals or repowering) then the distance tool was used to determine if the
distance between turbines on either side of the gap was wider than 70 meters If it was then
the screens were considered separate
The following criteria were used to determine screen membership Standalone
turbines that were more than 70 meters from the next closest turbine were considered single
member turbine screens Each was given a screen count of 1 and a screen id that equaled its
turbine id
Method s 40
Turbines in an easily recognizable line grouping were counted as a single screen as
long as there were no gaps more than 70 meters between a given turbine and its nearest
neighbor Each turbine was given a screen id consisting of the turbine id of the most
northerly or westerly turbine id followed by the turbine id on the most southerly or easterly
turbine id These screens had a screen count equal to the number of turbines present in the
screen In cases where screens contained ldquowind wallsrdquo or turbine screens with a visual
double stack of turbines all turbines were counted as members of one screen
Turbine Variable Testing
Variables were tested using Studentrsquos t-test and Chi-squared analysis to determine
significance of summary statistics These tests are consistent with those of previouse studies
investigating wind turbine attributes as they apply to avian fatalities (Orloff 1991 Thelander
2003) and will provide easily comparable results Chi-squared analysis was conducted on the
categorical variables including turbine model tower type settling party ridgetop end row
and saddle variables T-tests were conducted on continuous variables including elevation
slope aspect tower height rotor swept area generating capacity density diversity nearest
turbine distance monitoring count and screen count
Analysis of Demographic and Temporal Data
To produce demographic data I filtered the SRC fatality table by age class This
determined the proportion of golden eagle fatalities that were juvenile sub-adultimmature
adult and those that were undetermined After testing each turbine variable (as indicated
above) to discern which were significant and which were not I applied fatality records by age
class into each significant turbine variable This allowed me to see if any of the significant
Method s 41
turbine variables affected one age class more than another The same procedure was done
for the sex of the bird The SRC fatalities table was sorted by the sex field to determine the
proportion of golden eagle fatalities that were female male and undetermined Due to the
low fidelity of the sex data it was not compared to significant turbine variables
Temporal data was largely available in the SRC fatalities table A death date field was
already calculated for a majority of the records (109 of 134) This field was poplulated by
taking the fatality detection date and subtracting the estimated number of days dead which
was also a given field in the SRC fatalities table For those that did not have a death date no
additional calculation was made because each of these 25 records was missing a carcass age
estimation so no death date could accurately be determined Temporal trends were
graphically plotted to illustrate seasonal and monthly fatality tendencies
Method s 42
Figure M-1 Wind Turbine Tower Types
Tubular (left) lattice (middle) and vertical axis (right) tower types
Method s 43
Figure M-2 Historic Turbine Array and Fishnet Grid Altamont Pass Wind Resource Area
Interstat
e
580
Method s 44
Table M-1 Given and Calculated Turbine Table Variables
Variable Variable type Source Code
Turbine has killed a golden eagle or not
Categorical Binomial
Calculated value KILL
Number of dead golden eagles Continuous Annually calculated value D
Turbine is present in the array Categorical Binomial
Annually calculated value PRE
Turbine is monitored per year Categorical Binomial
Calculated value MON
Turbinersquos unique turbine identifier Continuous Given SRC turbine table TID
The model of the turbine Categorical Given SRC turbine table TMO
Elevation at the base of turbine Continuous Some given SRC turbine table and some calculated values
ELV
Slope of the hill where the turbine is installed
Continuous Some given SRC turbine table and some calculated values
SLP
Aspect of the hill face where the turbine is installed
Continuous Some given SRC turbine table and some calculated values
ASP
The type of tower that holds the wind turbine
Categorical Some given SRC turbine table and some calculated values
TTP
Height of the wind turbine Continuous Given SRC turbine table THT
Rotor swept area of the turbine blades
Continuous Some given SRC turbine table and some calculated values
RSA
Rated generating capacity of the turbine
Continuous Given SRC turbine table GCAP
Turbine is owned by one of the settling party
Categorical Binomial
Calculated value SP
Placement on a ridge top Categorical Binomial
Calculated value RDGTP
Placement at the end of a row of turbines
Categorical Binomial
Annually calculated value ER
Placement in the saddle of a hill ridge
Categorical Binomial
Calculated value SDDL
Unique identifier of fishnet square overlay map layer
Continuous Calculated value FISHID
Density of turbines in a fishnet square
Continuous Annually calculated value DNS
Shannon diversity index in a fishnet square
Continuous Annually calculated value DIV
Distance from turbine to nearest turbine
Continuous Annually calculated value NTD
Number of times a turbine is Continuous Annually calculated value MC
Method s 45
monitored
Unique identifier of a turbine screen
Continuous Annually calculated value SCID
Number of turbines in a screen Continuous Annually calculated value SC
Resu l t s 46
Results
Fatalities
Initial filtering of the fatalities table provided interesting results Table R-1 shows the
status id designations for all 7559 fatality records within the temporal bounds of this study
A number of redundant status ids have been removed from the data fields compared to what
is listed in Appendix A Currently only ten status ids were used Of the 7559 records 5086
are valid turbine related fatalities The other 2473 records are coded with status ids that will
disqualify them from fatality analysis conducted by the Scientific Review Committee and
were likewise eliminated from the present study
Table R-2 includes species with the most status id = 1 fatality records Rock pigeons
and European starlings top the list but the four target species for fatality reduction represent
over a quarter of all status id = 1 fatality records Small and medium unidentified birds are
those that were never identified to a taxonomic grouping Often these remains included only
bones or other body parts that were not confidently identifiable Golden eagle fatalities
account for 263 of the total
Table R-3 shows all golden eagle records listed by status id Of the 216 records 82
were not used in the current study The majority of the rejected records (66 of 82 80) were
removed because the carcass was in such a condition that the death date could not be
calculated or because the date of the death was calculated to be greater than 90 days These
elimination protocols were developed by the APWRA Scientific Review Committee to
ensure quality data and to remove as much speculation from their process of estimating bird
fatality rates I have adopted their standards of status designations in this study for the same
reasons
Resu l t s 47
Turbines
Altamontrsquos annual turbine presence arrays are detailed in Tables R-4 and R-5 Table
R-4 displays the total number of turbines present in the array for each year of the study by
turbine model 2004 is absent as there were no data available for that year Turbine presence
trends include the phasing out of the Danwin Flowind and Windmaster models and the
inclusion of the V-47 and Mitsubishi 1000A models over the duration of the study There
has been a 2682 reduction in the total number of turbines in the array during the present
studyrsquos temporal range
Monitored turbines
This study concerns turbines monitored for bird fatalities There are significant
differences among number of turbines present annually as seen in Table R-4 and the
turbines monitored as seen in Tables R-5 and R-6 The early monitoring efforts at Altamont
consisted of just 683 turbines in 1998 with searches conducted on just four turbine models
Table R-6 is similar to Table R-5 except that table values represent the proportion of
monitoring for each turbine model This proportion is important to keep in mind once the
golden eagle fatalities are joined to the turbine table and turbine models of kill turbines are
detailed
The monitoring count data in Table R-7 show a phenomenal increase in monitoring
effort in the years while the Altamont settlement agreement was finalized (2005-2007) and in
the years following This is a reflection on the amount of resources pooled to reduce bird
strikes at Altamont and it should serve to provide more confidence in the data used in the
current study
Tab
le R
-5
Tu
rbin
e P
rese
nce a
nd
Red
ucti
on
F
igu
res
Year
Mo
del
98
99
00
01
02
03
05
06
07
08
09
10
11
To
tal
53
87
53
67
53
58
53
45
53
38
53
25
50
21
48
78
47
24
44
52
42
48
39
99
39
42
Turb
ines
few
er
than
pre
vio
us
year
-2
0
-9
-13
-7
-13
-304
-143
-154
-272
-204
-249
-57
Per
cen
t le
ss
fro
m p
revio
us
year
-0
37
-01
7
-02
4
-01
3
-02
4
-57
1
-28
5
-31
6
-57
6
-45
8
-58
6
-14
3
To
tal re
duct
ion
num
ber
14
45
Per
cen
t re
duct
ion
sin
ce 1
998
268
2
Resu l t s 48
Fatalities and Turbines
Results of combining the turbine table and the fatalities table are reported herein
Table R-8 provides a list of the individual turbines (turbine id) credited with killing golden
eagles The year of the fatality as well as the turbine model are indexed Turbine ids marked
with are those that have killed more than one golden eagle Each appears in the table in
each year it caused a fatality If it killed two in one year it appears in that year one time and
the fatality count is 2
A different way to view golden eagles deaths in relation to turbine model is to
consider all turbine models Table R-9 includes all 16 turbine types and the count of dead
golden eagles per year for each turbine model In this table the grey shaded cells are all zero
values
The number of golden eagle fatality detections peaked in 2007 with 36 discoveries It
is unclear what drove so many detections in that year but the higher number was not limited
to just the golden eagle In fact each of the four target species had their highest recorded
fatality rate that year as well Table R-10 shows the 13-year fatality records for red-tailed
hawks (RTHA) burrowing owls (BUOW) American kestrels (AMKE) and golden eagles
(GOEA) This peak in fatality discoveries does not coincide directly with the peak in
monitoring seen in Table R-7 These two trends are illustrated in Fig R-18
The following pages are annual Altamont turbine array maps of monitored turbines
and locations of golden eagle fatalities found in each year Some elevation and terrain
features have been included in the map to provide context What were left out were the
turbines that were present each year but were not monitored This was an aesthetic choice
as the format of this thesis does not allow much deviation in the amount of paper real estate
Resu l t s 49
that can be used Condensing 160 Km2 into a 5 by 9 inch space would necessarily crowd the
features to the point of ambiguity
Table R-11 considers the total number of searches per turbine model and how many
golden eagle fatalities have been discovered at each The number of searches was divided by
the number of golden eagle fatalities to calculate the searcheseagle fatality figure
Turbine models have not been evenly monitored so the raw fatality count figures
must be considered in light of the monitoring count Fig R-17 illustrates this point by
measuring golden eagle fatalities on the primary y-axis (on the left) and the total number of
searches for each turbine model is measured on the secondary y-axis (on the right) Turbine
models are on the x-axis as coded numbers This figure begins to elucidate a relationship
between monitoring effort and success in detecting golden eagle fatalities By including two
y-axes a visual comparison can be made between the number of golden eagle fatalities
detected and the amount of searching that was done
Fig R-18 illustrates the total monitoring effort regardless of turbine model on the
secondary y-axis and it is coupled with golden eagle fatalities on the primary y-axis The
figure illustrates positive trend lines for both variables
Turbine Characteristics
The results of testing turbine characteristics are shown in Table R-12 below Those
values with significant differences between nonkill and kill turbines have been shaded grey
and bolded Following that is Table R-13 which contains additional summary statistics for
turbine characteristics
Summary statistics for aspect measurements of kill and nonkill turbines appear in the
table above but histograms of the data are more informative The following circular
Resu l t s 50
histograms were calculated using R Studio and the circular data package (Lund 2011) The
turbines are represented as small circles around a larger circle and placed at the degree of the
aspect of the hillside where that turbine stands The arrow in the center points toward the
mean aspect as calculated by the circular package in R The length of the arrow indicates the
relative strength of the mean calculation The dashed line outside the circle is a measure of
density for each vector
Fig R-16 represents the 5340 monitored turbines that have not killed golden eagles
The blue arrow points to the calculated mean of 412deg Fig R-17 illustrates the 134 turbines
that have killed golden eagles The red arrow at the center of the figure points toward the
mean direction of 3179deg In both figures the short length of the arrow indicates that aspect
data were not strongly skewed in any one direction or vector
Temporal Distribution Age and Sex Frequencies of Golden Eagle Fatalities
Figure R-18 is a histogram of fatalities grouped into quarters while Fig R-19 displays
fatalities by death month The summer time (3rd quarter) seems to be the most deadly at
Altamont The months of July August and September account for 450 of the fatalities
that are dated Both August and September have the largest number of deaths at 18 each
Next are July and October each with 13 fatalities
There is a problem however with these data Previously it was discussed that if death
dates could not be determined for golden eagle fatalities then the records were removed
from consideration There are 25 records without calculated death dates that have been
included in the present study as well as in fatality estimates for SRC reporting These records
are from the baseline fatality study that did not record carcass condition or estimation of
Resu l t s 51
days dead These records remain valid turbine related fatalities but ones that are missing
critical data for biological analysis
Fig R-21 combines temporal and demographic data into a single chart It shows
fatalities by age class and death month Undetermined ages and unknown death dates
dominate the graphic
Fig R-22 illustrates age class data of the 134 fatalities including 43 juveniles (321)
10 immature (75) 24 adult (179) and 57 (425) that were of undetermined age What
stands out is the large number of juvenile birds in the record This result contradicts Huntrsquos
findings that juvenile golden eagles were not killed as regularly as other age groups In that
study 1 of 117 (09) juveniles 31 of 155 (200) sub-adults and floaters and 2 of 47
(43) breeding adults were killed by turbines (Hunt 2002) It is not immediately clear why
these two findings are so divergent Perhaps research into natal origins of golden eagle
fatalities at Altamont would better describe the assemblage and yield clues as to whether the
high number of juvenile fatalities may be correlated to dispersal events
Tables R-14 through R-18 show the turbine variables that were shown to be
significant and age classes of golden eagle fatalities were used to parse the results in more
detail Finally Table R-19 shows the results of sex determination analysis
Resu l t s 52
Table R-1 All Fatality Records by Status Id
Status Id
Number of Records
Percentage of total fatalities
Status
1 5086 6728 Valid turbine related fatality
2 45 060 Fatality cannot be assigned to an animal group or size
4 33 044 Is not within 125 meters of the turbine
5 177 234 Cause of death is not turbine-related
6 827 1094 Is gt90 days dead or aged
7 370 489 Incidental or WRRS find except GOEAS
8 29 038 Injured bird except GOEA
9 38 050 Fatality without a valid search or valid detection
10 31 041 Off-site carcass used for placement only
16 923 1221 Death date could not be determined
Total 7559
Resu l t s 53
Table R-2 Top 10 Species of Status Id 1 Fatalities at Altamont 1998-2011
Species Common Name n Percentage of
Status Id 1 Records
Rock Pigeon 1180 2320
European Starling 629 1237
Red-tailed Hawk 573 1127
Western Meadowlark 544 1070
Burrowing Owl 347 682
American Kestrel 259 509
Small Unidentified Bird 229 450
Barn Owl 166 326
Golden Eagle 134 263
Medium Unidentified Bird 128 252
80 Other Species unidentified groups 897 1764
Total 5086
Target Species Sum 1313 2582
Resu l t s 54
Table R-3 Golden Eagle Fatality Records by Status Id
Status Id Record Count
Percentage of Records
Status Definition
1 134 620 Valid turbine related fatality
4 2 093 Is not within 125 meters of the turbine
5 6 278 Cause of death is not turbine-related
6 30 1389 Is gt90 days dead or aged
7 5 231 Incidental or WRRS find except GOEAs
9 2 093 Fatality without a valid search or valid detection
10 1 046 Off-site carcass used for placement only
16 36 1667 Death date could not be determined
Total 216
GOEA is the alpha code for Golden Eagles Status ID 7 is a designation for any bird fatality found first by turbine operators (WRRS) or are found dead while in the APWRA but not by biologists walking a transect A road killed bird is an example of one that would be an incidental find Golden eagles should not receive this designation and it is unclear by 5 records have been designated as status id 7
Resu l t s 55
T
ab
le R
-4
Pre
sen
ce C
ou
nt
by Y
ear
an
d T
urb
ine M
od
el
Year
Mo
del
98
99
00
01
02
03
05
06
07
08
09
10
11
250K
W
20
20
20
20
20
20
20
20
20
20
20
20
20
Bo
nus
536
536
536
536
536
536
536
536
531
522
500
498
489
Dan
win
39
39
39
39
39
39
39
39
25
0
0
0
0
En
erte
ch
170
170
170
170
170
170
169
143
143
141
136
136
133
Flo
win
d
169
169
169
169
169
169
0
0
0
0
0
0
0
Ho
wd
en
86
86
86
86
86
86
86
86
86
81
79
79
79
Ken
etec
h 5
6-1
00
33
93
33
73
33
64
33
51
33
44
33
33
31
68
30
52
30
40
28
18
26
45
24
01
23
58
KV
S 3
3
41
41
41
41
41
41
41
41
41
41
41
41
41
Mic
on
221
221
221
221
221
221
221
221
221
218
218
218
218
Mit
sub
ish
i 1000A
0
0
0
0
0
0
0
0
38
38
38
38
38
No
rdta
nk
371
371
371
371
371
371
371
371
311
306
305
304
303
Po
len
ko
12
12
12
12
12
12
12
12
12
12
12
12
12
V-4
7
0
0
0
0
0
0
31
31
31
31
31
31
31
Ves
tas
202
202
202
202
202
200
200
199
199
199
199
199
199
Win
dm
aste
r 101
101
101
101
101
101
101
101
0
0
0
0
0
Win
dm
atic
26
26
26
26
26
26
26
26
26
25
24
22
21
To
tal
53
87
53
67
53
58
53
45
53
38
53
25
50
21
48
78
47
24
44
52
42
48
39
99
39
42
Resu l t s 56
Tab
le R
-5
Mo
nit
ore
d C
ou
nt
by Y
ear
an
d T
urb
ine M
od
el
Year
Mo
del
98
99
00
01
02
03
05
06
07
08
09
10
11
250K
W
0
0
0
0
5
20
20
20
20
20
20
20
20
Bo
nus
320
320
317
314
384
206
395
399
412
411
384
471
240
Dan
win
25
25
9
10
23
14
0
0
0
0
0
0
0
En
erte
ch
0
0
0
170
170
0
143
143
143
141
136
136
132
Flo
win
d
136
136
88
5
5
0
0
0
0
0
0
0
0
Ho
wd
en
0
0
0
0
68
80
80
80
47
48
46
46
2
Ken
etec
h 5
6-1
00
0
393
422
418
21
09
19
18
10
14
10
86
15
72
14
80
13
87
15
35
12
22
KV
S 3
3
0
16
16
16
38
22
37
37
37
37
37
39
41
Mic
on
0
0
29
221
221
0
221
221
221
218
218
218
205
Mit
sub
ish
i 1000A
0
0
0
0
0
0
0
0
0
0
0
38
38
No
rdta
nk
0
0
0
0
224
312
125
125
125
120
119
118
87
Po
len
ko
0
0
0
12
12
0
12
12
12
12
12
12
0
V-4
7
0
0
0
0
0
0
31
31
31
31
31
31
5
Ves
tas
202
202
202
202
202
14
128
138
127
143
127
199
189
Win
dm
aste
r 0
0
0
0
8
8
0
0
0
0
0
0
0
Win
dm
atic
0
0
0
26
26
0
26
26
26
25
24
22
0
To
tal
683
1092
1083
1394
34
95
25
94
22
32
23
18
27
73
26
86
25
41
28
85
21
81
Resu l t s 57
T
ab
le R
-6 M
on
ito
red
Tu
rbin
es
as
a P
rop
ort
ion
of
To
tal
An
nu
al
Mo
nit
ori
ng
Eff
ort
Year
Mo
del
98
99
00
01
02
03
05
06
07
08
09
10
11
250K
W
0
0
0
0
001
008
009
009
007
007
008
007
009
Bo
nus
469
293
293
225
110
079
177
172
149
153
151
163
110
Dan
win
0
37
023
008
007
007
005
0
0
0
0
0
0
0
En
erte
ch
0
0
0
122
049
0
064
062
052
052
054
047
061
Flo
win
d
199
125
081
004
001
0
0
0
0
0
0
0
0
Ho
wd
en
0
0
0
0
019
031
036
035
017
018
018
016
001
Ken
etec
h 5
6-
100
0
360
390
300
603
739
454
469
567
551
546
532
560
KV
S 3
3
0
015
015
011
011
008
017
016
013
014
015
014
019
Mic
on
0
0
0
27
159
063
0
099
095
080
081
086
076
094
Mit
sub
ish
i 1000A
0
0
0
0
0
0
0
0
0
0
0
0
13
017
No
rdta
nk
0
0
0
0
064
120
056
054
045
045
047
041
040
Po
len
ko
0
0
0
0
09
003
0
005
005
004
004
005
004
000
V-4
7
0
0
0
0
0
0
014
013
011
012
012
011
002
Ves
tas
296
185
187
145
058
005
057
060
046
053
050
069
087
Win
dm
aste
r 0
0
0
0
0
02
003
0
0
0
0
0
0
0
Win
dm
atic
0
0
0
0
19
007
0
000
012
011
009
009
009
008
Resu l t s 58
T
ab
le R
-7
Su
mm
ary
Tab
le -
Tu
rbin
e P
rese
nce a
nd
Mo
nit
ore
d C
ou
nt
To
tals
Year
98
99
00
01
02
03
05
06
07
08
09
10
11
Turb
ines
Pre
sen
t 53
87
53
67
53
58
53
45
53
38
53
25
50
21
48
78
47
24
44
52
42
48
39
99
39
42
Turb
ines
Mo
nit
ore
d
683
10
92
10
83
13
94
34
95
25
94
22
32
23
18
27
73
26
86
25
41
28
85
21
81
Per
cen
t o
f A
rray
M
on
ito
red
127
203
202
261
655
487
445
475
587
603
598
721
553
Ind
ivid
ual
Turb
ine
Sea
rch
es
25
66
70
52
51
92
65
43
94
40
32
66
45
22
35
628
162
88
381
97
323
00
295
73
232
57
Resu l t s 59
Table R-8 Kill Turbines with Golden Eagle Fatality Census
Year Turbine Id n Turbine Model
1998 172 1 Bonus
192 1 Bonus
246 1 Bonus
263 1 Bonus
157 1 Bonus
1999 211 1 Bonus
279 1 Bonus
837 1 Kenetech 56-100
2000 174 1 Bonus
183 1 Bonus
121 1 Bonus
2001 1046 1 Enertech
157 1 Bonus
305 1 Bonus
2002 640 1 Kenetech 56-100
923 1 Kenetech 56-100
1970 1 Kenetech 56-100
2080 1 Kenetech 56-100
2223 1 Kenetech 56-100
2262 1 Kenetech 56-100
2744 1 Kenetech 56-100
2003 2221 1 Kenetech 56-100
2311 1 Kenetech 56-100
3201 1 Kenetech 56-100
4301 1 Nordtank
2005 218 1 Bonus
1679 1 Kenetech 56-100
2700 1 Kenetech 56-100
3733 1 Kenetech 56-100
2006 69 1 Bonus
166 1 Bonus
Resu l t s 60
2198 1 Kenetech 56-100
2469 1 Kenetech 56-100
2498 1 Kenetech 56-100
2734 1 Kenetech 56-100
3086 1 Kenetech 56-100
3103 1 Kenetech 56-100
3161 1 Kenetech 56-100
3165 1 Kenetech 56-100
3167 1 Kenetech 56-100
3304 1 Bonus
3736 1 Kenetech 56-100
3866 1 Bonus
4133 1 Kenetech 56-100
4217 1 Kenetech 56-100
2608 1 Kenetech 56-100
305 1 Bonus
2007
155 1 Bonus
210 1 Bonus
579 1 Kenetech 56-100
903 1 Kenetech 56-100
1149 1 Micon
1613 1 Kenetech 56-100
1665 1 KVS 33
1931 1 Kenetech 56-100
2019 1 Kenetech 56-100
2113 1 Kenetech 56-100
2219 1 Kenetech 56-100
2591 1 Kenetech 56-100
2600 1 Kenetech 56-100
2703 1 Kenetech 56-100
2752 1 Kenetech 56-100
2844 1 Kenetech 56-100
3085 1 Kenetech 56-100
Resu l t s 61
3433 1 Nordtank
3653 1 Kenetech 56-100
3738 1 Kenetech 56-100
3766 1 Kenetech 56-100
3793 1 Kenetech 56-100
3827 1 Kenetech 56-100
3848 1 Kenetech 56-100
3859 1 Kenetech 56-100
3941 1 Kenetech 56-100
4039 1 Kenetech 56-100
4048 1 Kenetech 56-100
4113 1 Kenetech 56-100
2701 2 Kenetech 56-100
3860 2 Kenetech 56-100
801 2 Kenetech 56-100
895 1 Kenetech 56-100
2008 111 1 Bonus
188 1 Bonus
213 1 Bonus
975 1 Micon
1300 1 Micon
1362 1 Howden
1588 1 Kenetech 56-100
1708 1 KVS 33
2750 1 Kenetech 56-100
2998 1 Kenetech 56-100
3073 1 Kenetech 56-100
3309 1 Bonus
3322 1 Bonus
3718 1 Kenetech 56-100
3848 1 Kenetech 56-100
5070 1 Kenetech 56-100
121 1 Bonus
Resu l t s 62
2009 201 1 Bonus
1616 1 Kenetech 56-100
1710 1 KVS 33
2307 1 Kenetech 56-100
2333 1 Kenetech 56-100
2473 1 Kenetech 56-100
3834 1 Kenetech 56-100
4036 1 Kenetech 56-100
4081 1 Kenetech 56-100
4264 1 V-47
5064 1 Kenetech 56-100
2608 1 Kenetech 56-100
895 1 Kenetech 56-100
2010 115 1 Bonus
194 1 Bonus
2207 1 Kenetech 56-100
2489 1 Kenetech 56-100
2534 1 Kenetech 56-100
2562 1 Kenetech 56-100
2585 1 Kenetech 56-100
3655 1 Kenetech 56-100
2697 1 Kenetech 56-100
2011 300 1 Bonus
322 1 Vestas
479 1 Vestas
790 1 Kenetech 56-100
2673 1 Kenetech 56-100
3759 1 Kenetech 56-100
3869 1 Kenetech 56-100
5000 1 Kenetech 56-100
2674 1 Kenetech 56-100
2697 2 Kenetech 56-100
Resu l t s 63
Table R-9 Count of Golden Eagle Fatalities by Year and Turbine Model
Year
Model 98 99 00 01 02 03 05 06 07 08 09 10 11 Totals
250KW 0 0 0 0 0 0 0 0 0 0 0 0 0 0
Bonus 5 2 3 2 0 0 1 5 2 6 1 2 1 30
Danwin 0 0 0 0 0 0 0 0 0 0 0 0 0 0
Enertech 0 0 0 1 0 0 0 0 0 0 0 0 0 1
Flowind 0 0 0 0 0 0 0 0 0 0 0 0 0 0
Howden 0 0 0 0 0 0 0 0 0 1 0 0 0 1
Kenetech 56-100
0 1 0 0 7 3 3 13 31 7 10 8 8 91
KVS 33 0 0 0 0 0 0 0 1 1 0 1 0 0 3
Micon 0 0 0 0 0 0 0 0 1 2 0 0 0 3
Mitsubishi 1000A
0 0 0 0 0 0 0 0 0 0 0 0 0 0
Nordtank 0 0 0 0 0 1 0 0 1 0 0 0 0 2
Polenko 0 0 0 0 0 0 0 0 0 0 0 0 0 0
V-47 0 0 0 0 0 0 0 0 0 0 1 0 0 1
Vestas 0 0 0 0 0 0 0 0 0 0 0 0 2 2
Windmaster 0 0 0 0 0 0 0 0 0 0 0 0 0 0
Windmatic 0 0 0 0 0 0 0 0 0 0 0 0 0 0
Annual
Fatalities 5 3 3 3 7 4 4 19 36 16 13 10 11 134
Resu l t s 64
Table R-10 Target Species Annual Fatality Count Totals
Year
Species 98 99 00 01 02 03 05 06 07 08 09 10 11 Totals
RTHA 11 50 25 13 26 17 34 102 109 63 41 26 56 573
BUOW 3 27 14 15 6 1 2 33 127 47 31 26 15 347
AMKE 3 10 11 9 14 8 6 18 54 45 39 22 20 259
GOEA 5 3 3 3 7 4 4 19 36 16 13 10 11 134
Grand Total 22 90 53 40 53 30 46 172 326 171 124 84 102 1313
Resu l t s 65
Figure R-1 Golden Eagle Fatalities and Monitored Turbines at the Altamont Pass Wind Resource Area 1998
Interstate
580
Resu l t s 66
Interstate
580
Figure R-2 Golden Eagle Fatalities and Monitored Turbines at the Altamont Pass Wind Resource Area 1999
Resu l t s 67
Figure R-3 Golden Eagle Fatalities and Monitored Turbines at the Altamont Pass Wind Resource Area 2000
Interstate
580
Resu l t s 68
Interstate
580
Figure R-4 Golden Eagle Fatalities and Monitored Turbines at the Altamont Pass Wind Resource Area 2001
Resu l t s 69
Figure R-5 Golden Eagle Fatalities and Monitored Turbines at the Altamont Pass Wind Resource Area 2002
Interstat
e
580
Resu l t s 70
Figure R-6 Golden Eagle Fatalities and Monitored Turbines at the Altamont Pass Wind Resource Area 2003
Interstat
e
580
Resu l t s 71
Figure R-7 Golden Eagle Fatalities and Monitored Turbines at the Altamont Pass Wind Resource Area 2005
Interstate
580
Resu l t s 72
Figure R-8 Golden Eagle Fatalities and Monitored Turbines at the Altamont Pass Wind Resource Area 2006
Interstate
580
Resu l t s 73
Figure R-9 Golden Eagle Fatalities and Monitored Turbines at the Altamont Pass Wind Resource Area 2007
Interstate
580
Resu l t s 74
Figure R-10 Golden Eagle Fatalities and Monitored Turbines at the Altamont Pass Wind Resource Area
Interstate
580
Resu l t s 75
Figure R-11 Golden Eagle Fatalities and Monitored Turbines at the Altamont Pass Wind Resource Area 2009
Interstate
580
Resu l t s 76
Figure R-12 Golden Eagle Fatalities and Monitored Turbines at the Altamont Pass Wind Resource Area 2010
Interstate
580
Resu l t s 77
Figure R-13 Golden Eagle Fatalities and Monitored Turbines at the Altamont Pass Wind Resource Area 2011
Interstate
580
Resu l t s 78
Table R-11 Search Effort Required per Golden Eagle Fatality
Turbine Model Count of
Eagle Fatalities Total
Searches Searches per
Eagle Fatality
250KW 0 1113 0
Bonus 30 37567 1252
Danwin 0 497 0
Enertech 1 13681 13681
Flowind 0 1965 0
Howden 1 2593 2593
Kenetech 56-100 91 107815 1184
KVS 33 3 2376 792
Micon 3 16667 5556
Mitsubishi 1000A 0 266 0
Nordtank 2 9588 4794
Polenko 0 732 0
V-47 1 1832 1832
Vestas 2 15534 7767
Windmaster 0 34 0
Windmatic 0 1564 0
Mean 13364 2465
Resu l t s 79
Figure R-14 Golden Eagle Fatalities by Turbine Model and Total Search Count
Resu l t s 80
Resu l t s 81
Table R-12 Summary Table of Test Findings
Variable Test Test Value Degrees freedom
p-value
Turbine Model
1998 x2 567 3 gt 010
1999 248 5 gt 075
2000 725 6 gt 025
2001 565 9 gt 075
2002 465 13 gt 095
2003 113 8 gt 099
2005 237 11 gt 099
2006 1093 11 gt 025
2007 1488 11 gt 010
2008 1356 11 gt 010
2009 1319 11 gt 025
2010 448 12 gt 095
2011 43 10 gt 090
Elevation t-test 234 142 002
Slope t-test -171 138 009
Aspect t-test -220 134 003
Tower Type x2 459 2 lt 005
Tower Height t-test 067 134 050
Rotor Swept Area t-test -2014 134 0046
Generating Capacity t-test -113 135 026
Settling Party x2 802 1 lt 001
Ridgetop x2 4842 1 lt 005
Resu l t s 82
End Row x2 1906 1 lt 001
Saddle x2 056 1 gt 050
Density t-test 710 145 lt 000
Shannon Diversity Index
t-test 092 140 036
Nearest Turbine Distance
t-test -199 133 0049
Monitored Count t-test -355 134 0001
Screen Count t-test 193 134 006
Resu l t s 83
Table R-13 Summary Statistics for Turbine Characteristics
Variable Turbine Min 1st Q Med Mean 3rd Q
Max σ
Elevation (m)
Kill 8424 16400 25170 25080 32270 52460 9599
Nonkill 3754 17790 28860 27050 35770 56700 10911
Slope
Kill 0000 0100 0165 0172 0220 0500 010
Nonkill 0000 0090 0140 0157 0210 0830 009
Aspect
Kill 114 12317 21202 31700 30806 35944 10631
Nonkill 003 9105 15884 4123 30010 35990 11163
Tower Height (m)
Kill 6000 6000 6000 7085 8000 16400 1893
Nonkill 2286 600 6000 6993 8000 18000 2014
Rotor Swept Area ( m2)
Kill 14131 25400 25400 29219 25855 173080 16027
Nonkill 14131 25390 25400 26424 25400 173080 13006
Generating Capacity (kWh)
Kill 400 1000 1000 1167 1000 6600 6957
Nonkill 400 1000 1000 1153 1000 10000 9841
Density
(TurbinesKm2)
Kill 298 2805 3971 4183 5560 11520 1981
Nonkill 099 3177 4567 4952 6751 11810 2609
Shannon Diversity
Index
Kill 1000 1000 1000 1345 1620 4420 063
Nonkill 1000 1000 1000 1361 1692 4419 065
Nearest Turbine
Distance (m)
Kill 1951 2438 2438 3923 3763 34390 4921
Nonkill 881 2438 2440 3068 3241 34390 1114
Monitored Count
Kill 000 700 900 903 1200 4300 635
Nonkill 100 200 700 705 1100 4400 616
Screen Count
Kill 100 500 1100 1395 2000 4900 1118
Nonkill 100 600 1200 1566 2200 5300 1166
Mean values for aspect were calculated as circular data using the R ldquocircularrdquo package All other data was calculated linearly The zero monitored count is explained by incidental finds of golden eagles not found on a search
Resu l t s 84
Figure R-16 Circular Aspect Histogram of Nonkill Turbines
Resu l t s 85
Figure R-17 Circular Aspect Histogram of Kill Turbines
Resu l t s 86
Figure R-18 Golden Eagle Fatalities by Quarter of Death Date
Resu l t s 87
Figure R-19 Golden Eagle Fatalities by Month of Death Date
Resu l t s 88
Figure R-20 Radar Chart of Golden Eagle Fatalities with Known Death Dates
Resu l t s 89
Figure R-21 Age Class and Death Dates of Golden Eagle Fatalities
Adult Immature Juvenile
Undetermined Age
Total
January 1 1
February 1 1 2 4
March 5 4 1 10
April 2 2 4
May 1 1 10 12
June 1 1 2 4 8
July 2 6 5 13
August 3 2 5 8 18
September 4 5 9 18
October 3 2 4 4 13
November 3 2 5
December 1 2 3
Unknown date 4 4 9 8 25
Total 24 10 43 57 134
Resu l t s 90
Figure R-22 Golden Eagle Fatalities by Age
Resu l t s 91
TableR-14 End Row Status by Golden Eagle Age Class
Age Class n False True
True
Difference from Total Mean
(381)
Adult 25 15 10 400 19
Immature 9 7 2 222 -158
Juvenile 42 31 11 262 -119
Undetermined 58 30 28 483 102
Total 134 83 51 381
Table R-15 Tower Type by Golden Eagle Age Class
Age Class n Lattice Tubular
Lattice
Difference from Total Mean
(709)
Adult 25 14 11 560 -149
Immature 9 6 3 667 -42
Juvenile 42 27 15 643 -66
Undetermined 58 48 10 828 119
Total 134 95 39 709
Table R-16 Rotor Swept Area by Golden Eagle Age Class
Age Class n Average
(m2)
Difference from Total Mean (29219) m2
Adult 25 30303 1084
Immature 9 34990 5771
Juvenile 42 26735 -2484
Undetermined 58 29656 437
Total 134 29219
Resu l t s 92
Table R-17 Ridgetop Status by Golden Eagle Age Class
Age Class n False True
True
Difference from Total Mean
(52)
Adult 25 25 0 00 -52
Immature 9 8 1 111 59
Juvenile 42 39 3 71 19
Undetermined 58 55 3 52 -01
Total 134 127 7 52
Table R-18 Nearest Turbine Distance by Golden Eagle Age Class
Age Class n Mean (m)
Difference from Total Mean (3923) m
Adult 25 3457 -466
Immature 9 3267 -655
Juvenile 42 3152 -770
Undetermined 58 4783 860
Total 134 3923
Table R-19 Sex Ratio of Golden Eagle Fatalities
Sex n Percentage of Total
Female 2 15
Male 0 00
Undetermined 132 985
Total 134
Discuss ion 93
Discussion
In this study I characterized the wind turbines of the Altamont Pass Wind Resource
Area according to geographic placement properties and by innate characteristics of the
turbine model This was done to test the hypothesis that certain of these characteristics may
make individual turbines more deadly to golden eagles Of the 5086 valid turbine related
fatalities during the study period 134 were golden eagles These 134 golden eagles were
killed by 123 individual wind turbines out of the 5400 that stand at Altamont The data
indicate that there are significant differences between turbines that have killed golden eagles
and those that have not killed golden eagles do exist
Innate Turbine Characteristics
Among innate characteristics the differences in frequencies of tower types was
significant (plt005) In kill turbines the lattice tower occurred more frequently - 709 of
kill turbines were on lattice towers tubular towers accounted for the remaining 291 No
vertical axis tower turbines resulted in golden eagles fatalities Among nonkill turbines lattice
towers constitute 588 while tubular towers make up 399 of the array Vertical axis
towers account for the remaining 13 Thus turbines built on lattice-structured towers
occur at higher rates among kill turbines A potential rationale for this lies in that birds are
often seen perched in or on the open lattice of the tower structure so there may be an
additional attraction to these turbine tower types for resting or roosting that results in a
disproportionate number of fatalities
The difference between the mean values of rotor swept areas of kill turbines and
nonkill turbines is also significant (p = 0046) For kill turbines mean rotor swept area was
2922 m2 while nonkill turbines mean value was smaller at 2642 m2 This finding is
Discuss ion 94
somewhat counterintuitive in that it has been posited that in order to make a turbine array
safer operators should concentrate on installing fewer larger turbines This idea leads to a
lower density turbine array with towers that have longer blades spinning over a greater area
Longer slower blades it is thought should be easier for a bird to notice and to avoid
Smaller blades (with a corresponding smaller rotor swept area) spin at a faster rate and are
theoretically more difficult for birds to detect and avoid This idea is at the heart of the
Altamont repowering scheme in which many smaller turbines are currently being removed
and replaced by fewer larger turbines Perhaps the speed of the turbine propellers has
nothing to do with killing golden eagles Instead turbines with larger rotor swept areas may
have the ability to swing out further and make contact with passing eagles Like a boxer with
a reach advantage a longer turbine blade can strike from a further distance
Of the innate characteristics that were not significant the results of the turbine
model chi-squared tests were most surprising The Kenetech 56-100 turbine model has been
responsible for 679 of the known turbine related golden eagle fatalities at Altamont yet
statistically this figure is not significant This is of course because this model makes up a
large portion of the monitored array each year between 360 (1999) and 739 (2003) of
all turbines searched This result is consistent with Huntrsquos study where he found 73 (27 of
42) of the golden eagles killed at Altamont were killed by Kenetech turbines (Hunt 2002)
Huntrsquos study did not publish statistical analysis such as was conducted in this study
Nevertheless the authors conclude that areas that containing the Kenetech turbine type are
more hazardous to golden eagles Thelander did calculate through chi-square analysis that
turbine model was significant in golden eagle fatalities but those results showed that the
Bonus model being more represented in kill turbines (Thelander 2003)
Discuss ion 95
Generating capacity was another innate characteristic that did not show a significant
difference between kill and nonkill turbines Among all of the variables tested this one was a
bit more abstract and had the least potential to interact with any golden eagle at Altamont It
would have been a surprise had generating capacity been significantly different in kill
turbines Thelanderrsquos study concurs that generating capacity is not significant (Thelander
2003) The differences in tower height between kill and nonkill turbines also are not
significant and once again Thelanderrsquo results agree
Geographic Placement Characteristics
Among the geographic placement characteristics with significant differences is
elevation aspect settling party ridgetop end row turbine density nearest turbine distance
and monitored count variables The elevation data show that when golden eagles are killed
the turbines are at a mean elevation of 2508 m 20 m lower than the mean elevation of
nonkill turbines at 2705 m This lower elevation also fits with the finding that kill turbines
were found significantly less frequently on hilltop ridgelines than nonkill turbines (p lt005)
Of the 134 kill turbines only 7 were on ridgelines This is just 52 while the nonkill rate of
ridgeline turbines was 112 The proportion of turbines that were on ridgelines was lower
than I had expected to find I assumed that ridgelines represented some of the best areas to
capture eolian energy and that there would be more than just 11 of turbines there If this
assumption is true then perhaps the method I used to calculate ridgelines was too strict to
accurately identify them all Or it may be that the ridgelines are not the best locations to
capture wind resources or that ridgelines are difficult to develop into turbine locations
Hill aspect was also found to be significantly different between killer turbines and
nonkill turbines The mean aspect for kill turbines was 317degwhile nonkill turbines were on
Discuss ion 96
slopes oriented towards 41deg This means that the average direction of the hillside of a kill
turbine faces northwest while the nonkill average faces northeast The histograms calculated
in R (Fig R-16 and R-17) illustrate that in neither group do a large proportion of turbines
reside on a hillside that faces west or southwest where the prevailing winds come from at
Altamont I have no doubt that the engineers and surveyors that site turbines know very well
what they are doing but it was a surprise for one of my assumptions to be dismantled
Aspect was shown as not significance Orloffrsquos (1992) and Thelanderrsquos studies (2003)
Among the more interesting findings is that the turbines that killed golden eagles
were in a less dense array and further away from the next nearest turbine neighbor The
mean measure of density of kill turbines was 4183 turbines per Km2 while the mean density
for nonkill turbines was higher at 4985 turbines per Km2 The next nearest turbine for a kill
turbine had a mean distance of 392 m while the nonkill turbinesrsquo nearest turbine neighbor
was closer at a mean distance of 307 m Both of these measurements indicate that kill
turbines are not among the densest most closely arrayed turbine groupings This concurs
with Orloffrsquos findings that turbines with lower structure density had significantly higher
mortality rates for both raptors and non-raptors (1992)
The measure of density used in this study however is not without flaws Both the
diversity and density calculations are based on a grid made of nearly 1 Km2 polygons that
was calculated and rendered in ArcMap This grid is a static layer based on of the maximum
extent of Altamontrsquos turbine array and it has enabled a number of simple calculations in the
current study This grid also represents a single sample and single measurement of the space
A more robust study would recalculate the grid a number of times after random placements
over the array By doing this many measurements would be taken and average values could
be calculated that better represent the space The same measurements of diversity and
Discuss ion 97
turbine density within the space could be better analyzed A sampling regime such as this
may potentially provide more reliable results An alternative for these calculations would
have been to generate a 500-1000 meter buffer around each turbine calculated annually and
use those buffer zones as polygons to calculate a diversity index and density figure This
technique would establish each turbine as the center of its own zone and may lead to a better
description of the turbinersquos relationships with its nearest neighbors and other geographic
features It would be interesting to see how the measurements of density may change
depending upon how the samples are taken Would a density measure based on each turbine
as the center of its own territory yield a more accurate result and would it support the
finding reported herein that kill turbines are found in a less dense array
Comparing nonkill and kill turbines that are at the end of turbine rows demonstrates
another area of significant difference between the two groups Of the 134 kill turbines
381 were end row turbines while only 224 of nonkill turbines were end row features If
this is indeed a variable that influences golden eagle fatalities then the repowering plan at
Altamont may be creating additional danger for golden eagles As turbines are being
removed the long rows (ldquoscreensrdquo in this study) are being broken up to create more gaps
with the idea that the long rows constitute a dangerous impediment to birds One of the
effects of this practice is to create more end row turbines If a row of turbines is broken in
the middle by removing three units then two more end row turbines are established on
either side of the removals In this study there was no significant difference between screen
counts of kill and nonkill turbines so my findings do not support the practice of breaking
apart long turbine rows into smaller entities
The difference in monitored count mean values between kill and nonkill turbines
was found to be significant (p = 0001) Although the mean values are not largely disparate at
Discuss ion 98
903 for kill turbines and 705 for nonkill turbines it makes logical sense that golden eagle
fatalities will be found at turbines that are searched more often An average of two additional
searches at the kill turbines may have made a difference in detecting an individual bird
fatality
The differences between kill turbines versus nonkill turbines have also been found to
be significant in the character of settling party Every single turbine credited with a golden
eagle death is owned by one of the wind operator settling parties at Altamont Among the
nonkill turbines a small portion 58 are not owned by any member of the settling party
This figure is suspicious because monitoring for bird fatalities was a condition of the
settlement and is paid for in part by wind operators and Alameda County as part of the
settlement It does not make complete sense that turbines are being monitored unless it was
under an alternative arrangement that I am unaware of This could also be an indication that
there is error in the data that must be rectified This variable was included in the study to
determine if there was a difference between settling party turbines some of which go
through seasonal shutdown (as part of the settlement) and those that do not go through the
seasonal shutdown I do not have confidence in the veracity of the data in this field so I do
not find that it supports or doesnrsquot support my hypothesis
The data also do not support differences in saddle turbines or turbine diversity as
significant between kill and nonkill turbines The Shannon index mean values between the
two groups are nearly indistinguishable at 134 for kill turbines and 136 for nonkill turbines
Just two kill turbines are located on hilltop saddles (15) while slightly more nonkill
turbines reside there (25)
Temporal Distribution Age and Sex Frequencies
Discuss ion 99
The most deadly time of the year for golden eagles at Altamont is during the months
of July August and September This corresponds with Altamontrsquos windy season and follows
the breeding period that starts at the beginning of the year (Hunt 1995) This is well
illustrated in the radar chart (Fig R-20) where the bulk of fatalities are seen to occur
between July and October with two noticeable spikes in March and May The lack of
fatalities recorded in the wintertime may be due in part to the seasonal shutdowns of
turbines in the off season or it could be a reflection of less golden eagle activity during that
time of year
The age class data provides an interesting look at the assemblage of fatalities Most
notable are the large number of juveniles (n=43) and the great number of fatalities with
undetermined age (n=57) As was suggested earlier the juvenile number is out of agreement
with Huntrsquos study (2002) where juveniles were a small percentage of fatalities caused by wind
turbines It is possible the numbers reported here for juvenile fatalities are skewed young
depending upon the criteria used by field biologist when they determined the age class of the
bird at time of detection This idea is supported by the low numbers of immature bird
fatalities (n=10) A population census including age class distributions of golden eagles at
Altamont has not been published but Hunt suggested a hypothetical population that
consisted 280 adults (307) 169 immature (509) and 101 juveniles (184) for a
population of 550 at equilibrium (1995) These figures suggest that immature birds make up
half of the population but in the present study they only account for 74 of the fatality
data tested It is possible that immature birds possess some behavioral trait that keeps them
relatively safe from turbine strikes but a more parsimonious explanation is that their low
number is a relic of mischaracterization at time of discovery Juvenile birds are those that are
in their first year of life and it is reasonable to think that a biologist may mistake a carcassrsquos
Discuss ion 100
plumage patterns as those of a younger bird The other possibility is that there is no error in
the age class designations of golden eagle fatalies and juvenile birds are killed by turbines at
Altamont at disproportionate rate compared to Huntrsquos suggested population age class
distribution This would be a disturbing trend because without replacement or recruitment
from outside golden eagle poplulations a higher death rate for juveniles at Altamont would
eventually lead to a collapse which has yet to happen
The results of the sex ratio analysis of the 134 fatalities do not provide much insight
into which sex is more or less disposed to fatal turbine interactions With only 2 of 134 birds
being positively characterized there is little that can be discussed The other 132 birds were
not characterized as either female or male so the sex of these records remains a mystery
The undetermined ages of 430 (58 of 134) of the sample makes it difficult to
detect trends in age class mortality but when looking at age classes and significant turbine
variables several interesting results appear Considering end row status Table R-14 shows
that for non-adult birds (n=51) the percentage killed by end row turbines is cumulatively
255 (13 of 51) which is lower than the average for all fatalities of 381 This is then
offset by the 58 undetermined birds that were more often killed by end row turbines (28 of
58 483)
Fewer adult birds were killed at lattice towers (10 of 25 560) than the average of
709 but again the undetermined birds (n=58) were killed by lattice tower turbines 828
of the time (48 of 58) In fact all birds with determined age classes were killed at lattice
tower turbines less than the calculated mean (Table R-15)
Rotor swept area (Table R-16) showed differences among age classes with juvenile
birds falling victim to smaller turbines on average and immature birds tending toward larger
Discuss ion 101
blade diameters Four of 51 non-adults (78) were killed by ridgetop turbines This is
higher than the calculated mean of 52
Each of the mean nearest turbine distances for all fatalities with classified age classes
are below the total mean of 3923 meters This mean is balanced by the higher than average
nearest turbine distance for fatalities of undetermined age (Table R-18)
C o n c l u s i o n s 1 0 2
Conclusions
There are characteristics of wind turbines fatal to golden eagles at Altamont that are
significantly different from characteristics of those turbines that do not result in fatalities
Among the differences are that kill turbines are found at lower elevations and the aspect of
the hill where the kill turbine averages 317deg while nonkill turbines face 41deg on average
Kill turbines are more often situated on lattice structure towers and they have larger
rotor swept areas than nonkill turbines Kill turbines are placed in less dense turbine arrays
and are less often placed on top of ridgelines Compared to nonkill turbines they have a
longer distance to the next nearest turbine and they are monitored more often Finally kill
turbines are more often situated at the end of a turbine row than are nonkill turbines
Among the characteristics that are not significantly different between kill and nonkill
turbines are the slope of the hill upon which a turbine stands the model of turbine height of
the turbine tower generating capacity diversity of the turbine array the number of other
turbines in its row and whether or not the turbine stands in the saddle of a hilltop ridge
Future Directions
The tests conducted in this study are simple but they reflect the standard approaches
to measuring wind turbine interactions with birds These tests however cannot explain how a
wind turbine is more or less capable or better equipped or better placed to result in a golden
eagle fatality Multivariate analysis on these and other characteristics of wind turbines may be
able to fill in more of our understanding of why and how eagles are killed
Perhaps one way to better understand why some turbines have killed golden eagles
would be to perform duplicate studies of turbine characteristics as they apply to fatalities of
other species By analyzing characteristics that may be important in turbines that result in
C o n c l u s i o n s 1 0 3
fatalities of rock dove red-tailed hawks American kestrels or any of the other often killed
birds at Altamont it may become in a comparative framework more clear which elements
apply to only to golden eagles and which do not
Potential extensions of this research include a further analysis of the remaining
turbines and how many of them fall into a range of values that this study has found
significant This could lead to predictive modeling of future fatalities and could better inform
fatality reduction efforts A more robust study also could be conducted using more tools in
ArcMap LiDAR data and three-dimensional modeling to better understand the terrain and
flight paths of golden eagles and other raptors that frequent Altamont
Efforts to reduce bird deaths at Altamont have attracted many brilliant thinkers
impassioned activists field biologists business people and scientists all in the service of
reducing the damages to bird populations There are some common-sense solutions that
seem to have not gotten to the table For example of the 123 turbines that have killed
golden eagles at Altamont 84 remain present and in operation Among these turbines with
the ids 305 2674 895 and 2608 still stand Each of these four turbines has already killed two
golden eagles during the timeframe of this study Also turbine 2697 is still present in the
array It is already responsible for three golden eagle fatalities In 1994 California enacted a
three strikes law that provided stiff penalties for habitual felony offenders this law has
arguably had some success in curbing violent crimes Perhaps the wind operators could offer
a similar penalty for those turbines that are found to habitually kill protected species
A c k n o w l e d g m e n t s 1 0 4
Acknowledgments
I must acknowledge the teachers in my life that have inspired me to pursue biology
as a topic of study an area of wonder and as a professional calling Among them are the
members of my thesis committee Drs Luis A Ruedas Deborah A Duffield and Michael T
Murphy as well as Craig Tufts Dr Robert Pinger and Tom Brown Jr
I must acknowledge and thank those field biologists that for years collected data
walking transects searching for the slightest hint of a feather I donrsquot know your names but
I thank you for the project I do however know Levin Nason Doug Leslie Karl Dickman
Jesse Schwartz and Chip McConnaha all of whom work on the Altamont project at ICFI
and informed this research
Finally I acknowledge and thank my wife Laura for her support and patience as I
began and finally completed this research
P h o t o C r e d i t s 1 0 5
Photo Credits
Tubular httpwwwpowerworkscomPicturesWEG-turbine-string-lo-res_bJPG Lattice httpmatrixwindsolutionscomkenetech-kvs-33-wind-turbineprettyPhoto[4689]0 Vertical axis httpwwwfiddlersgreennetmodelsmiscellanousWind-Turbinehtml
R e f e r e n c e s 1 0 6
References
Aiken R amp Harris A (2011) Deer Hunting in the United States Demographics amp Trends Addendum to the 2006 National Survey of Fishing Hunting and Wildlife Associated Recreation 2006-10 Retrieved from httpdigitalmediafwsgovcdmrefcollectiondocumentid207
Applegate R D Berger DD Chochran W W Raim A J (1987) Observations of a Radiotagged Golden Eagle Terminating Fall Migration J Raptor Res 21 68-70
American Wind Energy Association (2012) Wind Industry Statistics Quarterly Report 2012(4)
Barclay R M R Baerwald E F amp Gruver J C (2007) Variation in bat and bird fatalities at wind energy facilities assessing the effects of rotor size and tower height Can J Zool 85(3) 381-387 doi 101139Z07-011
Bortolotti G R (1984) Age and Sex Size Variation in Golden Eagles Journal of Field Ornithology 55(1) 54-66 Retrieved from httpwwwjstororgstable4512857
Brower J E Zar J von Ende CN (1998) Field and Laboratory Methods for General Ecology Fourth ed WCBMcGraw-Hill 1998
California Energy Commission (2007) California Guidelines for Reducing Impacts to Birds and Bats From Wind Energy Development CEC-700-2007-008-CMF 125
Cameron E S (1908) Observations on the Golden Eagle in Montana The Auk 25 251-68
Carnie S K (1954) Food Habits of Nesting Golden Eagles in the Coast Ranges of California The Condor (56)1 3-12
Collopy M W (1983) A Comparison of Direct Observations and Collections of Prey Remains in Determining the Diet of Golden Eagles The Journal of Wildlife Management 47(2) 360-368 Retrieved from httpwwwjstororgstable3808508
Collopy M W (1983) Foraging Behavior and Success of Golden Eagles The Auk 100(3) 747-749 Retrieved from httpwwwjstororgstable4086484
Coonan T J Schwemm C A et al (2005) Decline of an Island Fox Subspecies to Near Extinction The Southwestern Naturalist (50)1 32-41
Dixon J B (1937) The Golden Eagle in San Diego County California Condor 49-56
R e f e r e n c e s 1 0 7
Edwards T C J amp Collopy M W (1983) Obligate and Facultative Brood Reduction in Eagles An Examination of Factors That Influence Fratricide The Auk 100(3) 630-635 Retrieved from httpwwwjstororgstable4086464
Edwards T C J amp Kochert M N (1986) Use of Body Weight and Length of Footpad as Predictors of Sex in Golden Eagles Journal of Field Ornithology 57(4) 317-319
Ellis D H (2004) Mottling in the Plumage of Juvenile Golden Eagles North American Bird Bander (29)2 53-58
Erickson W P Johnson G D Strickland M D Young Jr D P Sernka K J amp Good R E (2001) Avian Collisions with Wind Turbines A Summary of existing studies and comparisons to other sources of avian collision mortality in the United States 62 Retrieved from httpwwwostigovenergycitationsproductbibliojsposti_id=822418
Esri Knowledge Base- Technical Articles (2011) How To Identify ridgelines from a DEM Article ID 39093 Retrieved from httpsupportesricomenknowledgebasetecharticlesdetail39093
Franson J C L Sileo and N J Thomas 1995 Causes of eagle deaths Page 68 in E T LaRoe G S Farris C E Puckett and P D Doran editors Our Living Resources A Report to the Nation on the Distribution Abundance and Health of the US Plants Animals and Ecosystems US Department of the Interior National Biological Service Washington DC USA
Golden Gate Audubon Society Ohlone Audubon Society et al (2007) S1 Final Settlement Agreement 10 Retrieved from httpwwwaltamontsrcorgalt_docalt_settlements1_board_approved_settlement_agreement(55464923_1)pdf
Good R E Nielson R M et al (2007) A Population Estimate for Golden Eagles in the Western United States Journal of Wildlife Management (71)2 395-402
Harmata A R amp Restani M (1995) Environmental contaminants and cholinesterase in blood of vernal migrant Bald and Golden Eagles in Montana Intermountain Journal of Science 1 1-15
Hoover S L (2002) The Response of Red-Tailed Hawks and Golden Eagles to Topographical Features Weather and Abundance of a Dominant Prey Species at the Altamont Pass Wind Resource Area California NRELSR-500-30868 Retrieved from httpwwwostigovenergycitationsproductbibliojsposti_id=15000694
Hunt G Jackman R E Brown T L Gilardi J G Driscoll D E amp Culp L (1995) A Pilot Golden Eagle Population Study in the Altamont Pass Wind Resource Area California
R e f e r e n c e s 1 0 8
Hunt G Jackman R E Hunt T L Driscoll D E amp Culp L (1999) A Population Study of Golden Eagles in the Altamont Pass Wind Resource Area Population Trend Analysis 1994-1997 NRELSR-500-26092 32 Retrieved from httpwwwnrelgovwindpdfs26092pdf
Hunt G (2002) Golden Eagles in a Perilous Landscape Predicting the Effects of Mitigation for Wind Turbine Bladestrike Mortality P500-02-043F 52
Hunt G Burnham W Parish C N Burnham K K Mutch B amp Oaks J L (2006) Bullet fragments in deer remains implications for lead exposure in avian scavengers Wildlife Society Bulletin 34(1) 167-170
ICFI International (2011) Altamont Pass Wind Resource Area Bird Fatality Study M(21)
Kochert M N amp Steenhof K (2002) Golden Eagles in the US amp Canada Status Trends amp Conservation Challenges Journal of Raptor Research 36(1 Supplement) 32-40 Retrieved from httpfrescusgsgovproductspapers1092_Kochertpdf
Kochert M N Steenhof K Mcintyre C L amp Craig E H (2002) Golden Eagle (Aquila chrysaetos) The Birds of North America Online Ithaca Cornell Lab of Ornithology Retrieved from httpbnabirdscornelledubnaspecies684
Leslie D Schwartz J amp Karas B R (2012) Altamont Pass Wind Resource Area Bird Fatality Study Bird Years 2005-2010 M(87) 171
Liguori J (2004) How to Age Golden Eagles Techniques for Birds Observed in Flight Birding (36)3 278-283
Lund U Agostinelli C (2011) Circular Statistics Package lsquocircularrsquo Circular Statistics (version 04-3) URL httpsr-forger-projectorgprojectscircular
Lutmerding J A amp Love A S (2013) Longevity Records of North American Birds Version 20131 Patuxent Wildlife Research Center Bird Banding Laboratory Laurel MD
McIntyre C L amp Collopy M W (2006) Postfledging Dependence Period of Migratory Golden Eagles (Aquila chrysaetos) in Denali National Park and Preserve Alaska The Auk 123(3) 877-884 Retrieved from httpenvironmentunreduacademyaboutCollopyPubsMcIntyreCollopy2006pdf
Menkens G E J amp Anderson S H (1987) Nest Site Characteristics of Predominantly Tree-nesting Population of Golden Eagles Journal of Field Ornithology 58(1) 22-25
National Renewable Energy Laboratory (2010) Estimates of Windy Land Area and Wind Energy Potential by State for Area gt=30 Capacity Factor at 80m Retrieved from httpwwwwindpoweringamericagovpdfswind_mapswind_potential_80m_30percentpdf
R e f e r e n c e s 1 0 9
National Research Council (2007) Environmental Impacts of Wind-Energy Projects
Olendorff R R (1976) The Food Habits of North American Golden Eagles American Midland Naturalist 95(1) 231-236 Retrieved from httpwwwjstororgstable2424254
Omland K S amp Hoffman S W (1996) Seasonal Diel and Spatial Dispersion Patterns of Golden Eagle Autumn Migration in Southwestern Montana The Condor (98)3 633-36
Orloff S G amp Flannery A (1992) Wind Turbine Effects on Avian Activity Habitat Use and Mortality in Altamont Pass and Solano County Wind Resource Areas 1989-1991 P700-92-401
Pattee O H Bloom P H Scott J M amp Smith M R (1990) Lead Hazards within the Range of the California Condor The Condor 92(4) 931-937 Retrieved from httpwwwjstororgstable1368729
Phillips R L J L Cummings et al (1996) Golden Eagle Predation on Domestic Calves Wildlife Society Bulletin (24)3 468-70
Scientific Review Committee Altamont Pass Wind Resource Area (2007) Altamont Pass Wind Resource Area Bird and Bat Mortality Monitoring Protocols (M)1 Retrieved from httpwwwaltamontsrcorgalt_docM1_APWRA_monitoring_protocol_7_11_07pdf
Scientific Review Committee Altamont Pass Wind Resource Area amp Chatfield A (2008a) Determination of Cause of Death Protocol (M)11 Retrieved from httpwwwaltamontsrcorgalt_docm11_cause_of_death_protocolpdf
Scientific Review Committee Altamont Pass Wind Resource Area (2008b) Working Decision Tree for Altamont Bird Fatality Data Filtering (M)26 Retrieved from httpwwwaltamontsrcorgalt_docm26_decision_tree_for_bird_fatality_data_filteringpdf
Smallwood K S amp Neher L (2004) Repowering the APWRA Forecasting and minimizing avian mortality without significant loss of power generation CEC-500-2005-005 Retrieved from http2011giftbiologicaldiversityorgcampaignsprotecting_birds_of_prey_at_altamont_passpdfscec-repoweringpdf
Smallwood K S amp Thelander C (2001) Bird Mortality At the Altamont Pass Wind Resource Area March 1998-September 2001 NRELSR-500-36973 411
Strickland M D Arnett E B et al (2011) Comprehensive Guide to Studying Wind Energy Wildlife Interactions National Wind Coordinating Collaborative 289
R e f e r e n c e s 1 1 0
Thelander C G Smallwood K S amp Rugge L (2003) Bird Risk Behaviors and Fatalities At the Altamont Pass Wind Resource Area Period Performance March 1998 - December 2000 NRELSR-500-33829 86
Tigner James R (1973) Golden Eagle Predation on a Pronghorn Fawn The Southwestern Naturalist 18 346-48
US Department of Energy (2008) 20 Wind Energy By 2030 Increasing Wind Energyrsquos Contribution to US Electricity Supply DOEGO-102008-2567 248
US Government Accountability Office ldquoImpacts on Wildlife and Government Responsibilities for Regulating Development and Protecting Wildliferdquo US Government Accountability Office Washington DC GAO-05-906 (2005) 60
Yates Richard E B Riley PT McClelland et al ldquoThe Influence of Weather on Golden Eagle Migration in Northwestern Montanardquo Journal of Raptor Research 352 (2001) 81-90
A p p e n d i x A 1 1 1
Appendix A List of Fields in the SRC Fatality Table
Field Name Description of field
Project ID Internal consultant code for management purposes
Project Project name ndash Altamont Pass Wind Resource Area
Fatality ID Unique ID database generated
Primary Detection ID Computer generated unique number
Fatality Fatality number assigned by field crew leader in the format of 4 digit year two digit month two digit day-two digit number of fatality discovered that day For example 20110526-01 is the first fatality discovered on May 26 2011
Primary Detection Detection number assigned by the discovering biologist Similar naming convention as fatality number but the number is appended to include the discovererrsquos initials and the number of detection the discoverer made that day For example 20110526-LTN01 is the first fatality that LTN made on May 26 2011
Was Injured TRUEFALSE whether the bird was still alive and injured when it was discovered
Is Wrrs TRUEFALSE whether a bird was initially detected by the Wildlife Reporting and Response System
Transect Protocol Identity of the protocol of monitoring that was being done at the time of discovery ndash current study QAQC Incidental etc
Transect Type The type of transect performed at time of discovery ndash primary secondary follow-up etc
Detection Date Date of detection
Detection Monitoring Year Different than calendar year monitoring year starts in October and continues into the next yearrsquos calendar by 9 months
Detection Year Month Coded month and year
Species Code 4 digit species code for birds and mammals GOEA=Golden Eagle
A p p e n d i x A 1 1 2
Age Age of fatality at time of death adult sub adult juvenile nestling unknown
Sex Sex female male or unknown
String Non-unique string identifier
Turbine Label Label on the turbine nearest the carcass
Turbine Bearing Back bearing from the carcass
Turbine Distance Distance from the carcass to the nearest turbine
Structure Type Notable structure near corpse ndash fence powerline building
Structure Identifier Sign or other identifier
Structure Bearing Back-bearing from the carcass used to locate structure
Structure Distance Distance to the structure
Position X X coordinate on GPS
Position Y Y coordinate on GPS
Body Parts Description of all body parts found or missing
Cause of Death ID Code for the diagnosed cause of death
Cause of Death Diagnosed cause of death determined in the field
Days Dead Range Categorical listing of days dead range
Days Dead Corresponds to the days dead range but set to an integer
Death Date Backdated using days dead and the detection date
Death Monitoring Year Monitoring year in which the fatality will be counted
Death Year Month Year and month in which the fatality will be counted
Was Scavenged Binomial variable based on evidence of scavenging
Carcass Condition Description of the carcass to help the death date determination
Were Insects Present Binomial variable
Insect Types Categorical variable listing of typical insect types present
A p p e n d i x A 1 1 3
Was Flesh Present Binomial variable used to determine carcass age
Flesh Textures Categorical variable used to determine carcass age
Was Head Present Binomial variable
Eye Condition Categorical variable used to indicate carcass age
Was Enamel Present Binomial variable used to determine carcass age
Enamel Presence Categorical variable used to determine carcass age
Were Bones Present Binomial variable used to determine carcass age
Bone Colors Categorical variable used to determine carcass age
Was Sample Taken Binomial variable recording whether samples will be on file
Sample Types Feather flesh or both
Distance Sighted Continuous variable used to track searcher statistics
Parts Sighted Variable used to track searcher statistics
Discoverer Categorical variable used to track searcher proficiency
Notes Blank field in which notes on weather conditions etc
Status ID One or two digit code for how the fatality will be categorized
Status Description of the status ID
Transect Status ID Code for the transect type that was being conducted when the carcass was detected
Transect Status Description of the transect status ID
The following 17 fields are the Status followed by the status ID as seen above In the database these fields are filled in with either True or False These fields are a redundancy but are there to better manipulate the data for reports
Unreviewed (0)
Valid (1)
No Group or Size (2)
A p p e n d i x A 1 1 4
No TurbineID (3)
gt125 m from turbine (4)
Cause of death not turbine-related (5)
gt90 days dead (6)
IncidentalWRRS (7)
Injured (8)
No transect or detection (9)
Off-site carcass for placement (10)
Redundant fatality (11)
Duplicate chicken or test (12)
First detected in non-primary search (13)
Additional parts (14)
Later detection was 13 (15)
Undetermined death date (16)
A p p e n d i x B 1 1 5
Appendix B Fatality Detection Form
A p p e n d i x C 1 1 6
Appendix C Document M11 Determination of Cause of Death (Adapted)
Determination of Cause of Death The following guidelines are used to determine the most likely cause of death for each fatality encountered in the field Cause of death is judged on the basis of 3 main variables
1) Species (non-predated species versus all other species
2) Proximity to turbines power lines and other structures and
3) The condition of the carcass including type of injury and scavenging The cause of death is circled on the fatality data form If a cause of death cannot be determined the unknown option is circled and the most likely causes is underlined Justification for the determination of cause of death is provided on the data form Illnessold age crippling bias or scavenger removal is not accounted for in our determination of cause of death See glossary at end of document for definitions of terms used
1 Blade StrikeTurbine Collision
A Fatality is any non-predated species (ie golden eagle red-tailed hawk or other large buteo great-horned owl etc) found within the search area
B Fatality is an intact (no evidence of scavenging) carcass with no apparent injuries and is found within the search radius
C Fatality is any bird or bat species that has not been scavenged and has injuries consistent with a turbine blade strike or tower collision (ie blunt force trauma severed wings legs or torso decapitation etc) This determination can only be made when the carcass has not been scavenged by vertebrates as scavenging may obscure or mimic turbine-induced injury
(Exceptions electrocutions line strikes and BUOW fatalities at burrows see sections 2 3 and 4B below)
2 Electrocution
A Carcass exhibits obvious signs of electrocution (ie singed feathers clenched talons etc)
B Intact carcass with no apparent injuries is found within 3m of a power pole and is greater than 10m from turbine string axis (see Blade Strike part B)
3 Line Strike
A Intact carcass with or without apparent injury is found outside of search radius beneath power lines or guy wires (within 3m of line) and no evidence of electrocution (see Electrocution)
4 Predation
A Fatalities of non-predated species (ie GOEA RTHA SWHA FEHA and GHOW) are never attributed to predation
A p p e n d i x C 1 1 7
B Scavengedpredated BUOW fatality within 1m of an active burrow is always considered predation regardless of proximity to other sources of mortality
5 Other
This category is reserved for any other obvious or suspected cause of death Evidence to support this assessment is provided on the data form These may include but are not limited to
Fence collisions
Auto collisions
Collisions with other structures such as transformer boxes or buildings
Entanglement in netting (present on some non-operational turbines to prevent perching)
Nestling fatalities found at base of turbine when young birds fall from the nest or when old nests are cleaned out of turbine housing
Significant turbine oilgrease on feathers
6 Unknown
A Blade striketurbine collision underlined
Intact or scavenged carcass of any species with competing or uncertain causes of death (For exception see Predation part C)
B Predation underlined
Scavengedpredated carcass of non-predated species found outside of search area with competing or uncertain causes of death
Scavengedpredated carcass of any other species found within or outside of search area with competing or uncertain causes of death
C Electrocution underlined
Any bird species found within 3m of a power pole with competing or uncertain causes of death
D Line Strike underlined
Any bird species found within 3m of power lines or guy wires with competing or uncertain causes of death
E Other underlined
Carcass of any species exhibiting evidence of non-listed (other) source of mortality with competing or uncertain causes of death
A p p e n d i x D 1 1 8
Appendix D List of Fields in the SRC Turbine Table
Field Name Description
Project ID Internal ICFI code for programming purposes
Project Project name ndash Altamont Pass Wind Resource Area
Turbine ID Unique numerical identifier for a turbine
Turbine Label Non unique alphanumeric identifier physically posted on a turbine tower
String Number Non unique numerical identifier of rowsectional grouping of turbines
Position X Latitudinal coordinate value based on NAD1927 Datum
Position Y Longitudinal coordinate value base on NAD1927 Datum
Company ID Name of the company that operates the turbine
Project Site A geographically defined area within the APWRA where wind companies operate turbine arrays
Turbine Model Modelmanufacturer of the wind turbine
Tower Type Lattice tubular or vertical axis
Tower Height Height from ground to turbine axis
Blade Length Length of blade from axis to tip
Rotor Swept Area Total area covered by a rotating turbine propeller
Generating Capacity The rated energy generating capacity for a wind turbine
Is AIC Is owned by the AIC partnership
Installation Date Date that the turbinetower was installed
Removal Date Date that the turbinetower was removed
Removal Reason A note field with details on why a turbinetower was removed
Tier Rating of the turbine following a hazardous turbine survey
Hrt2007 Rating of turbine in 2007
A p p e n d i x D 1 1 9
Hrt2010 Rating of turbine in 2010
Notes Additional note field
Grid ID
Elevation Elevation of the ground at the turbine base
Slope Slope of the hill on which the turbine was built
Aspect Direction the hill on which the turbine was built faces measured in degrees
County Which county in California ndash Alameda or Contra Costa
A p p e n d i x E 1 2 0
Appendix E List of Fields in the SRC Transects Table
Field Name Description
Project ID Internal code of consulting company
Project Project name ndash Altamont Pass Wind Resource Area
Transect GUID Computer generated unique identifier of a single transect (search)
Transect Date Date the transect was performed
Calendar year The calendar year in which the transect was performed
Monitoring Year The avian monitoring year in which the transect was performed
Year Month The calendar year followed by the name of the month
String ID Unique numerical identifier of rowsectional grouping of turbines
String Non unique numerical identifier of rowsectional grouping of turbines
of Turbines Count of turbines within that String ID
Installed Capacity Sum of turbine generating capacities within that String ID
Study ID Unique identity of the study that the transect was conducted to support
Study Code Abbreviation of the full study name for example CS-current Study
Transect Type ID Unique identity of the type of transect conducted Corresponds to transect type
Transect Type Identity of the type of transect conducted for example primary search secondary clearing Incidental etc
Transect Protocol ID Unique identity of the transect protocol Corresponds to transect type
Transect Protocol Identity of the protocol under which the transect was conducted for example KB clearing current study primary QAQC fatality check etc
A p p e n d i x E 1 2 1
Notes Note field contains information about changes and alterations to the record
Transect Status ID Code for reviewed and unreviewed transects
Transect Status Status of reviewed or unreviewed
A p p e n d i x F 1 2 2
Appendix F Use of the Circular Package in R to Calculate Aspect Statistics
Package lsquocircularrsquo httpcranr-projectorgwebpackagescircularcircularpdf
httpcasoilresourcelawrucdavisedudrupalnode1042
Scripts for Nonkill Turbine Aspect Calculations and Histogram
gt PASPlt-readcsv(CPinger DataFat Table versionsCSVsAspect
CalculationsPASPcsvheader=T)
gt aspectplot lt- function(PASP PASPbins=60 PASPbw=30 PASPaxis=seq(0 350 by=10)
plottitle=NULL)
gt PASPlt-naomit(PASP)
gt cPASPlt- circular(PASP units=degrees template=geographics)
gt mPASPlt-mean(cPASP)
gt rhoPASPlt-rhocircular(cPASP)
gt PASPaxislt-seq(0350by=10)
gt aPASPlt-circular(PASPaxisunits=degreestemplate=geographics)
gt PASPbinslt-(bins=60)
gt plot(cPASP axes=FALSE stack=TRUEshrink=115 cex=1 sep=006 pch=21col=1
bg=RoyalBlue)
gt lines(density(cPASPbw=30)col=RoyalBLuelty=2)
gt axiscircular(at=(-aPASP)+90labels=aPASPcex=06)
gt text(01125Northcex=085font=1)
gt arrowscircular(mPASPshrink=rhoPASPlength=015col=RoyalBlue)
gt summary(ASP)
the summary script above is a linear calculation of the data
Nonkill Min 003 1st Qu 9347 Median 16206 Mean 18386 3rd Qu 30057 Max 35990
gt summary(mPASP)
A p p e n d i x F 1 2 3
This calculation is the circular calculation of the mean value
n Mean Rho 100000 4123038 100000
Scripts for Kill Turbine Aspect Calculations and Histogram
gt aspectplot lt- function(KASP KASPbins=60 KASPbw=30 KASPaxis=seq(0 350 by=10)
plottitle=NULL)
+ KASPlt-naomit(KASP)
gt cKASPlt- circular(KASP units=degrees template=geographics)
gt mKASPlt-mean(cKASP)
gt rhoKASPlt-rhocircular(cKASP)
gt KASPaxislt-seq(0350by=10)
gt aKASPlt-circular(KASPaxisunits=degreestemplate=geographics)
gt KASPbinslt-(bins=60)
gt plot(cKASP axes=FALSE stack=TRUEshrink=115 cex=1 sep=006 pch=21col=1 bg=Red)
gt lines(density(cKASPbw=30)col=Redlty=2)
gt axiscircular(at=(-aKASP)+90labels=aKASPcex=06)
gt text(01125Northcex=085font=1)
gt arrowscircular(mKASPshrink=rhoKASPlength=015col=Red)
gt summary(KASP)
the summary script above is a linear calculation of the data
Kill Min 114 1st Qu 12317 Median 21202 Mean 20412 3rd Qu 30806 Max 35944
gt summary(mKASP)
This calculation is the circular calculation of the mean value
n Mean Rho 100000 31799896 (-6124193) 100000
Kill Aspect Review Minimum 282 1st Quarter 12664 Median 21941 Mean 20554 3rd Quarter 30583 Maximum 35944 gtsummary(mKASP) Mean -6124193
A p p e n d i x G 1 2 4
Appendix G Calculations of Hilltop Ridgelines
Adapted from Article 39093 October 2011 Calculating
httpsupportesricomenknowledgebasetecharticlesdetail39093 How To Identify ridgelines from a DEM
Article ID 39093
Software ArcGIS - ArcEditor 931 10 ArcGIS - ArcInfo 931 10 ArcGIS - ArcView 931 10
Platforms Windows XP 2003Server Vista 2008Server Win 7
Summary The instructions provided describe how to identify ridgelines from a DEM Spatial Analyst and the Hydrology Toolset can be used to identify and extract ridgeline features from an elevation raster (DEM) in the same manner as a stream network can be created by reversing the DEM cell values Procedure This workflow uses Map Algebra and the Hydrology Toolset to derive ridgeline features from a DEM
1 Fill the DEM using the Fill tool in the Hydrology Toolset
2 Switch the highlow values in the Fill DEM by using the Raster Calculator to multiply the Fill DEM by -1
3 Run the Flow Direction tool using the output raster from step 2 as the Input surface raster and
checking Force all edge cells to flow outward
4 Run the Flow Accumulation tool using the output raster from step 3 as the Input flow direction raster
A p p e n d i x G 1 2 5
5 Set the Flow Accumulation threshold and create the stream network raster using the Raster
Calculator For 931
6 Create a Stream Order raster using the stream network raster (step 5) for the Input steam raster and the Flow Direction raster (step 3) for the Input flow direction raster
7 Create a ridgeline shapefile by running the Stream to Feature tool with the Stream Order raster as the Input stream raster
Created 6242011Last Modified 10262011
A p p e n d i x G 1 2 6
To measure whether a turbine was near a ridgeline The Analysis toolboxProximitynear Tool A search radius of 10 meters was used Any turbine within the 10 meters is considered on the ridge top
A p p e n d i x H 1 2 7
Appendix H Fishnet Square Turbine Count Table
Turbine Model
Code
250KW 1
Bonus 2
Danwin 3
Enertech 4
Flowind 5
Howden 6
Kenetech 56-100
7
KVS 33 8
Turbine Model
Code
Micon 9
Mitsubishi 1000A
10
Nordtank 11
Polenko 12
V-47 13
Vestas 14
Windmaster 15
Windmatic 16
Turbines Present in 1999
Fis
h ID
1 2 3 4 5 6 7 8 9 10 11 12 13 14 15 16
To
tal
13 0 0 0 0 0 0 22 0 0 0 0 0 0 0 0 0 22
14 0 0 0 0 0 0 60 0 0 0 0 0 0 0 0 0 60
15 0 0 0 0 0 0 10 0 0 0 0 0 0 0 0 0 10
27 0 0 0 0 0 0 15 0 0 0 0 0 0 0 0 0 15
28 0 0 0 0 0 0 14 0 0 0 0 0 0 0 0 0 14
29 0 0 0 0 0 0 30 0 0 0 0 0 0 0 0 0 30
30 0 0 0 0 0 0 51 0 0 0 0 0 0 0 0 0 51
31 0 0 0 0 0 0 27 0 0 0 0 0 0 0 0 0 27
42 0 10 0 0 0 0 0 0 0 0 0 0 0 0 0 0 10
43 0 47 0 0 0 0 28 0 0 0 0 0 0 0 0 0 75
44 0 15 0 0 0 0 29 0 0 0 0 0 0 0 0 0 44
45 0 0 0 0 0 0 87 0 0 0 0 0 0 0 0 0 87
46 0 0 0 0 0 0 23 0 0 0 0 0 0 0 0 0 23
47 0 0 0 0 0 0 29 0 0 0 0 0 0 0 0 0 29
A p p e n d i x H 1 2 8
58 0 27 0 0 0 0 0 0 0 0 41 0 0 0 0 0 68
59 0 21 0 0 0 0 0 0 0 0 62 0 0 0 0 0 83
60 0 14 0 0 0 0 26 1 0 0 1 0 0 0 0 0 42
61 3 0 0 0 0 0 46 0 0 0 0 0 0 0 0 0 49
62 0 0 0 0 0 0 6 0 0 0 0 0 0 0 0 0 6
70 0 0 0 0 0 0 4 1 0 0 0 0 0 0 0 0 5
71 0 0 0 0 0 0 52 0 0 0 0 0 0 0 0 0 52
72 4 0 0 0 0 0 37 0 0 0 0 0 0 0 0 0 41
73 0 0 0 0 0 0 71 0 0 0 0 0 0 0 0 0 71
74 0 24 0 0 0 0 0 0 0 0 15 0 0 0 0 0 39
75 0 53 0 0 0 0 10 0 0 0 6 0 0 0 0 0 69
76 9 0 0 0 0 0 65 0 0 0 0 0 0 0 0 0 74
77 4 0 0 0 0 0 2 0 0 0 0 0 0 0 0 0 6
85 0 0 0 0 0 0 25 7 0 0 0 0 0 0 0 0 32
86 0 0 0 0 0 0 28 8 0 0 0 0 0 0 0 0 36
87 0 0 0 0 0 0 39 2 0 0 0 0 0 0 0 0 41
88 0 0 0 0 0 0 119 0 0 0 0 0 0 0 0 0 119
89 0 0 0 0 0 0 84 0 0 0 0 0 0 0 0 0 84
90 0 0 0 0 0 0 22 0 0 0 0 0 0 0 0 0 22
91 0 0 0 0 0 0 81 0 0 0 0 0 0 0 0 0 81
92 0 0 0 0 0 0 49 0 0 0 0 0 0 0 0 0 49
93 0 0 0 0 0 0 16 0 0 0 0 0 0 0 0 0 16
101 0 0 0 0 8 0 0 0 0 0 0 0 0 0 0 0 8
102 0 0 0 0 48 0 0 0 0 0 0 0 0 0 0 0 48
103 0 11 0 0 2 0 8 0 0 0 0 0 0 0 0 0 21
104 0 0 1 0 0 0 21 0 0 0 0 0 0 0 0 0 22
A p p e n d i x H 1 2 9
105 0 0 0 0 0 0 38 0 0 0 0 0 0 0 0 0 38
106 0 0 0 0 0 0 29 0 0 0 0 0 0 0 0 0 29
107 0 0 0 0 0 0 34 0 0 0 0 0 0 0 0 0 34
108 0 0 0 0 0 0 8 0 0 0 0 0 0 0 0 0 8
109 0 0 0 0 0 0 1 0 0 0 0 0 0 0 0 0 1
111 0 0 0 0 0 0 0 0 18 0 0 0 0 0 0 0 18
116 0 0 0 0 0 0 42 0 0 0 0 0 0 0 0 0 42
117 0 0 0 0 5 0 0 0 0 0 0 0 0 0 0 0 5
118 0 0 0 0 11 0 0 0 0 0 0 0 0 0 0 0 11
119 0 3 0 0 3 0 0 0 0 0 0 0 0 86 0 0 92
120 0 15 15 0 0 0 0 0 0 0 0 0 0 27 0 0 57
121 0 0 2 0 0 0 8 0 0 0 0 0 0 0 0 0 10
127 0 0 0 0 0 0 0 0 34 0 0 0 0 0 0 0 34
131 0 0 0 0 0 0 60 0 0 0 0 0 0 0 0 0 60
132 0 0 0 0 0 0 28 0 0 0 0 0 0 0 0 0 28
134 0 0 0 0 0 0 0 0 0 0 0 0 0 2 0 0 2
135 0 0 0 0 0 0 2 0 0 0 0 0 0 67 0 0 69
136 0 0 0 0 0 0 0 0 0 0 0 0 0 20 0 0 20
137 0 0 0 0 2 0 21 0 0 0 0 0 0 0 0 0 23
138 0 0 0 23 5 0 40 0 0 0 0 0 0 0 0 0 68
139 0 0 0 60 0 0 0 0 0 0 0 1 0 0 0 24 85
140 0 0 0 0 0 0 0 0 0 0 0 11 0 0 0 2 13
147 0 0 0 0 0 0 38 0 0 0 0 0 0 0 0 0 38
148 0 0 0 0 0 0 40 0 0 0 0 0 0 0 0 0 40
150 0 0 0 0 0 0 17 0 0 0 0 0 0 0 0 0 17
151 0 0 0 0 0 0 2 0 0 0 0 0 0 0 0 0 2
A p p e n d i x H 1 3 0
152 0 5 1 0 0 0 12 0 0 0 0 0 0 0 0 0 18
153 0 12 6 0 15 0 0 0 0 0 0 0 0 0 0 0 33
154 0 9 0 19 18 0 3 0 12 0 0 0 0 0 0 0 61
155 0 0 0 68 0 0 11 0 26 0 0 0 0 0 0 0 105
163 0 0 0 0 0 0 33 0 0 0 0 0 0 0 0 0 33
164 0 0 0 0 0 0 27 0 0 0 0 0 0 0 0 0 27
165 0 0 0 0 0 0 14 0 0 0 0 0 0 0 0 0 14
166 0 0 0 0 0 0 34 0 0 0 0 0 0 0 0 0 34
167 0 0 0 0 0 0 46 0 0 0 0 0 0 0 0 0 46
168 0 0 0 0 0 0 46 2 0 0 0 0 0 0 0 0 48
169 0 0 0 0 0 0 54 0 0 0 0 0 0 0 0 0 54
170 0 33 0 0 23 0 19 0 0 0 0 0 0 0 0 0 75
171 0 0 0 0 0 0 62 0 0 0 0 0 0 0 0 0 62
173 0 0 0 0 0 0 0 0 29 0 0 0 0 0 0 0 29
174 0 0 0 0 0 0 0 0 10 0 0 0 0 0 0 0 10
179 0 0 0 0 0 0 16 0 0 0 0 0 0 0 0 0 16
180 0 0 0 0 0 0 4 0 0 0 0 0 0 0 0 0 4
181 0 0 0 0 0 0 41 0 0 0 0 0 0 0 0 0 41
182 0 0 0 0 0 0 56 0 0 0 0 0 0 0 0 0 56
183 0 3 0 0 0 0 3 0 0 0 0 0 0 0 0 0 6
184 0 37 0 0 6 0 3 0 0 0 0 0 0 0 0 0 46
185 0 44 0 0 3 0 1 0 0 0 0 0 0 0 0 0 48
186 0 0 0 0 9 0 46 0 0 0 0 0 0 0 0 0 55
187 0 0 0 0 0 0 51 0 0 0 0 0 0 0 0 0 51
189 0 0 0 0 0 0 0 0 88 0 0 0 0 0 0 0 88
190 0 0 0 0 0 0 0 0 4 0 0 0 0 0 0 0 4
A p p e n d i x H 1 3 1
193 0 0 0 0 0 0 20 0 0 0 0 0 0 0 0 0 20
194 0 0 0 0 0 0 44 0 0 0 0 0 0 0 0 0 44
195 0 0 0 0 0 0 33 0 0 0 0 0 0 0 0 0 33
196 0 0 0 0 0 0 56 0 0 0 0 0 0 0 0 0 56
197 0 0 0 0 0 0 37 0 0 0 0 0 0 0 0 0 37
198 0 11 0 0 0 0 17 0 0 0 0 0 0 0 0 0 28
199 0 28 0 0 0 0 0 0 0 0 0 0 0 0 0 0 28
200 0 21 0 0 9 0 10 0 0 0 0 0 0 0 0 0 40
201 0 13 0 0 2 0 12 0 0 0 0 0 0 0 0 0 27
202 0 0 0 0 0 0 41 0 0 0 0 0 0 0 0 0 41
203 0 0 0 0 0 0 4 0 0 0 0 0 0 0 0 0 4
208 0 0 0 0 0 0 44 0 0 0 0 0 0 0 0 0 44
209 0 0 0 0 0 0 94 0 0 0 0 0 0 0 0 0 94
210 0 0 0 0 0 0 96 0 0 0 0 0 0 0 0 0 96
211 0 0 0 0 0 0 54 0 0 0 0 0 0 0 0 0 54
212 0 0 0 0 0 0 18 0 0 0 0 0 0 0 0 0 18
213 0 0 0 0 0 0 17 0 0 0 0 0 0 0 0 0 17
214 0 17 0 0 0 0 0 0 0 0 0 0 0 0 0 0 17
215 0 41 0 0 0 0 0 0 0 0 0 0 0 0 0 0 41
216 0 8 0 0 0 0 58 0 0 0 0 0 0 0 0 0 66
217 0 0 0 0 0 0 55 0 0 0 0 0 0 0 0 0 55
224 0 0 0 0 0 0 61 0 0 0 0 0 0 0 0 0 61
225 0 0 0 0 0 0 69 0 0 0 0 0 0 0 0 0 69
226 0 0 0 0 0 0 93 0 0 0 0 0 0 0 0 0 93
227 0 0 0 0 0 0 47 0 0 0 0 0 0 0 0 0 47
228 0 0 0 0 0 0 13 0 0 0 0 0 0 0 0 0 13
A p p e n d i x H 1 3 2
229 0 0 0 0 0 0 0 0 0 0 0 0 0 0 0 0 0
230 0 0 4 0 0 0 0 0 0 0 12 0 0 0 0 0 16
231 0 8 5 0 0 0 0 0 0 0 0 0 0 0 0 0 13
232 0 6 0 0 0 0 13 0 0 0 9 0 0 0 4 0 32
233 0 0 0 0 0 0 20 0 0 0 0 0 0 0 7 0 27
240 0 0 0 0 0 0 5 14 0 0 0 0 0 0 0 0 19
241 0 0 0 0 0 0 30 6 0 0 0 0 0 0 0 0 36
242 0 0 0 0 0 0 81 0 0 0 0 0 0 0 0 0 81
243 0 0 0 0 0 3 5 0 0 0 0 0 0 0 0 0 8
244 0 0 0 0 0 8 0 0 0 0 0 0 0 0 0 0 8
245 0 0 0 0 0 0 0 0 0 0 10 0 0 0 0 0 10
246 0 0 0 0 0 0 0 0 0 0 11 0 0 0 26 0 37
247 0 0 5 0 0 0 0 0 0 0 11 0 0 0 13 0 29
248 0 0 0 0 0 0 0 0 0 0 5 0 0 0 1 0 6
249 0 0 0 0 0 0 0 0 0 0 2 0 0 0 13 0 15
259 0 0 0 0 0 13 0 0 0 0 0 0 0 0 0 0 13
260 0 0 0 0 0 34 0 0 0 0 0 0 0 0 0 0 34
261 0 0 0 0 0 0 0 0 0 0 43 0 0 0 0 0 43
262 0 0 0 0 0 0 0 0 0 0 23 0 0 0 16 0 39
263 0 0 0 0 0 0 0 0 0 0 0 0 0 0 17 0 17
264 0 0 0 0 0 0 0 0 0 0 0 0 0 0 4 0 4
275 0 0 0 0 0 9 0 0 0 0 0 0 0 0 0 0 9
276 0 0 0 0 0 9 0 0 0 0 0 0 0 0 0 0 9
277 0 0 0 0 0 10 0 0 0 0 14 0 0 0 0 0 24
278 0 0 0 0 0 0 0 0 0 0 29 0 0 0 0 0 29
292 0 0 0 0 0 0 0 0 0 0 34 0 0 0 0 0 34
A p p e n d i x H 1 3 3
293 0 0 0 0 0 0 0 0 0 0 43 0 0 0 0 0 43
294 0 0 0 0 0 0 0 0 0 0 0 0 0 0 0 0 0
Total 20 536 39 170 169 86 3373 41 221 0 371 12 0 202 101 26 5367
A p p e n d i x I 1 3 4
Appendix I Abridged Records of Status 1 Golden Eagle Fatalities
Fatality Number
Detection Date
Age Sex String
Number Turbine
Label Turbine Bearing
Turbine Distance
BLMT07 052198 Unk Unk 64 1205 160 31
BL31 060998 Immature Unk 63 1190 261 255
BL312 061098 Juvenile Unk 77 1296 303 35
BL318 070298 Juvenile Unk 76 1279 263 288
BL347 092598 Juvenile Unk 68 1222 151 81
BL5057 100899 Adult Female 70 1244 38 62
BL5091 110399 Juvenile Unk 140 6514 118 19
BL5122 112299 Immature Unk 79 1312 247 46
BL4006 061500 Immature Unk 55 1154 96 13
BL4031 081800 Juvenile Unk 65 1207 62 10
BL4037 082600 Juvenile Unk 66 1216 82 12
BL4097 012501 Immature Unk 165 I-10 340 43
BL1005 070301 Unk Unk 85 1343 211 15
BL1041 121801 Adult Unk 63 1190 166 3
BL1214 070802 Unk Unk 148 6316 196 20
BL1242 082602 Unk Unk 121 5285 244 41
BL1244 101502 Unk Unk 363 964 228 16
BL1258 102802 Adult Unk 3121 2965 216 44
BL1288 111302 Unk Unk 306 2719 250 24
BL1301 111902 Unk Unk 329 4325 206 28
BL1303 112002 Unk Unk 331 4418 196 15
BL1439 022703 Adult Unk 244 H4 196 37
BL1444 030503 Juvenile Unk 335 41 194 22
A p p e n d i x I 1 3 5
BL1459 031103 Juvenile Unk 328 4323 222 50
BL1474 031803 Juvenile Unk 408 697 258 12
20051018-02
101805 Juvenile Unk 72 1251 27 46
20051025-09
102505 Juvenile Unk 361 4537 8 25
20051102-07
110205 Undetermined Unk 279 2389 0 0
20051102-12
110205 Juvenile Unk 517 2654 75 36
20060111-03
011106 Juvenile Unk 43 1102 306 6
20060523-02
052306 Unk Unk 517 2657 127 12
20060524-04
052406 Unk Unk 34899 4394 36 36
2336 060606 Unk Unk 282 215 0
20060705-02
070506 Unk Unk 324 4303 41 30
20060710-02
071006 Unk Unk 342 4030 30 10
20060717-01
071706 Unk Unk 363 954 342 24
20060717-10
071706 Unk Unk 403 1414 40 36
20060717-09
071706 Unk Unk 403 1410 326 41
20060718-10
071806 Unk Unk 39799 794 31 53
X06-82 073106 Immature Unk 63 1199 305 45
20060807-04
080706 Adult Unk 6832 2363 8 72
20060907-06
090706 Unk Unk 665 6350 101 65
A p p e n d i x I 1 3 6
20061009-01
100906 Juvenile Unk 342 4001 38 36
20061017-06
101706 Juvenile Unk 39999 3022 20 17
20061018-02
101806 Adult Unk 404 1358 49 13
20061026-14
102606 Unk Unk 85 1343 206 51
20061031-11
103106 Unk Unk 596 1058 19 32
20061215-01
121506 Juvenile Unk 427 331 60 36
2672 022207 Adult Unk 138 1176 350 24
20070228-01
022807 Juvenile Unk 37299 1332 189 4
20070319-05
031907 Adult Unk 70 1243 28 37
20070328-08
032807 Unk Unk 629 1297 15 95
20070405-01
040507 Unk Unk 588 6530 86 14
20070411-07
041107 Adult Unk 145 6342 48 20
2774 041607 Adult Unk 277 207 260 40
20070504-01
050407 Juvenile Unk 305 2675 224 28
2791 051507 Und Unk 517 2659 80 44
2860 052807 Adult Unk 138 1176 330 77
20070613-02
061307 Unk Unk 308 2803 300 79
20070618-05
061807 Juvenile Unk 271 4684 56 23
20070703-05
070307 Und Unk 451 39 41 18
A p p e n d i x I 1 3 7
20070711-11
071107 Juvenile Unk 361 4538 360 22
20070712-03
071207 Unk Unk 629 1288 50 26
20070725-06
072507 Juvenile Unk 654 5194 53 51
20070815-02
081507 Unk Unk 615 1162 162 1
20070821-02
082107 Unk Unk 31299 3649 103 77
20070821-01
082107 Unk Unk 328 4321 237 32
20070828-01
082807 Adult Female 365 1089 0 0
20070829-07
082907 Adult Unk 62 1188 360 28
20070904-01
090407 Unk Unk 116 5159 355 14
C07-238 090407 Adult Unk 1801 AB-8 20 12
20070905-06
090507 Juvenile Unk 361 4540 349 8
20070906-13
090607 Adult Unk 566 6130 42 35
20070911-03
091107 Unk Unk 588 6529 27 22
20070912-01
091207 Adult Unk 505 2516 83 5
20071003-05
100307 Unk Unk 34899 4386 234 91
20071009-20
100907 Unk Unk 146 6368 110 23
20071016-06
101607 Unk Unk 583 6491 43 59
20071016-07
101607 Unk Unk 588 6530 348 14
A p p e n d i x I 1 3 8
20071019-01
101907 Juvenile Unk 361 4538 84 4
20071102-01
110207 Adult Unk 39799 793 42 13
3194 111207 Immature Unk 34899 3625 60 64
20071114-07
111407 Unk Unk 573 6343 324 29
3271 121307 Unk Unk 58099 6450 355 5
20080205-04
020508 Immature Unk 583 6491 212 72
147 021908 Unk Unk 517 2639 45 50
20080311-06
031108 Juvenile Unk 267 4732 344 13
C08-077 032508 Adult Unk 189 GB-7 136 13
20080506-05
050608 Juvenile Unk 38999 3066 346 43
20080702-03
070208 Adult Unk 224 A3001 180 28
20080717-01
071708 Juvenile Unk 67 1224 300 5
20080724-02
072408 Unk Unk 5088 6503 30 50
20080804-03
080408 Juvenile Unk 430 249 95 61
20080903-09
090308 Juvenile Unk 428 239 26 43
20080915-06
091508 Unk Unk 364 953 15 34
20080923-01
092308 Unk Unk 52 1144 161 27
20080923-02
092308 Adult Unk 71 1246 66 44
X08-164 100208 Unk Unk 55 1154 50 35
A p p e n d i x I 1 3 9
20081201-04
120108 Juvenile Unk 156 TV-3 355 8
20081215-04
121508 Juvenile Unk 39799 3074 123 30
20090115-02
011509 Unk Unk 1005 WTG-
12 210 28
20090311-05
031109 Juvenile Unk 34899 4394 54 47
4164 052709 Unk Unk 629 1285 358 14
4301 070609 Unk Unk 342 4005 35 9
20090727-06
072709 Adult Unk 647 5124 84 26
4351 081409 Immature Unk 282 217 4 16
20090929-02
092909 Unk Unk 5085 6473 150 7
X09-082 092909 Unk Unk 69 1234 345 17
20091021-02
102109 Unk Unk 335 37 16 63
20091026-02
102609 Juvenile Unk 271 4687 2 37
20091103-04
110309 Juvenile Unk 582 6477 40 7
20091104-05
110409 Unk Unk 145 6342 212 36
4467 111009 Immature Unk 335 63 100 18
20100607-01
060710 Unk Unk 505 2518 87 24
20100610-02
061010 Juvenile Unk 347 4377 114 59
20100622-02
062210 Juvenile Unk 53 1148 86 64
20100722-01
072210 Juvenile Unk 360 4534 322 66
A p p e n d i x I 1 4 0
20100726-01
072610 Juvenile Unk 345 4220 21 30
X10-066 082410 Immature Unk 69 1227 42 29
4896 092110 Unk Unk 325 4312
20100923-03
092310 Juvenile Unk 342 4021 42 22
20101018-09
101810 Juvenile Unk 356 4524 86 18
20101019-12
101910 Unk Unk 346 4436 6 75
20110110-01
011011 Unk Unk 5110 5410 55 18
5109 031211 Unk Unk 597 4252
20110314-05
031411 Adult Unk 356 4523 35 29
20110526-01
052611 Juvenile Unk 566 6123 78 35
5181 060611 Unk Unk 360 4534
20110725-02
072511 Juvenile Unk 88 V1-11 239 1
20110802-04
080211 Adult Unk 356 4524 62 21
20110824-03
082411 Juvenile Unk 83 1338 168 1
20110913-01
091311 Juvenile Unk 137 1214 98 11
5335 091411 Unk Unk 360 4534
20110831-01
103111 Adult Unk 101 V9-12 109 7
20120419-02
041912 Juvenile Unk 566 6110 360 0
20120425-01
042512 Juvenile Unk 582 6477 338 4
A p p e n d i x I 1 4 1
20120530-03
053012 Juvenile Unk 35199 4460 69 41
20120606-06
060612 Juvenile Unk 50582 4635 55 22
20120716-05
071612 Immature Unk 329 4326 31 17
20121106-03
110612 Unk Unk 335 61 158 3
A p p e n d i x J 1 4 2
Appendix J Additional fields calculated for the turbines table
Field Description Year RDGTP Ridge top turbine Constant SP Settling party turbine Constant SDDL Saddle turbine Constant KILL Turbine has killed a GOEA D98 Number of dead GOEAs 1998 D99 ldquo ldquo 1998 D00 ldquo ldquo 2000 D01 ldquo ldquo 2001 D02 ldquo ldquo 2002 D03 ldquo ldquo 2003 D05 ldquo ldquo 2005 D06 ldquo ldquo 2006 D07 ldquo ldquo 2007 D08 ldquo ldquo 2008 D09 ldquo ldquo 2009 D10 ldquo ldquo 2010 D11 ldquo ldquo 2011 DT Total number of dead GOEAs Total FISHID ID of the turbinersquos fishnet square Constant DIV98 Diversity of trbrsquos fishnet square 1998 DIV99 ldquo ldquo 1999 DIV00 ldquo ldquo 2000 DIV01 ldquo ldquo 2001 DIV02 ldquo ldquo 2002 DIV03 ldquo ldquo 2003 DIV05 ldquo ldquo 2005 DIV06 ldquo ldquo 2006 DIV07 ldquo ldquo 2007 DIV08 ldquo ldquo 2008 DIV09 ldquo ldquo 2009 DIV10 ldquo ldquo 2010 DIV11 ldquo ldquo 2011 DIVKILL Diversity of turbinersquos fishnet id in year GOEA was killed DNS98 Turbine density of fishnet square 1998 DNS99 ldquo ldquo 1999 DNS00 ldquo ldquo 2000 DNS01 ldquo ldquo 2001 DNS02 ldquo ldquo 2002
A p p e n d i x J 1 4 3
DNS03 ldquo ldquo 2003 DNS05 ldquo ldquo 2004 DNS06 ldquo ldquo 2006 DNS07 ldquo ldquo 2007 DNS08 ldquo ldquo 2008 DNS09 ldquo ldquo 2009 DNS10 ldquo ldquo 2010 DNS11 ldquo ldquo 2011 DNSKILL Density of turbinersquos fishnetID in year GOEA was killed NTD98 Nearest turbine distance 1998 NTD99 Nearest turbine distance NTM98 Nearest turbine model 1998 NTM99 ldquo ldquo 1999 NTM00 ldquo ldquo 2000 NTM01 ldquo ldquo 2001 NTM02 ldquo ldquo 2002 NTM03 ldquo ldquo 2003 NTM05 ldquo ldquo 2005 NTM06 ldquo ldquo 2006 NTM07 ldquo ldquo 2007 NTM08 ldquo ldquo 2008 NTM09 ldquo ldquo 2009 NTM10 ldquo ldquo 2010 NTM11 ldquo ldquo 2011 NTMKILL Nearest turbine model in year GOEA was killed NTD98 Distance to nearest turbine 1998 NTD99 ldquo ldquo 1999 NTD00 ldquo ldquo 2000 NTD01 ldquo ldquo 2001 NTD02 ldquo ldquo 2002 NTD03 ldquo ldquo 2003 NTD05 ldquo ldquo 2005 NTD06 ldquo ldquo 2006 NTD07 ldquo ldquo 2007 NTD08 ldquo ldquo 2008 NTD09 ldquo ldquo 2009 NTD10 ldquo ldquo 2010 NTD11 ldquo ldquo 2011 NTDKILL Nearest turbine distance in year GOEA was killed MC98 Yearly monitored count 1998 MC99 ldquo ldquo 1999 MC00 ldquo ldquo 2000
A p p e n d i x J 1 4 4
MC01 ldquo ldquo 2001 MC02 ldquo ldquo 2002 MC03 ldquo ldquo 2003 MC05 ldquo ldquo 2005 MC06 ldquo ldquo 2006 MC07 ldquo ldquo 2007 MC08 ldquo ldquo 2008 MC09 ldquo ldquo 2009 MC10 ldquo ldquo 2010 MC11 ldquo ldquo 2011 MCT Total a turbine was monitored Total SOHi Screen order in the historic array SCHi Historic array screen count SIDHi Historic array screen id ERHi End row historic array ER98 End row status 1998 ER99 ldquo ldquo 1999 ER00 ldquo ldquo 2000 ER01 ldquo ldquo 2001 ER02 ldquo ldquo 2002 ER03 ldquo ldquo 2003 ER05 ldquo ldquo 2005 ER06 ldquo ldquo 2006 ER07 ldquo ldquo 2007 ER08 ldquo ldquo 2008 ER09 ldquo ldquo 2009 ER10 ldquo ldquo 2010 ER11 ldquo ldquo 2011 ERKILL End row status of turbine in year GOEA was killed SC98 Number of turbines in screen 1998 SC99 ldquo ldquo 1999 SC00 ldquo ldquo 2000 SC01 ldquo ldquo 2001 SC02 ldquo ldquo 2002 SC03 ldquo ldquo 2003 SC05 ldquo ldquo 2005 SC06 ldquo ldquo 2006 SC07 ldquo ldquo 2007 SC08 ldquo ldquo 2008 SC09 ldquo ldquo 2009 SC10 ldquo ldquo 2010 SC11 ldquo ldquo 2011 SCKILL Screen count of turbine in year GOEA was killed
A p p e n d i x J 1 4 5
SCID98 Turbine screen identity 1998 SCID99 ldquo ldquo 1999 SCID00 ldquo ldquo 2000 SCID01 ldquo ldquo 2001 SCID02 ldquo ldquo 2002 SCID03 ldquo ldquo 2003 SCID05 ldquo ldquo 2005 SCID06 ldquo ldquo 2006 SCID07 ldquo ldquo 2007 SCID08 ldquo ldquo 2008 SCID09 ldquo ldquo 2009 SCID10 ldquo ldquo 2010 SCID11 ldquo ldquo 2011 PRE98 Presence in the array 1998 PRE99 ldquo ldquo 1999 PRE00 ldquo ldquo 2000 PRE01 ldquo ldquo 2001 PRE02 ldquo ldquo 2002 PRE03 ldquo ldquo 2003 PRE05 ldquo ldquo 2005 PRE06 ldquo ldquo 2006 PRE07 ldquo ldquo 2007 PRE08 ldquo ldquo 2008 PRE09 ldquo ldquo 2009 PRE10 ldquo ldquo 2010 PRE11 ldquo ldquo 2011 MON98 Monitored status 1998 MON99 ldquo ldquo 1999 MON00 ldquo ldquo 2000 MON01 ldquo ldquo 2001 MON02 ldquo ldquo 2002 MON03 ldquo ldquo 2003 MON05 ldquo ldquo 2005 MON06 ldquo ldquo 2006 MON07 ldquo ldquo 2007 MON08 ldquo ldquo 2008 MON09 ldquo ldquo 2009 MON10 ldquo ldquo 2010 MON11 ldquo ldquo 2011
- Application of GIS and Spatial Analysis of Golden Eagle Fatalities Caused by Wind Turbines at the Altamont Pass Wind Resource
-
- Let us know how access to this document benefits you
- Recommended Citation
-
- tmp1373056213pdfklvo6
-

Application of GIS and Spatial Analysis of Golden Eagle Fatalities
Caused by Wind Turbines at the Altamont Pass Wind Resource Area CA
by
Andrew James Pinger
A thesis submitted in partial fulfillment of the requirements for the degree of
Master of Science
in Biology
Thesis Committee Luis A Ruedas Chair Deborah A Duffield Michael T Murphy
Portland State University 2013
A b s t r a c t i
Abstract
The Altamont Pass Wind Resource Area (Altamont) near Livermore California is
the oldest and largest wind farm in the United States It is known as a location of high avian
mortality especially for diurnal raptors such as the Golden Eagle (Aquila chrysaetos) Using
the avian monitoring data collected at Altamont for over thirteen years (1998-2003 2005-
2011) records were analyzed of 134 golden eagle deaths caused by wind turbine collisions
All wind turbines present during the same temporal range were characterized according to
turbine variables and geographic placement characteristics Values of turbines that killed
golden eagles were compared to values of turbines that did not It was discovered that
turbines that have killed golden eagles (kill turbines) share characteristics that are
significantly different from those that have not Kill turbines are more often situated on
lattice structure towers have larger rotor blade-swept areas are placed in less dense turbine
arrays are further away from the next nearest turbine and are less often placed on top of
ridgelines compared to nonkill turbines Finally kill turbines are more often situated at the
end of a turbine row than are nonkill turbines The differences between kill and nonkill
turbine model hill slope tower height generating capacity array diversity row count of
turbines and placement in a hill saddle were found to be not significant These findings
support in part earlier turbine studies at Altamont but do not concur with all previous
findings The methods used in this study can be applied to any bird species at Altamont and
at any wind resource area throughout the world As the wind industry continues to grow
techniques used in studies such as this are an important tool that can be used to direct
wildlife conservation policies
T a b l e o f C o n t e n t s i i
Table of Contents
Section Page Number
Abstract i
Table of Contents ii
List of Tables iii
List of Figures iv
Introduction 1
Methods 17
Results 46
Discussion 94
Conclusions 103
Acknowledgments 105
Photo Credits 106
References 107
Appendix A List of Fields in the SRC Fatalities Table 112
Appendix B Fatality Detection Form 116
Appendix C M11 Determination of Cause of Death (Adapted) 117
Appendix D List of Fields in the SRC Turbine Table 119
Appendix E List of Fields in the SRC Transects Table 121
Appendix F Use of Circular Package in R to Calculate Aspect Statistics 123
Appendix G Calculations of Hilltop Ridgelines 125
Appendix H Fishnet Square Turbine Count Table 128
Appendix I Abridged Records of Status Id 1 Golden Eagle Fatalities 135
Appendix J Additional Fields Calculated for Turbine Table 143
L i s t o f T a b l e s i i i
List of Tables
Table Title Page Number
I-1 Turbine Models in the Historic Array 15
I-2 Morphometric Characteristics of Golden Eagles 16
I-3 Composition of Golden Eagle Diet 16
M-1 Given and Calculated Turbine Table Variables 44
R-1 All Fatality Records by Status Id 52
R-2 Top 10 Species of Turbine Caused Bird Fatalities at Altamont 1998-2011 53
R-3 Golden Eagle Fatality Records by Status ID 54
R-4 Presence Count by Year and Turbine Model 55
R-5 Monitored Count by Year and Turbine Model 56
R-6 Monitored Turbines as a Proportion of Total Annual Monitoring Effort 57
R-7 Summary Table - Turbine Presence and Monitored Count Totals 58
R-8 Kill Turbines with Golden Eagle Fatality Census 59
R-9 Count of Golden Eagle Fatalities by Year and Turbine Model 63
R-10 Target Species Annual Fatality Count Totals 64
R-11 Search Effort Required per Golden Eagle Fatality 78
R-12 Summary Table of Test Findings 79
R-13 Summary Statistics for Turbine Characteristics 80
R-14 End Row Status by Golden Eagle Age Class 92
R-15 Tower Type by Golden Eagle Age Class 92
R-16 Rotor Swept Area by Golden Eagle Age Class 92
R-17 Ridgetop Status by Golden Eagle Age Class 93
R-18 Nearest Turbine Distance by Golden Eagle Age Class 93
R-19 Sex Ratio of Golden Eagle Fatalities 93
L i s t o f F i g u r e s i v
List of Figures
Figure Title Page Number
I-1 Map of Altamont Pass Wind Resource Area CA 12
I-2 Map of Historic Turbine Array Altamont Pass Wind Resource Area 13
I-3 Aquila chrysaetos Range Map 14
M-1 Wind Turbine Tower Types 42
M-2 Historic Turbine Array and Fishnet Grid 43
R-1 Golden Eagle Fatalities and Monitored Turbines at the
Altamont Pass Wind Resource Area 1998 65
R-2 Golden Eagle Fatalities and Monitored Turbines at the
Altamont Pass Wind Resource Area 1999 66
R-3 Golden Eagle Fatalities and Monitored Turbines at the
Altamont Pass Wind Resource Area 2000 67
R-4 Golden Eagle Fatalities and Monitored Turbines at the
Altamont Pass Wind Resource Area 2001 68
R-5 Golden Eagle Fatalities and Monitored Turbines at the
Altamont Pass Wind Resource Area 2002 69
R-6 Golden Eagle Fatalities and Monitored Turbines at the
Altamont Pass Wind Resource Area 2003 70
R-7 Golden Eagle Fatalities and Monitored Turbines at the
Altamont Pass Wind Resource Area 2005 71
R-8 Golden Eagle Fatalities and Monitored Turbines at the
Altamont Pass Wind Resource Area 2006 72
R-9 Golden Eagle Fatalities and Monitored Turbines at the
Altamont Pass Wind Resource Area 2007 73
R-10 Golden Eagle Fatalities and Monitored Turbines at the
Altamont Pass Wind Resource Area 2008 74
R-11 Golden Eagle Fatalities and Monitored Turbines at the
Altamont Pass Wind Resource Area 2009 75
R-12 Golden Eagle Fatalities and Monitored Turbines at the
Altamont Pass Wind Resource Area 2010 76
R-13 Golden Eagle Fatalities and Monitored Turbines at the
Altamont Pass Wind Resource Area 2011 77
L i s t o f F i g u r e s v
R-14 Golden Eagle Fatalities by Turbine Model and Total Search Count 79
R-15 Golden Eagle Fatalities and Search Totals 80
R-16 Circular Aspect Histogram of Nonkill Turbines 84
R-17 Circular Aspect Histogram of Kill Turbines 85
R-18 Golden Eagle Fatalities by Quarter of Death Date 86
R-19 Golden Eagle Fatalities by Month of Death Date 87
R-20 Radar Chart of Golden Eagle Fatalities with Known Death Dates 88
R-21 Age Class and Death Dates of Golden Eagle Fatalities 89
R-22 Golden Eagle Fatalities by Age 90
I n t r o d u c t i o n 1
Introduction
The wind resources in North America have the potential to provide massive
amounts of clean energy without emissions of greenhouse gases or harmful toxins (US
Government Accountability Office 2005) The US Department of Energy calculated that
land in the United States has an annual potential for 385 million gigawatt hours (GWh) of
wind energy production (NREL 2010) Wind is a growing domestic industry In 2012 13124
megawatts of new wind power capacity was installed in the United States bringing the US
total to 60007 MW This energy is generated by over 45000 individual wind turbines
throughout the nation (AWEA 2012) In 2008 the US Department of Energy released 20
Wind Energy by 2030 a report that details realistic strategies for how US energy demand
can be met with increasing wind power supply (US Department of Energy 2008) It is
reasonable to expect that many more wind turbines will become a regular part of the nationrsquos
skylines
Although wind energy is a plentiful domestic product that does not pollute the air or
water it does come with a biological cost New constructions of turbine arrays and
distribution systems including transmission lines have the potential to disturb or destroy
crucial wildlife habitats (GAO 2005) The costs of developing wind energy are more
concrete when you consider the direct conflicts between wind turbines and the animals that
also use the wind
Many birds have adapted to use winds for soaring and as an aid in migratory flight
This suite of adaptations has developed over deep time however these animals have had far
less time to adapt to sharing airspace with the spinning blades of wind turbine propellers
Unfortunately this nascent competition for winds often brings birds into lethal contact with
I n t r o d u c t i o n 2
tower structures and turbine blades Ground zero for this conflict lies in a rural setting fifty
miles east of San Francisco CA
The Altamont Pass Wind Resource Area (Altamont) near Livermore California
serves as an example of the conflict between wind energy and birds No wind farm in the
world has done more to solidify the idea that energy-generating wind turbines are dangerous
to wildlife (Erickson 2002) Altamont was developed in the 1980rsquos as the nationrsquos first large-
scale wind farm With over 5000 towers the skies over Altamont are a deadly place for
birds Altamont lies in the northeast corner of Alameda County with a small portion of the
array occupying and area in the south east corner of Contra Costa County (Fig I-1)
Altamontrsquos terrain consists of rolling hills of mostly open grassland with gradual
elevation changes and dispersed patches of deciduous hardwood trees including oaks
California buckeye and eucalyptus (Hunt 1999 Orloff and Flannery 1991) Much of the land
continues to be used for grazing by local ranchers
The wind resource area at Altamont covers between 141 Km2 (Hunt 1999) ndash 189
Km2 (Hoover 2002) depending upon what properties are included in the calculation There
are eight companies that operate wind farms in twenty-five project sites and a total of 5463
individual wind turbines have been a part of the historic array at Altamont For the
purposes of this research ldquohistoric arrayrdquo refers to all turbines that have been present at
Altamont between the years 1998 and 2011 (Fig I-2) The number of turbines in the historic
array is 5463 but at no time were that number of turbines all present Due to turbine
removals and installations throughout the temporal range of this study the array fluctuates
annually Tables R-4 and R-7 in the Results section provide counts of turbines per year for
those present (R-4) and those that were monitored (R-7)
I n t r o d u c t i o n 3
Due in part to the diversity of companies operating turbines there is a broad
diversity of wind turbine models within the array There have been 16 different turbine
models present in the time of this study (Table I-1)
Unlike most contemporary wind farms in the United States that do not have a
history of large bird fatalities (Erickson 2001) the turbines at Altamont are known to have
caused numerous bird fatalities including federally protected raptor species (Orloff 1992)
Although studies have identified ways in which new wind farms may reduce conflicts
with birds through alternative tower design and better siting strategies (Erickson 2001)
uncommonly high fatality numbers remain significant among raptor species (Smallwood amp
Thelander 2004) The species that top Altamontrsquos list of raptor fatalities are the red-tailed
hawk (Buteo jamaicensis) American kestrel (Falco parverius) barn owl (Tyto alba) burrowing owl
(Athene cunicularia) and golden eagle (Aquila chrysaetos) (Leslie 2012) Estimates of annual
golden eagles fatalities at Altamont range between 30-70 (Smallwood 2005 Leslie 2012) The
only wind farm in the country that compares with Altamont for golden eagle presence is the
facility at Foot Creek Rim WY where golden eagle deaths are reported far less frequently
(Strickland 2001)
Altamont settlement
Reports of large numbers of raptors being killed by wind turbines at Altamont
activated the San Francisco Bay area conservation community By January 2006 a number of
local Audubon Society chapters together with the group Californians for Renewable Energy
brought suit against wind farm operators and Alameda County to stop the killings of
federally protected bird species A number of wind farm operators chose to settle the suit
outside of court and agreed to take measures to decrease bird fatalities The settlement goal
I n t r o d u c t i o n 4
was a 50 reduction in annual fatalities for target species This reduction goal was based on
a calculated baseline estimate of annual fatalities prior to the agreement (Golden Gate
Audubon Society 2007) The target species were four among the raptor species listed above
red-tailed hawk American kestrel burrowing owl and golden eagle
The settlement agreement also chartered a Scientific Review Committee (SRC) to
oversee the progress of the fatality reduction goal The committeersquos composition is
ldquohellip five members each of whom is appointed by one of the following interests permittees (ie wind
farm companies) environmental community County Planning Department California state agency
(California Energy Commission or Department of Fish amp Game) and federal resources agency
(US Fish amp Wildlife Service) ldquo
The SRC commissioned consulting groups to undertake the bird fatality monitoring
work at Altamont The current contract is with ICF International (ICFI) Staffers of ICFI
conduct the field monitoring and post search data analysis The work of ICFI is to determine
and verify whether the settling parties have achieved the 50 fatality reduction goal Annual
reports that track the status of the 50 reduction goal are published but those reports are
not the only product that results from all of the monitoring programrsquos data collection A
publicly accessible multi-year fatality data set that can be analyzed for trends in bird
mortalities now exists Specifically an investigation of all the wind turbine-caused fatalities of
any single species may reveal patterns or variables that are important in turbines that killed
those birds The bird fatalities at Altamont that have gained the most attention are those of
golden eagles hence golden eagles are the focus of the present investigation
Study organism
I n t r o d u c t i o n 5
The Golden Eagle Aquila chrysaetos is North Americarsquos largest bird of prey and has a
global range in the northern hemisphere (Kochert 2002b) Aquila chrysaetos has a Holarctic
distribution with populations throughout Europe North Africa and Asia Six subspecies are
currently recognized including Ac kamtschatica distributed in Siberia from the Altai
Mountains in the west to the Kamchatka peninsula in the east Aquila c chrysaetos is found in
Europe from the British Islands as far east as the Altai Mountains Aquila chrysaetos daphanea
is found from Turkestan through India Pakistan and into China Aquila chrysaetos homeyeri is
limited to the Iberian Peninsula and coastal areas around the Mediterranean Sea including
North Africa Aquila chrysaetos japonica is limited to the Japanese archipelago and Korean
peninsula (Kochert 2002b) Aquila chrysaetos canadensis is the only subspecies of golden eagle
recognized in North America (Fig I-3) and is the taxon that occurs in the Altamont Pass
Wind Resource Area
The golden eagle is a long-lived species Banded individuals in North America have
lived as long as 31 years although in California the record is 20 years (Lutmerding 2013)
They display sexual dimorphism with the females being larger in measurements (Bortolotti
1984)
Golden eagles are known to prey on a diversity of terrestrial wildlife as well as avian
prey It has a highly adaptable diet that consisting mainly of small mammals Drawing from
primary sources throughout North America a 1976 survey of faunal remains in golden
eagles nests recorded a diet heavily weighted toward mammals
Larger mammals and birds donrsquot make up a large proportion of the golden eagle diet
so it is remarkable when these events are recorded There are published accounts of golden
eagles preying on island foxes (Urocyon littoralis littoralis) (Coonan 2005) pronghorn antelope
I n t r o d u c t i o n 6
(Antilocapra americana) (Tigner 1973) calves of domestic cattle (Bos taurus) (Phillips 1996)
mule deer (Odocoileus hemionus) (Olendorff 1976) and birds such as the red-tailed hawk (Buteo
jamaicensis) great horned owl (Bubo virginianus) and American coot (Fulica americana) (Dixon
1937) They are not known to regularly pursue fish like the bald eagle but as opportunistic
scavengers may consume fish as carrion (Ollendorff 1976)
Golden eagles near the Altamont Pass Wind Resource area feed predominantly on
California ground squirrels (Spermophilus beechyii) which account for 69 of prey items found
at golden eagle nests in the area (Hunt 1999) The rolling hills and open grassland of the
wind resource area seem to be very good habitat for ground squirrels and so it is likewise an
equally good hunting ground for golden eagles The abundant presence of ground squirrels
may help to explain the high golden eagles presence in the area
Mating amp reproduction
After maturity golden eagles form mating pairs that occupy and defend a territory
They usually breed every year and their brood is typically one or two chicks (sometimes
three) with facultative fratricide not uncommon in the nest (Edwards 1983) Individuals
appear to prefer nest sites high on cliff faces or when rocky outcrops are not available in
large trees (Menkens 1987)
Fledgling eagles leave the nest after an incubation period of 45 days and a fledging
period of ten to eleven weeks (Hunt 1999) Until this time both male and female parents
provision the young with food Once the juvenile birds leave the nest they remain in the
area for approximately two months with increasing independence from their parents Soon
thereafter the mating pair is known to chase juvenile birds away from their nest and
breeding territory At this point the juvenile birds are on their own with respect to feeding
I n t r o d u c t i o n 7
Survival probability estimates for juvenile golden eagles have been made on the central
California and Denali National Park populations These estimates show a probability of
survival between 78 in Denali (McIntyre 2006) and 84 in central California (Hunt 2002)
in the months following fledging
Population composition
The golden eagle population in the lands surrounding Altamont has been well
studied A 1995 survey found 44 breeding pairs occupying territories in the 820 Km2 area
surrounding Altamont This is one of the highest recorded population densities of golden
eagles and the figure is considered by many to underestimate real numbers (Hunt 1995)
A typical population of golden eagles is composed of four groups Adult eagles form
breeding pairs when breeding territories become available Juvenile are volant up to one year
old They do not breed and do not control territory Sub-adults are immature and range in
age between 1-3 years old Sub-adults do not breed and do not control a home territory
Finally there are mature adult eagles that do not possess or defend territories These non-
breeding adults are referred to as floaters (Hunt 1995) Floaters serve as a reserve in a
population for when breeding adult birds are eliminated (Hunt 1999)
Flight
Golden eagles display a number of flying styles including flapping gliding soaring
stooping and undulating flight (Kochert 2002b) Observations of golden eagles at Altamont
reveal that two types of flight are used primarily These consist of thermal soaring and
gliding (Hoover 2002) Thermal soaring helps eagles to gain elevation above the hunting
grounds after which they employ gliding to gradually move into position to pounce on prey
I n t r o d u c t i o n 8
While actively hunting the characteristic flight pattern of these eagles is referred to as
contour hunting and is characterized by low elevation flight 1-5 meters above the ground
during which the ridges and contours of the hillsides are followed (Carnie 1954 Collopy
1983) It is thought that this low profile flying allows eagles to get within close proximity to
their prey without the latter having much advance notice This low elevation contour flight
brings golden eagles into close proximity with the height of wind turbine blades and is
thought to be the primary reason why golden eagles are struck by turbine blades
Migration
The ecology of golden eagle migration has been well studied in several parts of the
United States and Canada (Applegate 1987 Omland 1996 Yates 2001 McIntyre 2006 Good
2007) but migratory tendencies of the Altamont golden eagles are less known The Coast
Range of California hosts resident golden eagles (Carnie 1954) and it is assumed that the
same holds for Altamont Whether or not golden eagles that are killed by turbines at
Altamont are resident eagles or are rather migrating or dispersing individuals is a question
that is important to pursue because it may explain how the population of golden eagles
around Altamont remains so seemingly stable in spite of the annual fatality estimates that 30-
70 golden eagles are killed at Altamont annually (Hunt 2002 Smallwood 2005 Leslie 2012)
No studies so far have provided answers to these questions so they remain unexplained
Federal Protection
In 1918 the Migratory Bird Treaty Act was signed by the United States and Great
Britain on behalf of Canada The act created criminal penalties for the taking or harming of
an extensive list of native migratory and resident birds in North America The law was
I n t r o d u c t i o n 9
initiated as a corrective measure to alleviate the damage to bird populations by market
hunters in the previous years The MBTA protects all native North American birds with the
exception of certain game birds In 1962 the golden eagle gained added protection when it
was added to the 1940 Bald Eagle Protection Act which was then renamed the Bald and
Golden Eagle Protection Act This act prohibits the taking of any eagle or eagle part without
a permit and it provides increased penalties for violations of the act
Threats
As the largest raptor in North America the golden eagle has few predators (Hunt
2002) besides humans Although the Bald and Golden Eagle Protection Act has outlawed
hunting of these birds eagles do still suffer indirectly from of human hunting activity There
are over 125 million deer hunters in the United States (Aiken 2011) Not every hunter
successfully kills a deer and of those that do many do not recover the deer they shoot
Unrecovered deer carcasses and discarded gut piles of deer that were shot by hunters using
jacketed and unjacketed lead bullets or slugs are a source of microscopic lead fragments that
are easily ingested by scavenging animals (Hunt 2006) As opportunistic scavengers golden
eagles may feed on these carcasses and can ingest large quantities of lead particles Surveys
conducted in Montana and California have shown between 35 and 85 of golden eagles
have elevated blood lead levels (Harmata 1995 Pattee 1992)
Other causes of golden eagle deaths come from a variety of human related sources
A 1995 survey of golden eagle carcasses conducted by the National Wildlife Health Center
showed that electrocutions claimed 25 and gunshots were responsible for 15 Poisoning
accounted for 6 of deaths and accidental trauma was responsible for 27 of the deaths of
specimens in the survey The remaining 27 were not described (Franson 1995) Accidental
I n t r o d u c t i o n 1 0
trauma included birds killed by collisions with cars buildings structures and wind turbines
Among these causes of unnatural deaths of golden eagles deaths caused by wind turbines
are the subject of the present study
With Altamontrsquos thirteen years of bird fatality data being available to the public
unique opportunities for research exist Investigations can now be conducted to better
understand the factors contributing to bird deaths at Altamont The goal of the present
study is to determine whether there are unique spatial factors and turbine characteristics that
contribute to golden eagle turbine collisions
I hypothesized that a turbinersquos physical attributes or its placement in the landscape or
within an array of turbines will lead to a relative increase or decrease in golden eagle
fatalities In particular I was interested to discover what differences existed between turbines
that displayed relatively increased fatalities versus turbines that had relatively reduced
fatalities To test for this difference every record of a golden eagle fatality at Altamont
between 1998 and 2011 was examined and filtered to establish those killed by turbine
collisions and from these a roster of fatal turbines was established
A comprehensive survey of every turbine at Altamont was undertaken and each
turbine described according to a set of characteristics These wind turbine attributes can be
divided into two categories Innate turbine characteristics are those that would be the same
no matter where the turbine was placed This includes tower height turbine model tower
type rated energy generating capacity and rotor swept area Placement characteristics are
those that are dependent upon where in the landscape or within a turbine array a turbine is
erected These characteristics include base elevation at placement the number of other
turbines that are in the same row aspect and slope of the ground on which the turbine
I n t r o d u c t i o n 1 1
stands density of turbines diversity of local turbines whether or not an individual turbine is
in a saddle of a hilltop ridge as well as the distance to the next nearest turbine Much of this
information is readily available through the SRC website but a portion of the placement data
must be calculated Once the turbine survey was complete the attributes of turbines that
killed golden eagles were compared to the characteristics of turbines that did not produce
kills If spatial factors or turbine characteristics do not appear in a significantly higher
frequency in turbines that have killed golden eagles than in those turbines that have not
killed golden eagles the hypothesis that innate or placement characteristics contribute to
eagle fatalities from wind turbines will be rejected
To investigate how demographic characteristics and temporal variation may
influence wind turbine-caused fatalities I examined age class and sex designations as well as
calculated death dates of golden eagle fatalities at Altamont A demographic analysis is
important to determine whether or not any age class is being disproportionately killed by
turbines Further analysis illustrates which temporal intervals are most deadly for each age
class and sex of golden eagle
I n t r o d u c t i o n 1 2
Figure I-1 Map of Altamont Pass Wind Resource Area CA
All maps created by Andrew Pinger in ArcMap 100 2011-2012
I n t r o d u c t i o n 1 3
Figure I-2 Historic Turbine Array Altamont Pass Wind Resource Area
Interstat
e
580
I n t r o d u c t i o n 1 4
Figure I-3 Aquila chrysaetos Range Map
Map data provided by NatureServe in collaboration with Robert Ridgely James
Zook The Nature Conservancy Migratory Bird Program Conservation International
Center for Applied Biodiversity Science World Wildlife Fund US and Environmental
Canada and WILDSPACE
I n t r o d u c t i o n 1 5
Table I-1 Turbine Models in the Historic Array
Turbine Model n Tower
Type(s) Tower Height
(m) Generating
Capacity (kWh)
Rotor Swept Area (m2)
250KW 20 Tubular 80 250 4906
Bonus 536 Tubular 60-80 65-150 1971 ndash 4212
Danwin 39 Tubular 80 110-160 2831 - 4212
Enertech 170 Lattice 60-80 40-60 1413
Flowind 169 Vertical
Axis 92-102 150-250 2288 - 2805
Howden 86 Tubular 112 330-750 na
Kenetech 56-100 3400 Lattice 60-140 100 2539
KVS 33 41 Lattice amp Tubular
80-120 400 8553
Micon 221 Tubular 80 65 1973
Mitsubishi 1000A 38 Tubular 60 1000 2538
Nordtank 371 Tubular 78-80 65-150 1971 - 4212
Polenko 12 Tubular 80 100 2540
V-47 31 Tubular 164-180 660 17304
Vestas 202 Tubular 45-80 95 2264-2600
Windmaster 101 Tubular 23 50-250 2940
Windmatic 26 Lattice 60 65 1682
Total 5463
I n t r o d u c t i o n 1 6
Table I-2 Morphometric Characteristics of Golden Eagles
Trait Female Male Source
Mass (grams) 3374-6124 2495-4281 Edwards 1986
Mean Wing Chord (mm) 6404 5950
Bortolotti 1984
Wing Chord Range (mm) 601 - 674 569 - 619
Table I-3 Composition of Golden Eagle Diet
Animal Group Percent
Rabbits and hares 541
Marmots prairie dogs and ground squirrels 218
Game birds 80
Hoofed animals 44
Passerine birds 32
Deer 19
Domestic Livestock 14
Mammalian predators 12
Avian predators 09
Waterfowl 05
Method s 17
Methods
Rather than undertake a novel study that would likely be limited in scope and
breadth to what a single researcher could collect in one or two seasons publicly available
data including thirteen years of observations fatality searches and geographic data were
accessed and used The Altamont Pass Wind Resource Arearsquos Scientific Review Committee
(SRC) provided these data on their websitersquos avian monitoring data portal This portal was
created and is maintained by the Portland OR staff of ICF International a Virginia-based
company that was contracted by the SRC to conduct bird monitoring and analysis of
fatalities at Altamont
The available data can be manipulated in standard publicly available software such as
Microsoft Excel Three tables in particular were used to calculate and analyze bird fatality
information The first is a fatalities table that includes all fatality records from 1998 to
present The second is a turbine table that holds information of the wind turbine array at
Altamont Finally there is a transect table that consists of records of searches dates and
protocols of the Altamont bird monitoring program The following section contains details
of each of these tables and the most pertinent fields from each table are described
SRC Fatalities Table
This table includes every record of a bird or bat fatality recorded at Altamont since
May 1998 There are 7560 records between May 1998 and December 2011 Each record
has 73 fields including such characters as species discovery date carcass condition
searchersrsquo initials etc A full listing of the 73 fields can be seen in Appendix A including
metadata for each field
Method s 18
Biologists conducting monitoring surveys at Altamont completed a fatality report for
each detection of a bird or bat fatality they found Each fatality report appears as a record in
the fatality table A copy of a fatality report completed in the field appears as Appendix B
Protocols for detecting bird fatalities at Altamont have evolved over many years
Current protocols include search transects walked by field biologists along a predefined
route (SRC 2007) The distances between transect routes in a search area is 6 - 8 meters This
distance accounts for a 3-4 m sightline on either side of the searcher The searched area
surrounding a turbine in Alameda County continues to a 50 m radius from the turbine base
For some turbines in Contra Costa County the radius extends to 60 and 75 m depending
upon the height of the turbine The taller turbines are afforded a larger search radius because
it is reasoned that a taller turbine with longer blades may throw a bird carcass further than
the smaller bladed turbine
The array of turbines monitored at Altamont (Fig I-2) is divided in two by Altamont
Pass Road with approximately half of the array on the north side of the road and half on the
south Turbines are grouped into plots which may contain multiple strings Each string
contains numerous turbines Each turbine is searched once a month according to a
predetermined transect schedule
When a dead bird is discovered biologists complete a fatality report by collecting
information about location of the body relative to the nearest turbine or other structures
Global Positioning System (GPS) coordinates of the carcass are recorded using a handheld
GPS device Also recorded at the time of detection are the plot string number and the
turbine label or turbine id
Method s 19
Valid detections of a bird fatality do not require a complete or even a partial carcass
Due to the presence of numerous bird and mammal scavenging species at Altamont it is
clear that a bird could be killed by a turbine and completely removed by an animal such as a
badger or coyote When this happens few traces of the bird may remain The M1 protocol
indicates that discovery of either 5tail feathers or 2 primaries or any combination of 10 total
feathers all can be considered a valid turbine-related fatality A detection such as this is
referred to as a ldquofeather spotrdquo The discovery of a feather spot suggests the presence of a
scavenger in the area and that this scavenger may have removed the remainder of the
carcass (SRC 2007)
Carcasses or remains are identified to the species and the age and sex of the bird is
determined if possible Plumage patterns carcass size and beak foot or other morphological
feature may be used to determine the taxonomic identity of a given fatality
The condition of the carcass is described in the detection form Through the notes
and body parts fields the monitoring team describes what was found This will include
descriptions of feathers parts of a carcass or a complete carcass Given the description and
details regarding stage of decomposition an estimate may be made of time since death and
cause of death Evidence of scavenging can also be assessed by presence of insects gnawed
bones or feathers or absence of body parts
A bird fatality may be discovered the day it was killed or months after its death It is
because of this temporal uncertainty that the date of discovery must be recorded in order to
estimate the date of death Estimates take into account carcass condition or state of decay of
the carcass and amount of time elapsed since the last search was performed at that site For
Method s 20
this study the specific day or month of death is not used Only the year of the birdrsquos death
was used to create annual fatality counts
Causes of death for bird fatalities are determined using protocols in the M11
determination of cause of death manual (SRC 2008a) Any golden eagle that is found within
the search area and does not show signs of electrocution is considered to have been killed by
a turbine collision unless the condition of the carcass is so scattered or deteriorated that the
cause of death is considered Unknown The unknown designation may be used when only
bone fragments or loose feathers remain The M11 cause of death protocol is available as
Appendix C
Following the initial collection of fatality data in the field fatality records were given
unique identifying numbers They were then filtered and given a status id that indicated how
the record would be considered for future analysis For example it may be determined that a
single dead bird was detected more than one time andor on more than one day When
multiple fatality records refer to the same bird then detections after the first one are given a
status id of 11 which is a duplicate detection of a known fatality If a bird is found more
than 125 meters from the closest turbine it is given a status id of 4 and is excluded from
this study Excluding records of birds found outside of the turbine search radius ensures that
extraneous non-wind turbine caused fatalities are not added into fatality estimates All
records were graded according to the M26 decision tree for Altamont bird fatality data
filtering protocol (SRC 2008b) Only golden eagle records with a status ID of 1 - valid
turbine related fatality - were used in this study
Method s 21
The first step in working with the fatality table was to filter records at the species
level and remove all records that were not golden eagles The second step was to filter the
table by status id and remove all records that had a status id other than 1
Among the most important fields in the fatality table is the turbine label field The
turbine label is an identifier that appears on the wind turbine tower When a biologist finds a
bird fatality he identifies the nearest turbine to the fatality and records its turbine label This
creates the initial pairing of a fatality to a specific turbine hence to that turbinersquos attributes
This leads to one of the assumptions of this work It is assumed that the turbine
closest to a bird fatality is the turbine that killed that bird This is potentially problematic for
several reasons It is possible that a scavenger could have moved a birdrsquos body Alternatively
birds injured by turbine strikes that did not die right away may have sufficient mobility to
cross from one search area into another If an injured bird then died in the adjacent search
area a non-offending turbine would be credited with the birdrsquos death In fact Hunt found
that five of 42 blade-stuck golden eagles his study were able to live through the initial trauma
long enough to wander away from the turbinersquos search radius (2002)
Because there are rarely if ever eyewitnesses to bird collisions with wind turbines this
assumption must be made The work of the SRC is to verify annual fatality counts for target
species in accordance with the settlement agreement (Golden Gate Audubon Society 2007)
Because this charge is narrowly focused on counting and calculating fatalities there have not
been efforts introduced to verify the relationship between a carcass location and the identity
of the turbine that was responsible for killing it As Huntrsquos findings demonstrate there is
clearly room for error but no estimate has been suggested
SRC Turbine Table
Method s 22
The turbine data table available from the SRC bird monitoring data portal includes
ownership and operator information as well as location and model details for each of the
5463 turbines that have operated at Altamont between 1998 and 2011 the temporal range
of the present study These data come from wind farm operators and includes X and Y
coordinates for each turbine A listing of the 27 fields in the turbine table can be seen in
Appendix D including metadata for each field
The turbine table was used to join fatality data to turbine data By matching turbine
labels with string ids turbine ids were assigned to fatality records Once this process was
completed a new variable and field was created denoting whether a turbine is a golden eagle
killer or not Turbines that have fatalities connected to them were considered ldquokill turbinesrdquo
while those that had no golden eagle fatalities connected to them were considered ldquononkillrdquo
turbines
Two of the most important fields in the turbine table are ldquodate installedrdquo and ldquodate
removedrdquo fields The values in these fields give calendar dates for when the turbine was
installed and when or whether a turbine has been uninstalled With these data an annual
census of the turbine array was calculated Turbines have been removed from Altamont for a
number of reasons including repair disuse or repowering a strategy of removing many
smaller turbines and replacing them with fewer larger more efficient turbines
The presence census is just an initial step in describing the turbine array Because not
every turbine is monitored every year by the field biologists it is important to determine
what turbines were searched and how often they were monitored This is done by
incorporating the transect table from the SRC data portal
SRC Transect Table
Method s 23
The transect table is a document that consists of 20 fields and 26601 transect
records A transect is a record of when the turbines of a given string were searched Initially
the string number referred to a unique set of wind turbines that were geographically grouped
together in a line or string on the landscape Over the years with additions and removals of
turbines the geographic cohesiveness of the turbines in any given string has been
inconsistent Because of this string numbers became anachronistic and data managers had
to code each turbine with a string number and create a string id field that would be constant
Because neither the string number nor string ID fields currently reflect cohesive consistent
or accurate geographic relationships of turbines I created a new field called screen id that
does capture accurate geographic relationships among turbines More about screen ids will
be described in the next section
The two most valuable fields in the transect table are the string number and the
monitoring year fields Each transect can be joined to the turbine table through the string
number This allows one to tally the number of times each turbine was searched each year
The number of times a turbine was monitored each year was calculated and added as a new
field to the turbine table
This introduces the second major assumption of this research When a string number
appears in the transect table there is a corresponding field called ldquonumber of turbinesrdquo This
refers to the count of turbines in that string number group When the transect table shows a
string number searched on a particular date it is assumed that all of the turbines on that
string are searched on that date This assumption is made because the transect table is not
detailed enough to display a list of transects for every turbine for every occasion that it is
searched The turbines are grouped into strings and only the string number is listed The
Method s 24
transect table is simply the document of record and does not indicate partial string searches
so it must be assumed that all turbines were searched A listing of the 20 fields in the transect
table is provided in Appendix E including metadata for each field
Data Production
In this section I describe how I generated new data by manipulating the data from
the three tables described above and how I created new information using Microsoft Excel
tools and Esrirsquos ArcGIS programs Table M-1 lists each turbine variable a brief description
and an indication of the origin of the data Many of the data come directly from the SRC
monitoring data tables but a significant portion of it was calculated using the tools
mentioned above What follows is a description of each variable and what was done to
calculate its values
The first step in calculating and analyzing data was to ensure that all of the provided
information was error checked and corrected Fields that included NA values or spelling
errors had to be rectified and any numerical field values with supernumerary digits fixed
Many of the variables in Table M-1 required the use of a GIS program to calculate I used
ESRIrsquos ArcGIS software suite including ArcMap version 100 and ArcCatalog version 100
to import data and geographic files to compute these values
Once the downloaded turbine fatalities and transect tables were cleaned up and
error checked they were combined into a single Excel file From this point forward all new
calculations were added as fields into a singular table In the following descriptions of this
process I will make distinctions between the original provided data tables by prefacing them
with SRC for example SRC turbine table
Method s 25
Using X Y and Z (elevation) coordinates I imported turbine data into ArcMap to
establish the historic array geographically Once the historic array was mapped sequential
annual map layers were created according to whether each turbine from the historic array
was present or not To undertake this step I referred to annual presence fields detailed on
the next page I added an elevation raster dataset from the United States Geological Surveyrsquos
National Elevation Dataset (NED) The N38122W dataset has 13 arc-second resolution
with the following bounding coordinates West -12200056 East -12099944 North
3800056 and South 3699944 I converted the raster set into a shape file and used the clip
tool to reduce its size to an area just larger than that covered by the Altamont turbine array
Clipping the elevation layer made data calculations and rendering more manageable and
nimble This clipped NED layer was used throughout this study and provides the foundation
for many thousands of calculations
Kill Turbine
This is the response variable in this study and refers to whether or not a turbine has
been responsible for killing a golden eagle This binomial variable was calculated through
Excel vertical lookup formulas that combined the turbine label and string number fields
from the SRC fatalities table to the string number and turbine id fields of the SRC turbines
table The new binomial field was populated as true for those turbine records that were
linked to golden eagle fatalities records or false for those turbines that were not associated
with any golden eagle deaths
Number of dead golden eagles
Method s 26
This variable represents the number of golden eagle fatalities per turbine per year A
ldquodead eaglesrdquo field was created in the turbine table for each year of the study and a field for
total dead eagles was included Filtering the turbine table for kill turbines populated these
fields Golden eagle records from the fatalities table were then put into a pivot table that
produced an accounting of how many eagles per year were killed The number of dead
golden eagles was then entered into the appropriate field for each turbine
The SRC fatality table includes fields for sex and age but the data collected by the
biologists at the time of discovery are not complete Fig R-3 in the results section shows the
distribution of age class for golden eagle fatalities The sex of an eagle carcass must be
difficult to establish because among the records used for this study only 2 were identified as
female and the rest were unidentified Age class can more easily be established through
feather molt sequence and patterns of color that change over the course of an eaglersquos age
(Liguori 2004 Ellis 2004) This may account for why the age records are more complete
Presence
For the purposes of this study it is necessary to determine what turbines were
present each year The SRC turbine table has installation and removal dates for many of the
records but not all of them There are no installation data for 2145 of 5463 records I
therefore assume that they were present at the beginning of the study in 1998 The remaining
3318 records were counted as present according to the published installation date The SRC
table has no removal data for 3468 records so I assumed that these 3468 turbines continued
to be present through the end of the study period 2011 Using this information annual
presence fields were added to the turbine table and were named PRE98-PRE03 PRE05-
PRE11
Method s 27
These presence fields were populated by the binomial variables true and false When
the turbine table was later imported into ArcMap for rendering these annual presence fields
were used as the source for creating presence turbine shape files in ArcMap This allowed
me to create maps of turbines present for each year Details on how these maps are created
appear in the screen id section These generated maps are critical in calculating other
variables such as end row status screen count nearest turbine model nearest turbine
distance density diversity index etc An annual presence summary table appears in the
Results section as Table R-4
Monitored amp Monitored Count
Annual presence of turbines is important in calculating numerous variables but
before testing can begin another filter must be created to account for what turbines were
monitored or not Because the array at Altamont is so large it is both financially and
logistically prohibitive to monitor or search every turbine Biologists and statisticians along
with the Scientific Review Committee have designed a monitoring protocol in which
turbines are search every 4-6 weeks There are however some turbines in the annual array
that are never monitored And there are some turbines that are monitored some years but
not others Therefore annual monitored fields were calculated
Merging the SRC turbine and transect tables produced this variable Using the
transect table as a source an Excel pivot table was created that displayed the sum of
transects for each string id for every year These data were then referenced back into the
turbine table through a vertical lookup formula using sting id as a lookup value This was
done per turbine per year The result was the creation of ldquoyearly monitored countrdquo fields for
each turbine
Method s 28
The yearly monitored count fields were copied and pasted onto the end of the
turbines table to be converted into binomial variables so that data manipulation was more
efficient Rather than monitored counts each value was converted to true or false If the
monitored count was greater than zero it was converted to True If it was zero the value
was changed to False This step provided new ways to sort and manipulate the data and
allowed for more calculations It also provided the definitive list of what turbines were
monitored for each year A summary table of annual monitored turbine counts is included in
the results section as Table R-5
An important correction was necessary before this dataset was ready to analyze
having to do with presence vs monitored status As new turbines were added into the array
they often were included into previously established turbine strings Because the monitoring
count calculations were made using the string id on the historic array table some turbines
were given credit for being monitored even before they were present This was corrected by
using the AND function formula in Excel the yearly monitored fields were checked to see if
they were getting credit for monitoring when they were not present
=AND(AE16=FALSEAS16=TRUE)
This formula checks to see whether the value in the presence was false and if the
value in the monitored field was true When cells with incorrect values were found each was
corrected in both the yearly monitored and yearly monitored count fields Once the turbine
table included yearly monitored fields it was possible to import it into ArcMap to create
turbine array maps of only monitored turbines
Turbine ID
Method s 29
As mentioned in the sections above this is a unique value for each wind turbine that
has ever been placed at the Altamont Pass Wind Resource Area Through joining the turbine
table to the SRC transect table golden eagle fatalities were permanently linked to the
characteristics of turbines that are considered responsible for each birdrsquos death
Turbine Model
The turbine model field is populated directly from the SRC turbine data table There
are 16 different models that have been present at Altamont The list of turbine models
appears in Table I-1 as well as in several tables in the results section
Elevation Slope and Aspect
These are the first three geographic placement variables considered Elevation is
height above sea level at the base of the wind turbine tower measured in meters It is
important to know if a wind turbinersquos elevation plays any role in golden eagle deaths because
the widely varying landscape throughout Altamont provides opportunities for diverse
placements of towers
Most turbines at Altamont are placed somewhere on a hillside Slope is a
measurement of prevailing pitch of the hill under which the turbine tower stands It is
measured as a proportion of the amount of elevation gain over a measured distance
Aspect is a measurement of the prevailing direction that the hillside faces and is
measured in degrees Because it is measured in degrees it is circular data and is analyzed as
such There is a package available for R named lsquocircularrsquo that calculates circular statistics and
creates graphic displays of data It was used to analyze all aspect data for this study
Appendix F includes the R scripts and explanations for how the lsquocircularrsquo package is used
Method s 30
The majority of elevation slope and aspect values were already populated in the SRC
table but some of the more recently installed turbines had incomplete records and were
calculated using ArcMap
To calculate missing values a turbine table was imported into ArcMap and converted
into an object-oriented shape file using the X and Y coordinates for turbines placements
The 13 arc-second resolution National Elevation Dataset (NED) raster file previously
mentioned was added as a layer into the document With the NED file and turbine locations
assembled together each turbine with missing slope elevation or aspect was selected and the
missing information was displayed in the objectrsquos attribute table The data were manually
entered into the turbines table for analysis
Tower Type
This variable refers to the type of structure that elevates the actual turbine
mechanism to heights where it harnesses wind to generate electricity There are three tower
types that prevail in the Altamont array (Fig I-3) - lattice tubular and vertical axis Lattice
towers have an open architecture that somewhat resembles of the Eiffel Tower with
exposed rails and girders These types of towers may also include guy wires for additional
support Tubular towers resemble solid columns from the ground to the turbine and include
internal ladders for maintenance workers to access turbines Finally vertical axis turbines
(also known as egg-beater turbines) are a novel design They typically have two curved blades
that emanate from the base and reconnect to the top of the axis Guy wires are incorporated
for additional support Most of the records in the SRC turbine table were complete for this
field but some were calculated using other turbine records as references
Method s 31
Tower Height
The height of the tower is measured in meters from the base to the turbine axis in
horizontal axis models In vertical axis models this measurement is from the base to the top
of the axis This variable was provided in the SRC turbine table Higher tower height was
found to be linked with increased bat fatalities but not with increased bird fatalities (Barclay
2007 Thelander 2003) Due to the golden eaglersquos low elevation contour flight pattern
investigating tower height was seen as important to this study
Rotor Swept Area
Rotor swept area refers to the total space swept by wind turbine blades as they
operate This is a value that was given in the SRC turbine table for most turbines and was
converted from square feet into square meters For the towers in which the value was not
given rotor swept area was calculated by using the blade length (given in the SRC table) as
the radius in the following formula
πr2 = Area of a circle
Generating Capacity
This variable was given in the SRC turbines table and refers to the rated energy
generating capacity measured in kilowatts per turbine Generating capacity is one measure of
the size of a turbine There is a question of whether or not a smaller turbine is more
dangerous to birds If the turbine is less conspicuous or has faster spinning blades perhaps
birds would not notice the turbinersquos presence before they were struck By comparing the
generating capacity of fatal turbines to those that have not killed golden eagles one may be
able to begin finding evidence for or against some of these concepts The Altamont
Method s 32
settlement parties measure biological costs of energy production in the form of
fatalitiesmegawatthouryear and the industry uses this same metric to compare bird and
bat fatality rates of one wind farm to another
Settling Party
This is a binomial variable calculated using the SRC turbine table Preceding the
settlement agreement seasonal experimental shutdowns of some wind turbines had been
practiced Following the 2007 settlement those wind operators identified as Settling Parties
commenced a regimented seasonal shutdown program A list of turbines that were shutdown
was not available but the turbine table includes ownership information AES Seawest
Altamont Power Altamont Winds enXco and NextEra are the wind operators that are
considered settling parties so all turbines owned by those companies were marked as true
Those owned by other companies were marked false
Ridge Top Turbines
To calculate whether a turbine exists on or near a hilltop ridgeline a series of
calculations were made according to the steps outlined on ESRIrsquos support page (Article
39093 October 2011) Using the Digital Elevation raster (DEM) along with the map algebra
and hydrology toolsets line features were created that represent continual high point ridges
throughout the APWRA Briefly the hydrology toolset can be used along with a DEM to
discover watershed features and low points throughout a map This is helpful in determining
where a stream is or should be and predicting which direction water flow will occur Using
the map algebra tool all of the values in the DEM layer were multiplied by -1 This step
Method s 33
inverted the elevation layer turning the high points at Altamont into low points so the
hydrology tools could be used
The hydrology toolset picked out the lowest points and probable stream channels
Inverted these were the ridgelines or complete opposites (-1) of streambeds Ridgelines
were then exported as a separate line feature layer and added to the map The complete
sequence of steps in this calculation is available in Appendix G
Next the near tool in the analysis tools toolbox was used to calculate what turbines
in the historic array are located within 10 m of previously calculated ridgelines The historic
turbine array table was used as the input for this calculation because it is the complete list
and because the turbines never moved from the locations in that table The ridgelines shape
file was used as the near feature and a search radius of 10 m was selected This calculation
returned distance values for every turbine that was at or within 10 m of a ridgeline These
data were then joined to the turbines table as a single binomial field named RDGTP with
values of either true for those at or within the 10 m radius or false for those that were
outside of the 10 m radius
End Row Turbines
As a bird approaches a row of turbines on an intersecting path it may consider the
row as a single entity on the landscape rather than a collection of individual turbines With
the turbines as densely arrayed as they are at Altamont this idea merits consideration If a
bird attempts to fly around the turbine row rather than through it it may instead be in close
proximity to the turbines at the end of the row If this does occur then end row turbines
should have more opportunities to kill birds and should have a higher fatality count to
support this hypothesis
Method s 34
Like screen count end row turbines are determined on an annual basis Using the
annual turbine presence layers described above a visual survey of every turbine screen was
performed to determine end row turbines Standalone turbines were not considered to be in
a row and were given a value of false
Saddle
A saddle refers to a dip in ridgeline on a hill or mountain From ground level it will
appear as a depressed area between two peaks of higher elevations Another name used by
mountaineers for this feature is col With elevations between zero and 650 m above sea level
the terrain at Altamont does not offer the most dramatic examples of hill saddles but they
are present Hill saddles are of particular interest in this study because they represent
probable flight paths for birds that are intent on overcoming a ridgeline by using the lowest
elevation passage possible Turbines placed in a hill saddle would then be close to more birds
passing by therefor theoretically having an increased chance at making contact
Turbines in hill saddles were located using ArcMap Unfortunately I was not aware
of any single tool 3rd party package SQL script or formula that can easily identify hill saddles
from an elevation profile or dataset Therefore the calculations for whether or not a turbine
stands in a hill saddle are a mix of new mapping technologies and old map reading
techniques as described below
I used the contour tool in the spatial analyst toolbox The 13 arc-second resolution
NED raster was once again used as the input raster and a contour interval of 10 meters was
selected This produced a tidy polyline feature that was incorporated into the base map Hill
shades were created using the 3D analyst hillshade tool to make the map easier to read and
understand I then loaded the historic turbine array shape file and displayed the turbines
Method s 35
according to their X and Y coordinates Then I examined each of the 5463 turbines of the
historic array and characterized each as being in a hill saddle or not Turbines that were
obviously not saddle turbines due to the character of the contour lines I marked as false
For those turbines that were closer to obvious saddles I used a distance-measuring tool in
ArcMap If a turbine was within 25 m of the center of a hill saddle I marked it as true I
used 25 m as a measurement to include those turbines that were not centered in the saddle
path of which there were few Because the contour line interval was set to 10 m the
resolution is not very high Hill saddles are typically not narrow avenues Most at Altamont
were 30 - 50 meters wide measured from one contour line to the same contour line on the
other side of the saddle so a 25 m radius is reasonable
Fishnet ID
Both the turbine density and Shannon diversity index variables rely on the creation
of a parameter that defines a geographic space This was done in several steps by creating a
grid that overlays the full extent of the Altamont Pass Wind Resource Area First the buffer
tool in the proximity toolkit was used to create 100 m buffers around each turbine of the
historic array This step was done to increase the footprint of the array The buffer tool was
set to dissolve all of buffers into several large polygons in a single shape file
The next step was to run the create fishnet tool in the data management toolkit and
use the previously created footprint shape file as the extent input By using this input the
fishnet that was produced would be confined to the smallest area that would cover the entire
array Ideally the fishnet would consist of squares that were each 1000 m by 1000 m but
because of some limitations of the tool and the size and shape of the array the finalized
fishnets were not exactly that size
Method s 36
The finished fishnet grid consists of 19 rows and 16 columns (Fig M-2) Each
fishnet square measures 101176 m long by 98125 m wide This equals 99279541 m2 per
fishnet square or 0993 Km2 per fishnet square The finished fishnet grid was saved as a
polygon shapefile Using the spatial join tool in the analysis toolkit the turbine table shape
file and the fishnet polygon shape file were joined This step added new fields to the turbines
shape file attribute table that included the name of the fishnet id for every turbine record
The updated turbine attribute table with the new relationship between turbine ids and
fishnet ids was exported back into Excel for further manipulation including calculations of
fishnet diversity and density
Density
The density of the turbine array is an important variable to consider The array at
Altamont was established well before many of the best practices for wildlife collision
avoidance were created Altamontrsquos turbine towers were placed in close proximity to each
other and turbine rows are sometimes established so closely to each other that they create a
ldquowind wallrdquo It is thought that a less dense array could provide birds with more space to
maneuver through the three dimensional landscape without making contact with a turbine
Density is calculated using the turbine table with the fishnet id field and Excel pivot
tables and formulae The first step in calculating turbine density per fishnet square was to
determine which fishnet polygons contained turbines and which did not This was done with
Excel pivot tables using the updated turbine table as a data source Pivot tables were created
and filtered for turbine presence for each year These tables calculated the count of turbines
by turbine model for each fishnet id and provided a grand total of turbines per fishnet
square Fishnet squares with zero turbines were dismissed The count of turbines present per
Method s 37
fishnet id was then divided by 0993 Km2 the area of each fishnet sq This gave each fishnet
id a measure of turbines per square kilometer per year These density values were then
added to the turbines table by way of the fishnet id
Shannon Diversity Index
Because this is a biological study of a complex system the diversity of actors within
that system is an important variable to consider As I calculated a measure of diversity in this
study turbines were treated as organisms (species) within the landscape and each species
being designated by its turbine model There are or have been 16 different turbine models
present at Altamont so species richness for the full historic array is 16 The turbines
however are not evenly distributed throughout the array and turbine models have varying
levels of dominance within designated smaller plots which changes annually
The question is whether or not the response variable (dead golden eagles) has a
relationship with the measure of diversity that is calculated Will the turbines that have killed
eagles be more often members of a monoculture of just one turbine model or the turbine be
a member of a more diverse array of turbine models
To calculate a measure of turbine diversity the fishnet squares shape file and the
turbine table were used Excel pivot tables were used extensively to produce output tables
that described each fishnet square and the count of each turbine model within it An
example of this pivot table is the table for 1999 shown in Appendix H Once tables were
created for each year of the study they were merged together to produce a Shannon diversity
index
The Shannon index is a widely used measure in biology and ecology although it was
originally developed in the telecommunications industry It is considered a suitable measure
Method s 38
of habitat diversity (Brower 1997) as it accounts for both evenness of species presence as
well as overall abundance The formula is
where H is the Shannon diversity index (Shannon 1948) and pi is the proportion of total
number of species in the community made up of the ith species
The final calculation expresses the Shannon index as eH This calculation was
completed for every fishnet square that contained at least one turbine and for every year of
the study The Shannon index values were then joined to the turbines table through the
fishnet id field
Nearest Turbine Distance
The proximity of the nearest turbine may be a factor in bird collisions with wind
turbines The array at Altamont is in some places quite densely arranged with turbines as
close as eleven meters from one another Using the ldquonearrdquo tool in ArcMaprsquos proximity
toolkit the distance was calculated between a turbine and the turbine closest to it It was
necessary to calculate this for every year of the study The near tool adds new fields into the
turbine attribute table including the object id of the nearest turbine and the calculated
distance The attribute tables were exported back into Excel and the vertical lookup formula
was used to populate the turbine table with these new nearest turbine distance field values
Screen ID and Screen Count
In efforts to simplify monitoring efforts at Altamont turbines were organized by
project sites and strings Project sites were operated by individual companies and strings
were rows of contiguous turbines After many turbine removals and new installations some
Method s 39
of these classifications were not appropriate measures for geographic analysis To investigate
how a line of contiguous turbines might affect the response variable new fields were created
as required
Turbine screens refer to landscape-level entities composed of a consecutive
unbroken line of turbines As turbines were added to or removed from the array turbine
screens would lengthen shorten or dissolve entirely so screen ids and screen counts were
calculated for each of the thirteen years of this study
To do this the historic arrayrsquos attribute table was sorted through a structured query
language (SQL) formula selecting only the turbines present in 1998 This new subset of
turbines present in 1998 was exported as a data table into the same ArcMap document The
1998 presence turbine file underwent previously described conversions and was added as a
shape file named Pre98 This sequence of creating turbine presence shape files was
completed for each year of the study
Turbine counts for each screen were determined through visual inspection of the
annual presence layers created in ArcMap When a screen appeared to have a gap in the
middle (due to removals or repowering) then the distance tool was used to determine if the
distance between turbines on either side of the gap was wider than 70 meters If it was then
the screens were considered separate
The following criteria were used to determine screen membership Standalone
turbines that were more than 70 meters from the next closest turbine were considered single
member turbine screens Each was given a screen count of 1 and a screen id that equaled its
turbine id
Method s 40
Turbines in an easily recognizable line grouping were counted as a single screen as
long as there were no gaps more than 70 meters between a given turbine and its nearest
neighbor Each turbine was given a screen id consisting of the turbine id of the most
northerly or westerly turbine id followed by the turbine id on the most southerly or easterly
turbine id These screens had a screen count equal to the number of turbines present in the
screen In cases where screens contained ldquowind wallsrdquo or turbine screens with a visual
double stack of turbines all turbines were counted as members of one screen
Turbine Variable Testing
Variables were tested using Studentrsquos t-test and Chi-squared analysis to determine
significance of summary statistics These tests are consistent with those of previouse studies
investigating wind turbine attributes as they apply to avian fatalities (Orloff 1991 Thelander
2003) and will provide easily comparable results Chi-squared analysis was conducted on the
categorical variables including turbine model tower type settling party ridgetop end row
and saddle variables T-tests were conducted on continuous variables including elevation
slope aspect tower height rotor swept area generating capacity density diversity nearest
turbine distance monitoring count and screen count
Analysis of Demographic and Temporal Data
To produce demographic data I filtered the SRC fatality table by age class This
determined the proportion of golden eagle fatalities that were juvenile sub-adultimmature
adult and those that were undetermined After testing each turbine variable (as indicated
above) to discern which were significant and which were not I applied fatality records by age
class into each significant turbine variable This allowed me to see if any of the significant
Method s 41
turbine variables affected one age class more than another The same procedure was done
for the sex of the bird The SRC fatalities table was sorted by the sex field to determine the
proportion of golden eagle fatalities that were female male and undetermined Due to the
low fidelity of the sex data it was not compared to significant turbine variables
Temporal data was largely available in the SRC fatalities table A death date field was
already calculated for a majority of the records (109 of 134) This field was poplulated by
taking the fatality detection date and subtracting the estimated number of days dead which
was also a given field in the SRC fatalities table For those that did not have a death date no
additional calculation was made because each of these 25 records was missing a carcass age
estimation so no death date could accurately be determined Temporal trends were
graphically plotted to illustrate seasonal and monthly fatality tendencies
Method s 42
Figure M-1 Wind Turbine Tower Types
Tubular (left) lattice (middle) and vertical axis (right) tower types
Method s 43
Figure M-2 Historic Turbine Array and Fishnet Grid Altamont Pass Wind Resource Area
Interstat
e
580
Method s 44
Table M-1 Given and Calculated Turbine Table Variables
Variable Variable type Source Code
Turbine has killed a golden eagle or not
Categorical Binomial
Calculated value KILL
Number of dead golden eagles Continuous Annually calculated value D
Turbine is present in the array Categorical Binomial
Annually calculated value PRE
Turbine is monitored per year Categorical Binomial
Calculated value MON
Turbinersquos unique turbine identifier Continuous Given SRC turbine table TID
The model of the turbine Categorical Given SRC turbine table TMO
Elevation at the base of turbine Continuous Some given SRC turbine table and some calculated values
ELV
Slope of the hill where the turbine is installed
Continuous Some given SRC turbine table and some calculated values
SLP
Aspect of the hill face where the turbine is installed
Continuous Some given SRC turbine table and some calculated values
ASP
The type of tower that holds the wind turbine
Categorical Some given SRC turbine table and some calculated values
TTP
Height of the wind turbine Continuous Given SRC turbine table THT
Rotor swept area of the turbine blades
Continuous Some given SRC turbine table and some calculated values
RSA
Rated generating capacity of the turbine
Continuous Given SRC turbine table GCAP
Turbine is owned by one of the settling party
Categorical Binomial
Calculated value SP
Placement on a ridge top Categorical Binomial
Calculated value RDGTP
Placement at the end of a row of turbines
Categorical Binomial
Annually calculated value ER
Placement in the saddle of a hill ridge
Categorical Binomial
Calculated value SDDL
Unique identifier of fishnet square overlay map layer
Continuous Calculated value FISHID
Density of turbines in a fishnet square
Continuous Annually calculated value DNS
Shannon diversity index in a fishnet square
Continuous Annually calculated value DIV
Distance from turbine to nearest turbine
Continuous Annually calculated value NTD
Number of times a turbine is Continuous Annually calculated value MC
Method s 45
monitored
Unique identifier of a turbine screen
Continuous Annually calculated value SCID
Number of turbines in a screen Continuous Annually calculated value SC
Resu l t s 46
Results
Fatalities
Initial filtering of the fatalities table provided interesting results Table R-1 shows the
status id designations for all 7559 fatality records within the temporal bounds of this study
A number of redundant status ids have been removed from the data fields compared to what
is listed in Appendix A Currently only ten status ids were used Of the 7559 records 5086
are valid turbine related fatalities The other 2473 records are coded with status ids that will
disqualify them from fatality analysis conducted by the Scientific Review Committee and
were likewise eliminated from the present study
Table R-2 includes species with the most status id = 1 fatality records Rock pigeons
and European starlings top the list but the four target species for fatality reduction represent
over a quarter of all status id = 1 fatality records Small and medium unidentified birds are
those that were never identified to a taxonomic grouping Often these remains included only
bones or other body parts that were not confidently identifiable Golden eagle fatalities
account for 263 of the total
Table R-3 shows all golden eagle records listed by status id Of the 216 records 82
were not used in the current study The majority of the rejected records (66 of 82 80) were
removed because the carcass was in such a condition that the death date could not be
calculated or because the date of the death was calculated to be greater than 90 days These
elimination protocols were developed by the APWRA Scientific Review Committee to
ensure quality data and to remove as much speculation from their process of estimating bird
fatality rates I have adopted their standards of status designations in this study for the same
reasons
Resu l t s 47
Turbines
Altamontrsquos annual turbine presence arrays are detailed in Tables R-4 and R-5 Table
R-4 displays the total number of turbines present in the array for each year of the study by
turbine model 2004 is absent as there were no data available for that year Turbine presence
trends include the phasing out of the Danwin Flowind and Windmaster models and the
inclusion of the V-47 and Mitsubishi 1000A models over the duration of the study There
has been a 2682 reduction in the total number of turbines in the array during the present
studyrsquos temporal range
Monitored turbines
This study concerns turbines monitored for bird fatalities There are significant
differences among number of turbines present annually as seen in Table R-4 and the
turbines monitored as seen in Tables R-5 and R-6 The early monitoring efforts at Altamont
consisted of just 683 turbines in 1998 with searches conducted on just four turbine models
Table R-6 is similar to Table R-5 except that table values represent the proportion of
monitoring for each turbine model This proportion is important to keep in mind once the
golden eagle fatalities are joined to the turbine table and turbine models of kill turbines are
detailed
The monitoring count data in Table R-7 show a phenomenal increase in monitoring
effort in the years while the Altamont settlement agreement was finalized (2005-2007) and in
the years following This is a reflection on the amount of resources pooled to reduce bird
strikes at Altamont and it should serve to provide more confidence in the data used in the
current study
Tab
le R
-5
Tu
rbin
e P
rese
nce a
nd
Red
ucti
on
F
igu
res
Year
Mo
del
98
99
00
01
02
03
05
06
07
08
09
10
11
To
tal
53
87
53
67
53
58
53
45
53
38
53
25
50
21
48
78
47
24
44
52
42
48
39
99
39
42
Turb
ines
few
er
than
pre
vio
us
year
-2
0
-9
-13
-7
-13
-304
-143
-154
-272
-204
-249
-57
Per
cen
t le
ss
fro
m p
revio
us
year
-0
37
-01
7
-02
4
-01
3
-02
4
-57
1
-28
5
-31
6
-57
6
-45
8
-58
6
-14
3
To
tal re
duct
ion
num
ber
14
45
Per
cen
t re
duct
ion
sin
ce 1
998
268
2
Resu l t s 48
Fatalities and Turbines
Results of combining the turbine table and the fatalities table are reported herein
Table R-8 provides a list of the individual turbines (turbine id) credited with killing golden
eagles The year of the fatality as well as the turbine model are indexed Turbine ids marked
with are those that have killed more than one golden eagle Each appears in the table in
each year it caused a fatality If it killed two in one year it appears in that year one time and
the fatality count is 2
A different way to view golden eagles deaths in relation to turbine model is to
consider all turbine models Table R-9 includes all 16 turbine types and the count of dead
golden eagles per year for each turbine model In this table the grey shaded cells are all zero
values
The number of golden eagle fatality detections peaked in 2007 with 36 discoveries It
is unclear what drove so many detections in that year but the higher number was not limited
to just the golden eagle In fact each of the four target species had their highest recorded
fatality rate that year as well Table R-10 shows the 13-year fatality records for red-tailed
hawks (RTHA) burrowing owls (BUOW) American kestrels (AMKE) and golden eagles
(GOEA) This peak in fatality discoveries does not coincide directly with the peak in
monitoring seen in Table R-7 These two trends are illustrated in Fig R-18
The following pages are annual Altamont turbine array maps of monitored turbines
and locations of golden eagle fatalities found in each year Some elevation and terrain
features have been included in the map to provide context What were left out were the
turbines that were present each year but were not monitored This was an aesthetic choice
as the format of this thesis does not allow much deviation in the amount of paper real estate
Resu l t s 49
that can be used Condensing 160 Km2 into a 5 by 9 inch space would necessarily crowd the
features to the point of ambiguity
Table R-11 considers the total number of searches per turbine model and how many
golden eagle fatalities have been discovered at each The number of searches was divided by
the number of golden eagle fatalities to calculate the searcheseagle fatality figure
Turbine models have not been evenly monitored so the raw fatality count figures
must be considered in light of the monitoring count Fig R-17 illustrates this point by
measuring golden eagle fatalities on the primary y-axis (on the left) and the total number of
searches for each turbine model is measured on the secondary y-axis (on the right) Turbine
models are on the x-axis as coded numbers This figure begins to elucidate a relationship
between monitoring effort and success in detecting golden eagle fatalities By including two
y-axes a visual comparison can be made between the number of golden eagle fatalities
detected and the amount of searching that was done
Fig R-18 illustrates the total monitoring effort regardless of turbine model on the
secondary y-axis and it is coupled with golden eagle fatalities on the primary y-axis The
figure illustrates positive trend lines for both variables
Turbine Characteristics
The results of testing turbine characteristics are shown in Table R-12 below Those
values with significant differences between nonkill and kill turbines have been shaded grey
and bolded Following that is Table R-13 which contains additional summary statistics for
turbine characteristics
Summary statistics for aspect measurements of kill and nonkill turbines appear in the
table above but histograms of the data are more informative The following circular
Resu l t s 50
histograms were calculated using R Studio and the circular data package (Lund 2011) The
turbines are represented as small circles around a larger circle and placed at the degree of the
aspect of the hillside where that turbine stands The arrow in the center points toward the
mean aspect as calculated by the circular package in R The length of the arrow indicates the
relative strength of the mean calculation The dashed line outside the circle is a measure of
density for each vector
Fig R-16 represents the 5340 monitored turbines that have not killed golden eagles
The blue arrow points to the calculated mean of 412deg Fig R-17 illustrates the 134 turbines
that have killed golden eagles The red arrow at the center of the figure points toward the
mean direction of 3179deg In both figures the short length of the arrow indicates that aspect
data were not strongly skewed in any one direction or vector
Temporal Distribution Age and Sex Frequencies of Golden Eagle Fatalities
Figure R-18 is a histogram of fatalities grouped into quarters while Fig R-19 displays
fatalities by death month The summer time (3rd quarter) seems to be the most deadly at
Altamont The months of July August and September account for 450 of the fatalities
that are dated Both August and September have the largest number of deaths at 18 each
Next are July and October each with 13 fatalities
There is a problem however with these data Previously it was discussed that if death
dates could not be determined for golden eagle fatalities then the records were removed
from consideration There are 25 records without calculated death dates that have been
included in the present study as well as in fatality estimates for SRC reporting These records
are from the baseline fatality study that did not record carcass condition or estimation of
Resu l t s 51
days dead These records remain valid turbine related fatalities but ones that are missing
critical data for biological analysis
Fig R-21 combines temporal and demographic data into a single chart It shows
fatalities by age class and death month Undetermined ages and unknown death dates
dominate the graphic
Fig R-22 illustrates age class data of the 134 fatalities including 43 juveniles (321)
10 immature (75) 24 adult (179) and 57 (425) that were of undetermined age What
stands out is the large number of juvenile birds in the record This result contradicts Huntrsquos
findings that juvenile golden eagles were not killed as regularly as other age groups In that
study 1 of 117 (09) juveniles 31 of 155 (200) sub-adults and floaters and 2 of 47
(43) breeding adults were killed by turbines (Hunt 2002) It is not immediately clear why
these two findings are so divergent Perhaps research into natal origins of golden eagle
fatalities at Altamont would better describe the assemblage and yield clues as to whether the
high number of juvenile fatalities may be correlated to dispersal events
Tables R-14 through R-18 show the turbine variables that were shown to be
significant and age classes of golden eagle fatalities were used to parse the results in more
detail Finally Table R-19 shows the results of sex determination analysis
Resu l t s 52
Table R-1 All Fatality Records by Status Id
Status Id
Number of Records
Percentage of total fatalities
Status
1 5086 6728 Valid turbine related fatality
2 45 060 Fatality cannot be assigned to an animal group or size
4 33 044 Is not within 125 meters of the turbine
5 177 234 Cause of death is not turbine-related
6 827 1094 Is gt90 days dead or aged
7 370 489 Incidental or WRRS find except GOEAS
8 29 038 Injured bird except GOEA
9 38 050 Fatality without a valid search or valid detection
10 31 041 Off-site carcass used for placement only
16 923 1221 Death date could not be determined
Total 7559
Resu l t s 53
Table R-2 Top 10 Species of Status Id 1 Fatalities at Altamont 1998-2011
Species Common Name n Percentage of
Status Id 1 Records
Rock Pigeon 1180 2320
European Starling 629 1237
Red-tailed Hawk 573 1127
Western Meadowlark 544 1070
Burrowing Owl 347 682
American Kestrel 259 509
Small Unidentified Bird 229 450
Barn Owl 166 326
Golden Eagle 134 263
Medium Unidentified Bird 128 252
80 Other Species unidentified groups 897 1764
Total 5086
Target Species Sum 1313 2582
Resu l t s 54
Table R-3 Golden Eagle Fatality Records by Status Id
Status Id Record Count
Percentage of Records
Status Definition
1 134 620 Valid turbine related fatality
4 2 093 Is not within 125 meters of the turbine
5 6 278 Cause of death is not turbine-related
6 30 1389 Is gt90 days dead or aged
7 5 231 Incidental or WRRS find except GOEAs
9 2 093 Fatality without a valid search or valid detection
10 1 046 Off-site carcass used for placement only
16 36 1667 Death date could not be determined
Total 216
GOEA is the alpha code for Golden Eagles Status ID 7 is a designation for any bird fatality found first by turbine operators (WRRS) or are found dead while in the APWRA but not by biologists walking a transect A road killed bird is an example of one that would be an incidental find Golden eagles should not receive this designation and it is unclear by 5 records have been designated as status id 7
Resu l t s 55
T
ab
le R
-4
Pre
sen
ce C
ou
nt
by Y
ear
an
d T
urb
ine M
od
el
Year
Mo
del
98
99
00
01
02
03
05
06
07
08
09
10
11
250K
W
20
20
20
20
20
20
20
20
20
20
20
20
20
Bo
nus
536
536
536
536
536
536
536
536
531
522
500
498
489
Dan
win
39
39
39
39
39
39
39
39
25
0
0
0
0
En
erte
ch
170
170
170
170
170
170
169
143
143
141
136
136
133
Flo
win
d
169
169
169
169
169
169
0
0
0
0
0
0
0
Ho
wd
en
86
86
86
86
86
86
86
86
86
81
79
79
79
Ken
etec
h 5
6-1
00
33
93
33
73
33
64
33
51
33
44
33
33
31
68
30
52
30
40
28
18
26
45
24
01
23
58
KV
S 3
3
41
41
41
41
41
41
41
41
41
41
41
41
41
Mic
on
221
221
221
221
221
221
221
221
221
218
218
218
218
Mit
sub
ish
i 1000A
0
0
0
0
0
0
0
0
38
38
38
38
38
No
rdta
nk
371
371
371
371
371
371
371
371
311
306
305
304
303
Po
len
ko
12
12
12
12
12
12
12
12
12
12
12
12
12
V-4
7
0
0
0
0
0
0
31
31
31
31
31
31
31
Ves
tas
202
202
202
202
202
200
200
199
199
199
199
199
199
Win
dm
aste
r 101
101
101
101
101
101
101
101
0
0
0
0
0
Win
dm
atic
26
26
26
26
26
26
26
26
26
25
24
22
21
To
tal
53
87
53
67
53
58
53
45
53
38
53
25
50
21
48
78
47
24
44
52
42
48
39
99
39
42
Resu l t s 56
Tab
le R
-5
Mo
nit
ore
d C
ou
nt
by Y
ear
an
d T
urb
ine M
od
el
Year
Mo
del
98
99
00
01
02
03
05
06
07
08
09
10
11
250K
W
0
0
0
0
5
20
20
20
20
20
20
20
20
Bo
nus
320
320
317
314
384
206
395
399
412
411
384
471
240
Dan
win
25
25
9
10
23
14
0
0
0
0
0
0
0
En
erte
ch
0
0
0
170
170
0
143
143
143
141
136
136
132
Flo
win
d
136
136
88
5
5
0
0
0
0
0
0
0
0
Ho
wd
en
0
0
0
0
68
80
80
80
47
48
46
46
2
Ken
etec
h 5
6-1
00
0
393
422
418
21
09
19
18
10
14
10
86
15
72
14
80
13
87
15
35
12
22
KV
S 3
3
0
16
16
16
38
22
37
37
37
37
37
39
41
Mic
on
0
0
29
221
221
0
221
221
221
218
218
218
205
Mit
sub
ish
i 1000A
0
0
0
0
0
0
0
0
0
0
0
38
38
No
rdta
nk
0
0
0
0
224
312
125
125
125
120
119
118
87
Po
len
ko
0
0
0
12
12
0
12
12
12
12
12
12
0
V-4
7
0
0
0
0
0
0
31
31
31
31
31
31
5
Ves
tas
202
202
202
202
202
14
128
138
127
143
127
199
189
Win
dm
aste
r 0
0
0
0
8
8
0
0
0
0
0
0
0
Win
dm
atic
0
0
0
26
26
0
26
26
26
25
24
22
0
To
tal
683
1092
1083
1394
34
95
25
94
22
32
23
18
27
73
26
86
25
41
28
85
21
81
Resu l t s 57
T
ab
le R
-6 M
on
ito
red
Tu
rbin
es
as
a P
rop
ort
ion
of
To
tal
An
nu
al
Mo
nit
ori
ng
Eff
ort
Year
Mo
del
98
99
00
01
02
03
05
06
07
08
09
10
11
250K
W
0
0
0
0
001
008
009
009
007
007
008
007
009
Bo
nus
469
293
293
225
110
079
177
172
149
153
151
163
110
Dan
win
0
37
023
008
007
007
005
0
0
0
0
0
0
0
En
erte
ch
0
0
0
122
049
0
064
062
052
052
054
047
061
Flo
win
d
199
125
081
004
001
0
0
0
0
0
0
0
0
Ho
wd
en
0
0
0
0
019
031
036
035
017
018
018
016
001
Ken
etec
h 5
6-
100
0
360
390
300
603
739
454
469
567
551
546
532
560
KV
S 3
3
0
015
015
011
011
008
017
016
013
014
015
014
019
Mic
on
0
0
0
27
159
063
0
099
095
080
081
086
076
094
Mit
sub
ish
i 1000A
0
0
0
0
0
0
0
0
0
0
0
0
13
017
No
rdta
nk
0
0
0
0
064
120
056
054
045
045
047
041
040
Po
len
ko
0
0
0
0
09
003
0
005
005
004
004
005
004
000
V-4
7
0
0
0
0
0
0
014
013
011
012
012
011
002
Ves
tas
296
185
187
145
058
005
057
060
046
053
050
069
087
Win
dm
aste
r 0
0
0
0
0
02
003
0
0
0
0
0
0
0
Win
dm
atic
0
0
0
0
19
007
0
000
012
011
009
009
009
008
Resu l t s 58
T
ab
le R
-7
Su
mm
ary
Tab
le -
Tu
rbin
e P
rese
nce a
nd
Mo
nit
ore
d C
ou
nt
To
tals
Year
98
99
00
01
02
03
05
06
07
08
09
10
11
Turb
ines
Pre
sen
t 53
87
53
67
53
58
53
45
53
38
53
25
50
21
48
78
47
24
44
52
42
48
39
99
39
42
Turb
ines
Mo
nit
ore
d
683
10
92
10
83
13
94
34
95
25
94
22
32
23
18
27
73
26
86
25
41
28
85
21
81
Per
cen
t o
f A
rray
M
on
ito
red
127
203
202
261
655
487
445
475
587
603
598
721
553
Ind
ivid
ual
Turb
ine
Sea
rch
es
25
66
70
52
51
92
65
43
94
40
32
66
45
22
35
628
162
88
381
97
323
00
295
73
232
57
Resu l t s 59
Table R-8 Kill Turbines with Golden Eagle Fatality Census
Year Turbine Id n Turbine Model
1998 172 1 Bonus
192 1 Bonus
246 1 Bonus
263 1 Bonus
157 1 Bonus
1999 211 1 Bonus
279 1 Bonus
837 1 Kenetech 56-100
2000 174 1 Bonus
183 1 Bonus
121 1 Bonus
2001 1046 1 Enertech
157 1 Bonus
305 1 Bonus
2002 640 1 Kenetech 56-100
923 1 Kenetech 56-100
1970 1 Kenetech 56-100
2080 1 Kenetech 56-100
2223 1 Kenetech 56-100
2262 1 Kenetech 56-100
2744 1 Kenetech 56-100
2003 2221 1 Kenetech 56-100
2311 1 Kenetech 56-100
3201 1 Kenetech 56-100
4301 1 Nordtank
2005 218 1 Bonus
1679 1 Kenetech 56-100
2700 1 Kenetech 56-100
3733 1 Kenetech 56-100
2006 69 1 Bonus
166 1 Bonus
Resu l t s 60
2198 1 Kenetech 56-100
2469 1 Kenetech 56-100
2498 1 Kenetech 56-100
2734 1 Kenetech 56-100
3086 1 Kenetech 56-100
3103 1 Kenetech 56-100
3161 1 Kenetech 56-100
3165 1 Kenetech 56-100
3167 1 Kenetech 56-100
3304 1 Bonus
3736 1 Kenetech 56-100
3866 1 Bonus
4133 1 Kenetech 56-100
4217 1 Kenetech 56-100
2608 1 Kenetech 56-100
305 1 Bonus
2007
155 1 Bonus
210 1 Bonus
579 1 Kenetech 56-100
903 1 Kenetech 56-100
1149 1 Micon
1613 1 Kenetech 56-100
1665 1 KVS 33
1931 1 Kenetech 56-100
2019 1 Kenetech 56-100
2113 1 Kenetech 56-100
2219 1 Kenetech 56-100
2591 1 Kenetech 56-100
2600 1 Kenetech 56-100
2703 1 Kenetech 56-100
2752 1 Kenetech 56-100
2844 1 Kenetech 56-100
3085 1 Kenetech 56-100
Resu l t s 61
3433 1 Nordtank
3653 1 Kenetech 56-100
3738 1 Kenetech 56-100
3766 1 Kenetech 56-100
3793 1 Kenetech 56-100
3827 1 Kenetech 56-100
3848 1 Kenetech 56-100
3859 1 Kenetech 56-100
3941 1 Kenetech 56-100
4039 1 Kenetech 56-100
4048 1 Kenetech 56-100
4113 1 Kenetech 56-100
2701 2 Kenetech 56-100
3860 2 Kenetech 56-100
801 2 Kenetech 56-100
895 1 Kenetech 56-100
2008 111 1 Bonus
188 1 Bonus
213 1 Bonus
975 1 Micon
1300 1 Micon
1362 1 Howden
1588 1 Kenetech 56-100
1708 1 KVS 33
2750 1 Kenetech 56-100
2998 1 Kenetech 56-100
3073 1 Kenetech 56-100
3309 1 Bonus
3322 1 Bonus
3718 1 Kenetech 56-100
3848 1 Kenetech 56-100
5070 1 Kenetech 56-100
121 1 Bonus
Resu l t s 62
2009 201 1 Bonus
1616 1 Kenetech 56-100
1710 1 KVS 33
2307 1 Kenetech 56-100
2333 1 Kenetech 56-100
2473 1 Kenetech 56-100
3834 1 Kenetech 56-100
4036 1 Kenetech 56-100
4081 1 Kenetech 56-100
4264 1 V-47
5064 1 Kenetech 56-100
2608 1 Kenetech 56-100
895 1 Kenetech 56-100
2010 115 1 Bonus
194 1 Bonus
2207 1 Kenetech 56-100
2489 1 Kenetech 56-100
2534 1 Kenetech 56-100
2562 1 Kenetech 56-100
2585 1 Kenetech 56-100
3655 1 Kenetech 56-100
2697 1 Kenetech 56-100
2011 300 1 Bonus
322 1 Vestas
479 1 Vestas
790 1 Kenetech 56-100
2673 1 Kenetech 56-100
3759 1 Kenetech 56-100
3869 1 Kenetech 56-100
5000 1 Kenetech 56-100
2674 1 Kenetech 56-100
2697 2 Kenetech 56-100
Resu l t s 63
Table R-9 Count of Golden Eagle Fatalities by Year and Turbine Model
Year
Model 98 99 00 01 02 03 05 06 07 08 09 10 11 Totals
250KW 0 0 0 0 0 0 0 0 0 0 0 0 0 0
Bonus 5 2 3 2 0 0 1 5 2 6 1 2 1 30
Danwin 0 0 0 0 0 0 0 0 0 0 0 0 0 0
Enertech 0 0 0 1 0 0 0 0 0 0 0 0 0 1
Flowind 0 0 0 0 0 0 0 0 0 0 0 0 0 0
Howden 0 0 0 0 0 0 0 0 0 1 0 0 0 1
Kenetech 56-100
0 1 0 0 7 3 3 13 31 7 10 8 8 91
KVS 33 0 0 0 0 0 0 0 1 1 0 1 0 0 3
Micon 0 0 0 0 0 0 0 0 1 2 0 0 0 3
Mitsubishi 1000A
0 0 0 0 0 0 0 0 0 0 0 0 0 0
Nordtank 0 0 0 0 0 1 0 0 1 0 0 0 0 2
Polenko 0 0 0 0 0 0 0 0 0 0 0 0 0 0
V-47 0 0 0 0 0 0 0 0 0 0 1 0 0 1
Vestas 0 0 0 0 0 0 0 0 0 0 0 0 2 2
Windmaster 0 0 0 0 0 0 0 0 0 0 0 0 0 0
Windmatic 0 0 0 0 0 0 0 0 0 0 0 0 0 0
Annual
Fatalities 5 3 3 3 7 4 4 19 36 16 13 10 11 134
Resu l t s 64
Table R-10 Target Species Annual Fatality Count Totals
Year
Species 98 99 00 01 02 03 05 06 07 08 09 10 11 Totals
RTHA 11 50 25 13 26 17 34 102 109 63 41 26 56 573
BUOW 3 27 14 15 6 1 2 33 127 47 31 26 15 347
AMKE 3 10 11 9 14 8 6 18 54 45 39 22 20 259
GOEA 5 3 3 3 7 4 4 19 36 16 13 10 11 134
Grand Total 22 90 53 40 53 30 46 172 326 171 124 84 102 1313
Resu l t s 65
Figure R-1 Golden Eagle Fatalities and Monitored Turbines at the Altamont Pass Wind Resource Area 1998
Interstate
580
Resu l t s 66
Interstate
580
Figure R-2 Golden Eagle Fatalities and Monitored Turbines at the Altamont Pass Wind Resource Area 1999
Resu l t s 67
Figure R-3 Golden Eagle Fatalities and Monitored Turbines at the Altamont Pass Wind Resource Area 2000
Interstate
580
Resu l t s 68
Interstate
580
Figure R-4 Golden Eagle Fatalities and Monitored Turbines at the Altamont Pass Wind Resource Area 2001
Resu l t s 69
Figure R-5 Golden Eagle Fatalities and Monitored Turbines at the Altamont Pass Wind Resource Area 2002
Interstat
e
580
Resu l t s 70
Figure R-6 Golden Eagle Fatalities and Monitored Turbines at the Altamont Pass Wind Resource Area 2003
Interstat
e
580
Resu l t s 71
Figure R-7 Golden Eagle Fatalities and Monitored Turbines at the Altamont Pass Wind Resource Area 2005
Interstate
580
Resu l t s 72
Figure R-8 Golden Eagle Fatalities and Monitored Turbines at the Altamont Pass Wind Resource Area 2006
Interstate
580
Resu l t s 73
Figure R-9 Golden Eagle Fatalities and Monitored Turbines at the Altamont Pass Wind Resource Area 2007
Interstate
580
Resu l t s 74
Figure R-10 Golden Eagle Fatalities and Monitored Turbines at the Altamont Pass Wind Resource Area
Interstate
580
Resu l t s 75
Figure R-11 Golden Eagle Fatalities and Monitored Turbines at the Altamont Pass Wind Resource Area 2009
Interstate
580
Resu l t s 76
Figure R-12 Golden Eagle Fatalities and Monitored Turbines at the Altamont Pass Wind Resource Area 2010
Interstate
580
Resu l t s 77
Figure R-13 Golden Eagle Fatalities and Monitored Turbines at the Altamont Pass Wind Resource Area 2011
Interstate
580
Resu l t s 78
Table R-11 Search Effort Required per Golden Eagle Fatality
Turbine Model Count of
Eagle Fatalities Total
Searches Searches per
Eagle Fatality
250KW 0 1113 0
Bonus 30 37567 1252
Danwin 0 497 0
Enertech 1 13681 13681
Flowind 0 1965 0
Howden 1 2593 2593
Kenetech 56-100 91 107815 1184
KVS 33 3 2376 792
Micon 3 16667 5556
Mitsubishi 1000A 0 266 0
Nordtank 2 9588 4794
Polenko 0 732 0
V-47 1 1832 1832
Vestas 2 15534 7767
Windmaster 0 34 0
Windmatic 0 1564 0
Mean 13364 2465
Resu l t s 79
Figure R-14 Golden Eagle Fatalities by Turbine Model and Total Search Count
Resu l t s 80
Resu l t s 81
Table R-12 Summary Table of Test Findings
Variable Test Test Value Degrees freedom
p-value
Turbine Model
1998 x2 567 3 gt 010
1999 248 5 gt 075
2000 725 6 gt 025
2001 565 9 gt 075
2002 465 13 gt 095
2003 113 8 gt 099
2005 237 11 gt 099
2006 1093 11 gt 025
2007 1488 11 gt 010
2008 1356 11 gt 010
2009 1319 11 gt 025
2010 448 12 gt 095
2011 43 10 gt 090
Elevation t-test 234 142 002
Slope t-test -171 138 009
Aspect t-test -220 134 003
Tower Type x2 459 2 lt 005
Tower Height t-test 067 134 050
Rotor Swept Area t-test -2014 134 0046
Generating Capacity t-test -113 135 026
Settling Party x2 802 1 lt 001
Ridgetop x2 4842 1 lt 005
Resu l t s 82
End Row x2 1906 1 lt 001
Saddle x2 056 1 gt 050
Density t-test 710 145 lt 000
Shannon Diversity Index
t-test 092 140 036
Nearest Turbine Distance
t-test -199 133 0049
Monitored Count t-test -355 134 0001
Screen Count t-test 193 134 006
Resu l t s 83
Table R-13 Summary Statistics for Turbine Characteristics
Variable Turbine Min 1st Q Med Mean 3rd Q
Max σ
Elevation (m)
Kill 8424 16400 25170 25080 32270 52460 9599
Nonkill 3754 17790 28860 27050 35770 56700 10911
Slope
Kill 0000 0100 0165 0172 0220 0500 010
Nonkill 0000 0090 0140 0157 0210 0830 009
Aspect
Kill 114 12317 21202 31700 30806 35944 10631
Nonkill 003 9105 15884 4123 30010 35990 11163
Tower Height (m)
Kill 6000 6000 6000 7085 8000 16400 1893
Nonkill 2286 600 6000 6993 8000 18000 2014
Rotor Swept Area ( m2)
Kill 14131 25400 25400 29219 25855 173080 16027
Nonkill 14131 25390 25400 26424 25400 173080 13006
Generating Capacity (kWh)
Kill 400 1000 1000 1167 1000 6600 6957
Nonkill 400 1000 1000 1153 1000 10000 9841
Density
(TurbinesKm2)
Kill 298 2805 3971 4183 5560 11520 1981
Nonkill 099 3177 4567 4952 6751 11810 2609
Shannon Diversity
Index
Kill 1000 1000 1000 1345 1620 4420 063
Nonkill 1000 1000 1000 1361 1692 4419 065
Nearest Turbine
Distance (m)
Kill 1951 2438 2438 3923 3763 34390 4921
Nonkill 881 2438 2440 3068 3241 34390 1114
Monitored Count
Kill 000 700 900 903 1200 4300 635
Nonkill 100 200 700 705 1100 4400 616
Screen Count
Kill 100 500 1100 1395 2000 4900 1118
Nonkill 100 600 1200 1566 2200 5300 1166
Mean values for aspect were calculated as circular data using the R ldquocircularrdquo package All other data was calculated linearly The zero monitored count is explained by incidental finds of golden eagles not found on a search
Resu l t s 84
Figure R-16 Circular Aspect Histogram of Nonkill Turbines
Resu l t s 85
Figure R-17 Circular Aspect Histogram of Kill Turbines
Resu l t s 86
Figure R-18 Golden Eagle Fatalities by Quarter of Death Date
Resu l t s 87
Figure R-19 Golden Eagle Fatalities by Month of Death Date
Resu l t s 88
Figure R-20 Radar Chart of Golden Eagle Fatalities with Known Death Dates
Resu l t s 89
Figure R-21 Age Class and Death Dates of Golden Eagle Fatalities
Adult Immature Juvenile
Undetermined Age
Total
January 1 1
February 1 1 2 4
March 5 4 1 10
April 2 2 4
May 1 1 10 12
June 1 1 2 4 8
July 2 6 5 13
August 3 2 5 8 18
September 4 5 9 18
October 3 2 4 4 13
November 3 2 5
December 1 2 3
Unknown date 4 4 9 8 25
Total 24 10 43 57 134
Resu l t s 90
Figure R-22 Golden Eagle Fatalities by Age
Resu l t s 91
TableR-14 End Row Status by Golden Eagle Age Class
Age Class n False True
True
Difference from Total Mean
(381)
Adult 25 15 10 400 19
Immature 9 7 2 222 -158
Juvenile 42 31 11 262 -119
Undetermined 58 30 28 483 102
Total 134 83 51 381
Table R-15 Tower Type by Golden Eagle Age Class
Age Class n Lattice Tubular
Lattice
Difference from Total Mean
(709)
Adult 25 14 11 560 -149
Immature 9 6 3 667 -42
Juvenile 42 27 15 643 -66
Undetermined 58 48 10 828 119
Total 134 95 39 709
Table R-16 Rotor Swept Area by Golden Eagle Age Class
Age Class n Average
(m2)
Difference from Total Mean (29219) m2
Adult 25 30303 1084
Immature 9 34990 5771
Juvenile 42 26735 -2484
Undetermined 58 29656 437
Total 134 29219
Resu l t s 92
Table R-17 Ridgetop Status by Golden Eagle Age Class
Age Class n False True
True
Difference from Total Mean
(52)
Adult 25 25 0 00 -52
Immature 9 8 1 111 59
Juvenile 42 39 3 71 19
Undetermined 58 55 3 52 -01
Total 134 127 7 52
Table R-18 Nearest Turbine Distance by Golden Eagle Age Class
Age Class n Mean (m)
Difference from Total Mean (3923) m
Adult 25 3457 -466
Immature 9 3267 -655
Juvenile 42 3152 -770
Undetermined 58 4783 860
Total 134 3923
Table R-19 Sex Ratio of Golden Eagle Fatalities
Sex n Percentage of Total
Female 2 15
Male 0 00
Undetermined 132 985
Total 134
Discuss ion 93
Discussion
In this study I characterized the wind turbines of the Altamont Pass Wind Resource
Area according to geographic placement properties and by innate characteristics of the
turbine model This was done to test the hypothesis that certain of these characteristics may
make individual turbines more deadly to golden eagles Of the 5086 valid turbine related
fatalities during the study period 134 were golden eagles These 134 golden eagles were
killed by 123 individual wind turbines out of the 5400 that stand at Altamont The data
indicate that there are significant differences between turbines that have killed golden eagles
and those that have not killed golden eagles do exist
Innate Turbine Characteristics
Among innate characteristics the differences in frequencies of tower types was
significant (plt005) In kill turbines the lattice tower occurred more frequently - 709 of
kill turbines were on lattice towers tubular towers accounted for the remaining 291 No
vertical axis tower turbines resulted in golden eagles fatalities Among nonkill turbines lattice
towers constitute 588 while tubular towers make up 399 of the array Vertical axis
towers account for the remaining 13 Thus turbines built on lattice-structured towers
occur at higher rates among kill turbines A potential rationale for this lies in that birds are
often seen perched in or on the open lattice of the tower structure so there may be an
additional attraction to these turbine tower types for resting or roosting that results in a
disproportionate number of fatalities
The difference between the mean values of rotor swept areas of kill turbines and
nonkill turbines is also significant (p = 0046) For kill turbines mean rotor swept area was
2922 m2 while nonkill turbines mean value was smaller at 2642 m2 This finding is
Discuss ion 94
somewhat counterintuitive in that it has been posited that in order to make a turbine array
safer operators should concentrate on installing fewer larger turbines This idea leads to a
lower density turbine array with towers that have longer blades spinning over a greater area
Longer slower blades it is thought should be easier for a bird to notice and to avoid
Smaller blades (with a corresponding smaller rotor swept area) spin at a faster rate and are
theoretically more difficult for birds to detect and avoid This idea is at the heart of the
Altamont repowering scheme in which many smaller turbines are currently being removed
and replaced by fewer larger turbines Perhaps the speed of the turbine propellers has
nothing to do with killing golden eagles Instead turbines with larger rotor swept areas may
have the ability to swing out further and make contact with passing eagles Like a boxer with
a reach advantage a longer turbine blade can strike from a further distance
Of the innate characteristics that were not significant the results of the turbine
model chi-squared tests were most surprising The Kenetech 56-100 turbine model has been
responsible for 679 of the known turbine related golden eagle fatalities at Altamont yet
statistically this figure is not significant This is of course because this model makes up a
large portion of the monitored array each year between 360 (1999) and 739 (2003) of
all turbines searched This result is consistent with Huntrsquos study where he found 73 (27 of
42) of the golden eagles killed at Altamont were killed by Kenetech turbines (Hunt 2002)
Huntrsquos study did not publish statistical analysis such as was conducted in this study
Nevertheless the authors conclude that areas that containing the Kenetech turbine type are
more hazardous to golden eagles Thelander did calculate through chi-square analysis that
turbine model was significant in golden eagle fatalities but those results showed that the
Bonus model being more represented in kill turbines (Thelander 2003)
Discuss ion 95
Generating capacity was another innate characteristic that did not show a significant
difference between kill and nonkill turbines Among all of the variables tested this one was a
bit more abstract and had the least potential to interact with any golden eagle at Altamont It
would have been a surprise had generating capacity been significantly different in kill
turbines Thelanderrsquos study concurs that generating capacity is not significant (Thelander
2003) The differences in tower height between kill and nonkill turbines also are not
significant and once again Thelanderrsquo results agree
Geographic Placement Characteristics
Among the geographic placement characteristics with significant differences is
elevation aspect settling party ridgetop end row turbine density nearest turbine distance
and monitored count variables The elevation data show that when golden eagles are killed
the turbines are at a mean elevation of 2508 m 20 m lower than the mean elevation of
nonkill turbines at 2705 m This lower elevation also fits with the finding that kill turbines
were found significantly less frequently on hilltop ridgelines than nonkill turbines (p lt005)
Of the 134 kill turbines only 7 were on ridgelines This is just 52 while the nonkill rate of
ridgeline turbines was 112 The proportion of turbines that were on ridgelines was lower
than I had expected to find I assumed that ridgelines represented some of the best areas to
capture eolian energy and that there would be more than just 11 of turbines there If this
assumption is true then perhaps the method I used to calculate ridgelines was too strict to
accurately identify them all Or it may be that the ridgelines are not the best locations to
capture wind resources or that ridgelines are difficult to develop into turbine locations
Hill aspect was also found to be significantly different between killer turbines and
nonkill turbines The mean aspect for kill turbines was 317degwhile nonkill turbines were on
Discuss ion 96
slopes oriented towards 41deg This means that the average direction of the hillside of a kill
turbine faces northwest while the nonkill average faces northeast The histograms calculated
in R (Fig R-16 and R-17) illustrate that in neither group do a large proportion of turbines
reside on a hillside that faces west or southwest where the prevailing winds come from at
Altamont I have no doubt that the engineers and surveyors that site turbines know very well
what they are doing but it was a surprise for one of my assumptions to be dismantled
Aspect was shown as not significance Orloffrsquos (1992) and Thelanderrsquos studies (2003)
Among the more interesting findings is that the turbines that killed golden eagles
were in a less dense array and further away from the next nearest turbine neighbor The
mean measure of density of kill turbines was 4183 turbines per Km2 while the mean density
for nonkill turbines was higher at 4985 turbines per Km2 The next nearest turbine for a kill
turbine had a mean distance of 392 m while the nonkill turbinesrsquo nearest turbine neighbor
was closer at a mean distance of 307 m Both of these measurements indicate that kill
turbines are not among the densest most closely arrayed turbine groupings This concurs
with Orloffrsquos findings that turbines with lower structure density had significantly higher
mortality rates for both raptors and non-raptors (1992)
The measure of density used in this study however is not without flaws Both the
diversity and density calculations are based on a grid made of nearly 1 Km2 polygons that
was calculated and rendered in ArcMap This grid is a static layer based on of the maximum
extent of Altamontrsquos turbine array and it has enabled a number of simple calculations in the
current study This grid also represents a single sample and single measurement of the space
A more robust study would recalculate the grid a number of times after random placements
over the array By doing this many measurements would be taken and average values could
be calculated that better represent the space The same measurements of diversity and
Discuss ion 97
turbine density within the space could be better analyzed A sampling regime such as this
may potentially provide more reliable results An alternative for these calculations would
have been to generate a 500-1000 meter buffer around each turbine calculated annually and
use those buffer zones as polygons to calculate a diversity index and density figure This
technique would establish each turbine as the center of its own zone and may lead to a better
description of the turbinersquos relationships with its nearest neighbors and other geographic
features It would be interesting to see how the measurements of density may change
depending upon how the samples are taken Would a density measure based on each turbine
as the center of its own territory yield a more accurate result and would it support the
finding reported herein that kill turbines are found in a less dense array
Comparing nonkill and kill turbines that are at the end of turbine rows demonstrates
another area of significant difference between the two groups Of the 134 kill turbines
381 were end row turbines while only 224 of nonkill turbines were end row features If
this is indeed a variable that influences golden eagle fatalities then the repowering plan at
Altamont may be creating additional danger for golden eagles As turbines are being
removed the long rows (ldquoscreensrdquo in this study) are being broken up to create more gaps
with the idea that the long rows constitute a dangerous impediment to birds One of the
effects of this practice is to create more end row turbines If a row of turbines is broken in
the middle by removing three units then two more end row turbines are established on
either side of the removals In this study there was no significant difference between screen
counts of kill and nonkill turbines so my findings do not support the practice of breaking
apart long turbine rows into smaller entities
The difference in monitored count mean values between kill and nonkill turbines
was found to be significant (p = 0001) Although the mean values are not largely disparate at
Discuss ion 98
903 for kill turbines and 705 for nonkill turbines it makes logical sense that golden eagle
fatalities will be found at turbines that are searched more often An average of two additional
searches at the kill turbines may have made a difference in detecting an individual bird
fatality
The differences between kill turbines versus nonkill turbines have also been found to
be significant in the character of settling party Every single turbine credited with a golden
eagle death is owned by one of the wind operator settling parties at Altamont Among the
nonkill turbines a small portion 58 are not owned by any member of the settling party
This figure is suspicious because monitoring for bird fatalities was a condition of the
settlement and is paid for in part by wind operators and Alameda County as part of the
settlement It does not make complete sense that turbines are being monitored unless it was
under an alternative arrangement that I am unaware of This could also be an indication that
there is error in the data that must be rectified This variable was included in the study to
determine if there was a difference between settling party turbines some of which go
through seasonal shutdown (as part of the settlement) and those that do not go through the
seasonal shutdown I do not have confidence in the veracity of the data in this field so I do
not find that it supports or doesnrsquot support my hypothesis
The data also do not support differences in saddle turbines or turbine diversity as
significant between kill and nonkill turbines The Shannon index mean values between the
two groups are nearly indistinguishable at 134 for kill turbines and 136 for nonkill turbines
Just two kill turbines are located on hilltop saddles (15) while slightly more nonkill
turbines reside there (25)
Temporal Distribution Age and Sex Frequencies
Discuss ion 99
The most deadly time of the year for golden eagles at Altamont is during the months
of July August and September This corresponds with Altamontrsquos windy season and follows
the breeding period that starts at the beginning of the year (Hunt 1995) This is well
illustrated in the radar chart (Fig R-20) where the bulk of fatalities are seen to occur
between July and October with two noticeable spikes in March and May The lack of
fatalities recorded in the wintertime may be due in part to the seasonal shutdowns of
turbines in the off season or it could be a reflection of less golden eagle activity during that
time of year
The age class data provides an interesting look at the assemblage of fatalities Most
notable are the large number of juveniles (n=43) and the great number of fatalities with
undetermined age (n=57) As was suggested earlier the juvenile number is out of agreement
with Huntrsquos study (2002) where juveniles were a small percentage of fatalities caused by wind
turbines It is possible the numbers reported here for juvenile fatalities are skewed young
depending upon the criteria used by field biologist when they determined the age class of the
bird at time of detection This idea is supported by the low numbers of immature bird
fatalities (n=10) A population census including age class distributions of golden eagles at
Altamont has not been published but Hunt suggested a hypothetical population that
consisted 280 adults (307) 169 immature (509) and 101 juveniles (184) for a
population of 550 at equilibrium (1995) These figures suggest that immature birds make up
half of the population but in the present study they only account for 74 of the fatality
data tested It is possible that immature birds possess some behavioral trait that keeps them
relatively safe from turbine strikes but a more parsimonious explanation is that their low
number is a relic of mischaracterization at time of discovery Juvenile birds are those that are
in their first year of life and it is reasonable to think that a biologist may mistake a carcassrsquos
Discuss ion 100
plumage patterns as those of a younger bird The other possibility is that there is no error in
the age class designations of golden eagle fatalies and juvenile birds are killed by turbines at
Altamont at disproportionate rate compared to Huntrsquos suggested population age class
distribution This would be a disturbing trend because without replacement or recruitment
from outside golden eagle poplulations a higher death rate for juveniles at Altamont would
eventually lead to a collapse which has yet to happen
The results of the sex ratio analysis of the 134 fatalities do not provide much insight
into which sex is more or less disposed to fatal turbine interactions With only 2 of 134 birds
being positively characterized there is little that can be discussed The other 132 birds were
not characterized as either female or male so the sex of these records remains a mystery
The undetermined ages of 430 (58 of 134) of the sample makes it difficult to
detect trends in age class mortality but when looking at age classes and significant turbine
variables several interesting results appear Considering end row status Table R-14 shows
that for non-adult birds (n=51) the percentage killed by end row turbines is cumulatively
255 (13 of 51) which is lower than the average for all fatalities of 381 This is then
offset by the 58 undetermined birds that were more often killed by end row turbines (28 of
58 483)
Fewer adult birds were killed at lattice towers (10 of 25 560) than the average of
709 but again the undetermined birds (n=58) were killed by lattice tower turbines 828
of the time (48 of 58) In fact all birds with determined age classes were killed at lattice
tower turbines less than the calculated mean (Table R-15)
Rotor swept area (Table R-16) showed differences among age classes with juvenile
birds falling victim to smaller turbines on average and immature birds tending toward larger
Discuss ion 101
blade diameters Four of 51 non-adults (78) were killed by ridgetop turbines This is
higher than the calculated mean of 52
Each of the mean nearest turbine distances for all fatalities with classified age classes
are below the total mean of 3923 meters This mean is balanced by the higher than average
nearest turbine distance for fatalities of undetermined age (Table R-18)
C o n c l u s i o n s 1 0 2
Conclusions
There are characteristics of wind turbines fatal to golden eagles at Altamont that are
significantly different from characteristics of those turbines that do not result in fatalities
Among the differences are that kill turbines are found at lower elevations and the aspect of
the hill where the kill turbine averages 317deg while nonkill turbines face 41deg on average
Kill turbines are more often situated on lattice structure towers and they have larger
rotor swept areas than nonkill turbines Kill turbines are placed in less dense turbine arrays
and are less often placed on top of ridgelines Compared to nonkill turbines they have a
longer distance to the next nearest turbine and they are monitored more often Finally kill
turbines are more often situated at the end of a turbine row than are nonkill turbines
Among the characteristics that are not significantly different between kill and nonkill
turbines are the slope of the hill upon which a turbine stands the model of turbine height of
the turbine tower generating capacity diversity of the turbine array the number of other
turbines in its row and whether or not the turbine stands in the saddle of a hilltop ridge
Future Directions
The tests conducted in this study are simple but they reflect the standard approaches
to measuring wind turbine interactions with birds These tests however cannot explain how a
wind turbine is more or less capable or better equipped or better placed to result in a golden
eagle fatality Multivariate analysis on these and other characteristics of wind turbines may be
able to fill in more of our understanding of why and how eagles are killed
Perhaps one way to better understand why some turbines have killed golden eagles
would be to perform duplicate studies of turbine characteristics as they apply to fatalities of
other species By analyzing characteristics that may be important in turbines that result in
C o n c l u s i o n s 1 0 3
fatalities of rock dove red-tailed hawks American kestrels or any of the other often killed
birds at Altamont it may become in a comparative framework more clear which elements
apply to only to golden eagles and which do not
Potential extensions of this research include a further analysis of the remaining
turbines and how many of them fall into a range of values that this study has found
significant This could lead to predictive modeling of future fatalities and could better inform
fatality reduction efforts A more robust study also could be conducted using more tools in
ArcMap LiDAR data and three-dimensional modeling to better understand the terrain and
flight paths of golden eagles and other raptors that frequent Altamont
Efforts to reduce bird deaths at Altamont have attracted many brilliant thinkers
impassioned activists field biologists business people and scientists all in the service of
reducing the damages to bird populations There are some common-sense solutions that
seem to have not gotten to the table For example of the 123 turbines that have killed
golden eagles at Altamont 84 remain present and in operation Among these turbines with
the ids 305 2674 895 and 2608 still stand Each of these four turbines has already killed two
golden eagles during the timeframe of this study Also turbine 2697 is still present in the
array It is already responsible for three golden eagle fatalities In 1994 California enacted a
three strikes law that provided stiff penalties for habitual felony offenders this law has
arguably had some success in curbing violent crimes Perhaps the wind operators could offer
a similar penalty for those turbines that are found to habitually kill protected species
A c k n o w l e d g m e n t s 1 0 4
Acknowledgments
I must acknowledge the teachers in my life that have inspired me to pursue biology
as a topic of study an area of wonder and as a professional calling Among them are the
members of my thesis committee Drs Luis A Ruedas Deborah A Duffield and Michael T
Murphy as well as Craig Tufts Dr Robert Pinger and Tom Brown Jr
I must acknowledge and thank those field biologists that for years collected data
walking transects searching for the slightest hint of a feather I donrsquot know your names but
I thank you for the project I do however know Levin Nason Doug Leslie Karl Dickman
Jesse Schwartz and Chip McConnaha all of whom work on the Altamont project at ICFI
and informed this research
Finally I acknowledge and thank my wife Laura for her support and patience as I
began and finally completed this research
P h o t o C r e d i t s 1 0 5
Photo Credits
Tubular httpwwwpowerworkscomPicturesWEG-turbine-string-lo-res_bJPG Lattice httpmatrixwindsolutionscomkenetech-kvs-33-wind-turbineprettyPhoto[4689]0 Vertical axis httpwwwfiddlersgreennetmodelsmiscellanousWind-Turbinehtml
R e f e r e n c e s 1 0 6
References
Aiken R amp Harris A (2011) Deer Hunting in the United States Demographics amp Trends Addendum to the 2006 National Survey of Fishing Hunting and Wildlife Associated Recreation 2006-10 Retrieved from httpdigitalmediafwsgovcdmrefcollectiondocumentid207
Applegate R D Berger DD Chochran W W Raim A J (1987) Observations of a Radiotagged Golden Eagle Terminating Fall Migration J Raptor Res 21 68-70
American Wind Energy Association (2012) Wind Industry Statistics Quarterly Report 2012(4)
Barclay R M R Baerwald E F amp Gruver J C (2007) Variation in bat and bird fatalities at wind energy facilities assessing the effects of rotor size and tower height Can J Zool 85(3) 381-387 doi 101139Z07-011
Bortolotti G R (1984) Age and Sex Size Variation in Golden Eagles Journal of Field Ornithology 55(1) 54-66 Retrieved from httpwwwjstororgstable4512857
Brower J E Zar J von Ende CN (1998) Field and Laboratory Methods for General Ecology Fourth ed WCBMcGraw-Hill 1998
California Energy Commission (2007) California Guidelines for Reducing Impacts to Birds and Bats From Wind Energy Development CEC-700-2007-008-CMF 125
Cameron E S (1908) Observations on the Golden Eagle in Montana The Auk 25 251-68
Carnie S K (1954) Food Habits of Nesting Golden Eagles in the Coast Ranges of California The Condor (56)1 3-12
Collopy M W (1983) A Comparison of Direct Observations and Collections of Prey Remains in Determining the Diet of Golden Eagles The Journal of Wildlife Management 47(2) 360-368 Retrieved from httpwwwjstororgstable3808508
Collopy M W (1983) Foraging Behavior and Success of Golden Eagles The Auk 100(3) 747-749 Retrieved from httpwwwjstororgstable4086484
Coonan T J Schwemm C A et al (2005) Decline of an Island Fox Subspecies to Near Extinction The Southwestern Naturalist (50)1 32-41
Dixon J B (1937) The Golden Eagle in San Diego County California Condor 49-56
R e f e r e n c e s 1 0 7
Edwards T C J amp Collopy M W (1983) Obligate and Facultative Brood Reduction in Eagles An Examination of Factors That Influence Fratricide The Auk 100(3) 630-635 Retrieved from httpwwwjstororgstable4086464
Edwards T C J amp Kochert M N (1986) Use of Body Weight and Length of Footpad as Predictors of Sex in Golden Eagles Journal of Field Ornithology 57(4) 317-319
Ellis D H (2004) Mottling in the Plumage of Juvenile Golden Eagles North American Bird Bander (29)2 53-58
Erickson W P Johnson G D Strickland M D Young Jr D P Sernka K J amp Good R E (2001) Avian Collisions with Wind Turbines A Summary of existing studies and comparisons to other sources of avian collision mortality in the United States 62 Retrieved from httpwwwostigovenergycitationsproductbibliojsposti_id=822418
Esri Knowledge Base- Technical Articles (2011) How To Identify ridgelines from a DEM Article ID 39093 Retrieved from httpsupportesricomenknowledgebasetecharticlesdetail39093
Franson J C L Sileo and N J Thomas 1995 Causes of eagle deaths Page 68 in E T LaRoe G S Farris C E Puckett and P D Doran editors Our Living Resources A Report to the Nation on the Distribution Abundance and Health of the US Plants Animals and Ecosystems US Department of the Interior National Biological Service Washington DC USA
Golden Gate Audubon Society Ohlone Audubon Society et al (2007) S1 Final Settlement Agreement 10 Retrieved from httpwwwaltamontsrcorgalt_docalt_settlements1_board_approved_settlement_agreement(55464923_1)pdf
Good R E Nielson R M et al (2007) A Population Estimate for Golden Eagles in the Western United States Journal of Wildlife Management (71)2 395-402
Harmata A R amp Restani M (1995) Environmental contaminants and cholinesterase in blood of vernal migrant Bald and Golden Eagles in Montana Intermountain Journal of Science 1 1-15
Hoover S L (2002) The Response of Red-Tailed Hawks and Golden Eagles to Topographical Features Weather and Abundance of a Dominant Prey Species at the Altamont Pass Wind Resource Area California NRELSR-500-30868 Retrieved from httpwwwostigovenergycitationsproductbibliojsposti_id=15000694
Hunt G Jackman R E Brown T L Gilardi J G Driscoll D E amp Culp L (1995) A Pilot Golden Eagle Population Study in the Altamont Pass Wind Resource Area California
R e f e r e n c e s 1 0 8
Hunt G Jackman R E Hunt T L Driscoll D E amp Culp L (1999) A Population Study of Golden Eagles in the Altamont Pass Wind Resource Area Population Trend Analysis 1994-1997 NRELSR-500-26092 32 Retrieved from httpwwwnrelgovwindpdfs26092pdf
Hunt G (2002) Golden Eagles in a Perilous Landscape Predicting the Effects of Mitigation for Wind Turbine Bladestrike Mortality P500-02-043F 52
Hunt G Burnham W Parish C N Burnham K K Mutch B amp Oaks J L (2006) Bullet fragments in deer remains implications for lead exposure in avian scavengers Wildlife Society Bulletin 34(1) 167-170
ICFI International (2011) Altamont Pass Wind Resource Area Bird Fatality Study M(21)
Kochert M N amp Steenhof K (2002) Golden Eagles in the US amp Canada Status Trends amp Conservation Challenges Journal of Raptor Research 36(1 Supplement) 32-40 Retrieved from httpfrescusgsgovproductspapers1092_Kochertpdf
Kochert M N Steenhof K Mcintyre C L amp Craig E H (2002) Golden Eagle (Aquila chrysaetos) The Birds of North America Online Ithaca Cornell Lab of Ornithology Retrieved from httpbnabirdscornelledubnaspecies684
Leslie D Schwartz J amp Karas B R (2012) Altamont Pass Wind Resource Area Bird Fatality Study Bird Years 2005-2010 M(87) 171
Liguori J (2004) How to Age Golden Eagles Techniques for Birds Observed in Flight Birding (36)3 278-283
Lund U Agostinelli C (2011) Circular Statistics Package lsquocircularrsquo Circular Statistics (version 04-3) URL httpsr-forger-projectorgprojectscircular
Lutmerding J A amp Love A S (2013) Longevity Records of North American Birds Version 20131 Patuxent Wildlife Research Center Bird Banding Laboratory Laurel MD
McIntyre C L amp Collopy M W (2006) Postfledging Dependence Period of Migratory Golden Eagles (Aquila chrysaetos) in Denali National Park and Preserve Alaska The Auk 123(3) 877-884 Retrieved from httpenvironmentunreduacademyaboutCollopyPubsMcIntyreCollopy2006pdf
Menkens G E J amp Anderson S H (1987) Nest Site Characteristics of Predominantly Tree-nesting Population of Golden Eagles Journal of Field Ornithology 58(1) 22-25
National Renewable Energy Laboratory (2010) Estimates of Windy Land Area and Wind Energy Potential by State for Area gt=30 Capacity Factor at 80m Retrieved from httpwwwwindpoweringamericagovpdfswind_mapswind_potential_80m_30percentpdf
R e f e r e n c e s 1 0 9
National Research Council (2007) Environmental Impacts of Wind-Energy Projects
Olendorff R R (1976) The Food Habits of North American Golden Eagles American Midland Naturalist 95(1) 231-236 Retrieved from httpwwwjstororgstable2424254
Omland K S amp Hoffman S W (1996) Seasonal Diel and Spatial Dispersion Patterns of Golden Eagle Autumn Migration in Southwestern Montana The Condor (98)3 633-36
Orloff S G amp Flannery A (1992) Wind Turbine Effects on Avian Activity Habitat Use and Mortality in Altamont Pass and Solano County Wind Resource Areas 1989-1991 P700-92-401
Pattee O H Bloom P H Scott J M amp Smith M R (1990) Lead Hazards within the Range of the California Condor The Condor 92(4) 931-937 Retrieved from httpwwwjstororgstable1368729
Phillips R L J L Cummings et al (1996) Golden Eagle Predation on Domestic Calves Wildlife Society Bulletin (24)3 468-70
Scientific Review Committee Altamont Pass Wind Resource Area (2007) Altamont Pass Wind Resource Area Bird and Bat Mortality Monitoring Protocols (M)1 Retrieved from httpwwwaltamontsrcorgalt_docM1_APWRA_monitoring_protocol_7_11_07pdf
Scientific Review Committee Altamont Pass Wind Resource Area amp Chatfield A (2008a) Determination of Cause of Death Protocol (M)11 Retrieved from httpwwwaltamontsrcorgalt_docm11_cause_of_death_protocolpdf
Scientific Review Committee Altamont Pass Wind Resource Area (2008b) Working Decision Tree for Altamont Bird Fatality Data Filtering (M)26 Retrieved from httpwwwaltamontsrcorgalt_docm26_decision_tree_for_bird_fatality_data_filteringpdf
Smallwood K S amp Neher L (2004) Repowering the APWRA Forecasting and minimizing avian mortality without significant loss of power generation CEC-500-2005-005 Retrieved from http2011giftbiologicaldiversityorgcampaignsprotecting_birds_of_prey_at_altamont_passpdfscec-repoweringpdf
Smallwood K S amp Thelander C (2001) Bird Mortality At the Altamont Pass Wind Resource Area March 1998-September 2001 NRELSR-500-36973 411
Strickland M D Arnett E B et al (2011) Comprehensive Guide to Studying Wind Energy Wildlife Interactions National Wind Coordinating Collaborative 289
R e f e r e n c e s 1 1 0
Thelander C G Smallwood K S amp Rugge L (2003) Bird Risk Behaviors and Fatalities At the Altamont Pass Wind Resource Area Period Performance March 1998 - December 2000 NRELSR-500-33829 86
Tigner James R (1973) Golden Eagle Predation on a Pronghorn Fawn The Southwestern Naturalist 18 346-48
US Department of Energy (2008) 20 Wind Energy By 2030 Increasing Wind Energyrsquos Contribution to US Electricity Supply DOEGO-102008-2567 248
US Government Accountability Office ldquoImpacts on Wildlife and Government Responsibilities for Regulating Development and Protecting Wildliferdquo US Government Accountability Office Washington DC GAO-05-906 (2005) 60
Yates Richard E B Riley PT McClelland et al ldquoThe Influence of Weather on Golden Eagle Migration in Northwestern Montanardquo Journal of Raptor Research 352 (2001) 81-90
A p p e n d i x A 1 1 1
Appendix A List of Fields in the SRC Fatality Table
Field Name Description of field
Project ID Internal consultant code for management purposes
Project Project name ndash Altamont Pass Wind Resource Area
Fatality ID Unique ID database generated
Primary Detection ID Computer generated unique number
Fatality Fatality number assigned by field crew leader in the format of 4 digit year two digit month two digit day-two digit number of fatality discovered that day For example 20110526-01 is the first fatality discovered on May 26 2011
Primary Detection Detection number assigned by the discovering biologist Similar naming convention as fatality number but the number is appended to include the discovererrsquos initials and the number of detection the discoverer made that day For example 20110526-LTN01 is the first fatality that LTN made on May 26 2011
Was Injured TRUEFALSE whether the bird was still alive and injured when it was discovered
Is Wrrs TRUEFALSE whether a bird was initially detected by the Wildlife Reporting and Response System
Transect Protocol Identity of the protocol of monitoring that was being done at the time of discovery ndash current study QAQC Incidental etc
Transect Type The type of transect performed at time of discovery ndash primary secondary follow-up etc
Detection Date Date of detection
Detection Monitoring Year Different than calendar year monitoring year starts in October and continues into the next yearrsquos calendar by 9 months
Detection Year Month Coded month and year
Species Code 4 digit species code for birds and mammals GOEA=Golden Eagle
A p p e n d i x A 1 1 2
Age Age of fatality at time of death adult sub adult juvenile nestling unknown
Sex Sex female male or unknown
String Non-unique string identifier
Turbine Label Label on the turbine nearest the carcass
Turbine Bearing Back bearing from the carcass
Turbine Distance Distance from the carcass to the nearest turbine
Structure Type Notable structure near corpse ndash fence powerline building
Structure Identifier Sign or other identifier
Structure Bearing Back-bearing from the carcass used to locate structure
Structure Distance Distance to the structure
Position X X coordinate on GPS
Position Y Y coordinate on GPS
Body Parts Description of all body parts found or missing
Cause of Death ID Code for the diagnosed cause of death
Cause of Death Diagnosed cause of death determined in the field
Days Dead Range Categorical listing of days dead range
Days Dead Corresponds to the days dead range but set to an integer
Death Date Backdated using days dead and the detection date
Death Monitoring Year Monitoring year in which the fatality will be counted
Death Year Month Year and month in which the fatality will be counted
Was Scavenged Binomial variable based on evidence of scavenging
Carcass Condition Description of the carcass to help the death date determination
Were Insects Present Binomial variable
Insect Types Categorical variable listing of typical insect types present
A p p e n d i x A 1 1 3
Was Flesh Present Binomial variable used to determine carcass age
Flesh Textures Categorical variable used to determine carcass age
Was Head Present Binomial variable
Eye Condition Categorical variable used to indicate carcass age
Was Enamel Present Binomial variable used to determine carcass age
Enamel Presence Categorical variable used to determine carcass age
Were Bones Present Binomial variable used to determine carcass age
Bone Colors Categorical variable used to determine carcass age
Was Sample Taken Binomial variable recording whether samples will be on file
Sample Types Feather flesh or both
Distance Sighted Continuous variable used to track searcher statistics
Parts Sighted Variable used to track searcher statistics
Discoverer Categorical variable used to track searcher proficiency
Notes Blank field in which notes on weather conditions etc
Status ID One or two digit code for how the fatality will be categorized
Status Description of the status ID
Transect Status ID Code for the transect type that was being conducted when the carcass was detected
Transect Status Description of the transect status ID
The following 17 fields are the Status followed by the status ID as seen above In the database these fields are filled in with either True or False These fields are a redundancy but are there to better manipulate the data for reports
Unreviewed (0)
Valid (1)
No Group or Size (2)
A p p e n d i x A 1 1 4
No TurbineID (3)
gt125 m from turbine (4)
Cause of death not turbine-related (5)
gt90 days dead (6)
IncidentalWRRS (7)
Injured (8)
No transect or detection (9)
Off-site carcass for placement (10)
Redundant fatality (11)
Duplicate chicken or test (12)
First detected in non-primary search (13)
Additional parts (14)
Later detection was 13 (15)
Undetermined death date (16)
A p p e n d i x B 1 1 5
Appendix B Fatality Detection Form
A p p e n d i x C 1 1 6
Appendix C Document M11 Determination of Cause of Death (Adapted)
Determination of Cause of Death The following guidelines are used to determine the most likely cause of death for each fatality encountered in the field Cause of death is judged on the basis of 3 main variables
1) Species (non-predated species versus all other species
2) Proximity to turbines power lines and other structures and
3) The condition of the carcass including type of injury and scavenging The cause of death is circled on the fatality data form If a cause of death cannot be determined the unknown option is circled and the most likely causes is underlined Justification for the determination of cause of death is provided on the data form Illnessold age crippling bias or scavenger removal is not accounted for in our determination of cause of death See glossary at end of document for definitions of terms used
1 Blade StrikeTurbine Collision
A Fatality is any non-predated species (ie golden eagle red-tailed hawk or other large buteo great-horned owl etc) found within the search area
B Fatality is an intact (no evidence of scavenging) carcass with no apparent injuries and is found within the search radius
C Fatality is any bird or bat species that has not been scavenged and has injuries consistent with a turbine blade strike or tower collision (ie blunt force trauma severed wings legs or torso decapitation etc) This determination can only be made when the carcass has not been scavenged by vertebrates as scavenging may obscure or mimic turbine-induced injury
(Exceptions electrocutions line strikes and BUOW fatalities at burrows see sections 2 3 and 4B below)
2 Electrocution
A Carcass exhibits obvious signs of electrocution (ie singed feathers clenched talons etc)
B Intact carcass with no apparent injuries is found within 3m of a power pole and is greater than 10m from turbine string axis (see Blade Strike part B)
3 Line Strike
A Intact carcass with or without apparent injury is found outside of search radius beneath power lines or guy wires (within 3m of line) and no evidence of electrocution (see Electrocution)
4 Predation
A Fatalities of non-predated species (ie GOEA RTHA SWHA FEHA and GHOW) are never attributed to predation
A p p e n d i x C 1 1 7
B Scavengedpredated BUOW fatality within 1m of an active burrow is always considered predation regardless of proximity to other sources of mortality
5 Other
This category is reserved for any other obvious or suspected cause of death Evidence to support this assessment is provided on the data form These may include but are not limited to
Fence collisions
Auto collisions
Collisions with other structures such as transformer boxes or buildings
Entanglement in netting (present on some non-operational turbines to prevent perching)
Nestling fatalities found at base of turbine when young birds fall from the nest or when old nests are cleaned out of turbine housing
Significant turbine oilgrease on feathers
6 Unknown
A Blade striketurbine collision underlined
Intact or scavenged carcass of any species with competing or uncertain causes of death (For exception see Predation part C)
B Predation underlined
Scavengedpredated carcass of non-predated species found outside of search area with competing or uncertain causes of death
Scavengedpredated carcass of any other species found within or outside of search area with competing or uncertain causes of death
C Electrocution underlined
Any bird species found within 3m of a power pole with competing or uncertain causes of death
D Line Strike underlined
Any bird species found within 3m of power lines or guy wires with competing or uncertain causes of death
E Other underlined
Carcass of any species exhibiting evidence of non-listed (other) source of mortality with competing or uncertain causes of death
A p p e n d i x D 1 1 8
Appendix D List of Fields in the SRC Turbine Table
Field Name Description
Project ID Internal ICFI code for programming purposes
Project Project name ndash Altamont Pass Wind Resource Area
Turbine ID Unique numerical identifier for a turbine
Turbine Label Non unique alphanumeric identifier physically posted on a turbine tower
String Number Non unique numerical identifier of rowsectional grouping of turbines
Position X Latitudinal coordinate value based on NAD1927 Datum
Position Y Longitudinal coordinate value base on NAD1927 Datum
Company ID Name of the company that operates the turbine
Project Site A geographically defined area within the APWRA where wind companies operate turbine arrays
Turbine Model Modelmanufacturer of the wind turbine
Tower Type Lattice tubular or vertical axis
Tower Height Height from ground to turbine axis
Blade Length Length of blade from axis to tip
Rotor Swept Area Total area covered by a rotating turbine propeller
Generating Capacity The rated energy generating capacity for a wind turbine
Is AIC Is owned by the AIC partnership
Installation Date Date that the turbinetower was installed
Removal Date Date that the turbinetower was removed
Removal Reason A note field with details on why a turbinetower was removed
Tier Rating of the turbine following a hazardous turbine survey
Hrt2007 Rating of turbine in 2007
A p p e n d i x D 1 1 9
Hrt2010 Rating of turbine in 2010
Notes Additional note field
Grid ID
Elevation Elevation of the ground at the turbine base
Slope Slope of the hill on which the turbine was built
Aspect Direction the hill on which the turbine was built faces measured in degrees
County Which county in California ndash Alameda or Contra Costa
A p p e n d i x E 1 2 0
Appendix E List of Fields in the SRC Transects Table
Field Name Description
Project ID Internal code of consulting company
Project Project name ndash Altamont Pass Wind Resource Area
Transect GUID Computer generated unique identifier of a single transect (search)
Transect Date Date the transect was performed
Calendar year The calendar year in which the transect was performed
Monitoring Year The avian monitoring year in which the transect was performed
Year Month The calendar year followed by the name of the month
String ID Unique numerical identifier of rowsectional grouping of turbines
String Non unique numerical identifier of rowsectional grouping of turbines
of Turbines Count of turbines within that String ID
Installed Capacity Sum of turbine generating capacities within that String ID
Study ID Unique identity of the study that the transect was conducted to support
Study Code Abbreviation of the full study name for example CS-current Study
Transect Type ID Unique identity of the type of transect conducted Corresponds to transect type
Transect Type Identity of the type of transect conducted for example primary search secondary clearing Incidental etc
Transect Protocol ID Unique identity of the transect protocol Corresponds to transect type
Transect Protocol Identity of the protocol under which the transect was conducted for example KB clearing current study primary QAQC fatality check etc
A p p e n d i x E 1 2 1
Notes Note field contains information about changes and alterations to the record
Transect Status ID Code for reviewed and unreviewed transects
Transect Status Status of reviewed or unreviewed
A p p e n d i x F 1 2 2
Appendix F Use of the Circular Package in R to Calculate Aspect Statistics
Package lsquocircularrsquo httpcranr-projectorgwebpackagescircularcircularpdf
httpcasoilresourcelawrucdavisedudrupalnode1042
Scripts for Nonkill Turbine Aspect Calculations and Histogram
gt PASPlt-readcsv(CPinger DataFat Table versionsCSVsAspect
CalculationsPASPcsvheader=T)
gt aspectplot lt- function(PASP PASPbins=60 PASPbw=30 PASPaxis=seq(0 350 by=10)
plottitle=NULL)
gt PASPlt-naomit(PASP)
gt cPASPlt- circular(PASP units=degrees template=geographics)
gt mPASPlt-mean(cPASP)
gt rhoPASPlt-rhocircular(cPASP)
gt PASPaxislt-seq(0350by=10)
gt aPASPlt-circular(PASPaxisunits=degreestemplate=geographics)
gt PASPbinslt-(bins=60)
gt plot(cPASP axes=FALSE stack=TRUEshrink=115 cex=1 sep=006 pch=21col=1
bg=RoyalBlue)
gt lines(density(cPASPbw=30)col=RoyalBLuelty=2)
gt axiscircular(at=(-aPASP)+90labels=aPASPcex=06)
gt text(01125Northcex=085font=1)
gt arrowscircular(mPASPshrink=rhoPASPlength=015col=RoyalBlue)
gt summary(ASP)
the summary script above is a linear calculation of the data
Nonkill Min 003 1st Qu 9347 Median 16206 Mean 18386 3rd Qu 30057 Max 35990
gt summary(mPASP)
A p p e n d i x F 1 2 3
This calculation is the circular calculation of the mean value
n Mean Rho 100000 4123038 100000
Scripts for Kill Turbine Aspect Calculations and Histogram
gt aspectplot lt- function(KASP KASPbins=60 KASPbw=30 KASPaxis=seq(0 350 by=10)
plottitle=NULL)
+ KASPlt-naomit(KASP)
gt cKASPlt- circular(KASP units=degrees template=geographics)
gt mKASPlt-mean(cKASP)
gt rhoKASPlt-rhocircular(cKASP)
gt KASPaxislt-seq(0350by=10)
gt aKASPlt-circular(KASPaxisunits=degreestemplate=geographics)
gt KASPbinslt-(bins=60)
gt plot(cKASP axes=FALSE stack=TRUEshrink=115 cex=1 sep=006 pch=21col=1 bg=Red)
gt lines(density(cKASPbw=30)col=Redlty=2)
gt axiscircular(at=(-aKASP)+90labels=aKASPcex=06)
gt text(01125Northcex=085font=1)
gt arrowscircular(mKASPshrink=rhoKASPlength=015col=Red)
gt summary(KASP)
the summary script above is a linear calculation of the data
Kill Min 114 1st Qu 12317 Median 21202 Mean 20412 3rd Qu 30806 Max 35944
gt summary(mKASP)
This calculation is the circular calculation of the mean value
n Mean Rho 100000 31799896 (-6124193) 100000
Kill Aspect Review Minimum 282 1st Quarter 12664 Median 21941 Mean 20554 3rd Quarter 30583 Maximum 35944 gtsummary(mKASP) Mean -6124193
A p p e n d i x G 1 2 4
Appendix G Calculations of Hilltop Ridgelines
Adapted from Article 39093 October 2011 Calculating
httpsupportesricomenknowledgebasetecharticlesdetail39093 How To Identify ridgelines from a DEM
Article ID 39093
Software ArcGIS - ArcEditor 931 10 ArcGIS - ArcInfo 931 10 ArcGIS - ArcView 931 10
Platforms Windows XP 2003Server Vista 2008Server Win 7
Summary The instructions provided describe how to identify ridgelines from a DEM Spatial Analyst and the Hydrology Toolset can be used to identify and extract ridgeline features from an elevation raster (DEM) in the same manner as a stream network can be created by reversing the DEM cell values Procedure This workflow uses Map Algebra and the Hydrology Toolset to derive ridgeline features from a DEM
1 Fill the DEM using the Fill tool in the Hydrology Toolset
2 Switch the highlow values in the Fill DEM by using the Raster Calculator to multiply the Fill DEM by -1
3 Run the Flow Direction tool using the output raster from step 2 as the Input surface raster and
checking Force all edge cells to flow outward
4 Run the Flow Accumulation tool using the output raster from step 3 as the Input flow direction raster
A p p e n d i x G 1 2 5
5 Set the Flow Accumulation threshold and create the stream network raster using the Raster
Calculator For 931
6 Create a Stream Order raster using the stream network raster (step 5) for the Input steam raster and the Flow Direction raster (step 3) for the Input flow direction raster
7 Create a ridgeline shapefile by running the Stream to Feature tool with the Stream Order raster as the Input stream raster
Created 6242011Last Modified 10262011
A p p e n d i x G 1 2 6
To measure whether a turbine was near a ridgeline The Analysis toolboxProximitynear Tool A search radius of 10 meters was used Any turbine within the 10 meters is considered on the ridge top
A p p e n d i x H 1 2 7
Appendix H Fishnet Square Turbine Count Table
Turbine Model
Code
250KW 1
Bonus 2
Danwin 3
Enertech 4
Flowind 5
Howden 6
Kenetech 56-100
7
KVS 33 8
Turbine Model
Code
Micon 9
Mitsubishi 1000A
10
Nordtank 11
Polenko 12
V-47 13
Vestas 14
Windmaster 15
Windmatic 16
Turbines Present in 1999
Fis
h ID
1 2 3 4 5 6 7 8 9 10 11 12 13 14 15 16
To
tal
13 0 0 0 0 0 0 22 0 0 0 0 0 0 0 0 0 22
14 0 0 0 0 0 0 60 0 0 0 0 0 0 0 0 0 60
15 0 0 0 0 0 0 10 0 0 0 0 0 0 0 0 0 10
27 0 0 0 0 0 0 15 0 0 0 0 0 0 0 0 0 15
28 0 0 0 0 0 0 14 0 0 0 0 0 0 0 0 0 14
29 0 0 0 0 0 0 30 0 0 0 0 0 0 0 0 0 30
30 0 0 0 0 0 0 51 0 0 0 0 0 0 0 0 0 51
31 0 0 0 0 0 0 27 0 0 0 0 0 0 0 0 0 27
42 0 10 0 0 0 0 0 0 0 0 0 0 0 0 0 0 10
43 0 47 0 0 0 0 28 0 0 0 0 0 0 0 0 0 75
44 0 15 0 0 0 0 29 0 0 0 0 0 0 0 0 0 44
45 0 0 0 0 0 0 87 0 0 0 0 0 0 0 0 0 87
46 0 0 0 0 0 0 23 0 0 0 0 0 0 0 0 0 23
47 0 0 0 0 0 0 29 0 0 0 0 0 0 0 0 0 29
A p p e n d i x H 1 2 8
58 0 27 0 0 0 0 0 0 0 0 41 0 0 0 0 0 68
59 0 21 0 0 0 0 0 0 0 0 62 0 0 0 0 0 83
60 0 14 0 0 0 0 26 1 0 0 1 0 0 0 0 0 42
61 3 0 0 0 0 0 46 0 0 0 0 0 0 0 0 0 49
62 0 0 0 0 0 0 6 0 0 0 0 0 0 0 0 0 6
70 0 0 0 0 0 0 4 1 0 0 0 0 0 0 0 0 5
71 0 0 0 0 0 0 52 0 0 0 0 0 0 0 0 0 52
72 4 0 0 0 0 0 37 0 0 0 0 0 0 0 0 0 41
73 0 0 0 0 0 0 71 0 0 0 0 0 0 0 0 0 71
74 0 24 0 0 0 0 0 0 0 0 15 0 0 0 0 0 39
75 0 53 0 0 0 0 10 0 0 0 6 0 0 0 0 0 69
76 9 0 0 0 0 0 65 0 0 0 0 0 0 0 0 0 74
77 4 0 0 0 0 0 2 0 0 0 0 0 0 0 0 0 6
85 0 0 0 0 0 0 25 7 0 0 0 0 0 0 0 0 32
86 0 0 0 0 0 0 28 8 0 0 0 0 0 0 0 0 36
87 0 0 0 0 0 0 39 2 0 0 0 0 0 0 0 0 41
88 0 0 0 0 0 0 119 0 0 0 0 0 0 0 0 0 119
89 0 0 0 0 0 0 84 0 0 0 0 0 0 0 0 0 84
90 0 0 0 0 0 0 22 0 0 0 0 0 0 0 0 0 22
91 0 0 0 0 0 0 81 0 0 0 0 0 0 0 0 0 81
92 0 0 0 0 0 0 49 0 0 0 0 0 0 0 0 0 49
93 0 0 0 0 0 0 16 0 0 0 0 0 0 0 0 0 16
101 0 0 0 0 8 0 0 0 0 0 0 0 0 0 0 0 8
102 0 0 0 0 48 0 0 0 0 0 0 0 0 0 0 0 48
103 0 11 0 0 2 0 8 0 0 0 0 0 0 0 0 0 21
104 0 0 1 0 0 0 21 0 0 0 0 0 0 0 0 0 22
A p p e n d i x H 1 2 9
105 0 0 0 0 0 0 38 0 0 0 0 0 0 0 0 0 38
106 0 0 0 0 0 0 29 0 0 0 0 0 0 0 0 0 29
107 0 0 0 0 0 0 34 0 0 0 0 0 0 0 0 0 34
108 0 0 0 0 0 0 8 0 0 0 0 0 0 0 0 0 8
109 0 0 0 0 0 0 1 0 0 0 0 0 0 0 0 0 1
111 0 0 0 0 0 0 0 0 18 0 0 0 0 0 0 0 18
116 0 0 0 0 0 0 42 0 0 0 0 0 0 0 0 0 42
117 0 0 0 0 5 0 0 0 0 0 0 0 0 0 0 0 5
118 0 0 0 0 11 0 0 0 0 0 0 0 0 0 0 0 11
119 0 3 0 0 3 0 0 0 0 0 0 0 0 86 0 0 92
120 0 15 15 0 0 0 0 0 0 0 0 0 0 27 0 0 57
121 0 0 2 0 0 0 8 0 0 0 0 0 0 0 0 0 10
127 0 0 0 0 0 0 0 0 34 0 0 0 0 0 0 0 34
131 0 0 0 0 0 0 60 0 0 0 0 0 0 0 0 0 60
132 0 0 0 0 0 0 28 0 0 0 0 0 0 0 0 0 28
134 0 0 0 0 0 0 0 0 0 0 0 0 0 2 0 0 2
135 0 0 0 0 0 0 2 0 0 0 0 0 0 67 0 0 69
136 0 0 0 0 0 0 0 0 0 0 0 0 0 20 0 0 20
137 0 0 0 0 2 0 21 0 0 0 0 0 0 0 0 0 23
138 0 0 0 23 5 0 40 0 0 0 0 0 0 0 0 0 68
139 0 0 0 60 0 0 0 0 0 0 0 1 0 0 0 24 85
140 0 0 0 0 0 0 0 0 0 0 0 11 0 0 0 2 13
147 0 0 0 0 0 0 38 0 0 0 0 0 0 0 0 0 38
148 0 0 0 0 0 0 40 0 0 0 0 0 0 0 0 0 40
150 0 0 0 0 0 0 17 0 0 0 0 0 0 0 0 0 17
151 0 0 0 0 0 0 2 0 0 0 0 0 0 0 0 0 2
A p p e n d i x H 1 3 0
152 0 5 1 0 0 0 12 0 0 0 0 0 0 0 0 0 18
153 0 12 6 0 15 0 0 0 0 0 0 0 0 0 0 0 33
154 0 9 0 19 18 0 3 0 12 0 0 0 0 0 0 0 61
155 0 0 0 68 0 0 11 0 26 0 0 0 0 0 0 0 105
163 0 0 0 0 0 0 33 0 0 0 0 0 0 0 0 0 33
164 0 0 0 0 0 0 27 0 0 0 0 0 0 0 0 0 27
165 0 0 0 0 0 0 14 0 0 0 0 0 0 0 0 0 14
166 0 0 0 0 0 0 34 0 0 0 0 0 0 0 0 0 34
167 0 0 0 0 0 0 46 0 0 0 0 0 0 0 0 0 46
168 0 0 0 0 0 0 46 2 0 0 0 0 0 0 0 0 48
169 0 0 0 0 0 0 54 0 0 0 0 0 0 0 0 0 54
170 0 33 0 0 23 0 19 0 0 0 0 0 0 0 0 0 75
171 0 0 0 0 0 0 62 0 0 0 0 0 0 0 0 0 62
173 0 0 0 0 0 0 0 0 29 0 0 0 0 0 0 0 29
174 0 0 0 0 0 0 0 0 10 0 0 0 0 0 0 0 10
179 0 0 0 0 0 0 16 0 0 0 0 0 0 0 0 0 16
180 0 0 0 0 0 0 4 0 0 0 0 0 0 0 0 0 4
181 0 0 0 0 0 0 41 0 0 0 0 0 0 0 0 0 41
182 0 0 0 0 0 0 56 0 0 0 0 0 0 0 0 0 56
183 0 3 0 0 0 0 3 0 0 0 0 0 0 0 0 0 6
184 0 37 0 0 6 0 3 0 0 0 0 0 0 0 0 0 46
185 0 44 0 0 3 0 1 0 0 0 0 0 0 0 0 0 48
186 0 0 0 0 9 0 46 0 0 0 0 0 0 0 0 0 55
187 0 0 0 0 0 0 51 0 0 0 0 0 0 0 0 0 51
189 0 0 0 0 0 0 0 0 88 0 0 0 0 0 0 0 88
190 0 0 0 0 0 0 0 0 4 0 0 0 0 0 0 0 4
A p p e n d i x H 1 3 1
193 0 0 0 0 0 0 20 0 0 0 0 0 0 0 0 0 20
194 0 0 0 0 0 0 44 0 0 0 0 0 0 0 0 0 44
195 0 0 0 0 0 0 33 0 0 0 0 0 0 0 0 0 33
196 0 0 0 0 0 0 56 0 0 0 0 0 0 0 0 0 56
197 0 0 0 0 0 0 37 0 0 0 0 0 0 0 0 0 37
198 0 11 0 0 0 0 17 0 0 0 0 0 0 0 0 0 28
199 0 28 0 0 0 0 0 0 0 0 0 0 0 0 0 0 28
200 0 21 0 0 9 0 10 0 0 0 0 0 0 0 0 0 40
201 0 13 0 0 2 0 12 0 0 0 0 0 0 0 0 0 27
202 0 0 0 0 0 0 41 0 0 0 0 0 0 0 0 0 41
203 0 0 0 0 0 0 4 0 0 0 0 0 0 0 0 0 4
208 0 0 0 0 0 0 44 0 0 0 0 0 0 0 0 0 44
209 0 0 0 0 0 0 94 0 0 0 0 0 0 0 0 0 94
210 0 0 0 0 0 0 96 0 0 0 0 0 0 0 0 0 96
211 0 0 0 0 0 0 54 0 0 0 0 0 0 0 0 0 54
212 0 0 0 0 0 0 18 0 0 0 0 0 0 0 0 0 18
213 0 0 0 0 0 0 17 0 0 0 0 0 0 0 0 0 17
214 0 17 0 0 0 0 0 0 0 0 0 0 0 0 0 0 17
215 0 41 0 0 0 0 0 0 0 0 0 0 0 0 0 0 41
216 0 8 0 0 0 0 58 0 0 0 0 0 0 0 0 0 66
217 0 0 0 0 0 0 55 0 0 0 0 0 0 0 0 0 55
224 0 0 0 0 0 0 61 0 0 0 0 0 0 0 0 0 61
225 0 0 0 0 0 0 69 0 0 0 0 0 0 0 0 0 69
226 0 0 0 0 0 0 93 0 0 0 0 0 0 0 0 0 93
227 0 0 0 0 0 0 47 0 0 0 0 0 0 0 0 0 47
228 0 0 0 0 0 0 13 0 0 0 0 0 0 0 0 0 13
A p p e n d i x H 1 3 2
229 0 0 0 0 0 0 0 0 0 0 0 0 0 0 0 0 0
230 0 0 4 0 0 0 0 0 0 0 12 0 0 0 0 0 16
231 0 8 5 0 0 0 0 0 0 0 0 0 0 0 0 0 13
232 0 6 0 0 0 0 13 0 0 0 9 0 0 0 4 0 32
233 0 0 0 0 0 0 20 0 0 0 0 0 0 0 7 0 27
240 0 0 0 0 0 0 5 14 0 0 0 0 0 0 0 0 19
241 0 0 0 0 0 0 30 6 0 0 0 0 0 0 0 0 36
242 0 0 0 0 0 0 81 0 0 0 0 0 0 0 0 0 81
243 0 0 0 0 0 3 5 0 0 0 0 0 0 0 0 0 8
244 0 0 0 0 0 8 0 0 0 0 0 0 0 0 0 0 8
245 0 0 0 0 0 0 0 0 0 0 10 0 0 0 0 0 10
246 0 0 0 0 0 0 0 0 0 0 11 0 0 0 26 0 37
247 0 0 5 0 0 0 0 0 0 0 11 0 0 0 13 0 29
248 0 0 0 0 0 0 0 0 0 0 5 0 0 0 1 0 6
249 0 0 0 0 0 0 0 0 0 0 2 0 0 0 13 0 15
259 0 0 0 0 0 13 0 0 0 0 0 0 0 0 0 0 13
260 0 0 0 0 0 34 0 0 0 0 0 0 0 0 0 0 34
261 0 0 0 0 0 0 0 0 0 0 43 0 0 0 0 0 43
262 0 0 0 0 0 0 0 0 0 0 23 0 0 0 16 0 39
263 0 0 0 0 0 0 0 0 0 0 0 0 0 0 17 0 17
264 0 0 0 0 0 0 0 0 0 0 0 0 0 0 4 0 4
275 0 0 0 0 0 9 0 0 0 0 0 0 0 0 0 0 9
276 0 0 0 0 0 9 0 0 0 0 0 0 0 0 0 0 9
277 0 0 0 0 0 10 0 0 0 0 14 0 0 0 0 0 24
278 0 0 0 0 0 0 0 0 0 0 29 0 0 0 0 0 29
292 0 0 0 0 0 0 0 0 0 0 34 0 0 0 0 0 34
A p p e n d i x H 1 3 3
293 0 0 0 0 0 0 0 0 0 0 43 0 0 0 0 0 43
294 0 0 0 0 0 0 0 0 0 0 0 0 0 0 0 0 0
Total 20 536 39 170 169 86 3373 41 221 0 371 12 0 202 101 26 5367
A p p e n d i x I 1 3 4
Appendix I Abridged Records of Status 1 Golden Eagle Fatalities
Fatality Number
Detection Date
Age Sex String
Number Turbine
Label Turbine Bearing
Turbine Distance
BLMT07 052198 Unk Unk 64 1205 160 31
BL31 060998 Immature Unk 63 1190 261 255
BL312 061098 Juvenile Unk 77 1296 303 35
BL318 070298 Juvenile Unk 76 1279 263 288
BL347 092598 Juvenile Unk 68 1222 151 81
BL5057 100899 Adult Female 70 1244 38 62
BL5091 110399 Juvenile Unk 140 6514 118 19
BL5122 112299 Immature Unk 79 1312 247 46
BL4006 061500 Immature Unk 55 1154 96 13
BL4031 081800 Juvenile Unk 65 1207 62 10
BL4037 082600 Juvenile Unk 66 1216 82 12
BL4097 012501 Immature Unk 165 I-10 340 43
BL1005 070301 Unk Unk 85 1343 211 15
BL1041 121801 Adult Unk 63 1190 166 3
BL1214 070802 Unk Unk 148 6316 196 20
BL1242 082602 Unk Unk 121 5285 244 41
BL1244 101502 Unk Unk 363 964 228 16
BL1258 102802 Adult Unk 3121 2965 216 44
BL1288 111302 Unk Unk 306 2719 250 24
BL1301 111902 Unk Unk 329 4325 206 28
BL1303 112002 Unk Unk 331 4418 196 15
BL1439 022703 Adult Unk 244 H4 196 37
BL1444 030503 Juvenile Unk 335 41 194 22
A p p e n d i x I 1 3 5
BL1459 031103 Juvenile Unk 328 4323 222 50
BL1474 031803 Juvenile Unk 408 697 258 12
20051018-02
101805 Juvenile Unk 72 1251 27 46
20051025-09
102505 Juvenile Unk 361 4537 8 25
20051102-07
110205 Undetermined Unk 279 2389 0 0
20051102-12
110205 Juvenile Unk 517 2654 75 36
20060111-03
011106 Juvenile Unk 43 1102 306 6
20060523-02
052306 Unk Unk 517 2657 127 12
20060524-04
052406 Unk Unk 34899 4394 36 36
2336 060606 Unk Unk 282 215 0
20060705-02
070506 Unk Unk 324 4303 41 30
20060710-02
071006 Unk Unk 342 4030 30 10
20060717-01
071706 Unk Unk 363 954 342 24
20060717-10
071706 Unk Unk 403 1414 40 36
20060717-09
071706 Unk Unk 403 1410 326 41
20060718-10
071806 Unk Unk 39799 794 31 53
X06-82 073106 Immature Unk 63 1199 305 45
20060807-04
080706 Adult Unk 6832 2363 8 72
20060907-06
090706 Unk Unk 665 6350 101 65
A p p e n d i x I 1 3 6
20061009-01
100906 Juvenile Unk 342 4001 38 36
20061017-06
101706 Juvenile Unk 39999 3022 20 17
20061018-02
101806 Adult Unk 404 1358 49 13
20061026-14
102606 Unk Unk 85 1343 206 51
20061031-11
103106 Unk Unk 596 1058 19 32
20061215-01
121506 Juvenile Unk 427 331 60 36
2672 022207 Adult Unk 138 1176 350 24
20070228-01
022807 Juvenile Unk 37299 1332 189 4
20070319-05
031907 Adult Unk 70 1243 28 37
20070328-08
032807 Unk Unk 629 1297 15 95
20070405-01
040507 Unk Unk 588 6530 86 14
20070411-07
041107 Adult Unk 145 6342 48 20
2774 041607 Adult Unk 277 207 260 40
20070504-01
050407 Juvenile Unk 305 2675 224 28
2791 051507 Und Unk 517 2659 80 44
2860 052807 Adult Unk 138 1176 330 77
20070613-02
061307 Unk Unk 308 2803 300 79
20070618-05
061807 Juvenile Unk 271 4684 56 23
20070703-05
070307 Und Unk 451 39 41 18
A p p e n d i x I 1 3 7
20070711-11
071107 Juvenile Unk 361 4538 360 22
20070712-03
071207 Unk Unk 629 1288 50 26
20070725-06
072507 Juvenile Unk 654 5194 53 51
20070815-02
081507 Unk Unk 615 1162 162 1
20070821-02
082107 Unk Unk 31299 3649 103 77
20070821-01
082107 Unk Unk 328 4321 237 32
20070828-01
082807 Adult Female 365 1089 0 0
20070829-07
082907 Adult Unk 62 1188 360 28
20070904-01
090407 Unk Unk 116 5159 355 14
C07-238 090407 Adult Unk 1801 AB-8 20 12
20070905-06
090507 Juvenile Unk 361 4540 349 8
20070906-13
090607 Adult Unk 566 6130 42 35
20070911-03
091107 Unk Unk 588 6529 27 22
20070912-01
091207 Adult Unk 505 2516 83 5
20071003-05
100307 Unk Unk 34899 4386 234 91
20071009-20
100907 Unk Unk 146 6368 110 23
20071016-06
101607 Unk Unk 583 6491 43 59
20071016-07
101607 Unk Unk 588 6530 348 14
A p p e n d i x I 1 3 8
20071019-01
101907 Juvenile Unk 361 4538 84 4
20071102-01
110207 Adult Unk 39799 793 42 13
3194 111207 Immature Unk 34899 3625 60 64
20071114-07
111407 Unk Unk 573 6343 324 29
3271 121307 Unk Unk 58099 6450 355 5
20080205-04
020508 Immature Unk 583 6491 212 72
147 021908 Unk Unk 517 2639 45 50
20080311-06
031108 Juvenile Unk 267 4732 344 13
C08-077 032508 Adult Unk 189 GB-7 136 13
20080506-05
050608 Juvenile Unk 38999 3066 346 43
20080702-03
070208 Adult Unk 224 A3001 180 28
20080717-01
071708 Juvenile Unk 67 1224 300 5
20080724-02
072408 Unk Unk 5088 6503 30 50
20080804-03
080408 Juvenile Unk 430 249 95 61
20080903-09
090308 Juvenile Unk 428 239 26 43
20080915-06
091508 Unk Unk 364 953 15 34
20080923-01
092308 Unk Unk 52 1144 161 27
20080923-02
092308 Adult Unk 71 1246 66 44
X08-164 100208 Unk Unk 55 1154 50 35
A p p e n d i x I 1 3 9
20081201-04
120108 Juvenile Unk 156 TV-3 355 8
20081215-04
121508 Juvenile Unk 39799 3074 123 30
20090115-02
011509 Unk Unk 1005 WTG-
12 210 28
20090311-05
031109 Juvenile Unk 34899 4394 54 47
4164 052709 Unk Unk 629 1285 358 14
4301 070609 Unk Unk 342 4005 35 9
20090727-06
072709 Adult Unk 647 5124 84 26
4351 081409 Immature Unk 282 217 4 16
20090929-02
092909 Unk Unk 5085 6473 150 7
X09-082 092909 Unk Unk 69 1234 345 17
20091021-02
102109 Unk Unk 335 37 16 63
20091026-02
102609 Juvenile Unk 271 4687 2 37
20091103-04
110309 Juvenile Unk 582 6477 40 7
20091104-05
110409 Unk Unk 145 6342 212 36
4467 111009 Immature Unk 335 63 100 18
20100607-01
060710 Unk Unk 505 2518 87 24
20100610-02
061010 Juvenile Unk 347 4377 114 59
20100622-02
062210 Juvenile Unk 53 1148 86 64
20100722-01
072210 Juvenile Unk 360 4534 322 66
A p p e n d i x I 1 4 0
20100726-01
072610 Juvenile Unk 345 4220 21 30
X10-066 082410 Immature Unk 69 1227 42 29
4896 092110 Unk Unk 325 4312
20100923-03
092310 Juvenile Unk 342 4021 42 22
20101018-09
101810 Juvenile Unk 356 4524 86 18
20101019-12
101910 Unk Unk 346 4436 6 75
20110110-01
011011 Unk Unk 5110 5410 55 18
5109 031211 Unk Unk 597 4252
20110314-05
031411 Adult Unk 356 4523 35 29
20110526-01
052611 Juvenile Unk 566 6123 78 35
5181 060611 Unk Unk 360 4534
20110725-02
072511 Juvenile Unk 88 V1-11 239 1
20110802-04
080211 Adult Unk 356 4524 62 21
20110824-03
082411 Juvenile Unk 83 1338 168 1
20110913-01
091311 Juvenile Unk 137 1214 98 11
5335 091411 Unk Unk 360 4534
20110831-01
103111 Adult Unk 101 V9-12 109 7
20120419-02
041912 Juvenile Unk 566 6110 360 0
20120425-01
042512 Juvenile Unk 582 6477 338 4
A p p e n d i x I 1 4 1
20120530-03
053012 Juvenile Unk 35199 4460 69 41
20120606-06
060612 Juvenile Unk 50582 4635 55 22
20120716-05
071612 Immature Unk 329 4326 31 17
20121106-03
110612 Unk Unk 335 61 158 3
A p p e n d i x J 1 4 2
Appendix J Additional fields calculated for the turbines table
Field Description Year RDGTP Ridge top turbine Constant SP Settling party turbine Constant SDDL Saddle turbine Constant KILL Turbine has killed a GOEA D98 Number of dead GOEAs 1998 D99 ldquo ldquo 1998 D00 ldquo ldquo 2000 D01 ldquo ldquo 2001 D02 ldquo ldquo 2002 D03 ldquo ldquo 2003 D05 ldquo ldquo 2005 D06 ldquo ldquo 2006 D07 ldquo ldquo 2007 D08 ldquo ldquo 2008 D09 ldquo ldquo 2009 D10 ldquo ldquo 2010 D11 ldquo ldquo 2011 DT Total number of dead GOEAs Total FISHID ID of the turbinersquos fishnet square Constant DIV98 Diversity of trbrsquos fishnet square 1998 DIV99 ldquo ldquo 1999 DIV00 ldquo ldquo 2000 DIV01 ldquo ldquo 2001 DIV02 ldquo ldquo 2002 DIV03 ldquo ldquo 2003 DIV05 ldquo ldquo 2005 DIV06 ldquo ldquo 2006 DIV07 ldquo ldquo 2007 DIV08 ldquo ldquo 2008 DIV09 ldquo ldquo 2009 DIV10 ldquo ldquo 2010 DIV11 ldquo ldquo 2011 DIVKILL Diversity of turbinersquos fishnet id in year GOEA was killed DNS98 Turbine density of fishnet square 1998 DNS99 ldquo ldquo 1999 DNS00 ldquo ldquo 2000 DNS01 ldquo ldquo 2001 DNS02 ldquo ldquo 2002
A p p e n d i x J 1 4 3
DNS03 ldquo ldquo 2003 DNS05 ldquo ldquo 2004 DNS06 ldquo ldquo 2006 DNS07 ldquo ldquo 2007 DNS08 ldquo ldquo 2008 DNS09 ldquo ldquo 2009 DNS10 ldquo ldquo 2010 DNS11 ldquo ldquo 2011 DNSKILL Density of turbinersquos fishnetID in year GOEA was killed NTD98 Nearest turbine distance 1998 NTD99 Nearest turbine distance NTM98 Nearest turbine model 1998 NTM99 ldquo ldquo 1999 NTM00 ldquo ldquo 2000 NTM01 ldquo ldquo 2001 NTM02 ldquo ldquo 2002 NTM03 ldquo ldquo 2003 NTM05 ldquo ldquo 2005 NTM06 ldquo ldquo 2006 NTM07 ldquo ldquo 2007 NTM08 ldquo ldquo 2008 NTM09 ldquo ldquo 2009 NTM10 ldquo ldquo 2010 NTM11 ldquo ldquo 2011 NTMKILL Nearest turbine model in year GOEA was killed NTD98 Distance to nearest turbine 1998 NTD99 ldquo ldquo 1999 NTD00 ldquo ldquo 2000 NTD01 ldquo ldquo 2001 NTD02 ldquo ldquo 2002 NTD03 ldquo ldquo 2003 NTD05 ldquo ldquo 2005 NTD06 ldquo ldquo 2006 NTD07 ldquo ldquo 2007 NTD08 ldquo ldquo 2008 NTD09 ldquo ldquo 2009 NTD10 ldquo ldquo 2010 NTD11 ldquo ldquo 2011 NTDKILL Nearest turbine distance in year GOEA was killed MC98 Yearly monitored count 1998 MC99 ldquo ldquo 1999 MC00 ldquo ldquo 2000
A p p e n d i x J 1 4 4
MC01 ldquo ldquo 2001 MC02 ldquo ldquo 2002 MC03 ldquo ldquo 2003 MC05 ldquo ldquo 2005 MC06 ldquo ldquo 2006 MC07 ldquo ldquo 2007 MC08 ldquo ldquo 2008 MC09 ldquo ldquo 2009 MC10 ldquo ldquo 2010 MC11 ldquo ldquo 2011 MCT Total a turbine was monitored Total SOHi Screen order in the historic array SCHi Historic array screen count SIDHi Historic array screen id ERHi End row historic array ER98 End row status 1998 ER99 ldquo ldquo 1999 ER00 ldquo ldquo 2000 ER01 ldquo ldquo 2001 ER02 ldquo ldquo 2002 ER03 ldquo ldquo 2003 ER05 ldquo ldquo 2005 ER06 ldquo ldquo 2006 ER07 ldquo ldquo 2007 ER08 ldquo ldquo 2008 ER09 ldquo ldquo 2009 ER10 ldquo ldquo 2010 ER11 ldquo ldquo 2011 ERKILL End row status of turbine in year GOEA was killed SC98 Number of turbines in screen 1998 SC99 ldquo ldquo 1999 SC00 ldquo ldquo 2000 SC01 ldquo ldquo 2001 SC02 ldquo ldquo 2002 SC03 ldquo ldquo 2003 SC05 ldquo ldquo 2005 SC06 ldquo ldquo 2006 SC07 ldquo ldquo 2007 SC08 ldquo ldquo 2008 SC09 ldquo ldquo 2009 SC10 ldquo ldquo 2010 SC11 ldquo ldquo 2011 SCKILL Screen count of turbine in year GOEA was killed
A p p e n d i x J 1 4 5
SCID98 Turbine screen identity 1998 SCID99 ldquo ldquo 1999 SCID00 ldquo ldquo 2000 SCID01 ldquo ldquo 2001 SCID02 ldquo ldquo 2002 SCID03 ldquo ldquo 2003 SCID05 ldquo ldquo 2005 SCID06 ldquo ldquo 2006 SCID07 ldquo ldquo 2007 SCID08 ldquo ldquo 2008 SCID09 ldquo ldquo 2009 SCID10 ldquo ldquo 2010 SCID11 ldquo ldquo 2011 PRE98 Presence in the array 1998 PRE99 ldquo ldquo 1999 PRE00 ldquo ldquo 2000 PRE01 ldquo ldquo 2001 PRE02 ldquo ldquo 2002 PRE03 ldquo ldquo 2003 PRE05 ldquo ldquo 2005 PRE06 ldquo ldquo 2006 PRE07 ldquo ldquo 2007 PRE08 ldquo ldquo 2008 PRE09 ldquo ldquo 2009 PRE10 ldquo ldquo 2010 PRE11 ldquo ldquo 2011 MON98 Monitored status 1998 MON99 ldquo ldquo 1999 MON00 ldquo ldquo 2000 MON01 ldquo ldquo 2001 MON02 ldquo ldquo 2002 MON03 ldquo ldquo 2003 MON05 ldquo ldquo 2005 MON06 ldquo ldquo 2006 MON07 ldquo ldquo 2007 MON08 ldquo ldquo 2008 MON09 ldquo ldquo 2009 MON10 ldquo ldquo 2010 MON11 ldquo ldquo 2011
- Application of GIS and Spatial Analysis of Golden Eagle Fatalities Caused by Wind Turbines at the Altamont Pass Wind Resource
-
- Let us know how access to this document benefits you
- Recommended Citation
-
- tmp1373056213pdfklvo6
-