Application of GI-based Procedures for Soil Moisture Mapping and Crop Vegetation Status Monitoring...
24
Application of GI-based Application of GI-based Procedures for Soil Moisture Procedures for Soil Moisture Mapping Mapping and Crop Vegetation Status and Crop Vegetation Status Monitoring in Romania Monitoring in Romania Dr. Adriana MARICA, Dr. Gheorghe STANCALIE, Daniel ALEXANDRU, Argentina NERTAN, Cristian FLUERARU National Meteorological Administration Bucharest, Romania WMO, FAO & COST 718 WORKSHOP ON CLIMATIC ANALYSIS AND MAPPING FOR AGRICULTURE Bologna, 14-17 June 2005
-
Upload
shanna-newton -
Category
Documents
-
view
218 -
download
1
Transcript of Application of GI-based Procedures for Soil Moisture Mapping and Crop Vegetation Status Monitoring...

Application of GI-based Application of GI-based Procedures for Soil Moisture Procedures for Soil Moisture
MappingMappingand Crop Vegetation Status and Crop Vegetation Status
Monitoring in RomaniaMonitoring in Romania
Dr. Adriana MARICA, Dr. Gheorghe STANCALIE, Daniel ALEXANDRU, Argentina NERTAN, Cristian FLUERARU
National Meteorological Administration Bucharest, Romania
WMO, FAO & COST 718 WORKSHOP ON CLIMATIC ANALYSIS AND MAPPING FOR AGRICULTURE
Bologna, 14-17 June 2005

Presentation outline:
1. Introduction: Recent developments in the use of GI-based procedures in Romania;
2. Application of GIS for mapping historical soil moisture data (methodology & results);
3. Examples of derived products obtained by using Arc View applications for improving operational agrometeorological activity;
4. Application of remote sensing data to monitor crop vegetation status;
5. Conclusions.
1. Introduction:1. Introduction:
The agrometeorological activity undergoing within National Meteorological Administration (NMA), integrates complex issues concerning the evolution of the water supply of soils and vegetation state of the crops with respect to the meteorological parameters evolution, being a particularly important activity whose final objective is to elaborate/edit the agrometeorological bulletins;
In our institut there is an intense activity in the developing applications of new methods and technologies to provide additional improved agrometeorological information for decision-makers and other users;
Our recent developments in the use of GI-based procedures summarized in this presentation include:
statistical analysis procedure on historical series of soil moisture data to produce agroclimatic classification in order to promote sustainable land and water management;
NDVI image analysis procedure to monitor current crop vegetation conditions and its variation with time.

Objectives:
to analyze the spatial and temporal evolution of soil moisture over a 30-year period in order to identify the intervals and zones with high risk at the occurrence of extreme climatic events;
to provide information on the long term average of soil moisture, that are very useful for placing current or expected conditions in a historical context.
2. Application of GIS for mapping historical soil moisture data
The application for spatial representation of soil moisture is performed in VBA (Visual Basic for Applications) for Arc View 8.3 and is structured on two components:
a) the data collected and the different information layers that are organized in a database and all the information is integrated in a GIS;
b) spatial representation of soil moisture by using “Kriging” interpolation method.

Input data used:
• Monthly data of measured soil moisture (m3/ha) from 50 agrometeorological stations over the 1970-2000 interval, for:
two soil depths (0-20 cm and 0-100 cm);
three calendar dates specific to the phenological phases of maize crop (April 30, July 31 and August 31);
• Available water capacity -AWC (m3/ha) for different soil types;
• Calculated % of AWC.

Classification of the soil moisture levels:Classification of the soil moisture levels:
% of AWC HUMIDITY CLASSES
0 - 20% Extremly drought
20 - 35% Strongly drought 35 - 50% Moderate drought 50 - 70% Satisfactory supply 70 - 100% Optimal supply >100% Above normal moisture values
% of AWC HUMIDITY CLASSES
0 - 20% Extremly drought
20 - 35% Strongly drought 35 - 50% Moderate drought 50 - 70% Satisfactory supply 70 - 100% Optimal supply >100% Above normal moisture values
To assess long term average of soil moisture:
-the frequency (%) of humidity class was computed
-the prevalent class of soil moisture in different climatic and soil type zones was established
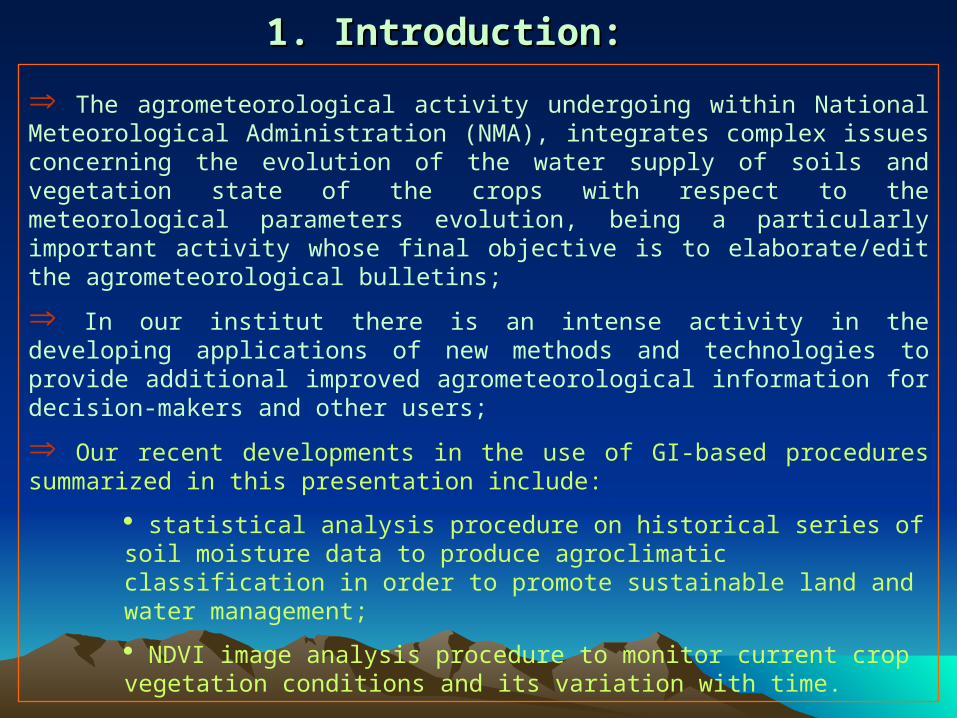
Soil moisture database integration in a GIS
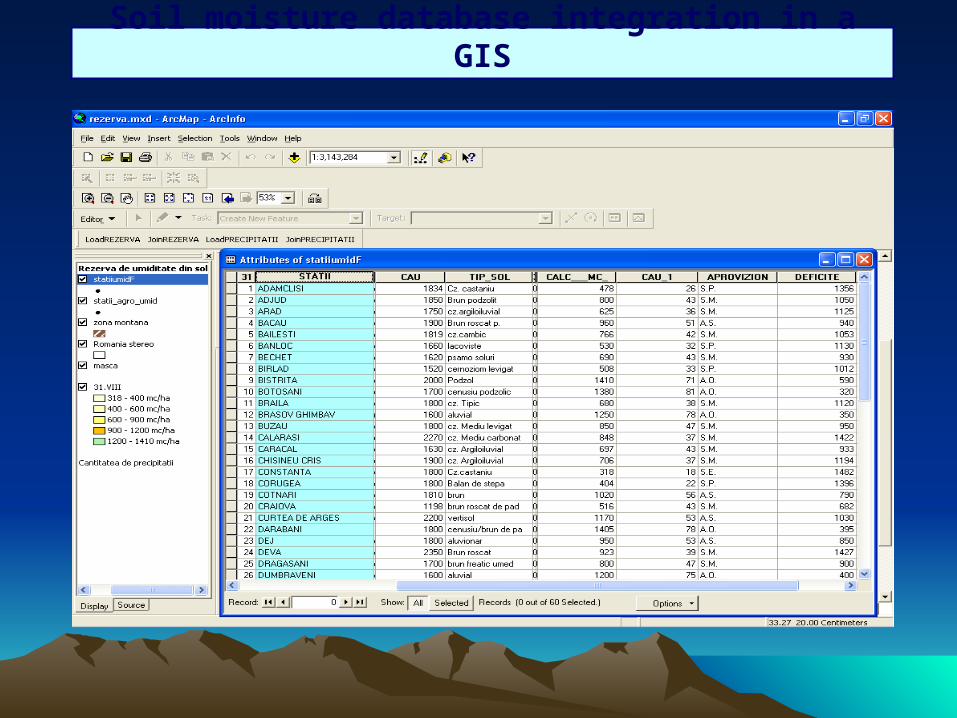
The map with the agrometeorological stations
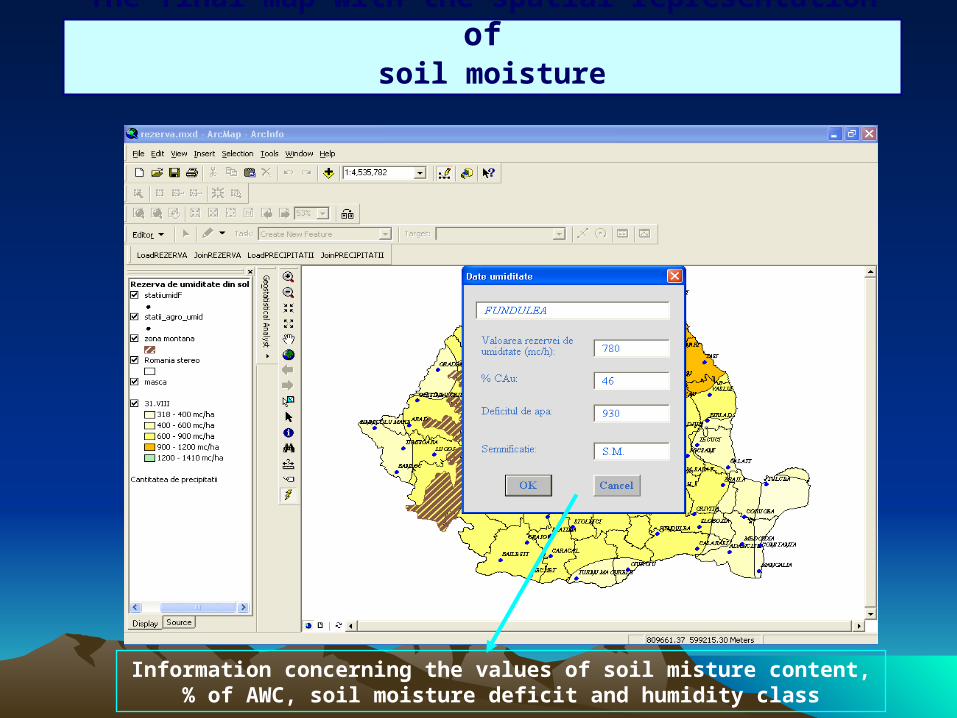
Information concerning the values of soil misture content, %
of AWC, soil moisture deficit and humidity class
The final map with the spatial representation of soil moisture

Average Soil Moisture, 1970-2000, at 30 April
Legend
230 - 300 mc/ha
300 - 400 mc/ha
400 - 471 mc/ha
zona montana
CANCELOK
OS
70
Significance:
86
420
% AWC:
Moisture reserve value (m3/ha):
CURTEA DE ARGES
Water deficit:
Moisture data
Maize available water in 0-20 cm
depth of soil
Satisfactory supply (50-70% of AWC)
Near optimal supply (70-85% of AWC)Optimal supply (85-1oo% of AWC)

Average Soil Moisture, 1970-2000, at 31 July
Legend
445 - 600 mc/ha
600 - 900 mc/ha
900 - 1200 mc/ha
1200 - 1385 mc/ha
zona montana
CANCELOK
MD
885
Significance:
48
825
% AWC:
Moisture reserve value (m3/ha):
FUNDULEA
Water deficit:
Moisture data
Maize available water in 0-100 cm
depth of soil
Stronghly drought (20-35% of AWC)
Moderate drought (35-50% ofAWC)Satisfactory supply (50-70% of AWC)
Near optimal supply (70-85% of AWC)

Average Soil Moisture, 1970-2000, at 31 August
Legend
318 - 400 mc/ha
400 - 600 mc/ha
600 - 900 mc/ha
900 - 1200 mc/ha
1200 - 1410 mc/ha
zona montana
CANCELOK
SD
985
Significance:
32
465
% AWC:
Moisture reserve value (m3/ha):
TECUCI
Water deficit:
Moisture data
Maize available water in 0-100 cm
depth of soil
Extremely drought (0-20% of AWC)Stronghly drought (20-35% of AWC)Moderate drought (35-50% of AWC)Satisfactory supply (50-70% of AWC)Near optimal supply (70-85% of AWC)

Example of yearly soil moisture variabiity, in the period 1970-2000, at CALARASI station
Soil Moisture, 1970-2000, 30 April
0
100
200
300
400
500
600
1970
1973
1976
1979
1982
1985
1988
1991
1994
1997
2000
mc/
ha
Soil moist.Avg. 1970-2000AWC
Soil Moisture, 1970-2000, 31 July
0
500
1000
1500
2000
2500
1970
1973
1976
1979
1982
1985
1988
1991
1994
1997
2000
mc/
ha
Soil moist.Avg. 1970-2000AWC
Soil Moisture, 1970-2000, 31 August
0
500
1000
1500
2000
2500
1970
1973
1976
1979
1982
1985
1988
1991
1994
1997
2000
mc/
ha
Soil Moist.Avg. 1970-2000AWC
Drought years occured in
50-60% of cases (15-18 years)

Weekly Soil Temperature (JPG file)
Weekly Soil Moisture (JPG file)
Monthly precipitation (JPG file)
Tmed>0°C, 1Feb-10April
Weekly precipitation (JPG file)

Applications of NDVI values derived from SPOT-VEGETATION imagery are used to:
follow dynamic of crop vegetation status;• infer crop progress (crop growth and development) and conditions;• analyze the temporal shape of the NDVI;• estimate beginning of growing season, leaf growth, etc. based on temporal profile analysis.
4. Application of remote sensing data to 4. Application of remote sensing data to monitor crop vegetation conditionsmonitor crop vegetation conditions
Key issues for NDVI series data analysis:
• overlay of a mask in order to isolate agricultural lands;• overlay of reference points selection of representative crop-cultivated areas with at least 4 sq.km surfaces (equiv.of 4 pixels) using terrain information or high resolution satellite-derived landcover maps;• accurate localization of the reference points using GPS;• extraction of NDVI values;• analysis & interpretation.

The monitoring of crop vegetation conditions and its variation with time is based on the analysis of the dekadal maps of NDVI;
Begining from the last dekade of March 2005 these maps have been included and analysed in the Agrometeorological Bulletin;
Generally, the winter crops status was better as compared with previous year, especially for the crops sown in optimal time, but a delay in crop development with about 1-2 weeks was observed.

NDVI / Spot-Vegetation / 11-20 March 2005
Exemples of application remote sensing technology for monitoring crop vegetation
status
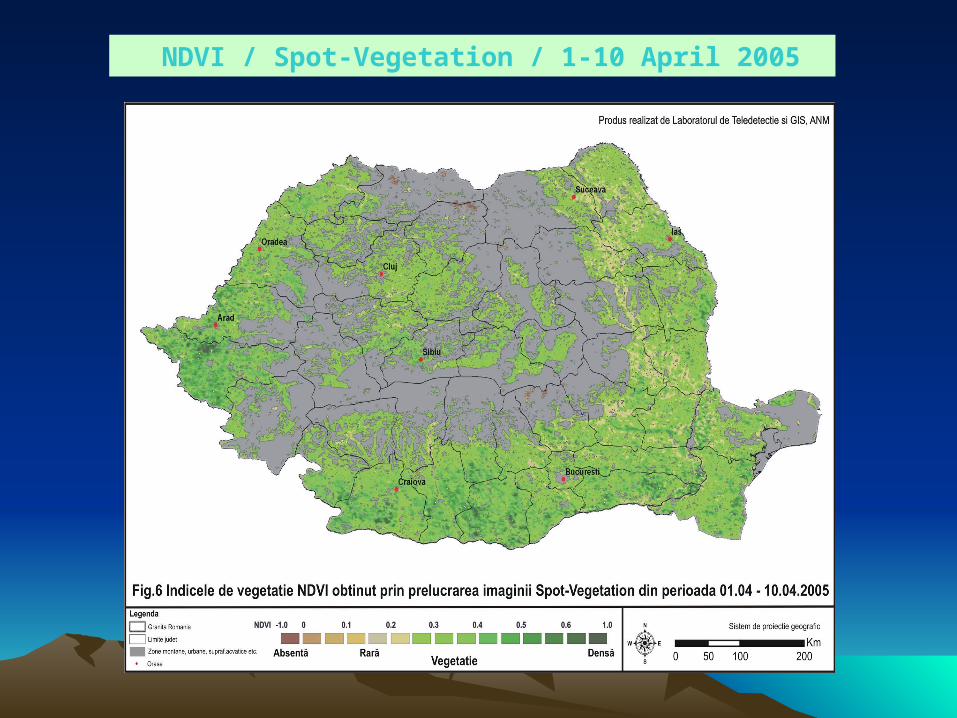
NDVI / Spot-Vegetation / 1-10 April 2005

NDVI / Spot-Vegetation / 11-20 April 2005

NDVI / Spot-Vegetation / 21-30 April 2005
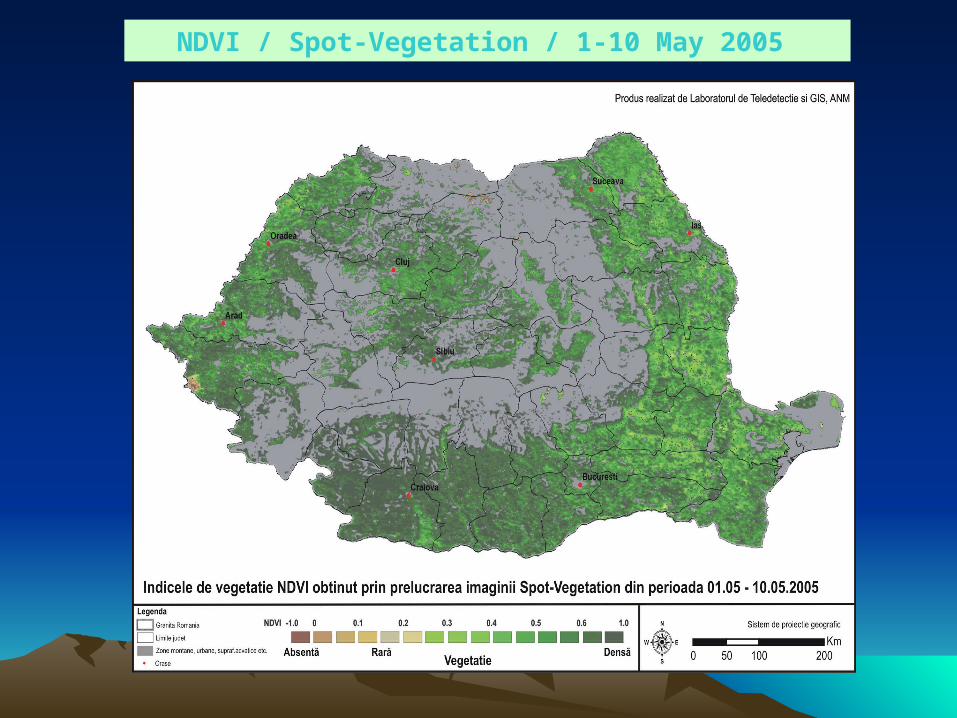
NDVI / Spot-Vegetation / 1-10 May 2005

The examples given in this presentation shown that the The examples given in this presentation shown that the combination of ground-measurements, GIS and satellite combination of ground-measurements, GIS and satellite data gives promising results for the mapping soil moisture data gives promising results for the mapping soil moisture to define agroclimatic potentialities and restrictions, and to define agroclimatic potentialities and restrictions, and for monitoring crop vegetation status;for monitoring crop vegetation status;
The capability of GIS technology is significant, enabling The capability of GIS technology is significant, enabling users to develop accurate and precise maps based on users to develop accurate and precise maps based on quantitative data to be analysed in combination with other quantitative data to be analysed in combination with other sources of data;sources of data;
The continues application of GIS and remote sensing The continues application of GIS and remote sensing technologies to evaluate soil moisture and vegetation state technologies to evaluate soil moisture and vegetation state of the crops will contribute to improving the of the crops will contribute to improving the agrometeorological information in order to provide better agrometeorological information in order to provide better decision support in agricultural management;decision support in agricultural management;
Conclusions:Conclusions:

ConclusionsConclusions
The assessment and near-real time monitoring of the The assessment and near-real time monitoring of the risk agrometeorological factors and their zoning over the risk agrometeorological factors and their zoning over the country’s agricultural territory, during vegetation season country’s agricultural territory, during vegetation season of crops will allow timely identification of the agricultural of crops will allow timely identification of the agricultural areas the most vulnerable and the dissemination of the areas the most vulnerable and the dissemination of the information to the users for taking adequate measures information to the users for taking adequate measures (irrigation, fertilizing, agrotechnics to preserve the water (irrigation, fertilizing, agrotechnics to preserve the water in the soil, etc.); in the soil, etc.);

Thank you