APPLICATION OF FUZZY LOGIC WITH GENETIC … · Application of fuzzy logic with genetic algorithms...
16
ZESZYTY NAUKOWE POLITECHNIKI POZNAŃSKIE J Nr 62 Organizacja i Zarządzanie 2014 Nadia BELU * , Laurenţiu IONESCU * APPLICATION OF FUZZY LOGIC WITH GENETIC ALGORITHMS TO FMEA METHOD Failure Mode and Effect Analysis (FMEA) is one of the well-known techniques of qual- ity management that is used for continuous improvement in product or process design. One important issue of FMEA is the determination of the risk priorities of failure modes. The purpose of this paper is to compare three different methods for prioritizing failure modes in a process FMEA study. These methods are traditional approach, fuzzy logic and Genetic Algorithms using a risk-cost model of FMEA – to estimate the weight of risk factors. According to the findings, the integration of Genetic Algorithms and fuzzy revealed a dif- ference in prioritizing failure modes among the methods. Because these methods eliminate some of the shortcomings of the traditional approach, they are useful tools in identifying the high priority failure modes. They can also provide the stability of process assurance. Key words: FMEA, Fuzzy Logic, Genetic Algorithm, Costs, Risk Priority Number 1. INTRODUCTION In today’s hard economic conditions, companies must ensure quality products de- livered on time at a competitive price. To achieve it companies always appeal to various quality planning methods, at the same time ensuring that their suppliers do this. In practice, there are two main groups of methods of quality planning. The first is a group of preventive methods. Their goal is already at the design stage to pre- vent the occurrence of noncompliance, the consequences of which would be no- ticeable only in the later stages of production, or even exploitation. The second * University of Pitesti, 110040 Pitesti Str. Targul din Vale, nr.1, Arges, Romania.
Transcript of APPLICATION OF FUZZY LOGIC WITH GENETIC … · Application of fuzzy logic with genetic algorithms...

Z E S Z Y T Y N A U K O W E P O L I T E C H N I K I P O Z N A Ń S K I E J
Nr 62 Organizacja i Zarządzanie 2014
Nadia BELU*, Laurenţiu IONESCU
*
APPLICATION OF FUZZY LOGIC WITH GENETIC
ALGORITHMS TO FMEA METHOD
Failure Mode and Effect Analysis (FMEA) is one of the well-known techniques of qual-
ity management that is used for continuous improvement in product or process design. One
important issue of FMEA is the determination of the risk priorities of failure modes. The
purpose of this paper is to compare three different methods for prioritizing failure modes
in a process FMEA study. These methods are traditional approach, fuzzy logic and Genetic
Algorithms using a risk-cost model of FMEA – to estimate the weight of risk factors.
According to the findings, the integration of Genetic Algorithms and fuzzy revealed a dif-
ference in prioritizing failure modes among the methods. Because these methods eliminate
some of the shortcomings of the traditional approach, they are useful tools in identifying
the high priority failure modes. They can also provide the stability of process assurance.
Key words: FMEA, Fuzzy Logic, Genetic Algorithm, Costs, Risk Priority
Number
1. INTRODUCTION
In today’s hard economic conditions, companies must ensure quality products de-
livered on time at a competitive price. To achieve it companies always appeal to
various quality planning methods, at the same time ensuring that their suppliers do
this.
In practice, there are two main groups of methods of quality planning. The first
is a group of preventive methods. Their goal is already at the design stage to pre-
vent the occurrence of noncompliance, the consequences of which would be no-
ticeable only in the later stages of production, or even exploitation. The second
* University of Pitesti, 110040 Pitesti Str. Targul din Vale, nr.1, Arges, Romania.

Nadia Belu, Laurenţiu Ionescu
6
group of methods of quality planning is a method to design the process parameters.
These methods are particularly important for obtaining the best possible technical
and economic effects, while maintaining the desired level of product quality [11].
One of the most important preventive methods is Failure Mode and Effects
Analysis (FMEA). It is a methodology for risk management and quality improve-
ment aimed at identifying potential causes of failure of products and processes,
their quantification by risk assessment, ranking of the problems identified accord-
ing to their importance, and the determination and implementation of related cor-
rective actions.
The traditional FMEA determines the risk priority of each failure mode using
the Risk Priority Numbers (RPN), which can be obtained as a product of three risk
factors, namely Severity (S), Occurrence (O) and Detection (D) [6]. Unfortunately,
the crisp RPN method shows some important limitations when FMEA is applied in
real-world cases. Therefore, a number of approaches have been suggested in the
literature to enhance the FMEA methodology, such as technique for ordering pref-
erence by similarity to ideal solution (TOPSIS) [3], decision making trial and
evaluation laboratory (DEMATEL) [13], grey theory [4, 9], analytic hierarchy
process (AHP) [2], data envelopment analysis (DEA) [5], Monte Carlo [1], fuzzy
logic
[7, 8, 9, 12, 14].
One of most critical aspects of the FMEA methodology, which is greatly con-
tested by the authors, is that this kind of analysis fails to take into consideration
extremely remarkable factors, such as the economic aspect of the failure modes.
In this study, a process FMEA data of a welding process is used. Prioritization
of the failure modes will be estimated by 3 different methods and the results of
these methods will be compared with each other. First method is the traditional
approach, second method is the fuzzy FMEA and the third method is the Genetic
Algorithms (GA) using a risk-cost model of FMEA. We applied the GA in FMEA
analysis to determine the risk of a process so as the total quality cost – and here we
are also talking about the failures costs and the failures prevention and quality ap-
praisal costs – is to be minimal.
2. CLASSICAL APPLICATION OF PROCESS FAILURE MODE
EFFECT ANALYSIS
In the first part of the study a classical application of Process FMEA has been
realized for the welding process. For this process the FMEA team identified
31 failure modes with different potential causes. Risk Priority Numbers (RPNs) of
the failure modes are calculated. The failures with the highest RPN values are pre-
Application of fuzzy logic with genetic algorithms to FMEA method
7
sented (64, 72, 80, and 128). Some of the data can be seen in Table 3. All 31 items
are not given in this table.
3. FUZZY FMEA APPLICATION
The methodology of the fuzzy RPNs is based on fuzzy set theory. In 1965,
Zadeh proposed fuzzy set theory [15], and later established fuzzy logic based on
fuzzy sets. The three inputs Severity (S), Occurrence (O) and Detection (D) are
fuzzified and evaluated in a fuzzy inference engine built on a consistent base of
IF-THEN rules. The fuzzy output is defuzzified to get the crisp value of the RPN
that will be used for a more accurate ranking of the potential risks.
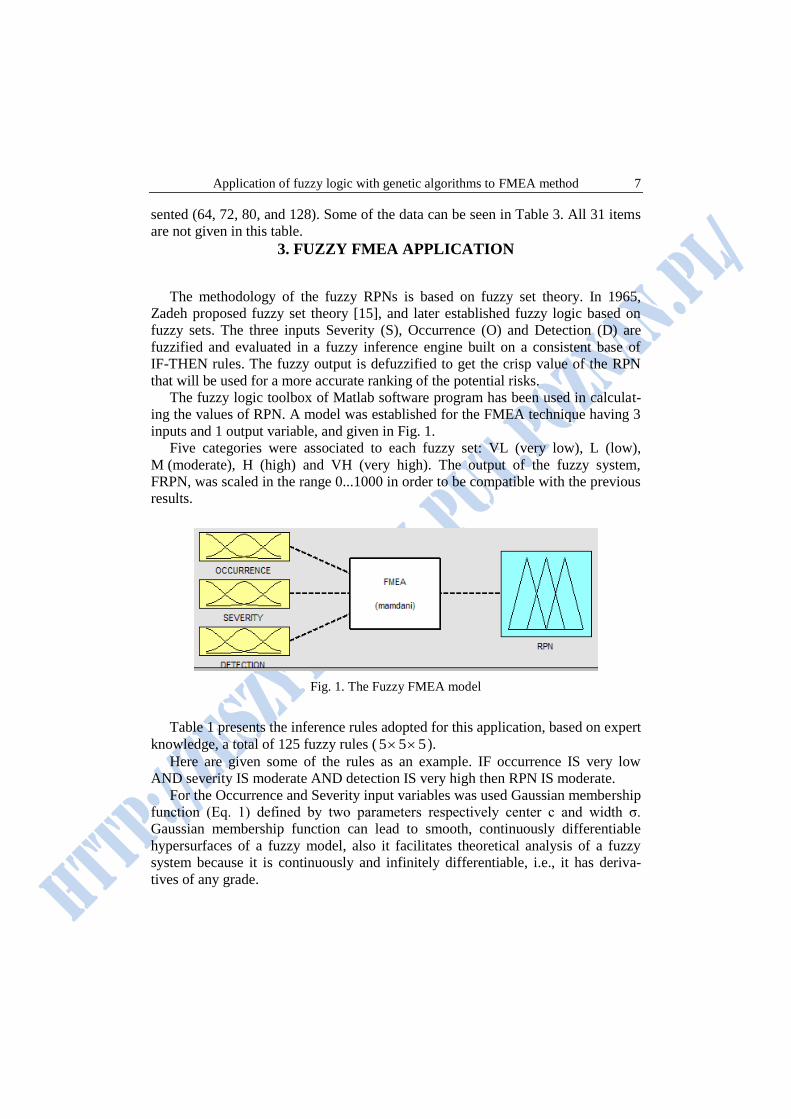
The fuzzy logic toolbox of Matlab software program has been used in calculat-
ing the values of RPN. A model was established for the FMEA technique having 3
inputs and 1 output variable, and given in Fig. 1.
Five categories were associated to each fuzzy set: VL (very low), L (low),
M (moderate), H (high) and VH (very high). The output of the fuzzy system,
FRPN, was scaled in the range 0...1000 in order to be compatible with the previous
results.
Fig. 1. The Fuzzy FMEA model
Table 1 presents the inference rules adopted for this application, based on expert
knowledge, a total of 125 fuzzy rules ( 555 ).
Here are given some of the rules as an example. IF occurrence IS very low
AND severity IS moderate AND detection IS very high then RPN IS moderate.
For the Occurrence and Severity input variables was used Gaussian membership
function (Eq. 1) defined by two parameters respectively center c and width σ.
Gaussian membership function can lead to smooth, continuously differentiable
hypersurfaces of a fuzzy model, also it facilitates theoretical analysis of a fuzzy
system because it is continuously and infinitely differentiable, i.e., it has deriva-
tives of any grade.

Nadia Belu, Laurenţiu Ionescu
8
2
2
1exp
cxxA (1)
bA
a
cx
x2
1
1
(2)
For the Detection input variable was used Cauchy membership function (gener-
alized bell) (Eq. 2) with the three parameters a, b, c.
Table 1. Inference rules
Occurrence: VL
Severity FUZZY RPN
VL L M H VH
VL VL VL VL VL L
L VL VL VL L L
M VL VL L L M
H VL L L M M
Detection
VH L L M M H
Occurrence: L
Severity FUZZY RPN
VL L M H VH
VL VL VL VL L L
L VL VL L L M
M VL L L M M
H L L M M H
Detection
VH L M M H H
Occurrence: M
Severity FUZZY RPN
VL L M H VH
VL VL VL L L M
L VL L L M M
M L L M M H
H L M M H H
Detection
VH M M H H VH
Occurrence: H
Severity FUZZY RPN
VL L M H VH
VL VL L L M M
L L L M M H
M L M M H H
H M M H H VH
Detection
VH M H H VH VH
Probabilitate apariţie: VH
Severity FUZZY RPN
VL L M H VH
VL L L M M H
L L M M H H
M M M H H VH
H M H H VH VH
Detection
VH H H VH VH VH
Mamdani min/max method of inference mechanism (input method: min; aggre-
gate method: max) was used and the results were defuzzified by center of gravity
method. There are different algorithms for defuzzification as well. These are Cen-
ter of Gravity, Center of Gravity for Singletons, Center of Area, Left Most Maxi-
mum, and Right Most Maximum.

Application of fuzzy logic with genetic algorithms to FMEA method
9
Among these algorithms the most popular one is the center of gravity (centroid)
technique. It finds the point where a vertical line would slice the aggregate set into
two equal masses.
As to the types of failure, the fuzzy RPN values provided in the model are given
in Table 3 in comparison with the RPN values of classical FMEA and FMEA based
on Genetic Algorithms.
4. FMEA COST MODEL BY GENETIC ALGORITHM
Genetic algorithms (GA) can be used to search for solutions difficult to obtain
by other conventional methods, in different areas. They can be run on a computer
or can be accelerated on parallel hardware structures [10]. One of the cases when
the genetic algorithms are suitable is the optimization problem – finding the opti-
mal solutions. Finding the optimum is a very difficult issue, especially when many
different criteria are needed to be considered: that’s the situation when we’re talk-
ing of a multi-criteria analysis for systems.
In this case, we are faced with such a problem. On one side, we have the prob-
lem of risk analysis that a production process involves from the perspective of the
failures that can occur. On the other side, the costs issue must be considered thus
an economic analysis is needed. Finding the optimum is crucial, meaning finding
a solution with a risk degree accepted by the client but also viable, economically
speaking.
In the proposed model we suppose that failures which will not cause deaths or
human injuries are considered in terms of economic evaluation. These kinds of
causes (for example with a value of Severity of 9 or 10) must be eliminated in any
case, regardless of any economical consideration. The multi-criteria analysis starts
only when the failures severity is less than 8. This kind of failures goes in the class
where a cost-risk analysis is required and the search of an optimum is made. The
problem of finding an optimum is basically the finding of a risk level that is ac-
cepted by the client where the failure, prevention and evaluation costs added to-
gether, so the total cost, is minimal.
4.1. Costs of quality
Cost of quality is a measurement used for assessing the waste or loss from a de-
fined process. These costs are significant and can be significantly reduced or
avoided. Most cost of quality measurements utilize 4 categories of costs:
Internal failure costs iC are associated with internal losses before the product
is supplied to the client, are defined by the relation:
Nadia Belu, Laurenţiu Ionescu
10
didai CPPnC )1( (3)
External failure costs eC occur outside of the process being analyzed. These
costs are usually discovered by or affect third parties such as clients, are given by
the relation:
imgCCPPnC dedae (4)
where n is the items produced per batch, aP the probability of a failure occurring,
dP the probability of the failure not to be detected, diC the internal cost per fail-
ure, deC the external cost per failure and imgC cost of the firm image (loss of
reputation).
Preventive costs are associated with the prevention of future losses due to poor
quality, such as unplanned problems, lost opportunities and waste.
Assessment or appraisal costs are those associated with measurement and as-
sessment of a process. These are usually designed to find quality problems before
the product or service is delivered to the client or to improve the quality of the
product.
perspersequipequipappprev cncnC (5)
where equipn is the number of equipment used in the production process to prevent
the failures, for inspections, equipc is the cost of the equipment, persn is the number
of persons engaged in the prevention of failures (for training) and persc is the cost
assigned per person.
4.2. Coding scheme used
The proposed solution in this paper, does not exclude at all the classic FMEA
approach. That is because the traditional FMEA reports are still commonly used.
That is why we are still using the traditional FMEA parameters S, O and D and the
expression of risk assessment is still the classic one.
Instead, the genetic algorithm is the one that after having established values in
the acceptable interval for the three parameters, for each failure mode, is assessing
the risk by reporting it to the failures costs and also the failures prevention and
quality evaluation costs.

Application of fuzzy logic with genetic algorithms to FMEA method
11
By using the presented costs formulas, we are getting different risk assessments
reported to the cost. So, we are not changing the risk formula or the parameters
frame from the FMEA traditional model but we are using the genetic algorithms to
find the optimal solutions for the FMEA parameters so as the total cost of quality
which includes the failures costs and the failures prevention and quality evaluation
costs is minimal. Something like this would not be possible with the deterministic
methods because they do not establish a risk-cost report.
The primary use of the algorithm is to determine the risk of a manufacturing
process so as the total quality cost – and here we are also talking about the failures
costs and the failures prevention and quality evaluation costs – is minimal.
The gene is coding the tiniest unit in the solution. It is always a number. If
a chromosome is revealed by the FMEA parameters for a single failure mode, the
gene is one of those factors. The structure of a specimen is presented in Fig. 2.
Fig. 2. Encoding the problem risk-cost analysis with genetic algorithms
As we can see, the specimen is the FMEA analysis. Each chromosome is coding
a failure mode. The gene represents a single FMEA parameter. The solution that
we are looking for, the one that has been codified inside the individual, is called in
specific terminology Phenotype (alongside the other possible solutions) while his
“genetic code” is called Genotype.
4.3. Parameters of genetic algorithm in the risk model
After encoding the problem the next step is the parameterization of the algo-
rithm to resolve our problem. The genetic algorithm has a set of parameters that
must be established by such a planner as well as the encoding scheme.

Nadia Belu, Laurenţiu Ionescu
12
Setting the parameters is the second major step that must be followed while
working with the genetic algorithms. The parameters of the genetic algorithm that
we have used in the cost-risk model are given in Table 2.
Table 2. Parameters of genetic algorithm used in the risk-cost model
Parameter Value
Number of individuals/generation 10
Maximum number of generations 500
Method of selection (for interbreeding) roulette wheel
Number of pairs at interbreeding/generation (rate of
interbreeding)
1
Number of points of interbreeding 1
Selection method at mutation random
Mutation rate 0.3
Assessment function cost minimization
Selection method of the replaced individual elitist (the weakest is replaced)
4.4. Running the genetic algorithm
After establishing the parameters of the genetic algorithm running the algorithm
is taking place using the cost based assessment for an optimum risk analysis. In the
diagram from the Fig. 3 are shown the steps for running the algorithm.
In the first place, it all starts from the established failure modes for a certain
manufacturing process. These failure modes are automatically retrieved from
a database composed by the experts.
This means that anytime the process changes, the database is updated and the
algorithm will run to obtain the FMEA analysis for the new process. So our solu-
tion is not dependent on a certain process or certain failure mode. In database each
failure mode has assigned intervals allowed for S and D. During evolution
algorithm (search solution) are obtained S and D and are determined the internal
and the external costs on the market as well as the prevention costs (for each failure
mode). In this moment is taking place the establishment of the number of chromo-
somes of an individual.
After this preliminary stage, the launching of the genetic algorithm throws the
initialization of the generation 0, the first population of individuals. The initializa-
tion is random, for each gene, but respecting the demanded range. After the
achievement of the first generation (generation 0) the evolutionary loop is starting.
In the first place, the evaluation of that population is taking place (in our case it is

Application of fuzzy logic with genetic algorithms to FMEA method
13
the generation 0). The evaluation represents calculating the failure and prevention
and appraisal costs and comparing them. The fitness is obtained by decreasing in
the module these two costs. After this assessment, we have a fitness vector, which
has on each position the fitness value for each individual.
Get fault modes
Set individual dimension:
number of fault modes
represent number of
chromosomes
Generation 0:
Randomly
generated
individuals
Evaluation using
cost model
Sort ascending
Selection of
parents using
roulette method
Apply crossover
operator: result an
offspring
Generate a
random number
which set the
mutation rate
Fitness <
Tolerable
error?
Mutation?
Random selection
of individual and
gene for mutation
Found the optimal
solution !
Complete the
maxim number of
generation?
Local optima
obtained
yes
yes
no
yes
no
Replace worst
individual with
offspring
no
Fig. 3. Diagram of the genetic algorithm to determine the FMEA based on the risk-cost
analysis
In the testing stage, we also check if the evolution process is over, through con-
vergence to the searched optimum solution, if one of the individuals has its fitness

Nadia Belu, Laurenţiu Ionescu
14
value under the limit of the maximum permissible error (in this case +/–50) or
through convergence to a local optimum when the number of generations has been
run is bigger than the maximum allowed. Through the second case, we have a solu-
tion that is the best, so far, but is not the optimum. If this matter is not convenient,
the evolution process can restart once again, the generation 0 will have other values
than the generation 0 from the previous process.
If the evolutionary loop is not over (the optimum has not been found and maxi-
mum allowed number of generations has not been reached), the classification of the
individuals is taking place after the fitness vector. Sorting is necessary for the next
stage, namely the selection. Through the selection the two parents will be chosen
for the crossover operator.
The crossover is carried out through random selection of the crossover point.
The resulting offspring will be from this moment the eleventh individual of the
population (which initially had 10 individuals).
The next genetic operator, the mutation, is enabled for the current generation
randomly, according to the rate of mutation – as we showed it is not necessarily
a mutation of the generation. If the mutation is occurring, then an individual and
one of his genes is chosen randomly which will suffer the mutation. The mutation
represents the changing of the gene condition randomly but respecting the valid
interval of values. After the mutation, there are still eleven individuals; the muta-
tion is an operator that is changing the condition of an individual, it does not lead
to a new individual. After this last genetic operator has been applied, the resulting
offspring (the eleventh individual) will replace the randomly weakest one resulting
from the assessment. So at the end we have a population with 10 individuals.
Another specific element of the run algorithm for our problem is the fact that
we’ll have the same number of individuals and it won’t change during the evolu-
tion process (just like the generation 0).
The evolution process is restarted from the assessment and it is running until the
end of the evolution, as shown.
4.5. The achieved results
Alongside the temporarily displayed results – some of them very hard to under-
stand – as well as the final report during the evolution, the program allows saving
into a file the information that must be investigated.
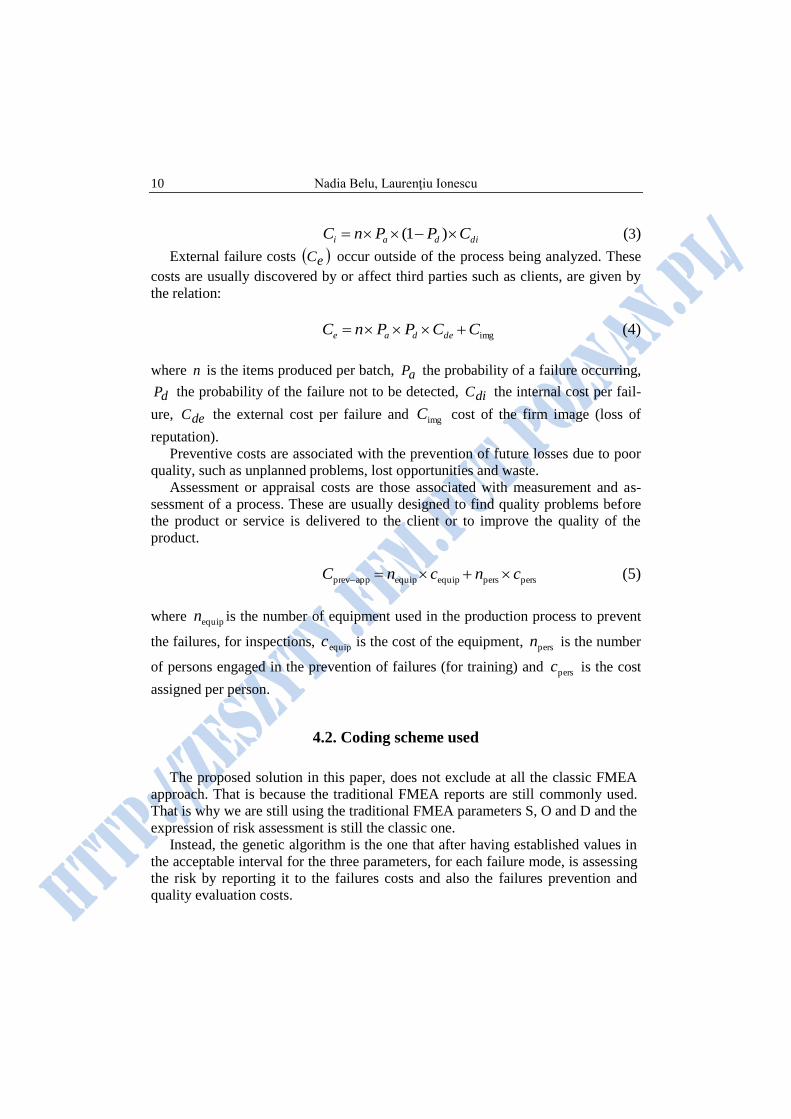
The Risk Priority Number (RPN) has been monitored during the evolution. Its
evolution for a process with 7 failure modes is presented in Fig. 4.
It can be seen that it’s spreading to a big scale of values at the beginning, but
after that, as the algorithm converges we can see that the scale is getting smaller.
The calculations have been done on a RPN of an individual with the arithmetic
average of the RPN for each failure mode.
Application of fuzzy logic with genetic algorithms to FMEA method
15
It can be observed the evolution of the individual 8 (purple). It started from
a medium RPN of below 118 and as the evolution continues (more specifically in
the first 15 generations) we have a constant value. After that, the value increases to
129. Finally, all individuals converge to a RPN value around 99.
Fig. 4. The evolution of RPN – analysis of process with 7 failure modes, convergence
at the generation 33
This is explained by the fact that evolution trains all individuals to an accept-
able risk-cost ratio.
At generation 33, individual 8 has been selected which represents the cost report
that is most optimum but also with the tiniest risk of all of the populations. This is
a perfect situation when the risk and the cost are both very low.
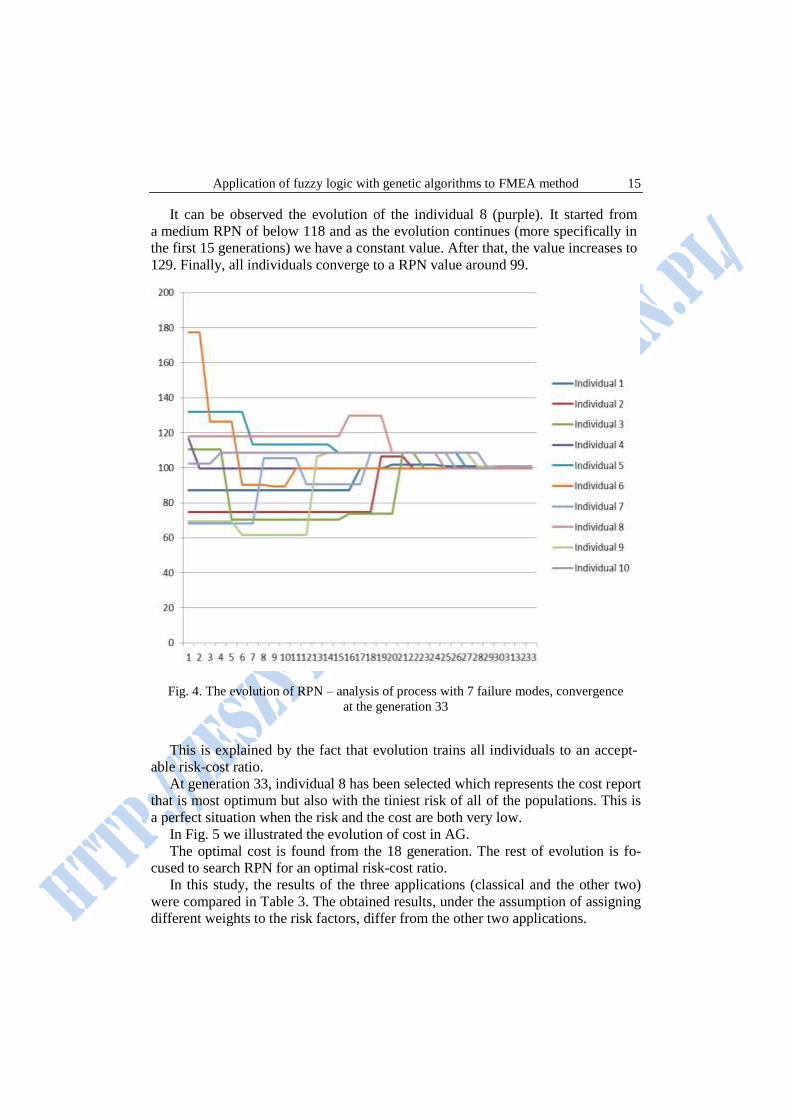
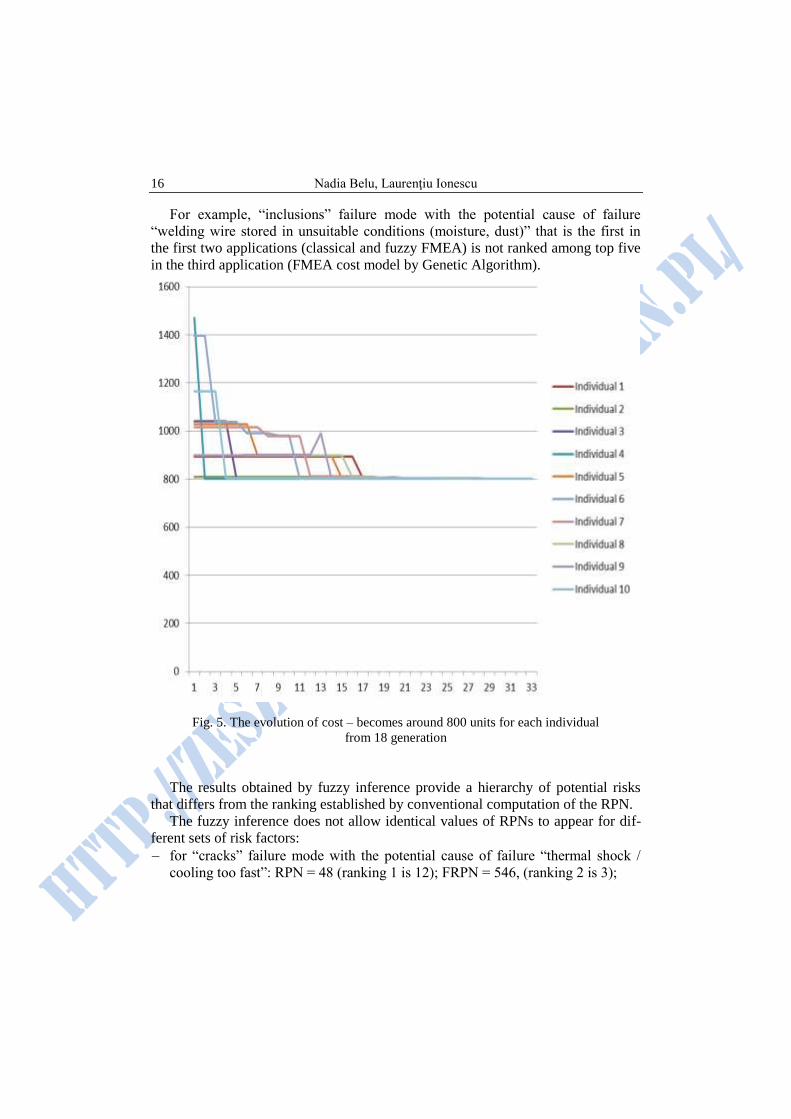
In Fig. 5 we illustrated the evolution of cost in AG. The optimal cost is found from the 18 generation. The rest of evolution is fo-
cused to search RPN for an optimal risk-cost ratio.
In this study, the results of the three applications (classical and the other two)
were compared in Table 3. The obtained results, under the assumption of assigning
different weights to the risk factors, differ from the other two applications.
Nadia Belu, Laurenţiu Ionescu
16
For example, “inclusions” failure mode with the potential cause of failure
“welding wire stored in unsuitable conditions (moisture, dust)” that is the first in
the first two applications (classical and fuzzy FMEA) is not ranked among top five
in the third application (FMEA cost model by Genetic Algorithm).
Fig. 5. The evolution of cost – becomes around 800 units for each individual
from 18 generation
The results obtained by fuzzy inference provide a hierarchy of potential risks
that differs from the ranking established by conventional computation of the RPN.
The fuzzy inference does not allow identical values of RPNs to appear for dif-
ferent sets of risk factors:
for “cracks” failure mode with the potential cause of failure “thermal shock /
cooling too fast”: RPN = 48 (ranking 1 is 12); FRPN = 546, (ranking 2 is 3);

Application of fuzzy logic with genetic algorithms to FMEA method
17
for “insufficient penetration” failure mode with the potential cause of failure
“Improper welding parameters”: RPN = 48 (ranking 1 is 14); FRPN = 513,
(ranking 2 is 15).
Another example is that “insufficient penetration” failure mode with the poten-
tial cause of failure “oxidized parts” is placed first in the last application, whereas
it was ranking 14–15 in the first two applications.

Nadia Belu, Laurenţiu Ionescu
18
5. CONCLUSIONS
FMEA, as a very important safety and reliability analysis tool, has been exten-
sively used for examining potential failures in products, processes, designs and
services.
Compared with the traditional RPN, the fuzzy FMEA proposed has advantages,
for example:
more risk factors can be included if necessary;
the relative importance weights of risk factors are taken into consideration in the
process of prioritization of failure modes, which makes the proposed FMEA
more realistic, more practical and more flexible;
risk factors and their relative importance weights are evaluated in a linguistic
manner rather than in precise numerical values.
The traditional FMEA analysis does not include a financial evaluation of the
failure mode. A risk-cost model offers the management opportunity to determine
the financial risk of failure modes and to weigh the failure costs with the expenses
needed for improvements. Using a model based on costs in FMEA analysis is ob-
taining a viable alternative with a lower degree of subjectivity in the process of risk
assessment.
The genetic algorithms method is given a higher risk coefficient than the one
given by the traditional method. That is because with this cost model, the economic
aspect of the process is also considered. We also have to consider that the genetic
algorithms method is at a global scale for the whole process. Although we have a
higher risk coefficient for a failure mode, on a global scale we have a decrease of
risk and cost.
The proposed solution offers an alternative with low cost to commercial solu-
tions and provides benefits in terms of cost and time allocated for FMEA analysis.
LITERATURE
[1] Arunraj N.S., Mandal S., Maiti J., Modeling uncertainty in risk assessment: An inte-
grated approach with fuzzy set theory and Monte Carlo simulation, Accident Analysis
& Prevention, 2013, 55, s. 242-255.
[2] Braglia M., MAFMA: Multi-attribute failure mode analysis, International Journal of
Quality & Reliability Management, 2000, 17 (9), s. 1017-1033.
[3] Braglia M., Frosolini M., Montanari, R., Fuzzy TOPSIS approach for failure mode,
effects and criticality analysis, Quality and Reliability Engineering International,
2003, 19 (5), s. 425-443.
[4] Chang C.L., Liu P.H., Wei C.C., Failure mode and effects analysis using grey theory,
Integrated Manufacturing Systems, 2001, 12 (3), s. 211-216.
Application of fuzzy logic with genetic algorithms to FMEA method
19
[5] Chin K.S., Wang Y.M., Poon G.K.K., Yang J.B., Failure mode and effects analysis by
data envelopment analysis, Decision Support Systems, 2009, 48 (1), s. 246-256.
[6] Chrysler Corporation, Ford Motor Company, General Motors Corporation, Potential
Failure Modes and Effects Analysis (FMEA). Reference Manual, 4th ed., 2008.
[7] Guimaraes A.C.F, Lapa C.M.F., Fuzzy inference to risk assessment on nuclear engi-
neering systems, Applied Soft Computing, 2007, 7, s. 17-28.
[8] Lertworasirikul S., Fang S.-C., Joines J.A., Nuttle H.L., Fuzzy data envelopment
analysis (DEA): A possibility approach, Fuzzy Sets and Systems, 2003, 139,
s. 379-394.
[9] Liu H.C., Liu L., Bian Q.H., Lin Q.L., Dong N., Xu P.C., Failure mode and effects
analysis using fuzzy evidential reasoning approach and grey theory, Expert Systems
with Applications, 2011, 38, s. 4403-4415.
[10] Mazare A., Ionescu L., Serban G., Barbu V., Evolvable Hardware with Boolean Func-
tions Network Implementation, w: Proceeding of International Conference on Applied
Electronics, IEEE Catalog Number CFP1169A-PRT, Pilsen, September 2011, s. 255-
-260.
[11] Misztal A., Quality planning in various sectors companies, w: Book of Proceedings of
International May Conference on Strategic Management, University of Belgrad, Bor,
Serbia, 2013, s. 778-786.
[12] Rachieru N., Belu N., Anghel D.C., Improvement of Process Failure Mode and Effects
Analysis using Fuzzy Logic, Applied Mechanics and Materials, 2013, 371,
s. 822-826.
[13] Seyed-Hosseini S.M., Safaei N., Asgharpour M.J., Reprioritization of failures in
a system failure mode and effects analysis by decision making trial and evaluation labo-
ratory technique, Reliability Engineering & System Safety, 2006, 91 (8), s. 872-881.
[14] Tay K.M., Lim C.P., Application of fuzzy inference techniques to FMEA, Advances
in Intelligent and Soft Computing, 2006, 34, s. 161-171.
[15] Zadeh L.A., Fuzzy sets, Information and Control, 1965, 8 (3), s. 338-353.
ZASTOSOWANIE LOGIKI ROZMYTEJ
Z ALGORYTMAMI GENETYCZNYMI DO METODY FMEA
Streszczenie
Analiza przyczyn i skutków wad (FMEA) należy do dobrze znanych technik zarządza-
nia jakością; jest wykorzystywana do ciągłego doskonalenia projektów, produktów lub
procesów. Jedną z ważnych kwestii FMEA jest ustalanie priorytetów ryzyka niezgodności.
Celem niniejszej pracy jest porównanie trzech metod ustalania poziomu ryzyka niezgodno-
ści: podejścia tradycyjnego, logiki rozmytej i algorytmów genetycznych na potrzeby anali-
zy FMEA. Integracja algorytmów genetycznych i logiki rozmytej ujawniła różnicę w usta-
laniu znaczenia przyczyn niezgodności. Ponieważ metody te eliminują niektóre wady po-
dejścia tradycyjnego, są użytecznymi narzędziami w identyfikacji przyczyn niezgodności
o wysokim ryzyku. Mogą również zapewniać stabilność procesu.

Nadia Belu, Laurenţiu Ionescu
20