Improved Process Performance Using Accenture's Performance ...
Integrated Technologies for Improved Plant Performance and Availability: Application of
First Principles and Empirical Modeling Technologies
Mr. Michael Fox Supervisor, Data Utilization
FirstEnergy Corp. IDEA Center
Mr. Douglas Eakle Performance/CBM Engineer
FirstEnergy Corp. Harrison Power Station
Mr. Ron Griebenow
Director, Energy Services GP Strategies Corporation
ABSTRACT FirstEnergy Corp. has recently selected and installed first principles thermodynamic models and empirical, advanced-pattern recognition-based models to monitor and predict the capacity, efficiency and condition of the units, systems and equipment in its 16-unit/7-site fleet of coal-fired supercritical power plants. This single software platform will be used at both the plants and at the new Information Diagnostic Evaluation and Analysis (IDEA) Center to continually improve the reliability, availability and efficiency of these power stations.
First principles power plant thermodynamic models are developed for verifying plant design, establishing performance benchmarks, and evaluating current operating data and, in many cases, conducting performance tests. These models are then used to determine the cost of off-design operation, identify load-limiting factors, and quantify the effects of degradation of key plant equipment. Empirical models, based on historical operating plant data, are effective at identifying abnormal operating conditions, equipment degradation, and faulty instrument indications thereby providing information for condition-based maintenance. Models based on Advanced Pattern Recognition (APR) tend to be less susceptible to instrument errors and are particularly effective at identifying equipment problems well before a catastrophic upset.
FirstEnergy has been using independent systems that incorporate most of the capabilities for years. Enhancement and integration of these technologies allows access to the raw data and calculated results in a single platform, substantially expanding their capability for advanced equipment diagnostics and accurate, actionable information. FirstEnergy is also leveraging these systems and key operations, engineering and maintenance expertise through the establishment of centralized monitoring and diagnostic center, the IDEA Center, located in Akron, Ohio, and piloting the same system at one of its nuclear plants through an internal Synergy Initiative.
This presentation will provide an overview of the technologies utilized and present several case studies identifying the problems and issues identified by the system and FirstEnergy diagnostic team(s) and quantifying the benefits to FirstEnergy.

2
BACKGROUND In the increasingly competitive electric power generation market, it is critical that all generation resources be utilized in the most cost-effective manner. In particular, it is essential that the operation and maintenance costs of steam-power cycles be minimized while maintaining peak availability, reliability, efficiency and environmental compliance. Advanced control technologies and complex monitoring systems are becoming more frequently used to support these optimization efforts. However, these systems can also tend to overload the plant operator with data, rather than supplying the critical information needed to make important operating decisions.
From the operational standpoint, fuel is the single largest component of generation cost, often comprising between 50 and 80 percent of the total. As such, a one percent reduction in fuel consumption will result in a significant decrease in operating cost. FirstEnergy Corp. (FirstEnergy) has been utilizing thermodynamic modeling software and on-line performance monitoring calculations since the 1980s in an effort to identify equipment performance degradation and minimize inefficiencies in operation. While these technologies have continued to evolve over the years, effective application required substantial time and expertise. In addition, the on-line systems were highly dependent on instrumentation that was often inaccurate. It was stated in a recent performance improvement conference hosted by the Electric Power Research Institute (EPRI) that the majority of performance degradation alerts were caused, often incorrectly, by erroneous instrument readings.
From the maintenance standpoint, it is critical that the diminishing pool of highly skilled technicians and mechanics be focused on tasks that contribute to reliable and efficient operation of the generating facility. If maintenance effort is spent responding to inaccurate indications of equipment condition and instrument problems, then the time spent on optimizing the generation process is reduced.
Allegheny Energy (now FirstEnergy) recognized the need for improved data quality in their on-line monitoring systems and began using advanced data validation methods based on Advanced Pattern Recognition (APR) in the late 1990s. Application of advanced data validation methods can help reduce operation and maintenance costs in a number ways. First, using advanced data validation to pre-process the plant data that is used by performance monitoring, combustion optimization and control systems will provide these systems with accurate and reliable information, increasing confidence in the calculated results and operational recommendations. Second, advanced data validation can accurately identify instruments requiring calibration. Calibration efforts can be then focused on only those instruments that need attention, reducing total hours required for instrument maintenance. Third, advanced data validation can differentiate between changes in equipment performance and instrument faults, reducing maintenance “false alarms” and saving maintenance hours.
The same APR core technology was later applied to equipment health monitoring through changes in the scope and focus of the APR models. This is done by characterizing the process or system through the patterns of numerical data that are monitored for that system and then comparing those patterns to current operating data. Conceptually, this technology mimics a human's ability to observe a system and then make judgments based on past experience. FirstEnergy’s equipment health monitoring has helped minimize the time spent reviewing data

3
for equipment that is performing properly and focused attention on those items that are deviating from normal operation.
Historically, performance and condition monitoring at FirstEnergy included multiple, independent systems, each requiring maintenance, training and application expertise. While there was some overlap in the information provided by each system, diagnosis of a specific problem often required the subject matter expert (SME) to switch back and forth between the systems to collect all of the information required.
GP Strategies Corporation has provided on-line performance monitoring systems to the electric power industry since the early 1990s. Over the past six years, GP Strategies has acquired and/or developed expertise in APR technology and rotational dynamics that have been integrated into a single software platform, EtaPROTM. Recognizing the additional value that could be obtained through integration of these on-line systems, FirstEnergy first piloted and then expanded installation of the GP Strategies’ system throughout their fossil fleet. In addition, FirstEnergy has established a centralized monitoring and diagnostic center, the Information Diagnostic Evaluation and Analysis (IDEA) Center, to support plant personnel in their monitoring and diagnostic efforts. IDEA Center personnel have been trained in model development and maintenance and will take the lead role in updating/tuning plants models as changes occur within their facilities (e.g., following major outages).
The following sections of this paper provide more detail on the EtaPRO system and several case studies that demonstrate the benefits that FirstEnergy has received from their EtaPRO systems.

4
THE SYSTEM The EtaPRO system includes standard performance calculations based on ASME Performance Test Codes (PTC), first principles thermodynamic modelling (VirtualPlantTM), APR-based anomaly detection (EtaPRO APRTM), and machinery diagnostics (EtaPRO PredictorTM) all on a single platform. The EtaPRO Client is used by end users of all levels including operators, engineers, managers, and supervisors to view plant data and calculated results in any number of customizable displays. An example fossil cycle overview is provided below.
Figure 1 - EtaPRO Cycle Overview Display
VirtualPlant is a core EtaPRO technology that enables first principles modelling of power cycles for accurate prediction of thermodynamic and hydraulic performance of gas turbine-based combined-cycle, conventional fossil and nuclear power plants. Models built with VirtualPlant are rigorous, first principle-based engineering models of the power plant cycle where energy and mass are conserved in each component. VirtualPlant contains a large library of plant components such as steam generators (fossil boiler, HRSG, nuclear steam supply), steam and gas turbines, condensers, feedwater heaters, cooling towers, air-cooled condensers and pumps. In addition, there are numerous components such as valves, mixers, splitters, sinks, and heat sources for controlling mass and energy flows in the cycle. VirtualPlant models can be run on-line to calculate expected values and validate instrumentation or off-line to perform “what-if” analyses (e.g., determine capacity and heat rate impacts of removing a feedwater heater from service). An example VirtualPlant model is provided below.

5
Figure 2 – VirtualPlant Sample Display
EtaPRO APR creates a mathematical model based on historical data patterns and generates high-quality estimates of all measurement values associated with the system under investigation. These “estimated” values act as predictions of how the system should be behaving based on past experience. The estimated values are then compared with the actual measured values associated with the system. As any signal deviates from its normal pattern, in excess of a user-defined amount and duration, the model will alert plant staff to this anomaly. These alerts notify the analyst when a component or signal should be investigated for degradation. Properly set up, this system results in “health by exception” in that the analyst responds only to those components and signals that deviate from normal behavior and cause alerts. An example APR display is included below.

6
Figure 3 – Sample EtaPRO APR Trend Display
EtaPRO Predictor, currently being integrated into the EtaPRO platform, is a hardware and software platform for automated machine fault identification and diagnosis. It compares actual vibration spectra with machine-specific reference signatures to identify fault symptoms, and provides advanced warning of impending machine failure – including specific component fault diagnosis and predicted time to required action – as indicated in the figure below.
Figure 4 - EtaPRO Cycle Overview Display
Expected Value
Measured Value
Alarm Range
Difference between expected and measured
Alert

7
While the EtaPRO system includes multiple technologies, each of which could provide alerts to various plant personnel, all alerts (or “Concerns”) can be managed through a single EtaPRO display, the Concerns Viewer. Concerns will be activated based on user-defined deviations from expected values. These expected values can be determined by an APR model, a VirtualPlant model, an EtaPRO Predictor diagnosis, a user-defined EtaPRO calculation, a curve fit, or a fixed value. Each of these can provide key advantages in different plant areas or for different monitoring objectives. For example, a feedwater heater drain cooler approach temperature (DCA) should remain fairly constant over the operating load range of a unit. Monitoring this parameter through a detailed APR model would work, but comparing the plant-calculated value to a fixed value would likely provide comparable results with significantly less time required for model development and maintenance. An example Concerns Viewer display is shown below.
Figure 5 – Sample EtaPRO Concerns Viewer
The red “ticks” indicate a measured value is exceeding the upper alarm at a specific time in the user-selectable time range and a blue “ticks” indicate that the measured value is exceeding the lower alarm point. As noted, users can easily change the displayed time range. In addition, the user can readily change the information they want displayed (the columns) and the order of the display columns by simply dragging them to the location desired. Notes can be recorded as the alarms are reviewed and the alarm status is changed (i.e., acknowledged) and trend plots for multiple measurements can be displayed in a common grouping for equipment degradation analysis, as shown below.

8
Figure 6 – Example Concerns Viewer Trend Plots
In addition, any alerts/concerns can be automatically distributed by EtaPRO, along with user-defined reports and Excel spreadsheets, via email or text.
9
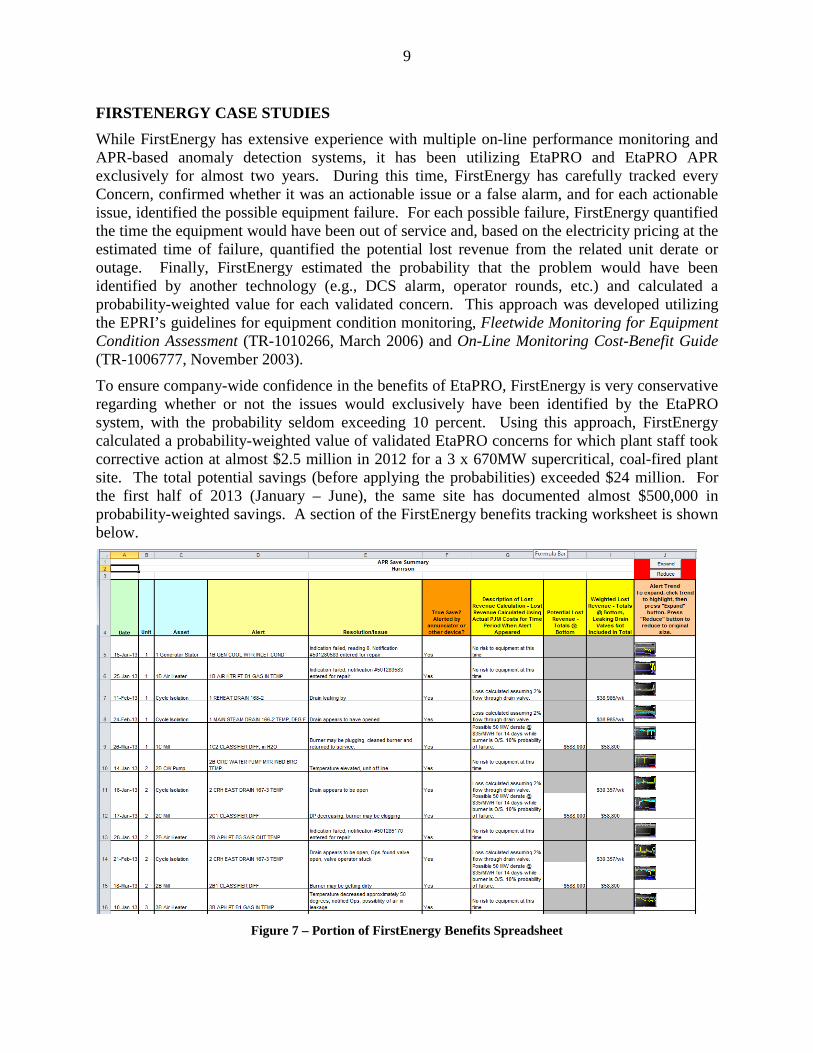
FIRSTENERGY CASE STUDIES While FirstEnergy has extensive experience with multiple on-line performance monitoring and APR-based anomaly detection systems, it has been utilizing EtaPRO and EtaPRO APR exclusively for almost two years. During this time, FirstEnergy has carefully tracked every Concern, confirmed whether it was an actionable issue or a false alarm, and for each actionable issue, identified the possible equipment failure. For each possible failure, FirstEnergy quantified the time the equipment would have been out of service and, based on the electricity pricing at the estimated time of failure, quantified the potential lost revenue from the related unit derate or outage. Finally, FirstEnergy estimated the probability that the problem would have been identified by another technology (e.g., DCS alarm, operator rounds, etc.) and calculated a probability-weighted value for each validated concern. This approach was developed utilizing the EPRI’s guidelines for equipment condition monitoring, Fleetwide Monitoring for Equipment Condition Assessment (TR-1010266, March 2006) and On-Line Monitoring Cost-Benefit Guide (TR-1006777, November 2003).
To ensure company-wide confidence in the benefits of EtaPRO, FirstEnergy is very conservative regarding whether or not the issues would exclusively have been identified by the EtaPRO system, with the probability seldom exceeding 10 percent. Using this approach, FirstEnergy calculated a probability-weighted value of validated EtaPRO concerns for which plant staff took corrective action at almost $2.5 million in 2012 for a 3 x 670MW supercritical, coal-fired plant site. The total potential savings (before applying the probabilities) exceeded $24 million. For the first half of 2013 (January – June), the same site has documented almost $500,000 in probability-weighted savings. A section of the FirstEnergy benefits tracking worksheet is shown below.
Figure 7 – Portion of FirstEnergy Benefits Spreadsheet

10
Additional details on a few of the more recent items are included in the following case studies.
Feedwater Heater Isolation/Bypass
On May 23, 2013, EtaPRO alerted plant staff to a high feedwater heater level on Harrison Unit 2, heater 24B, indicating that the heater was “flooded”, as shown in Figure 8, below.
Figure 8 – 24B Feedwater Heater Level
Inspection by plant staff identified that the heater level pots were "bumped" during teardown of scaffolding in the area. This caused the heater to isolate and the feedwater heater bypass valves to open, bypassing the feedwater heater and reducing plant efficiency and capacity. However, no annunciator alarm regarding the feedwater heater isolation was received in control room. This concern was validated as an equipment issue, and the heater was put back into service.
Isolation of this feedwater heater would cause a unit derate of 5 MW. It was estimated that the heater would likely have remained isolated for one week before it would have been identified though another system or by an operator making routine rounds. The value of the lost generation was calculated to be $29,400.
Figure 9, on the following page, shows that the actual value returned to normal after the heater was returned to service, just over 12 hours after the initial alert.

11
Figure 9 – 24B Feedwater Heater Level with Return to Service
Forced Draft (FD) Fan IB Bearing
On April 11, 2013, the Unit 3 B-side forced draft (FD) fan inboard bearing temperature increased measurably on a Concern that was already being monitored (note that the temperature is already in alert prior to a plant shutdown in Figure 10 – FD Fan Inboard Bearing Temperature (following page), but it is only 6 or 7 degrees higher than expected). It should be noted that the unit was off-line where there is no predicted value or difference displayed (to the right of middle in Figure 10). The EtaPRO system automatically turns off its performance and condition monitoring calculations under user-defined conditions, such as when the unit generation is below minimum sustainable load.
The temperature still was not extremely high, but it was running at 150 degrees F, which was about 25 degrees higher than normal. The DCS alarm point for this bearing temperature is 180 degrees F, well above the operating temperature at the time. Harrison Station has had issues with roof leaks in this FD Fan room and it was thought that this bearing may have been sucking in rain water (it is under vacuum) and reducing the effectiveness of the oil. While this issue was not at a level that immediate removal from service and repair was justified, a maintenance request was written up for changing the oil (including an oil analysis) and inspecting the bearing at the next available opportunity.
During the week of July 2, the unit had to be taken off-line for a tube leak, and remained off-line for approximately one week, as can be seen in the EtaPRO trend plot, including both the bearing temperature (yellow) and unit generation (cyan) included in Figure 11, (following page). This plot, the bearing temperature cooling close to ambient temperature (~80 degrees) shortly after the unit is brought off-line, and heating up as the unit is brought back into operation, as also could be seen during the April outage in Figure 10.

12
Figure 10 – FD Fan Inboard Bearing Temperature
Figure 11 – FD Fan Inboard Bearing Temperature and Gross Power Output
During this outage, plant staff performed an oil change on this bearing, and babbit material was discovered in the oil that was removed from the bearing. The bearing was rolled out for

13
inspection and some minor damage was confirmed (though less than expected). Harrison personnel were able to scrape the bearing, blue it, and return it to service.
During the inspection, the mechanics noticed that the oil sight glass on the bearing was still indicating oil in the bearing, even though the bearing had been drained. They found the oil sight glass connection to the bearing housing plugged with dirt and sludge such that it still indicated a level even though there was no oil in the bearing. While the bearing was not running dry, it was no doubt low on oil which caused the slightly elevated bearing temperature. Had EtaPRO not alerted plant personnel to this elevated bearing temperature, the low oil level would not have been noticed until the temperature hit DCS alarm levels, which would have dramatically increased the damage and increased the time and cost for repair.
Following the repair, the actual bearing temperature dropped about 15 degrees F (
Figure 12), but not all the way down to previously “normal” levels (i.e., inside the alarm bands). Plant staff has continued to monitor this bearing temperature and has seen no further change in the operating temperature. The model has been scheduled for tuning, which can be done by either adding data patterns with this new operating temperature or by simply adding a small bias to the estimated temperature.

14
Figure 12 – FD Fan Inboard Bearing Temperature
Loss of the FD fan during normal operation would have resulted in a unit derate of 300MW and repair would have taken at least 48 hours. This would have resulted in lost revenue of approximately $504,000. Applying a very conservative 10 percent probability, FirstEnergy recognized a probability-weighted savings of $50,400. This does not included the likely increased costs for the actual repair, had the bearing been run to a DCS alarm level or possibly to failure.
Gland Steam Temperature Alerts
Harrison Station had been having issues with control of gland steam temperature for some time. Control of these temperatures is important because high gland steam temperatures often lead to vibration issues on the low-pressure (LP) turbine, which could require load reductions or cause turbine/seal damage. Unfortunately, the gland steam temperature is not under automatic control. It currently requires an operator to manually adjust valve positions to control the gland steam supply temperature (typically 440-460 degrees F) and the gland steam temperature feeding the LP turbine seals (typically 210-220 degrees F). A diagram of this system is included below.

15
Figure 13 – Gland Steam Seal System
Proper adjustment of these temperature control valves can often be missed, particularly after a plant start-up. They are scheduled to be added to the DCS for automatic control, but plant personnel wanted to make sure these temperatures were more closely watched in the meantime. Unfortunately, these temperatures were not included in any of the existing performance and condition monitoring models.
This was easily done by simply adding the tags to an existing EtaPRO APR model. The tags were added to the Unit 3 LP Steam turbine model on April 2, 2013. Immediately after adding the tags, the system will automatically pull tag data consistent with the time stamped data already in the model for other points (as far back as late 2005, in this case). The new tag data added should be then reviewed by the analyst to make sure it is all consistent with “normal” operation. More on that shortly.

16
Figure 14 – EtaPRO APR Models and Revision Tracking
Plant personnel very quickly received the benefits of adding these points, as they were alerted to high gland-steam temperature to the LP turbine on June 3, 2013, as shown in Figure 15 on the following page. The plant performance engineer arrived at the site around 6 a.m., reviewed the concerns viewer, and alerted operations staff to the issue. As can be seen in Figure 15, corrective action was taken and the temperature dropped to (below?) normal levels by 7 a.m.
However, the astute reader will note that, after the correction was made, the estimated values remained slightly higher than the measured value after the repair, and actually jumped up higher than the measured value for a brief period during the temperature excursion. This indicates that there is likely some bad data in the historical data set used to build the model.

17
Figure 15 – Gland Steam Temperature to LP Turbine
As was previously noted, high gland steam temperatures can often lead to vibration issues on the LP turbine. While the vibration response lags the gland steam temperature increase by several hours, this relationship can be clearly seen in the trend plot below (Figure 16).
Figure 16 – Gland Steam Temperature and Bearing Vibration Trends

18
While the bearing vibrations did increase significantly, they did not hit alarm levels in the control room or the condition monitoring system, as shown in the figure below.
Figure 17 – Number 8 Bearing Vibration
It was determined that continued operation in this state would have caused a unit derate of 50 MW to address LP turbine vibration, and it would likely have required about one week to determine the root cause through other data analysis. The lost revenue impact would have been $294,000. Applying a 10 percent probability of this issue not being found by another system(s) resulted in a probability weighted benefit of $29,400.
As can be seen below, the “noisy” estimated value was often running slightly (~5 degrees) higher than the actual gland steam temperature to the LP turbine before the excursion and continued to run that way for almost a month after the temperature was corrected. However, during periods that the “noise” reduced in the estimated value, it was very close to the measured value, bringing the measure value back to within the defined alarm limits. As noted previously, this often indicates the presence of bad or abnormal operating data in the model. The model was tuned during the early July outage, and the “noise” and deviation are clearly eliminated (the right end of the plot in Figure 18).

19
Figure 18 – Long-term Gland Steam Temperature Trend
The data problem that was found in the model is represented in Figure 19.
Figure 19 – EtaPRO APR Asset Data View
The lower plot in the Asset Data View (Figure 19), shows the gland steam temperature to LP turbine temperature (y-axis) versus the gross power output or unit load (x-axis). The data circled

20
in red represents operation with the gland steam desuperheater not being operated properly (i.e., operating with high gland steam temperature). The upper plot presents the gland steam temperature to LP turbine temperature (y-axis) versus time. Although it is difficult to read at the figure resolution, the dates for which this data was recorded run from late 2006 through the fall of 2007, with a few spaces of no data and lower temperatures in the spring of 2007. While this data should not have been included in the model, since it represents abnormal or suboptimal operation, the high temperatures shown for such a long period of time does further emphasize that the gland steam temperature control has been a long-term problem and needed closer monitoring.
Again, this point was added in April to an existing model designed to monitor the condition of the LP turbine. When the points were added, the EtaPRO APR system interrogated the plant historian for point values for these tags that were consistent with time stamps for those data points that made up the model prior to these point being added(17 tags in the initial model). Fortunately, EtaPRO APR’s localized modelling and Harrison staff diligence still identified and corrected a problem that could have been very costly. The tuning that occurred in July required removal of these high temperature values, which can be done graphically with about four mouse clicks.
Removal of these points eliminates all of the data patterns with these 2006 time stamps, but subsequent model testing confirmed that sufficient data was retained for the gland steam system and the other tags included in the LP turbine performance model to ensure effective modelling. Had that not been the case, additional data could have been easily added.
Cycle Isolation
On July 7, 2012, the Harrison Station condition monitoring system alerted plant personnel to a high drain line temperature on Unit 3 following a start-up, Figure 20.

21
Figure 20 – Unit 3 Reheat Inlet Drain Temperature
Maintenance personnel were dispatched and found a failed drain isolation valve. A work order was written up for replacement of the valve during the next unit outage. The unit went into a short outage late on July 13, and the valve was replaced. Immediately following the unit start-upon July 18, the drain temperature quickly went into alarm again (Figure 21). Inspection revealed that air was blowing through the solenoid and providing insufficient pressure to close the valve. The solenoid was quickly replaced and the valve went shut.
Figure 21 – Unit 3 Reheat Inlet Drain Temperature
Steam flow through a drain valve reduces steam flow through the steam turbine and increased heat duty on the condenser. A full thermodynamic model is required to quantify the capacity and heat rate impact of this cycle isolation loss. Off-line “what-if” analysis utilizing VirtualPlant allows plant personnel to run sensitivity studies varying the valve leakage flow and calculating the resulting capacity and heat rate. Based on the temperature, valve size and drain piping size and length, FirstEnergy estimated that two percent of the reheat steam flow was being dumped to the condenser. This resulted in increased generating costs of $38,985 per week.
Air Heater Support Bearing
On July 7, 2012, the Harrison Station condition monitoring system alerted plant personnel to a high air-heater support bearing temperature on Unit 2. While the temperature was only about 12 degrees F above the expected value, plant personnel were dispatched to check the oil level and a normal level was indicated in the site glass. The Concern status was changed to “monitor” and the Performance and Condition Monitoring Engineer continued to monitor the temperature. The bearing temperature remained slightly elevated, even dropping slightly, for

22
three days. On July 10, the bearing temperature increased another 10 degrees F, fairly quickly. Plant staff checked the oil level again and found it to be within the normal range in the site glass. Although the bearing temperature was still below the DCS alarm limits, the Performance and Condition Monitoring Engineer asked maintenance staff to add some oil to the bearing reservoir. The bearing temperature dropped almost immediately. Ultimately, two gallons of oil was added to the reservoir and the bearing temperature dropped to a level slightly below the expected value. This entire progression is represented in Figure 22, on the following page.
Figure 22 – Unit 2 A Air Heater Support Bearing Temperature
Failure of the air heater support bearing would have resulted in a unit trip and loss of all generation. Repair and replacement would have required at least 72 hours. The resulting loss in revenue at summer power pricing would have exceeded $4 million. FirstEnergy believes that this issue could likely have been identified by other systems, possibly even a control room alarm before complete failure of the bearing. However, substantial damage to the bearing would have likely occurred, particularly with the unresponsive oil level indication. FirstEnergy applied a 10 percent probability to the cost impact of the bearing failure and quantified the benefit of this corrective action at $436,440.

23
CONCLUSION FirstEnergy has had extensive experience with multiple on-line performance monitoring and APR-based anomaly detection systems, and each of them has provided substantial return on investment. However, the single, integrated platform provided by GP Strategies has resulted in increased visibility of issues through the availability of both performance data and equipment condition anomalies on a single platform and the unlimited distribution rights of the EtaPRO client software to FirstEnergy personnel. Based on the probability-weighted savings, the system licensing and implementation costs were recovered in less than four months.
Given the success throughout its fossil fleet, FirstEnergy embarked on a pilot installation of the EtaPRO APR condition monitoring software in their nuclear operations (FENOC) in late 2012. The pilot project at the Perry Nuclear Station identified several issues within a three-month period, monitoring only 15 major pieces of equipment, and convinced FENOC that the system would provide similar return on investment in their nuclear stations. FENOC has begun expanding the condition monitoring models for the Perry Station using in-house resources and will be licensing the EtaPRO APR technology for its entire nuclear fleet (four units at three sites). FENOC also will consider implementation of the EtaPRO thermal performance toolset.