
Application of enterprise risk management models during ...
123
Application of enterprise risk management models during new business development PE Heyneke Mini-dissertation in partial fulfilment of the requirements for the degree Master of Business Administration at the Potchefstroom campus of the North-West University Supervisor: Prof. JG Kotze November, 2010
Transcript of Application of enterprise risk management models during ...

Application of enterprise risk management models during
new business development
PE Heyneke
Mini-dissertation in partial fulfilment of the requirements for the degree Master of Business Administration
at the Potchefstroom campus of the North-West University
Supervisor: Prof. JG Kotze
November, 2010

i | P a g e
ABSTRACT
Enterprise is often described as risk for reward, but it may be possible to reduce
the risk while improving returns. According to SEDA, failure rates of SMMEs in
South Africa range from 70 to 80 percent. The need for this study arose when it
was found that most SMMEs did not have a formal system in place to mitigate their
risks right from the outset in the feasibility study, the business plan design and the
start-up of the business. This lack of mitigation controls could be a result of a lack
of understanding of the enterprise risk management (ERM) methodology or an
inappropriate ERM decision-making model to assist them in a way that would
mitigate their risk and minimise financial losses.
The ERM approach can anticipate unplanned occurrences and is a systematic way
of foreseeing the future. Entrepreneurs and business owners take on risks to
pursue new business objectives within their respective risk appetites. This study
also evaluated several models of risk identification and the ERM methodology. In
this study an ERM model, ISO 31000, was applied in a business case and a
comparison was made between the risks identified in the business plan and the
ERM approach.

ii | P a g e
ACKNOWLEDGEMENTS
Firstly, I would like to thank the Lord for giving me the opportunity and strength to
work through challenges while studying for my MBA. It has been tough but He
never left my side during the rough times.
Secondly, I would like to express my sincere gratitude to the following people for
their constructive input:
� My Mom and Dad, for being part of my life and raising me through tough
times. It is such a pity they cannot share this specific milestone with me.
� My family and special friends for their support.
� My study group members: without them I wouldn't have made it this far.
� All my friends and colleagues, with special thanks for their interest and
support.
� Professor Jan Kotze for his personal commitment and professional
guidance.
� Lastly, a special thanks to Sasol for the bursary funding.

iii | P a g e
TABLE OF CONTENTS
ABSTRACT ............................................................................................................. i
ACKNOWLEDGEMENTS ...................................................................................... ii
LIST OF FIGURES .............................................................................................. viii
LIST OF TABLES .................................................................................................. ix
CHAPTER 1 ........................................................................................................... 1
NATURE AND SCOPE OF THE STUDY ............................................................... 1
1.1 INTRODUCTION........................................................................................... 1
1.2 PROBLEM STATEMENT ............................................................................. 2
1.2.1 Enterprise risk management.................................................................................... 3
1.2.2 Business incubators ................................................................................................. 6
1.3 RESEARCH OBJECTIVES .......................................................................... 8
1.3.1 Primary objective .................................................................................................... 8
1.3.2 Secondary objectives ............................................................................................... 8
1.4 RESEARCH METHODOLOGY..................................................................... 8
1.4.1 Selection of a researchable topic ............................................................................. 9
1.4.2 Formal formulation ................................................................................................. 9
1.4.3 Planning ................................................................................................................ 10
1.4.4 Implementation .................................................................................................... 10
1.4.5 Interpretation and presentation ............................................................................ 10
1.5 LIMITATIONS OF THE STUDY .................................................................. 10
1.5 CHAPTER DIVISION .................................................................................. 11

iv | P a g e
CHAPTER 2 ......................................................................................................... 13
ENTERPRISE RISK MANAGEMENT .................................................................. 13
2.1 INTRODUCTION......................................................................................... 13
2.2 DEFINITIONS OF CONCEPTS .................................................................. 13
2.2.1 Defining risk .......................................................................................................... 13
2.2.2 Enterprise risk management defined ..................................................................... 15
2.2.3 New business development ................................................................................... 18
2.3 HISTORY OF RISK MANAGEMENT .......................................................... 22
2.3.1 Enterprise development in South Africa ................................................................ 23
2.3.2.1 Business support and incubators in South Africa ................................................... 24
2.4 BUSINESS DEVELOPMENT - A SOUTH AFRICAN PERSPECTIVE ....... 28
2.4.1 Trends in business creation and business failure ................................................... 28
2.4.2 Why do businesses fail? ........................................................................................ 31
2.4.3 Business plan development vs. risk management .................................................. 33
2.5 ENTERPRISE RISK MODELS ................................................................... 34
2.5.1 The King Ill Report (King Report on Governance) ................................................... 34
2.5.1.1 Corporate governance and lessons learned from financial crises ........................... 34
2.5.1.2 Risk management and the financial crisis .............................................................. 35
2.5.1.3 Was there a risk failure? ........................................................................................ 35
2.5.1.4 What can we learn from the financial crisis? ......................................................... 36
2.6 BENEFITS OF IMPLEMENTING ERM ....................................................... 37
2.6.1 Why SMMEs should value risk management as important ..................................... 37
2.6.2 Benefits of implementing enterprise risk management ......................................... 38
2.7 CONCLUSION ............................................................................................ 39

v | P a g e
CHAPTER 3 ......................................................................................................... 40
THE DERIVED ERM PROCESS METHODOLOGY ............................................. 40
3.1 INTRODUCTION......................................................................................... 40
3.2 THE ERM METHOD ................................................................................... 40
3.3 OBJECTIVE OF ERM ................................................................................. 42
3.4 ESSENTIAL STEPS FOR PERFORMING A RISK ASSESMENT ............. 44
3.4.1 Drivers of risk management .................................................................................. 44
3.4.1.1 Financial Risk ............................................................................................................ 45
3.4.1.2 Operational Risk ........................................................................................................ 46
3.4.2 Framework ............................................................................................................ 50
3.5 RISK MANAGEMENT PROCESS .............................................................. 51
3.5.1 Assign responsibilities, mandate and commitment ................................................ 51
3.5.2 Determining the business objective ....................................................................... 53
3.5.3 Risk Identification .................................................................................................. 56
3.5.4 Risk analyses and assessment ................................................................................ 57
3.5.5 Evaluation of risk ................................................................................................... 59
3.5.6 Risk treatment ...................................................................................................... 60
3.5.7 Risk measurement, monitoring and registers ........................................................ 61
CHAPTER 4 ......................................................................................................... 64
THE ENTERPRISE RISK MANAGEMENT PROCESS APPLIED IN A BUSINESS
CASE STUDY ....................................................................................................... 64
4.1 INTRODUCTION......................................................................................... 64
4.2 RUBNIC OIL (PTY) Ltd: COMPANY BACKGROUND INFORMATION ... 64
4.2.1 Business description of Rubnic Oil ......................................................................... 64
4.2.2 Business risks as mentioned in Rubnic Oil’s business plan ...................................... 66

vi | P a g e
4.3 ISO 31000, THE RECOMMENDED ENTERPRISE RISK MANAGEMENT
MODEL ................................................................................................................. 67
4.3.1 The risk management framework design ............................................................... 67
4.4 RUBNIC OIL ENTERPRISE RISK MANAGEMENT ANALYSIS ................ 71
4.4.1 Step 1: Assign responsibilities, mandate and commitment .................................... 71
4.4.1.1 Establishing the risk appetite of the business directors .......................................... 73
4.4.2 Step 2: Determining the business objective .......................................................... 74
4.4.2.1 External context .................................................................................................... 74
4.4.2.2 Internal context ..................................................................................................... 74
4.4.3 Step 3: Risk assessment ......................................................................................... 76
4.4.3.1 External Environment Risks applicable to Rubnic Oil .............................................. 76
4.4.3.2 HR and personnel risk ........................................................................................... 78
4.4.3.3 Operation and production risk............................................................................... 80
4.4.3.4 Technology Risk .................................................................................................... 84
4.5.3.5 Procurement and infrastructure risk ...................................................................... 87
4.4.3.6 Financial Risk ......................................................................................................... 88
4.4.3.7 Market Risk ........................................................................................................... 90
4.4.3.8 Strategic Risk ........................................................................................................ 93
4.4.3.9 Safety and security risk .......................................................................................... 95
4.4.3.10 Legal and environmental risk ................................................................................. 96
4.5 RUBNIC OIL’S INHERENT RISK PROFILE SUMMARY ........................... 98
4.6 RISK GAP ANALYSIS: BUSINESS PLAN VS. APPLIED ERM MODEL 100
4.7 CONCLUSION .......................................................................................... 102
CHAPTER 5 ....................................................................................................... 103
CONCLUSIONS AND RECOMMENDATIONS .................................................. 103

vii | P a g e
5.1 INTRODUCTION....................................................................................... 103
5.2 CONCLUSION .......................................................................................... 103
5.3 RECOMMENDATION ............................................................................... 104
5.4 ACHIEVEMENT OF OBJECTIVE ............................................................. 106
5.4.1 Primary objective ................................................................................................ 106
5.4.2 Secondary objectives ........................................................................................... 106
5.5 RECOMMENDATION FOR FURTHER RESEARCH ............................... 107
REFERENCES ................................................................................................... 108

viii | P a g e
LIST OF FIGURES
Figure 1.1: Relationship between risk management principles, framework and process ................................................................................................................... 5
Figure 1.2: Research process model ................................................................... 9
Figure 2-1: Relationship between types of investors and risk profile .................. 19
Figure 2.2: The inverse relationship between interest rate and number of businesses, 2001 -2008 ........................................................................................ 29
Figure 2.3: New registrations of businesses, 2000-2008 ................................... 30
Figure 2.4: Insolvencies and liquidations, 2000-2008 ........................................ 31
Figure 3.1: Relationships between the risk management principles, framework and process .......................................................................................................... 41
Figure 3.2: Drivers of Risk Management ............................................................ 44
Figure 3.3: Relationship between the components of the framework for managing risk ........................................................................................................................ 50
Figure 3.4: Risk management process, in detail ................................................ 51
Figure 3.5: Risk treatment process .................................................................... 60
Figure 4.1: Risk matrix plot diagram for application ........................................... 70
Figure 4.2: Rubnic Oil Structure ......................................................................... 72
Figure 4.3: External environment risk matrix plot diagram ................................. 77
Figure 4.4: HR and personnel risk matrix plot diagram ...................................... 79
Figure 4.5: Operations and production risk matrix plot diagram ......................... 82
Figure 4.6: Technology risk matrix plot diagram................................................. 86
Figure 4.7: Procurement and infrastructure risk matrix plot diagram .................. 87
Figure 4.8: Financial risk matrix plot diagram ..................................................... 89
Figure 4.9: Market risk matrix plot diagram ........................................................ 92
Figure 4.10: Strategic risk matrix plot diagram ..................................................... 94
Figure 4.11: Safety and security risk matrix plot diagram ..................................... 95
Figure 4.12: Legal and environmental risk matrix plot diagram ............................ 97
Figure 4.13: Total inherent risk spread ................................................................. 99
Figure 4.14: Rubnic Oil – Total risk value profile ................................................ 100
Figure 4.15: Risk identification comparison; Busines plan vs ERM approach .... 101
Figure 4.16: ERM applied, total risk spread ....................................................... 101

ix | P a g e
LIST OF TABLES
Table 2.1: Categories of SMMEs ......................................................................... 21 Table 3.1: Subcategories of financial risk familiar to most business owners, and their description..................................................................................................... 45 Table 3.2: Subcategories of operational risk and their description ...................... 46 Table 3.3: Assign risk roles and responsibilities within corporate governance .... 53 Table 4.1: Probability rating table ........................................................................ 68 Table 4.2: Impact (severity) rating table .............................................................. 69 Table 4.3: Questionnaire on elements of risk management and risk oversight principles ............................................................................................................... 73 Table 4.4: SWOT analysis ................................................................................... 75 Table 4.5: External environment risk register ...................................................... 76 Table 4.6: HR and personnel risk ........................................................................ 78 Table 4.7: Operations risk ................................................................................... 81 Table 4.8: Technology risk .................................................................................. 85 Table 4.9: Procurement and infrastructure risk .................................................... 87 Table 4.10: Financial risk ...................................................................................... 88 Table 4.12: Market Risk ........................................................................................ 92 Table 4.13: Strategic Risk .................................................................................... 93 Table 4.14: Safety and security risk ...................................................................... 95 Table 4.15: Legal and environmental risk ............................................................. 97 Table 4.16: Total risk (internal and external) value ............................................... 99

1 | P a g e
CHAPTER 1
NATURE AND SCOPE OF THE STUDY
1.1 INTRODUCTION
Risk management is usually seen as an expensive and complex undertaking that
can be applied only by large organisations. This mini-dissertation argues the
opposite. Large or small, all organisations need risk management. The aim of this
mini-dissertation is to evaluate and apply an Enterprise Risk Management (ERM)
model to Small, Medium and Micro Enterprises (SMMEs) from business incubation
and through the business development phase until a sustainable business has
been established. ERM is a flexible concept that requires the utilisation of
background knowledge and forward thinking rather than money and resources.
This mini-dissertation attempts to prove that when the business owner is assessing
and evaluating the true business risk, ERM can easily be applied in a small
organisation and can play a major role in its success. In this study, the focus is
shifted from customary insurance and finance risk management to strategic risk
management. The study also shows how broad the application of risk management
tools can be.
The mini-dissertation starts with a literature review, examining the main risk
management concepts. It further offers an ERM model to fit in with general ERM
goals and concepts. Following the ERM model is a case study presenting a
practical application of ERM. The final section of this script deals with the research
findings and conclusions. The research methodology used in this mini-dissertation
is a case study of a start-up business. All these activities were effectively applied
and properly monitored in an actual business application. The details of these
activities and how they were structured will not be discussed, as such a discussion
will move the focus from risk management to qualitative research and marketing.

2 | P a g e
1.2 PROBLEM STATEMENT
In today's challenging global economy, business opportunities and risks are
constantly changing. There is a constant need for identifying, assessing,
managing and monitoring the organisation’s business opportunities and risks.
Enterprise is often described as risk for reward, but it may be possible to reduce
risk while improving returns. Risk and reward could also have a converse
relationship as opposed to the view that reward is in proportion to the measure of
risk assumed. To enable the exploitation of upside risk (opportunities), the risk
management plan should not concentrate only on de-risking responses and
interventions (King III: 2009). Risk management involves managing to achieve an
appropriate balance between realising the opportunities for gains while minimising
losses. It is an integral part of good management practice and an essential
element of good corporate governance (AS/NZS 4360:2004).
SMMEs are struggling to implement, embed and sustain a pragmatic enterprise
risk management model that is robust, adds value and creates a balance between
cost and reward.
According to Small enterprise development agency (SEDA, 2009) failure rates of
SMMEs in South Africa range from 70 to 80 percent (estimated), as a result,
millions of rands are lost by businesses. It is believed that enterprise failures occur
because the need for risk management (RM) has not been fully understood before
start-up or, where it has, the response has been inappropriate or ineffective.
Why do businesses fail? (Not only businesses but non-profit ventures and
government initiatives can fail as well). It is simply because of inadequate attention
to one or more of the variables to which the enterprise is vulnerable. There is a
clear need for any enterprise to integrate risk management (RM) within the
strategic or business planning of the incubation of businesses, and to embed these

3 | P a g e
risk processes in all activities that are subject to change or that pose a potential
threat to the enterprise.
The need for this study arose when it was found that most SMMEs did not have a
formal system in place to mitigate their risks right from the outset in the feasibility
study, business plan design and the start-up of the business. This lack of mitigation
controls could be a result of a lack of understanding of the enterprise risk
management (ERM) methodology or an inappropriate ERM decision-making model
to assist them in a way that would mitigate their risk and minimise financial losses.
The King III (2009) report requires all corporate businesses to have a risk
management plan in place. This requirement, which is standard practice of
corporate governance, is supported by the new 2009 draft publication, ISO 31000,
which is expected to be published in South Africa in 2010.
The International Organisation for Standardisation (ISO) has produced a risk
management standard known as the ISO 31000, developed by the ISO
Technical Management Board Working Group on Risk Management. The
ISO 31000, Risk Management - Principles and Guidelines, acknowledges that
organisations operate in uncertainty. It is an international risk management
standard which can be used by any organisation, independent of its size or what it
does (ISO 31000, 2009).
1.2.1 Enterprise risk management
An enterprise risk management programme (ERMP) is a systematic way of
collecting and managing risks, also known as uncertainties, in an organisation.
Risks are classified into various categories, such as strategic, systems and
processes, compliance, financial, political, and project risks. All of these categories
can be affected by internal and external events and each risk usually comes with
its own unique level of probability and impact.

4 | P a g e
What is ERM? ERM is the discipline by means of which an organisation in any
industry assesses, controls, exploits, finances, and monitors risks from all sources
for the purpose of increasing the organisation’s short- and long-term value to
stakeholders. (CAS report, May 2003). According to KPMG (2008), there are
various types of risks and these can vary from business to business as follows:
� External business risk
o Economy risk;
o Regulatory or compliance risk;
o Financial risk;
o Political risk.
� Internal Business risk
o Strategic risk;
o Employee / HR risk;
o Environmental risk;
o Health and safety risk;
o Operational risk.
According to the King III report (2009), the essential focus of the code is that the
board should “exercise leadership to prevent risk management from becoming a
series of activities that are detached from the realities of the company’s business.”
In this context, risk is positioned as a cornerstone of corporate governance and risk
governance is substantially different from the requirement to implement risk
management. Greater pressure is placed on the board to ensure that it is satisfied
with the management of risk.
The King III report (2009) also indicates various risk management frameworks
such as COSO, ISO, IRMA ERM Code of Practice, IRM (UK), among others. In
the South African context, the new international standard, ISO 31000 - Risk
Management Principles and Guidelines, is expected to be entrenched and required
as indicated by the KING III. The principles of such an ISO standard can be used
in developing enterprises.

5 | P a g e
Figure 1.1:
Relationship between risk management principles, framework and process
Source: ISO 31000, International Standard, 2009
The combined effect of the new Companies Act (2008) and the King III Code is
that all "entities" (which include anyone who trades or provides service, whatever
the size or form of incorporation) will need to apply the Code and its
recommendations or explain why not! There is a substantial amount on risk
management and the researcher foresees that most small businesses will not
know where to start.
Risk is one of the most overlooked areas in small businesses in spite of the fact
that it is clear to most small business owners that operating any business involves
risk. While taking a risk and winning is fun, prudent business owners take care to
minimise their risk. A good risk management system is a continuous process of
analysis and communication.

6 | P a g e
The question raised is this: if the concept of enterprise risk is widely known and
SMMEs are eager to build an ERM process into their organisations, why is ERM
not successfully implemented, embedded and monitored in order to provide the
assurance to senior executives and all other stakeholders that all potentially
significant business risks are identified and managed?
1.2.2 Business incubators
The Department of Trade and Industry (DTI) (2005) has established a Small
Enterprise Forum, which will be led by the Small Enterprise Development Agency
(SEDA) as an integrator of publicly funded small business initiatives in South
Africa, as articulated in the National Small Business Act of 2004. It is proposed that
the following entities be part of the forum:
� Small Enterprise Development Agency (SEDA);
� SA Micro-Finance Apex Fund (SAMAF);
� Khula Enterprise Finance Limited;
� Umsobomvu Youth Fund (UYF);
� National Empowerment Fund (NEF);
� Industrial Development Corporation (IDC);
� National Productivity Institute (NPI);
� Tshumisano Trust;
� Tourism Enterprise Programme (TEP);
� South African Revenue Service (SARS SMME Division);
� Sector education and training authorities (Setas);
� Small-scale Mining Board;
� Forestry Enterprise Development (FED) programme;
� provincial Development Finance Institutions (DFIs),
� provincial small business; and
� development agencies.

7 | P a g e
“Improving co-ordination of entrepreneurship and small business promotion efforts
within government remains an important priority. The Inter-Departmental
Committee on entrepreneurship and Small Business Promotion will be
strengthened through government cluster arrangements, drawing in all the relevant
national departments” (Department of Trade and Industry (DTI), 2005).
Furthermore, the DTI (2005) recommended that the corporate sector participate in
this incubation initiative and play a much larger role in promoting entrepreneurship
and small business. It is suggested that corporate business support the process
through sponsoring enterprise education and financial-literacy programmes for
learners and by running in-house business support and induction programmes.
Sasol established a business function called Sasol ChemCity to fulfil the promise
of supporting SMMEs and entrepreneurship. In addition, Sasol ChemCity services
assist entrepreneurs and their businesses in both the start-up and growth phases
of their development. The entrepreneur business support cuts across the value
chain from the feasibility study to a bankable business plan and beyond business
start-up to sustainability (www.chemcity).
Every business or other venture needs to practise risk management, otherwise it
has a high probability of failure. SMMEs within ChemCity are more vulnerable than
bigger or non-chemical businesses, but seldom take a structured approach
towards risk. A little time spent with experienced guidance in examining the
business’s key exposures and setting up processes to track and manage them will
go a long way in creating a robust and enduring enterprise.

8 | P a g e
1.3 RESEARCH OBJECTIVES
The objectives of this study have been set as follows:
1.3.1 Primary objective
The primary objective of this research is to conduct a theoretical and empirical
investigation, which addresses the following aspects:
� determining what is currently available in the literature regarding enterprise
risk management and its application in new business development; and
� recommending a model for the improvement of the maturity level of a
business owner in terms of risk management, particularly in business
planning for implementation and sustainability.
1.3.2 Secondary objectives
In order to achieve the primary objective, the following secondary objectives will be
pursued:
� establishing the gap between the risks identified as part of the business plan
and the true risk; and
� identifying to what extent the entrepreneur or business incubator has
evaluated the inherent business risk during the new business development.
1.4 RESEARCH METHODOLOGY
Since research is a detailed process, the researcher must find a research model to
break down the methods used into smaller units. The following model is used in
this research study:

9 | P a g e
Figure 1.2:
Research process model
Phase 1: Selection of a researchable topic
Step 1: Identify a researchable problem.
Phase 2: Formal formulation
Step 2: Assess the suitability of the research approach.
Step 3: Formulate the problem.
Phase 3: Planning
Step 4: Undertake a literature review.
Step 5: Research and select a model or method for application.
Step 6: Select a business case for application.
Phase 4: Implementation
Step 7: Apply the selected model in an actual case study or business plan.
Phase 5: Interpretation and presentation
Step 8: Analyse and interpret results.
Step 9: Write the research report.
Source: adapted from a Sasol internal company document
1.4.1 Selection of a researchable topic
In phase 1, a researchable topic, based on its relevance, was identified. The topic
“Application of enterprise risk management models during new business
development.” was identified for the following reasons:
� its strategic management aptitude capability, and
� the importance of a sustainable business to the economy of South Africa.
1.4.2 Formal formulation
In phase 2, the quantitative research approach was identified. According to De Vos
et al. (2002: 79), a quantitative approach is identified as an inquiry into a social or
human problem, based on testing a theory composed of variables, measured with

10 | P a g e
numbers and analysed in order to determine whether the theory holds true. The
final research problem was formulated as the “Application of enterprise risk
management models during new business development.”
1.4.3 Planning
Phase 3 consists of a literature study on the research problem. In this research
paper, a literature study was conducted on the application of enterprise risk
management models during new business development. A quantitative study will
be done based on specific keywords. The internet will play a vital role in searching
for the most recent publications and information on enterprise risk management.
Books, journals and articles will also be consulted in the literature study.
1.4.4 Implementation
Phase 4 consists of conducting the research and implementing all the decisions
taken with regard to the business case study. An incubated business will be
selected from a database from Sasol ChemCity. The ERM model will be applied
against the business plan to identify the inherent risk of the selected business.
Formal interviews will also be conducted to formulate the business-specific risk.
1.4.5 Interpretation and presentation
In phase 5, the data are processed, analysed and interpreted. Conclusions are
drawn and recommendations made.
1.5 LIMITATIONS OF THE STUDY
The following aspects have been identified as limitations of the study:
� Limited geographical scope of the study
The empirical study is limited to SMMEs, thus the results and
recommendations of the research are representative of circumstances in the
incubation and business planning process of ChemCity, Since the

11 | P a g e
convenience sampling technique was used to source participants, the
sample cannot be considered representative of all small and medium-sized
businesses in South Africa.
� Limited time for the study
The time taken to conduct the research is limited because the empirical
study will be conducted after hours and not during working hours. Because
the research must also be completed within a specific period, the time for
conducting the survey is very limited. This study reflects the situation in
2010.
� Limited sample size
The study will only focus on only one business case.
1.5 CHAPTER DIVISION
The chapters in this mini-dissertation are presented as follows:
Chapter 1
Introduction and problem statement.
Chapter 2
Literature review of enterprise risk management models.
Literature overview of small and medium-sized enterprises.
Literature overview of the reasons for failures of small and medium-sized
businesses and the relationship to enterprise risk management.
Chapter 3
Development and application of an enterprise risk management model for SMMEs.
.

12 | P a g e
Chapter 4
Application of a recommended Enterprise Risk Management model (ERM) in an
actual business case.
Chapter 5
Conclusions and recommendations.

13 | P a g e
CHAPTER 2
ENTERPRISE RISK MANAGEMENT
2.1 INTRODUCTION
The one thing everyone wishes for is to be able to see into the future so that
businesses can be prepared for any unplanned occurrences that could be
detrimental to our life, health or wealth. Applying enterprise risk management is a
way of foreseeing the future of a business and anticipating any unplanned
occurrences that could possibly have a negative impact, so that plans and
procedures can be put in place to mitigate that risk.
2.2 DEFINITIONS OF CONCEPTS
2.2.1 Defining risk
Risk is a generic term and different disciplines would categorise and interpret risk
in very different ways. Risk is normally associated with an opportunity or a threat,
irrespective of where the risk discipline is used (Puschaver & Eccles, 1998:3).
Layton and Funston (2006:3) concur that risk is the diminished opportunity for gain,
the probability of failure or the cause of factors that can negatively affect the
realisation of an organisation’s objectives.
Any occurrence that can cause a deviation from any intended objectives is
classified as risk, where positive deviations are considered as opportunities and
negative deviations are seen as threats or risk. Opportunities are likely to be
covered by the organisation’s regular strategy review plans. Any risks (negative
14 | P a g e
deviations) are covered by the formal risk management methods or the enterprise
risk management (ERM) process (KPMG, 2008:4).
Australian Standard Risk Management (AS/NZS 4360:1999:1) describes risk
management as follows: “Risk management is the term applied to a logical and
systematic method of establishing the context, identifying, analysing, evaluating,
treating, monitoring and communicating risks associated with any activity, function
or process in a way that will enable organisations to minimise losses and maximise
opportunities. Risk management is as much about identifying opportunities as
avoiding or mitigating losses.”
There are many different ways to describe risk, but in ordinary terms most people
will propose that risk is the likelihood of adverse consequences occurring (Olson,
2002:5).
Risk is mostly viewed from a pessimistic or negative viewpoint and usually focuses
on potential losses, but there is always a possibility that many benefits can be
obtained by taking risks. Therefore, the definition adopted by Olson (2002:5) that
"... risk is the uncertainty of future outcomes", is an improved description of risk.
From a risk management point of view, there is uncertainty about the following:
� whether the anticipated event/occurrence will take place; and,
� if it should occur, what its effect and the extent of its effect will be.
Lucouw (2004:80) defines risk as a possibility that some inauspicious outcome will
emerge, such as not meeting targets, or not arriving at a particular destination. He
argues further that risk is normally associated with the negative because there is
anticipation that the actual outcome of an occurrence will be worse than the
anticipated results. Uncontrollable risks will eventually result in failure; therefore,
risk should be managed at a favourable level between higher and lower risk levels
and not be avoided (Lucouw, 2004:82). Avoidance of risk will lead to low or no
improvement opportunities for the business. Risks ought to be taken when the

15 | P a g e
rewards of a risk-taking decision exceed the negative outcome associated with the
risk.
Cortez (2010:6) claims that once owners and managers understand the way risk
manifests itself, they can classify and deal with it. Business owners become more
familiar with risk and can therefore recognise and analyse these risk occurrences.
These managers are then better equipped to manage these risks in the future by
developing appropriate techniques. Once the managers are more aware of risks
they can act upon them more rapidly. The author also describes a few types of
risks:
� new risks, related to new business activities;
� ever-present risks, which represent the majority of risks a business must
face and which are always around;
� concentrated risks, or how several individual risks act together with each
other and combine into a possible “perfect storm”;
� contagious risks, or how a small risk triggers an event that creates other
risks and other damaging events; and
� sudden risks, which materialise without forewarning, and include incidents
such as fires, acts of God such as floods, and unexpected political shifts or
legal changes.
2.2.2 Enterprise risk management defined
According to Jourdan and Michaelson (2008:3), enterprise risk management
(ERM) is effective only if the risk radar for the organisation has a meaningful and
forward-looking risk management method.
The Casualty Actuarial Society (CAS) (2003:8) adopted the definition of enterprise
risk management as “… the discipline by which an organisation in any industry
assesses, controls, exploits, finances and monitors risk from all sources for the

16 | P a g e
purposes of increasing the organisation’s short- and long-term value to its
stakeholders.”
Similarly, the Committee of Sponsoring Organisations of the Treadway
Commission (COSO) (2004:2) defines ERM as “… a process, effected by an
entity’s board of directors, management and other personnel, applied in a strategy
setting and across the enterprise, designed to identify potential events that may
affect the entity, and manage risk to be within its risk appetite, to provide
reasonable assurance regarding the achievement of entity goals.”
In summary, the COSO ERM framework describes enterprise risk management as
a process which is:
� a continuous ongoing process flowing through an entity;
� brought about by people at every level of a business;
� applied in a strategy setting;
� applied across the enterprise, at every level and entity and includes taking
a unit-level portfolio view of risk;
� designed to classify and categorise possible events affecting the business
and to manage risk within its risk appetite;
� able to provide realistic reassurance to business owners, management
and/or investors; and
� a mechanism leading to the setting of targets in one or more separate,
although overlapping, categories – it is “a means to an end, not an end in
itself”.
These two definitions adopted by CAS and COSO have several commonalities.
Both address ERM as a method or process. ERM is a structured, organised way of
managing risks throughout the business functions of the organisation. Therefore,
ERM cannot be described is as a once-and-done activity, but rather an ongoing
process.

17 | P a g e
DeLoach (2000:3), explains that within ERM, the objective focuses on integrating
risk management and existing management processes. ERM transforms risk
management to a proactive, continuous, value-based, widely focused and process-
driven activity. It is important, therefore, to identify any future events that could
have positive and negative effects, and, consequently, implement efficient
strategies for managing the organisation’s exposure to those possible future
events.
Jourdan and Michaelson (2008:4) conclude that effective application of ERM
principles can help business leaders identify possible emerging risk through
knowledgeable, logical, value-creating decision-making. This ERM methodology
can help organisations to protect themselves and advance their strategies and
objectives if it is embedded in their culture.
According to COSO (2004:17), ERM affects people at every level of an
organisation and is a permanent entity-wide process. Furthermore, it is argued that
ERM is a strategic tool applied across the enterprise at every level and function,
and includes taking an entity-level portfolio view of risk. It is also designed to
identify potential events affecting the entity and to manage risk within its risk
appetite. Reasonable assurance can be provided to an entity's management and
board throughout the ERM process and this will assist them in the achievement of
their objectives. ERM also contributes by aligning risk appetite and business
strategy; it promotes risk response decisions; it reduces possible operational
surprises and losses; it identifies and manages numerous cross-enterprise risks
while seizing opportunities and enhancing the deployment of funds (COSO,
2004:16-21).
De la Rosa (2004:10) defines ERM as a systematic approach effectively designed
to recognise possible events that may have an effect on the organisation and the
managing of its risks within the pre-approved risk appetite of the business.

18 | P a g e
The objective of ERM is to manage the uncertainties that might negatively or
positively influence achievement of the organisation's objectives, and therefore,
this proactive approach will create, protect and enhance shareholder value (De
Loach, 2005:3).
2.2.3 New business development
“South Africa faces numerous economic, political and social challenges in its new
democracy, of which a key challenge is that of massive and growing
unemployment. This problem is especially evident amongst the country’s youth,
who more often than not lack the experience, skills and education necessary to
access employment in the formal sectors” (Herrington, Kew & Kew, 2009:12).
Herrington et al. (2009:47) also state in their Global Entrepreneurship Monitor
(GEM) report that entrepreneurship is important and a dynamic force for shaping
changes in the economic environment. It is difficult to understand the relationship
between entrepreneurship and development, although traditionally the important
role new and small business plays in the economy is neglected in analyses of
economic growth and competitiveness.
In 1995, Trevor Manuel, the former Minister of Trade and Industry, identified issues
relevant to entrepreneurship and the importance of these issues:
“With millions of South Africans unemployed and underemployed, the
government has no option but to give its full attention to the task of
job creation, and generating sustainable and equitable growth. Small,
medium and micro enterprises represent an important vehicle to
address the challenges of job creation, economic growth and equity
in our country. We believe that the real engine of sustainable and
equitable growth in this country is the private sector. We are
committed to doing all we can to help create an environment in which

19 | P a g e
businesses can get on with their job” (Global Entrepreneurship
Monitor (GEM), 2010).
Herrington et al. (2009:123) argue that starting and growing a company or
business is not easy and is full of burdens and unforeseen hazards, problems and
obstacles – “it is like trying to manoeuvre through quicksand or over a minefield.”
Successful entrepreneurs have the capacity to think quickly, are well balanced,
have specific skills and are extremely persistent and determined. Furthermore,
Herrington et al. (2009:124) state that cash is important in the early stages of the
business, and that profitability within the early stages of the business is less
important than having a positive cash flow. Without a positive cash flow the
business will not survive. As the business develops, the level of risk diminishes
and the investors change, as depicted in figure 2.1
Figure 2.1:
Relationship between types of investors and risk profile
Source: Global Entrepreneurship Monitor (2010)
Herrington et al. (2009:124) indicate that 95% of all businesses are started in
South Africa by entrepreneurs who raise their own funding by utilising savings from
friends and family. However, Khula Enterprise Finance and the National Youth

20 | P a g e
Development Agency do provide funding for entrepreneurs although this is not yet
formally exploited. This could be due to lack of knowledge of the existence of these
funders.
The White Paper (SA, 2003:7-8) classifies enterprises based on size and diversity,
and identifies the following four categories:
� Survivalist enterprises – these involve activities performed by people who
are unable to find a paid job or enter into an economic sector of their choice.
� Micro-enterprises – very small businesses, often involving only the owner,
some family member(s) and, at most, one or two paid employees.
� Small enterprises – these constitute the bulk of the established
businesses, employing between 5 and 50 people. The enterprises will
usually be owner-managed or directly controlled by owner-communities.
� Medium enterprises – these employ between 51 and 200 employees and
achieve a turnover of 5 million rand per annum.
According to the White Paper (SA, 2003:11), too many people are active in the
informal sector, where there is little institutional support. A true modern-day
entrepreneur, Sir Richard Branson, said “...entrepreneurs have been the driving
force for growth in countries around the world. Their ability to see opportunities, to
see order amongst chaos where others see only issues, problems and
disorganisation, has helped transform communities and economies”.

21 | P a g e
The National Small Business Act divides SMMEs into the following categories
(refer to Table 2.1):
Table 2.1:
Categories of SMMEs
Category of SMME Description
Survivalist enterprises Operates in the informal sector of the economy.
Mainly undertaken by unemployed persons. Income generated below the poverty line. Providing minimum means to keep the unemployed and their families alive. Little capital invested and not many assets. Not much training. Limited opportunities for growing the business.
Micro enterprises Between one and five employees, usually the owner and family. Informal - no license, formal business premises or labour legislation. Turnover below the VAT registration level of R300 000 per year. Basic business skills and training. Potential to make the transition to a viable formal small business
Very small enterprises Part of formal economy, use technology. Fewer than 10 paid employees. Include self-employed artisans (electricians, plumbers) and professionals.
Small enterprises Fewer than 100 employees. More established than very small enterprises, formal and registered, fixed business premises. Owner-managed, but more complex management structure.
Medium enterprises Up to 200 employees. Still mainly owner-managed, but decentralised management structure with division of labour. Operate from fixed premises with all formal requirements.
Source: National Small Business Act (102/996)
Marx et al. (1998:730) analyse the importance of SMMEs as follows:
� Development of risk takers: SMME owners could join or leave the
business sector at any given time. Risk taking and risk acceptance are
typical entrepreneurial characteristics of SMME owners.
� Management experience: Managers of SMMEs obtain experience to
enable them to manage larger enterprises at a later stage.
� Innovation: In creating SMME opportunities, vital economic growth is
stimulated.

22 | P a g e
� Interdependence: The large enterprise often depends on SMMEs and vice
versa. This is done by means of contracts allocated to SMMEs by larger
organisations.
� Employment: SMMEs create employment, and work creation in this sector
is more significant than in larger organisations.
� Keeping larger enterprises competitive: The adaptability of SMMEs to
consumer needs is greater than their ability to outperform larger enterprises
in terms of cost.
2.3 HISTORY OF RISK MANAGEMENT
Vaughan (1997:27) confirms that the term risk management originated in the early
1950s. One of the first references to the theory of risk management appeared in
the Harvard Business Review in 1956. The article seemed revolutionary in its idea
that responsibility ought to be assigned in managing risk:
“The aim of the article is to outline the most important principles of a
workable program for risk management – for so it must be
conceived, even to the extent of putting it under one executive, who
in a large company might be a full time risk manager.”
Leitch (2003) argues that risk management emerged separately in safety,
insurance, investment, medicine, artificial intelligence, and policy analyses. In
1992, after a few high-profile corporate frauds and accounting scandals, the
London Stock Exchange introduced new regulations covering aspects of corporate
governance. At about the same time in the USA, the Committee of Sponsoring
Organisations of the Treadway Commission (COSO) published the COSO
Framework, written by Coopers and Lybrand. The COSO framework was based
on internal controls and the provision of protection against risk. Risk might change
over time; therefore, monitoring controls should be implemented to meet the
changing needs.

23 | P a g e
In 2001 and 2002, shareholders lost confidence in companies and good corporate
governance due to the large corporate scandals and failures involving, inter alia,
Enron and WorldCom. Poor corporate governance and unethical behaviour of
directors were to blame for these failures (Ulick, 2002:1-5). These occurrences
contributed to a greater focus on good corporate governance within the business
environment. As a result, in 2002, the King II Report published various policies,
corporate codes and acts, which consist of the following six focus areas: board of
directors, risk management, internal audit, integrated sustainable reporting,
accounting and auditing, and compliance and execution. Secondly, the Sarbanes-
Oxley Act (SOX) was imposed in 2002, after the Enron tragedy (Gray & Manson,
2005:91). The Higgs Report, published in Britain in January 2003, provides
guidelines to non-executive directors of companies with regard to corporate
governance (Gray & Manson, 2005:607).
The third report on corporate governance in South Africa (King III) became
necessary because of changes in the international governance trends and the new
South African Companies Act No. 71 of 2008. Corporate governance was
presented as a crisis because the credit crunch resulted in disaster for financial
institutions. Although the US is the primary source of the current financial crisis, the
statutory requirements for rigorous internal controls of SOX have not prevented the
collapse of many leading brands in US banking and finance. Furthermore, the King
III report argues that “sustainability is the primary moral and economic imperative
of the 21st century. It is one of the most important sources of both opportunities and
risks for businesses”. In conclusion, risk encompasses issues over the entire
spectrum of the business and enterprise. Business and enterprise strategy
involves risk because one is dealing with future events (King III, 2009:1-7).
2.3.1 Enterprise development in South Africa
According to the Small Enterprise Development Agency (SEDA) (2009:11-13),
since 1994, South Africa has shown positive economic growth although
unemployment has not been satisfactorily addressed. SMMEs will have a positive

24 | P a g e
effect on the South African economy by contributing to the reduction of
unemployment rates. Worldwide, it has been verified that the SMME sector
stimulates economic growth, redistributes wealth within the country and helps
reduce unemployment rates.
The contribution of small businesses in South Africa to the country’s overall GDP is
significantly lower than that of developed economies, where small businesses
contribute some two thirds of GDP. In South Africa, they contribute only one third
to the GDP. Failure rates of SMMEs in South Africa range from 70 to 80 percent
(estimated), and, as a result, millions of rands are lost by businesses (SEDA,
2009).
2.3.2.1 Business support and incubators in South Africa
The Small Enterprise Development Agency (SEDA) (2009:42) concluded that a
national strategy for the development and promotion of small businesses in South
Africa should be developed by the government. The primary responsibility in the
formulation, coordination and monitoring of national policies related to SMME was
given to the Department of Trade and Industry (DTI). To promote the growth and
continued success of SMMEs, programmes like the Reconstruction and
Development programme (RDP), Growth, Employment and Redistribution (GEAR)
program and Agri South Africa (AGRI SA) were implemented in 2006. Public and
private small business support systems are available for the development of
SMMEs in South Africa. The different support organisations are as follows
(SEDA,2009):
� Department of Trade and Industry (DTI). It offers the following forms of
support:
o Its objective is to create a number of developmental incentives by
improving the competitiveness of SMMEs.
o It was given responsibility by government for the formulation,
coordination and monitoring of policies related to SMMEs.

25 | P a g e
o A programme was developed in 2001 supporting SMME repayment
and reducing credit exposure. This initiative should assist SMME
liquidity and limit exposure to risk.
� Khula Finance Limited. This is a government funding institution. It is a
South African Micro-Finance Apex Fund under the authority of the DTI.
Khula targets the R1 000 to R200 000 sector without surety by giving higher
interest rates than the bank and shorter payment periods. Khula offers the
following:
o equity, basic funding and a credit indemnity scheme to share the
finance risk with banks, enabling SMMEs to access funding from a
participating bank or other financial institution;
o the Thuso Mentorship programme assisting with business plan
compilation and mentorship; and
o the Khula Mentorship Programme, which facilitates access to finance
and mitigates risk for SMMEs.
� Business Partners Limited. This was formed in 1998 from the Small
Business Development Corporation (SBDC), and focuses on SMME funding
from R150 000 to R15 million. It is one of the more successful SMME
support organisations, providing:
o funds for start-ups, expansions, takeovers and management buyouts;
o personalised service, industry knowledge, experience and
networking.
� Small Enterprise Development Agency (SEDA). It was established with
80% focus on the SMME sector, with the following objectives:
o reducing the institutional duplication in the small business sector;
o optimising resource exploitation;
o improving geographical outreach through an integrated service
delivery network;

26 | P a g e
o responding to needs, capabilities and opportunities;
o wide networking and established branches countrywide;
o information sharing, business skills training, export training, trade,
company audits and assessment, technical support, business
coaching and mentoring, and market access assistance to
entrepreneurs.
� Local Business Service Centres. A partnership between government,
local communities and the private sector, LBSCs have the following points
of focus:
o on a national level, job creation, wealth creation, transformation and
empowerment;
o services concentrated mainly on information, training, counselling,
advisory services and linking networking and services;
o regionally, increased access of locals to SMME support services and
opportunities.
� Commercial Banks. In South Africa, more than 30 registered banks offer
start-up or expansion funding to entrepreneurs directly as well as through
the government, public and private enterprises. The bankable business plan
is the standard requirement in obtaining these funds.
o Standard Bank offers:
� a package on planning and financing an SME;
� a booklet on SMEs entitled “A business of your own”;
� an SME business plan and loan application;
� an SME call line;
� public liability and personal accident insurance for SMEs;
� an SME autobank card;
� business deposits via the ATM;
� an owner loan protection plan.

27 | P a g e
o First National Bank offers:
� an SME investments programme providing for early stage
venture capital from R250 000 to R1 million (in partnership
with the Small Business Project);
� FNB’s small business support, focusing on finance mainly to
franchisees and smaller amounts to non-franchisees;
� an export finance scheme providing working capital, charged
at prime overdraft rates;
� business plan guidelines and business/technical assistance;
� the Momentum UYF progress fund with loan amounts of R100
000 to R5 million for minority equity participation and R100
000 to R20 million for BEE deals.
o NedEnterprise offers:
� one-stop full-service relationship banking;
� financial loans from R50 000 to R1,5 million, with the
entrepreneur contributing at least 25%, consisting of either
income-generating assets and/or cash. There is flexibility
when assessing applications.
o ABSA offers:
� the Business Banking Toolbox, which consists of a complete
business guide with 14 brochures;
� tailor-made products for businesses.
� Sasol ChemCity is a wholly-owned subsidiary of Sasol. It acts as a
business incubator to facilitate the establishment of independent
downstream SMMEs in the chemical and related sectors thus supporting
two important national strategies i.e. job creation and Broad-Based Black
Economic Empowerment (BBBEE). Since 2004, a cumulative total of over
100 enterprises has been established, with more than 1500 jobs created.
ChemCity services assist entrepreneurs and their businesses in both the
start-up and growth phases of their development. ChemCity also supports

28 | P a g e
the business entrepreneur from the feasibility study, to a bankable business
plan and beyond business start-up to sustainability (www.chemcity). In
collaboration with its partners, Sasol ChemCity offers as part of its business
incubation the following services;
o general consulting services;
o industry and competitor analysis;
o opportunity identification;
o marketing studies, strategy and planning;
o technology sourcing;
o technical development;
o feasibility studies;
o compilation of business plans;
o identification of entrepreneurs;
o financial sourcing;
o site selection;
o sourcing of equipment or raw materials;
o project facilitation; and
o plant cost estimations.
2.4 BUSINESS DEVELOPMENT - A SOUTH AFRICAN PERSPECTIVE
2.4.1 Trends in business creation and business failure
According to the State of Entrepreneurship in South Africa Report (2009:3),
entrepreneurship is essential to the “economic and social development of South
Africa. Through innovation, entrepreneurs create new, competitive markets and
businesses which lead to job creation and have a multiplying effect on the
economy. Entrepreneurs tend to submit applications that are inconsistent with the
funder’s mandate. Venture capital funding is expensive; as a result, venture
capitalists are generally not willing to assume too much risk”.
29 | P a g e
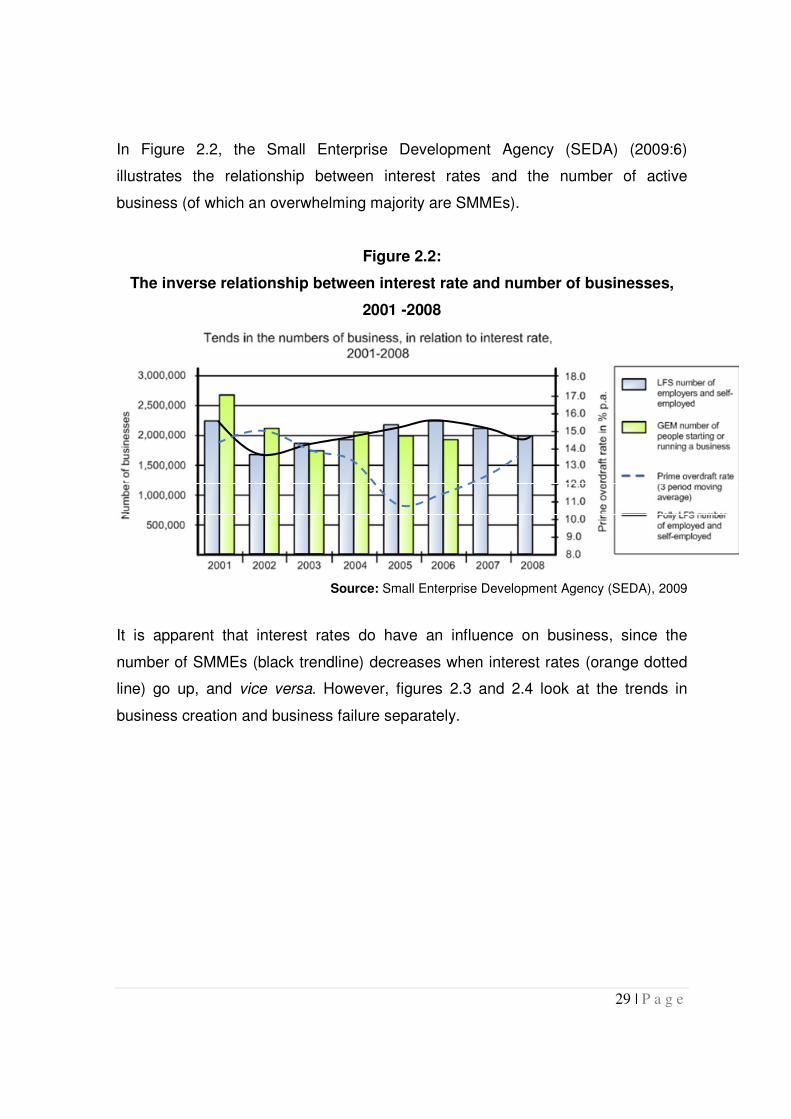
In Figure 2.2, the Small Enterprise Development Agency (SEDA) (2009:6)
illustrates the relationship between interest rates and the number of active
business (of which an overwhelming majority are SMMEs).
Figure 2.2:
The inverse relationship between interest rate and number of businesses,
2001 -2008
Source: Small Enterprise Development Agency (SEDA), 2009
It is apparent that interest rates do have an influence on business, since the
number of SMMEs (black trendline) decreases when interest rates (orange dotted
line) go up, and vice versa. However, figures 2.3 and 2.4 look at the trends in
business creation and business failure separately.

30 | P a g e
Figure 2.3:
New registrations of businesses, 2000-2008
Source: Small Enterprise Development Agency (SEDA), 2009
Figure 2.3 illustrates the increase from 2000 to 2008 in the number of registrations
of close corporations and companies (including SMMEs). Importantly, the
businesses, of which only a tiny minority are large enterprises, represent only a
small proportion of the small business spectrum. Many businesses operate without
registering as a separate legal entity, in the formal or informal sector. The chart
also shows that after a rapid increase in new business registrations from 2004, this
trend stabilised in 2008.

31 | P a g e
Figure 2-4:
Insolvencies and liquidations, 2000-2008
Source: Small Enterprise Development Agency (SEDA), 2009
This chart depicting insolvencies and liquidations shows that after a reduction in
the number of liquidations and insolvencies for a few years, there was an upward
trend in 2008. The difference between insolvencies and liquidations reflects the
stronger vulnerability of the smaller, more informal SMMEs. Medium-sized
companies will possibly have more ability to ride out unfavourable periods and
remain active in spite of lower turnover, whereas less sophisticated enterprises
may be forced out of business by unfavourable conditions (SEDA 2009:6).
2.4.2 Why do businesses fail?
According to Cortez (2010:16), there are huge amounts of information and
innumerable books on how to succeed in business, but regardless of this
knowledge, 33 percent of all business start-ups fail within two years and 56 percent
fail within four years. Cortez also asserts that “the old paradigm of creating a brick-
and-mortar business and holding it for two, three, or four generations is out of
date”.

32 | P a g e
Cortez (2010:16) presents seven reasons why businesses fail:
� Financial failure. Although there are many reasons for financial failure,
the most frequent cause is the inability to manage cash flow;
� Strategic inability to compete. The inability to be competitive in the
market is related to products, client accessibility and being less
aggressive than the competition;
� Merger or takeover. The competition buys out the business or top
product lines or merges it into their own;
� Force majeure. Some businesses fail due to natural disasters. Some
countries may be involved in war, which affects business risk;
� Fraud. An estimated one third of businesses fail because of fraud,
including the so-called “cooking the books” to suit auditors and
stakeholders, and other misuses of money;
� Loss of key supplier. The loss of a major supplier, leading to loss of
quality control, results in reduced customer satisfaction;
� Loss of key customer. By relying on only one or a few big customers for
income, businesses face the risk of failure.
Timmons and Spinelli (2007:598-599) concur that the troubles of a company can
be caused by external forces not under the control of management, such as
recession, interest rate changes, government policy changes or new competition.
However, managers that manage turnarounds will use such circumstances and
adjust; therefore, the failure of a business can rarely be attributed to these factors.
Most causes of failure are found within the company management. The numerous
causes of a company in trouble might be classified into three broad areas:
inattention to strategic issues, general management problems, and poor financial
or accounting practices.
Many businesses fail to spend enough time protecting their downside, applying
energy to investing, planning and strategies for the successful future. The

33 | P a g e
unpredictability and risk associated with the unknown or gray area related to the
downside may harm the business. By failing to manage the downside, a positive
future is just a dream. It is important to focus on building a business that will
succeed through any risk scenario and survive and thrive through economic ups
and downs (Cortez, 2010:18).
According to Timmons and Spinelli. (1994:380), the inability to anticipate obstacles
may result in a venture that is excessively risky and expensive. This is especially
so where excessive optimism and over-commitment culminate in ignoring reality.
Every plan or business plan has its limitations; every firm faces obstacles, whether
planned or unplanned.
2.4.3 Business plan development vs. risk management
Timmons and Spinelli. (2007:223-224) maintain that a business plan can convert
an idea into an opportunity. The business plan will consolidate and evaluate the
merits, requirements, risks and potential rewards of the opportunity. The plan is the
starting point for potential investors in beginning a due diligence to determine
potential and various risks of the business enterprise: technology risk, market risk,
management risk, financial risk and competitive and strategic risk.
Business development is associated with risk and problems. However, the
business plan customarily contains some embedded assumptions about these
risks. Identifying the risks in the business plan helps to demonstrate to the
“investors that you have thought about them and can handle them“ (Timmons and
Spinelli, 2007:244).
However, the risk assessment methodology in the business plan as described by
Timmons and Spinelli (2007:224), where risk is rated only a high, medium and low,
is not an effective risk management tool. They describe the following process as
risk management:
� Discuss any assumptions made and risk contained in the business plan.

34 | P a g e
� Identify and discuss the perceived risk with regard to:
� cash flow problems,
� price cutting of competitors,
� unfavourable industry trends, and
� difficulties in obtaining credit.
� Point out any assumptions and risks more critical to the success of the new
business venture. Also give a plan to minimise the impact of any
unfavourable outcome in every case.
2.5 ENTERPRISE RISK MODELS
2.5.1 The King Ill Report (King Report on Governance)
� The King Code of Governance Principles and the King Report on
Governance (King III) came into effect on 1 March 2010 (Engelbrecht
2010:30). While King III is non-legislative, it is in line with the Companies
Act No. 71 of 2008, which came into effect on 1 July 2010, and represents
the country’s official code for governance and best practices. Engelbrecht
(2010:30) maintains that “risk-based auditing is one of the most important
principles addressed by King III”. The code’s repositioned risk-based focus
is mainly on internal auditing. This is done to ensure that valuable controls
have been implemented over relevant key risks that have been identified.
Risk-based internal auditing refers to strategic, operational, financial, and
compliance matters as well as sustainability issues.
2.5.1.1 Corporate governance and lessons learned from financial crises
PricewaterhouseCoopers (2008:3) argue that “the origins of the financial crisis will
be debated for some time, but the fallout exposed one clear shortcoming:
inadequate risk assessment practices. Too many companies took on excessive
risk with too little regard for reasonable, realistic long-term performance
expectations. The debacle is focusing minds on more robust approaches to risk
management, with a new imperative to keep pace with financial innovation,

35 | P a g e
performance incentives, and business goals. Reforms will stretch risk management
across the organisation and involve systematically linking risk and corporate
performance management, leading to an informed view of reward”.
PricewaterhouseCoopers (2008:3) also report that “many companies fail to
connect risk and performance in the course of basic performance management”. In
only 37 percent of US-based multinationals did senior executives confirm that their
companies linked key risk indicators to corporate performance indicators.
2.5.1.2 Risk management and the financial crisis
Coffin, of the Risk and Insurance Management Society (RIMS) (2009:3), reports
that Robert P. Hartwig, president of the Insurance Information Institute, lashed out
at present enterprise risk management frameworks when he declared that “the
financial crisis is the result of a failure of risk management [in the banking and
securities markets] on a colossal scale … We may literally have to tear up the
manual of enterprise risk management and start over”.
2.5.1.3 Was there a risk failure?
Coffin (2008:7) maintains that although it might be easy to blame risk management
for the financial crisis, such an accusation should be rejected for the following
reasons:
� The financial crisis resulted from a system-wide “failure to embrace
appropriate enterprise risk management behaviours” or attributes within
these distressed organisations.
� In addition, there was an apparent “failure to develop and reward internal
risk management competencies.”
� There was also a “failure to use enterprise risk management to inform
management’s decision-making for both risk-taking and risk-avoiding
decisions.”

36 | P a g e
� Enterprise risk management best practices were not embedded from
executive level all the way down to the operation floor; therefore, the
assumption was that there is only a single way to a particular risk analysis.
� There was a failure to recognise, characterise, communicate and scrutinise
risk tolerances accurately. It was also incorrectly assumed that everybody
within the organisation understood how much risk the organisation was
prepared to take.
� “According to CEO Challenge 2006: Top Ten Challenges, The Conference
Board 2006, a study done by the RIMS found that 54% of the Fortune 100
directors surveyed understood their company’s risk tolerance.”
2.5.1.4 What can we learn from the financial crisis?
According to Coffin (2008:7), the following lessons can be learned from the
financial crisis:
� The first lesson is to establish whether the organisation is largely
concerned with the downside protection (resilience), upside opportunity
(sustainability), or an amalgamation of both. The organisation is required to
have a full understanding of its expected and desired outcomes and to
design its enterprise risk management accordingly.
� Secondly, merely implementing an enterprise risk programme is not
enough. The solution to successful enterprise risk management practices
depends on the behavioural attributes of the organisation at all levels.
� Additionally, a sustainable risk programme requires those responsible for
leading the risk activities within an organisation to have particular skills,
insight and competencies. The enterprise risk manager will need to pay
special attention to developing skills such as the following:
o leadership skills;
o strategic thinking;
o ethical judgment;
o innovative decision-making; and
o communication.

37 | P a g e
McKinsey (2008:2) suggests a few persistent themes in risk management
breakdown, and claims that most of the large surprises, in principle, could have
been avoided. McKinsey also agrees that good risk management is based on four
basic disciplines:
1. Ensure full transparency across all risks and in the entire organisation.
2. Put in place dynamic risk governance structures.
3. Define the firm’s risk appetite clearly.
4. Instil a consistent, strong risk culture focused on optimising well-understood risk
return trade-offs within the defined risk strategy.
2.6 BENEFITS OF IMPLEMENTING ERM
2.6.1 Why SMMEs should value risk management as important
According to Valsamakis, Vivian and Du Toit. (2005:7), the reasons for the
management of risk are explicitly associated with the business objectives of the
organisation. These include survival, growth, and maximisation of profits. An
ERMP which reduces the risk of the company should be related to its corporate
business strategy. The ERMP should also be aligned with the firm’s common
purpose of existence.
Sammer (2001:1) concludes that the triumphant and successful management of
risks is an important driver in the success or failure of many organisations.
Because the future is unpredictable, there are fundamental issues that require
serious attention and the general threat is the failure to manage risk (Arminas
2003:1).
Valsamakis et al. (2003:12) illustrate the importance of risk management in an
organisation. Risk management is just as important as entrepreneurship and
business intelligence in enhancing the economic growth of the western world.

38 | P a g e
SMEs generally suffer from the problems of trying to work out how to optimise their
processes and the most efficient way to exploit their resources. Because of the
shortage of experienced personnel, they need to explore effective ways to plan the
time schedule of this valuable resource. The size of SMEs prohibits a temporary
failure in cost and duration estimations for projects undertaken, while bigger
companies, even when estimations are optimistic, have the financial and
managerial strength to undertake corrective actions (Kirytopoulos et al., 2001).
According to the International Risk Management Institute (IRMI) (2009), almost all
people and organisations strive to manage risk for three fundamental reasons:
� to protect resources from unexpected losses,
� to be prepared to seize opportunities,
� to limit uncertainty.
2.6.2 Benefits of implementing enterprise risk management
No handbook is available for integrating risk and performance management.
“Companies are recognising that the same drivers of increased volatility – capital
mobility, rapid innovation, and the development of new business models – also
offer opportunities that they must exploit to increase revenue, improve shareholder
value, and satisfy evolving customer demands” (PricewaterhouseCoopers 2009:3).
With an integrated, honourable approach to managing risk and business
performance, enterprises can grasp economic opportunities with greater
confidence.
Why manage risk? Degraeve (2004) concludes that it is uncertain what the future
results of our decisions will be. Effective understanding of risk management will
provide precious knowledge and information by which one can prepare for the
unpredictable future. Risk management will also help one to be prepared against

39 | P a g e
uncertainties, minimising costs, comparing results and business stability. Most
importantly, risk management improves our decision-making ability.
Sadgrove (1996) suggests that risk management is applicable to all kinds of
organisations. He also states that “Small companies are more vulnerable to risk.”
2.7 CONCLUSION
To fully understand the concept of risk management, it was important to define risk
management and enterprise risk management. The term risk management
originated in the early 1950s and the concept became more popular as the
importance of risk management was realised. After a few high-profile corporate
frauds and accounting scandals, the London Stock Exchange introduced new
regulations covering aspects of corporate governance.
In South Africa, small businesses contribute one-third of GDP. Failure rates of
SMMEs in South Africa range from 70 to 80 percent (estimated), and, as a result,
millions of rands are lost by businesses. It is obvious that an enterprise risk model
is needed for minimising failure rates. The King Code of Governance Principles
and the King Report on Governance (King III) is non-legislative and represents
South Africa’s official code of governance and best practices. The code’s
repositioned risk-based focus is mainly on internal auditing. This is done to ensure
that valuable controls have been implemented over relevant key risks that have
been identified. Risk-based internal auditing refers to strategic, operational,
financial, and compliance matters as well as sustainability issues. In conclusion, in
the view of Roughley et al. (2001), successful risk management improves
competitive advantage, reduces missed opportunities and decreases time spent on
solving problems.
40 | P a g e
CHAPTER 3
THE DERIVED ERM PROCESS METHODOLOGY
3.1 INTRODUCTION
ERM is a technique where a portfolio of risks is managed holistically.
Entrepreneurs and business owners take on risks to pursue new business
objectives within their respective risk appetites. The objective of this chapter is to
identify relevant ERM and a general comprehensive approach for business owners
to use as a guide for implementation.
3.2 THE ERM METHOD
COSO (2004:3) presents an enterprise risk management framework geared to
achieving an entity’s objectives, set forth in four categories:
� Strategic – high-level goals, aligned with and supporting its mission:
� Operations – effective and efficient use of its resources:
� Reporting – reliability of reporting: and
� Compliance – compliance with applicable laws and regulations.
Furthermore, COSO (2004:3) explains that categorising these objectives allows a
focus on different aspects of enterprise risk management. These separate but
overlapping categories (a specific objective may fall into more than one category)
deal with different entity needs and could, therefore, be the direct responsibility of
different executives.
The ISO 31000 International Standard for risk management principles and
guidelines (2009:V) describes the interaction between the principles for managing

41 | P a g e
risk. The framework in which risk occurs and the risk management process
described are shown in Figure 3.1.
Figure 3.1:
Relationships between the risk management principles, framework and
process
Source: ISO 31000 (2009)
Risk management, when implemented and maintained in harmony with the ISO
31000, enables a business to:
� increase the probability of achieving objectives;
� achieve proactive management;
� recognise and treat risk throughout the organisation and create awareness
thereof;
� improve the recognition of opportunities and threats;
� comply with applicable legal and regulatory requirements;
� improve financial reporting;
� improve governance;
� improve stakeholder confidence and trust;

42 | P a g e
� institute a consistent basis for decision-making and planning;
� improve controls;
� effectively assign and apply resources for risk treatment;
� improve operational effectiveness and efficiency;
� enhance health and safety performance, including environmental protection;
� improve loss prevention and incident management;
� minimise losses;
� improve organisational learning; and
� improve organisational resilience.
3.3 OBJECTIVE OF ERM
COSO (2004:3) states that “value is maximised when management sets strategy
and objectives to strike an optimal balance between growth and return goals and
related risks, and efficiently and effectively deploys resources in pursuit of the
entity’s objectives”. Enterprise risk management encompasses the following
aspects:
� Aligning the risk appetite of the organisation and strategy – Management
considers the business risk appetite in evaluating tactical alternatives,
setting objectives, and developing mechanisms to manage interrelated
risks.
� Enhancing risk response decisions – ERM prompts the manager to
categorise and select alternative risk responses, such as risk avoidance,
reduction, sharing or acceptance.
� Reducing operational surprises and losses – ERM enables the
identification of possible events and the setting up of responses, thereby
reducing surprises and related costs or losses.
� Identifying and managing multiple and cross-enterprise risks – many risks
exist, affecting different parts of the organisation, and ERM facilitates
efficient reaction to the interconnected impacts, and integrated responses to
multiple risks.

43 | P a g e
� Seizing opportunities – By taking into consideration a full selection of likely
events, management is positioned to spot and proactively recognise
opportunities.
� Improving the deployment of capital – Obtaining risk information allows
management to evaluate overall capital needs successfully and improve
capital allocation.
The capability intrinsic to ERM will assist management in achieving the business
performance and profitability targets and in the prevention of potential loss of
assets. ERM further assists by avoiding damage to the entity’s reputation and
associated consequences and helps by ensuring efficient reporting and
compliance with applicable legislation and regulations. In conclusion, ERM assists
an organisation in meeting its vision and in evading pitfalls and surprises on its
journey according to COSO. (2004:3).
The purpose of the Australian/New Zealand Risk Management Standard (2004:1-
2) is to give direction that allows public, private or community enterprises, groups
and individuals to achieve the following:
� a more secure and accurate basis for decision-making and forecasting;
� superior recognition of opportunities and threats;
� the gaining of value from uncertainty and variability by means of pro-active
rather than re-active management;
� allocation and utilisation of resources;
� improved incident management and reduction in loss and the cost of risk,
including commercial insurance premiums;
� enhanced stakeholder confidence and belief;
� improved relevant legislation compliance; and
� improved corporate governance.

44 | P a g e
3.4 ESSENTIAL STEPS FOR PERFORMING A RISK ASSESMENT
3.4.1 Drivers of risk management
The Institute of Risk Management (IRM) (2010:14) suggests that increase in risk
can be divided into internal and external factors. Figure 3.2 illustrates the drivers of
risk management and the risk classification system. The figure provides examples
of internal and external risk drivers. Risk Scorecard approaches integrate strategic
(as well as tactical and operational) risks under all four headings.
Figure 3.2:
Drivers of Risk Management
Source: The Institute of Risk Management (2010:14)
Although there are no risk classification systems that are generally applicable to all
types of organisations, risk categorisation systems are more often than not based
on the division of risks into those related to:
� financial control,
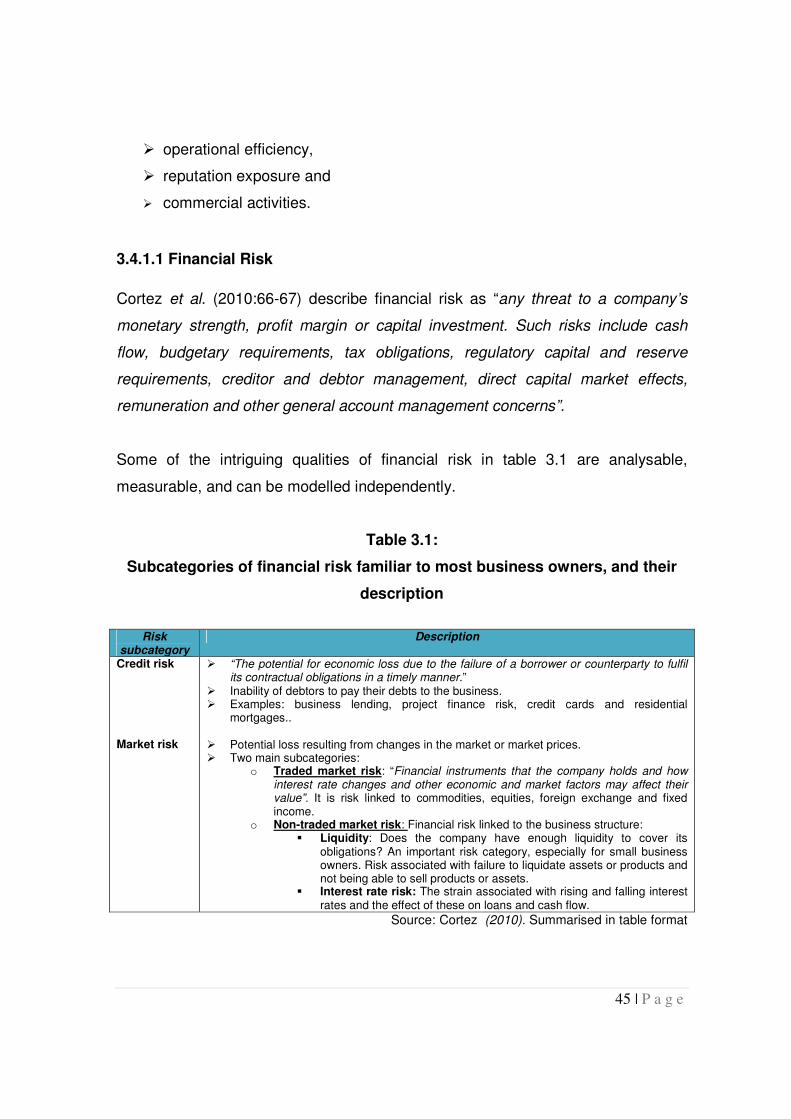
45 | P a g e
� operational efficiency,
� reputation exposure and
� commercial activities.
3.4.1.1 Financial Risk
Cortez et al. (2010:66-67) describe financial risk as “any threat to a company’s
monetary strength, profit margin or capital investment. Such risks include cash
flow, budgetary requirements, tax obligations, regulatory capital and reserve
requirements, creditor and debtor management, direct capital market effects,
remuneration and other general account management concerns”.
Some of the intriguing qualities of financial risk in table 3.1 are analysable,
measurable, and can be modelled independently.
Table 3.1:
Subcategories of financial risk familiar to most business owners, and their
description
Risk
subcategory Description
Credit risk Market risk
� “The potential for economic loss due to the failure of a borrower or counterparty to fulfil its contractual obligations in a timely manner.”
� Inability of debtors to pay their debts to the business. � Examples: business lending, project finance risk, credit cards and residential
mortgages.. � Potential loss resulting from changes in the market or market prices. � Two main subcategories:
o Traded market risk: “Financial instruments that the company holds and how interest rate changes and other economic and market factors may affect their value”. It is risk linked to commodities, equities, foreign exchange and fixed income.
o Non-traded market risk: Financial risk linked to the business structure: � Liquidity: Does the company have enough liquidity to cover its
obligations? An important risk category, especially for small business owners. Risk associated with failure to liquidate assets or products and not being able to sell products or assets.
� Interest rate risk: The strain associated with rising and falling interest rates and the effect of these on loans and cash flow.
Source: Cortez (2010). Summarised in table format

46 | P a g e
3.4.1.2 Operational Risk
Cortez. (2010:69-70) describe operational risk as “the risk of loss resulting from
inadequate or failed internal processes, people and systems, or from external
events. This includes fraud, security issues, and outside occurrences, including
natural disasters, political upheaval, and widespread power outages”.
Operational risks are related to the phases of the internal operations and some
non-strategic external events like natural disasters and security breaches. Table
3.2 describes operational risk and divides it into a number of subclasses:
Table 3-2:
Subcategories of operational risk and their description
Risk subcategory Description People/organisation risk Business process management risk System and equipment risk Legal and compliance risk Security Risk Project Risk External events risk
� Culture, structure and people issues that may affect the operation � Risk inherent in human error and � Risks arising due to employment practices, inadequate staff, loss of
key personnel, employee errors or actions and workplace safety � Ability to consistently manage the day-to-day operations and the
delivery of: o Service/products: product and service delivery, poor response to
customer complaints, poor business practices, (documentation, disclosures, product flaws, improper business or market practices)
o Process and controls: failed transaction processing, vendor and supplier miscommunication, process control failures, poor internal documentation control
� Cost incurred due to business disruption and system failures � Poor maintenance resulting in unplanned replacement of equipment � Failure to upgrade and maintain internal systems and equipment � Compliance with applicable legal requirements such as legislation,
regulations, standards, codes of practice and contractual terms � Extended to additional rules that may be documented in contracts,
customer requirements, social environment or internal management policies, procedures and good corporate governance guidelines
� Security risk to business concern premises, assets and people � Security of information, intellectual property, and technology � Threats to the management of equipment, finances, resources,
technology and people associated with the projects � “Acts of God” or natural and non-natural disasters
Source: Cortez. (2010) Summarised in table format

47 | P a g e
According to the practical guide to risk assessment by PricewaterhouseCoopers
(2008:9-11), risk assessments can be conducted at different levels within the
organisation. The objectives and events under consideration determine the scope
of the risk assessment to be undertaken. Furthermore, PricewaterhouseCoopers
describes some examples of frequently performed risk assessments, including:
� Strategic risk assessment: “Evaluation of risks linked to the organisation’s
mission and strategic objectives, usually performed by senior management
teams in strategic planning meetings, with varying degrees of formality.”
� Operational risk assessment. “Evaluation of the risk of loss (including
risks to financial performance and condition) resulting from inadequate or
failed internal processes, people, and systems, or from external events. In
certain industries, regulators have imposed the requirement that companies
regularly identify and quantify their exposure to such risks. While
responsibility for managing the risk lies with the business, an independent
function often acts in an advisory capacity to help assess these risks.”
� Compliance risk assessment. “Evaluation of risk factors relative to the
organisation’s compliance obligations, considering laws and regulations,
policies and procedures, ethics and business conduct standards and
contracts, as well as strategic voluntary standards and best practices to
which the organisation has committed. This type of assessment is typically
performed by the compliance function with input from business areas.”
� Internal audit risk assessment. “Evaluation of risks related to the value
drivers of the organisation, covering strategic, financial, operational, and
compliance objectives. The assessment considers the impact of risks on
shareholder value as a basis for defining the audit plan and monitoring key
risks. This top-down approach enables the coverage of internal audit
activities to be driven by issues that directly impact shareholder and
customer value, with clear and explicit linkage to strategic drivers for the
organisation.”

48 | P a g e
� Financial statement risk assessment. “Evaluation of risks related to a
material misstatement of the organisation’s financial statements through
input from various parties such as the controller, internal audit, and
operations. This evaluation, typically performed by the finance function,
considers the characteristics of the financial reporting elements (e.g.,
materiality and susceptibility of the underlying accounts, transactions, or
related support to material misstatement) and the effectiveness of the key
controls (e.g., likelihood that a control might fail to operate as intended, and
the resultant impact).”
� Fraud risk assessment. “Evaluation of potential instances of fraud that
could impact the organisation’s ethics and compliance standards, business
practice requirements, financial reporting integrity, and other objectives.
This is typically performed as part of Sarbanes-Oxley compliance or during
a broader organisation-wide risk assessment, and involves subject matter
experts from key business functions where fraud could occur (e.g.,
procurement, accounting, and sales) as well as forensic specialists.”
� Market risk assessment. “Evaluation of market movements that could
affect the organisation’s performance or risk exposure, considering interest
rate risk, currency risk, option risk, and commodity risk. This is typically
performed by market risk specialists.”
� Credit risk assessment. “Evaluation of the potential that a borrower or
counterparty will fail to meet its obligations in accordance with agreed terms.
This considers credit risk inherent to the entire portfolio as well as the risk in
individual credits or transactions, and is typically performed by credit risk
specialists.”
� Customer risk assessment. “Evaluation of the risk profile of customers
that could potentially impact the organisation’s reputation and financial
position. This assessment weighs the customer’s intent, creditworthiness,
affiliations and other relevant factors. This is typically performed by account
managers, using a common set of criteria and a central repository for the
assessment data.”

49 | P a g e
� Supply chain risk assessment. “Evaluation of the risks associated with
identifying the inputs and logistics needed to support the creation of
products and services, including selection and management of suppliers
(e.g., up-front due diligence to qualify the supplier, and ongoing quality
assurance reviews to assess any changes that could impact the
achievement of the organisation’s business objectives).”
� Product risk assessment. “Evaluation of the risk factors associated with
an organisation’s product, from design and development through
manufacturing, distribution, use, and disposal. This assessment aims to
understand not only the revenue or cost impact, but also the impact on the
brand, interrelationships with other products, dependency on third parties,
and other relevant factors. This type of assessment is typically performed by
product management groups.”
� Security risk assessment. “Evaluation of potential breaches in an
organisation’s physical assets and information protection and security. This
considers infrastructure, applications, operations and people, and is typically
performed by an organisation’s information security function.”
� Information technology risk assessment. “Evaluation of potential for
technology system failures and the organisation’s return on information
technology investments. This assessment would consider such factors as
processing capacity, access control, data protection, and cyber crime. This
is typically performed by an organisation’s information technology risk and
governance specialists.”
� Project risk assessment. “Evaluation of the risk factors associated with the
delivery or implementation of a project, considering stakeholders,
dependencies, timelines, cost, and other key considerations. This is typically
performed by project management teams.”

50 | P a g e
3.4.2 Framework
ISO 31000 (2009:8) states that the successful implementation of risk management
is dependent on the effectiveness of the management framework. The framework
should be incorporated throughout the organisation at all levels. Figure 3.3
illustrates these required relationships.
Figure 3.3:
Relationship between the components of the framework for managing risk
Source: ISO 31000 (2009)
This framework assists in managing risks effectively and ensures that risk
information from these processes is adequately reported. It should therefore be
used as a foundation for decision-making and accountability at all relevant
organisational levels.

51 | P a g e
3.5 RISK MANAGEMENT PROCESS
The details of the risk management process are shown in Figure 3.4.
Figure 3.4
Risk management process, in detail
Source: Australian/New Zealand Risk Management Standard (2004:13)
3.5.1 Assign responsibilities, mandate and commitment
King III (2009:73-80) argues there are 10 principles assigned to the board on the
subject of responsibilities in risk management:
Principle 1: “The board should be responsible for governance of risk.”

52 | P a g e
Principle 2: “The board should determine the levels of risk tolerance.”
Principle 3: “The risk committee or audit committee should assist the board in
carrying out its risk responsibilities.”
Principle 4: “The board should delegate to management the responsibility to
design, implement and monitor the risk management plan.”
Principle 5: “The board should ensure that risk assessments are performed on a
continual basis.”
Principle 6: “The board should ensure that frameworks and methodologies are
implemented to increase the probability of anticipating unpredictable
risk.”
Principle 7: “The board should ensure that management considers and
implements appropriate risk responses.”
Principle 8: “The board should ensure continual risk monitoring by management.”
Principle 9: “The board should receive assurance regarding the effectiveness of
the risk management process.”
Principle 10: “The board should ensure that there are processes in place enabling
complete, timely, relevant, accurate and accessible risk disclosure to
stakeholders.”
The ISO 31000 Standard (2009:4) states that the introduction of risk management
requires sturdy and determined commitment and strategic and rigorous planning
by the organisation’s management in ensuring dedication at all levels.
Management should, therefore:
� describe and approve the risk management policy;
� ensure alignment between the organisation's culture and the risk
management policy;
� agree on and align risk management performance indicators with the
organisation’s performance indicators;
� determine risk management objectives and align these with the
organisation’s strategies;
� ensure fulfilment of legal and regulatory requirements;

53 | P a g e
� assign accountabilities and responsibilities at all the suitable levels within
the organisation;
� assign essential resources to risk management; and
� communicate the benefits of risk management to all stakeholders.
The position paper from the Institute of Internal Auditors (IIA) (2002) maintains that
the foundation and cornerstone of effective corporate governance are the boards
of directors, senior management, internal auditors and external auditors. The most
important risk management roles and responsibilities are set out in Table 3.3
below.
Table 3.3:
Assign risk roles and responsibilities within corporate governance
Risk management
responsibilities Primary roles in corporate governance
Board of Directors No Apply and give strategic risk management direction and provide authority and supervision to senior management.
Senior Management Yes Is primarily responsible for ERM. It delegates risk management authority and specifies risk tolerance thresholds to specific risk owners. Reports ERM strategy, plans and performance results to the board of directors.
Risk Owners Yes Allocate applicable risk management authority and tolerance thresholds to assigned personnel and employees. Report performance results and plans to senior management.
Internal and external auditors
No Give independent, objective assurance to senior management and the board of directors about the effectiveness of risk management, controls and governance processes.
Source: Sobel and Reding (2004)
3.5.2 Determining the business objective
When entering into any new ventures, it is important to know what the objectives
are in terms of business growth, market, financial strengths, key players, and
short- and long-term goals. All these actions are transferable into risk
management. When assessing risk, all the contexts, as well as the scope, are
established. Consider and recognise the objectives of the organisation with regard

54 | P a g e
to risk management, scope of activity and the organisation operating environment.
(Cortez, 2010:54).
ISO 31000 (2009:10) highlights the importance of understanding and evaluating
the micro and macro environment of the organisation before the inception, design
and execution of the function of managing risk, since these contexts can
significantly influence the risk framework design.
Evaluating the organisation's macro (external) environment may incorporate, but is
not restricted to:
� the social and cultural, legal, regulatory, financial, technological, economic,
natural and competitive environment, whether international, national,
regional or local;
� key drivers and trends having an impact on the objectives of the
organisation; and
� external stakeholder relationships, perceptions and values.
Evaluating the organisation's micro (internal) environment may incorporate, but is
not restricted to:
� governance, organisational structure, roles and accountabilities;
� policies, objectives, and the strategies that are in place to achieve them;
� capabilities, understood in terms of resources and knowledge (e.g. capital,
time, people, processes, systems and technologies);
� information systems, information flows and decision-making processes
(both formal and informal);
� relationships with, and perceptions and values of, internal stakeholders and
the organisation's culture;
� standards, guidelines and models adopted by the organisation; and
� the form and extent of contractual relationships.
55 | P a g e
Key principles must be considered for risk assessments to yield meaningful results.
A risk assessment should start and end with comprehensive business objectives
that are well established within the key value drivers. These objectives will provide
the origin for measuring the impact and probability of risk ratings. Governance
throughout the assessment process should be clearly established
(PricewaterhouseCoopers, 2008:3).
Furthermore, PricewaterhouseCoopers (2008:6) argues that, apart from the scope
or mandate, risk assessments should collectively amalgamate functions and
parties to identify events that could possibly affect the organisation’s ability to
achieve its objectives, rate these risks, and establish adequate risk responses. To
determine the scope of the risk assessment, it is important to understand the
organisation’s objectives and the types of risk possible within the business
environment. Objectives may be broad (e.g. considering organisation-wide
strategic, operational, compliance, and reporting requirements) or more narrow
(e.g. relating to a product, process, or function such as supply chain, new product
sales, or regulatory compliance). Likewise, possible risks may span many
categories (e.g. market, credit, product, liquidity, and accounting when considering
credit crisis implications) or only a few if the discussion is more narrowly focused
(e.g. supplier risk). In conclusion, the scope may be enterprise-wide or limited to a
business unit or a particular geographical area.
According to the AS/NZ Standard (1999:8-9), prior to the commencement of a risk
management study, it is essential that the organisation and its capabilities must be
understood, including its goals and objectives and the applicable strategies that
exist in achieving them. This is important for the following reasons:
� Risk management occurs within the context of the goals, objectives and
strategies of the organisation.
� Failure to achieve the organisation’s objectives or possible project outcomes
is one set of risks which must be managed.

56 | P a g e
� Organisational policy and goals should define the criteria which define
whether a risk is acceptable or not, and this should form the basis of
treatment options.
3.5.3 Risk Identification
ISO 31000 (2009:17) suggests that any organisation ought to identify its possible
risks, applicable impact areas, their causes and the potential consequences. The
objective of this step is to populate a complete register of risks. The risk
identification is based on events that have the capability to generate, improve,
avoid, degrade, increase or interrupt the accomplishment of the business,
objectives. Wide-range recognition of risk is important, as any non-identifiable risk
will not be included in further analysis. Importantly, risks associated with not
pursuing an opportunity must be identified. The Identification process ought to
incorporate all risks, whether or not their cause is under the organisation’s control,
and even though the source or cause of the risk may not be evident. Risk
identification should include the examination of a domino effect of specific
consequences, including collective effects. Risk identification ought to consider an
extensive variety of consequences, even if the source or cause of the risk may not
be observable. All important causes and consequences should be considered. The
organisation ought to apply risk-identification tools and techniques linked to its
objectives and capabilities. All information must be up to date and relevant to the
organisation. Knowledgeable people and employees should be involved in the risk-
identifying process.
The AS/NZ standard (1999:12) confirms that this step is intended to identify the
possible risks to be managed within the organisation. An all-inclusive identification
process and the use of a systematic process are vital, because any probable risk
not acknowledged at this stage would be excluded from further analysis. The
identification process should include any risk under the control of the organisation.
The following techniques may apply:

57 | P a g e
� What can happen: The objective is to populate a comprehensive record of
events which may influence the organisation.
� How and why it can happen: Having identified a list of events, it is
essential to reflect on likely causes and scenarios. It is important that all
significant causes are presented.
� Tools and techniques: Risk-identification processes consist of checklists,
judgments and decisions made based on experience, records of history,
flow charts, brainstorming, systems analysis, scenario analysis and systems
engineering techniques. The nature of the activities under review will
dominate the applicable risk approach to be used.
COSO (2004:41) recommends that management envision and identify possible
events and what the influence will be on the company if the events do happen.
Management should also decide whether the events are associated with
opportunities or if they will negatively affect the company’s effectiveness in
accomplishing its business strategy and objectives. Risks are associated with
events with a negative impact and require management’s evaluation and response.
Opportunities are associated with events with a positive impact and management
incorporates these opportunities into its business strategy and objective-setting
processes.
3.5.4 Risk analyses and assessment
According to COSO (2004:49), risk assessment allows for consideration of the
degree of impact that the possible events may have on achievement of business
objectives. Management assesses events from two perspectives:
� likelihood and impact, using a mixture of qualitative and quantitative
methods; and
� examination of the potential events across the entity and their positive and
negative impacts, individually or by categories. Risks are assessed on an
inherent and a residual basis.

58 | P a g e
The AS/NZ standard (1999:7) implies that the analysis should consider the range
of potential consequences and how likely it is that those consequences will occur.
Analysis is done by determining the existing controls in terms of
outcome/consequence and probability/likelihood. Consequence and likelihood
could be combined to generate an anticipated level of risk.
Risk assessment involves risk identification followed by the formal valuation or
ranking. A template should be applied for recording accurate information about
each risk identified. The consequences of a risk materialising may be negative
(hazard risks), positive (opportunity risks), or may result in greater uncertainty.
Organisations need to develop suitable definitions for the different levels of
likelihood and the consequences associated with these different risks. Risk
rankings could be quantitative, semi-quantitative or qualitative in terms of the
likelihood of occurrence and the possible consequences or impact (IRM 2010:5).
ISO 31000 (2009:18) concurs that risk analysis involves a process of developing
an understanding of the risk. Risk analysis provides a guide to risk evaluation and
applicable decisions if the relevant risks need to be treated; it also includes the
main suitable risk management strategies and methods. Risk analysis provides
input into decision-making and applicable decision-making options involving the
different types and levels of risk. Risk analysis involves:
� consideration of the causes and sources of risk,
� positive and negative consequences of the risk and
� the likelihood of the occurrence of these consequences.
Factors that influence consequences and likelihood need to be recognised. Risk is
analysed in determining the consequences and their probability. It is important that
the interdependence of the different risks should to be considered.
59 | P a g e
3.5.5 Evaluation of risk
According to the AS/NZ standard (1999:15-16), risk evaluation is the comparison
of the level of risk established within the analysis process against a previously
established risk criterion. Risk analysis and the risk comparison criteria should be
considered on the same basis. Risk evaluations will generate a prioritised list of
risks for further action. The objectives and opportunities resulting from the risk
factor ought to be considered, and any decisions should take account of the risk
tolerance of the organisation. If the resulting risks fall into the low or acceptable
risk categories they may be accepted with minimal further treatment. Low and
acceptable risks should be monitored and periodically reviewed to ensure they
remain acceptable. High risk should be treated as indicated in the risk treatment
process.
The IRM (2010:5) expresses the view that evaluation of risks may be improved by
utilising a risk classification system. Risk classification systems are essential as
they allow an organisation to identify accumulations of related risks. Such a system
will also allow for the recognition of related strategies, tactics and operations that
are most vulnerable. Risk classification systems are not commonly relevant to all
types of organisations.
The objective of risk evaluation is to provide assistance in making decisions. This
is done based on the risk analysis outcomes, which indicate which risks need
treatment and suggest priorities for treatment implementation. Risk evaluation
involves comparing the level of risk found during the analysis process with risk
criteria established when the context was considered. Decisions are made
according to legal, regulatory and other applicable requirements. Risk treatment
and related decisions made are subject to the organisation's risk attitude. ISO
31000 (2009:18).

60 | P a g e
3.5.6 Risk treatment
According to ISO 31000 (2009:19), risk treatment involves “selecting one or more
options for modifying risks, and implementing those options”. Risk treatment
involves a regular process of:
� assessing a risk treatment;
� determining whether residual risk levels are tolerable;
� if not tolerable, generating a new risk treatment; and
� assessing the treatment effectiveness.
Figure 3.5 illustrates the risk treatment process that can be utilised within the
business environment.
Figure 3-5:
Risk treatment process
Source: AS/NZ standard (1999:17)
61 | P a g e
The AS/NZ standard (1999:16) proposes that risk treatment include rating
applicable risk options, assessing those options, preparing risk treatment plans
and implementing these plans.
Options, which are not necessarily mutually exclusive or appropriate in all
circumstances, include the following: (AS/NZ standard (1999:16))
� Risk avoidance:
o Deciding not to proceed with the activity.
o Risk avoidance can occur inappropriately due to an attitude of risk
aversion, resulting in the following:
� decisions made to evade or disregard risks despite the
available information;
� failure to treat risk;
� postponing decisions which the organisation cannot
circumvent; or
� selecting an option because it represents a potentially lower
risk, regardless of its benefits.
o Inappropriate risk avoidance may increase the significance of other
risks.
� Reduce the likelihood of the occurrence
� Reduce the consequences
� Transfer the risk:
o Sharing some part of the risk with other parties by contracts,
insurance arrangements and organisational structures such as
partnership and joint ventures.
� Retain the risk.
3.5.7 Risk measurement, monitoring and registers
According to the IRM (2010:15), risk assessments are to be recorded in a risk
register. There is no formal standard for layout of a risk register; the organisation is
supposed to create a suitable format for this essential document. The risk register

62 | P a g e
is not a static confirmation of the significant risks faced by the organisation and
should frequently be reviewed as a risk action plan. The plan should include
current controls and details of any further actions that are planned. These added
actions should be formulated as auditable actions, and a distinct timescale with
appointed responsibility assigned to individuals. Risk management must be
entrenched within the strategic planning as well as the budget processes.
ISO 31000 (2009:13) recognises that in order for risk management to be
successful and to continue to sustain organisational performance, the organisation
must:
� evaluate risk management performance against its indicators. It should be
periodically reviewed for appropriateness;
� periodically measure the progress vs. the risk management plan and
possible deviations from it;
� periodically evaluate whether the risk management framework, policy and
plan are still suitable, against the organisation’s external and internal
environment;
� report on risk, progress of the risk management plan and whether the risk
management policy is being followed; and
� review the efficiency of the risk management framework.
The AS/NZ standard (1999:20) affirmed the importance of monitoring risks, the
successful application of the risk treatment plan, the strategies applied and the
management system which is set up to control the implementation of the plan.
Risks and the effectiveness of control measures should be monitored to ensure
that varying circumstances do not change risk priorities. Few risks remain static.
Ongoing review is essential to ensure that the management plan remains relevant.
According to COSO (2004:75), there are two ways of monitoring: through ongoing
activities or separate evaluations. ERM mechanisms are generally prepared to
examine themselves on an ongoing basis. Management should have reasonable
assurance with regard to the effectiveness of enterprise risk management and

63 | P a g e
therefore requires frequent assessments. This reassessment is done to assist
management’s judgment in the implementing of controls.
The risk management process requires periodic or ad hoc monitoring and review
and should entail regular checking or surveillance. The responsibilities assigned for
monitoring and review should be clearly defined. The organisation's monitoring and
review processes must embrace all aspects of the risk management process for
the purposes of:
� ensuring that effective and efficient controls are implemented in both design
and operation;
� improving risk assessments by obtaining added information;
� analysing events and learning from them;
� detecting changes, external and internal, risk criteria and the risk itself; and
� identifying emerging risks.
In conclusion, it is recommended that the results of monitoring and review be
documented and reported (ISO 31000, 2009:20).

64 | P a g e
CHAPTER 4
THE ENTERPRISE RISK MANAGEMENT PROCESS
APPLIED IN A BUSINESS CASE STUDY
4.1 INTRODUCTION
The chapter serves to give an overview of the perceived risk of the company
chosen for this case study, Rubnic Oil, and the actual risk identified by the
researcher, followed by a discussion of the gap between the risk identified in the
Rubnic Oil business plan and the inherent risk identified through a systematic ERM
process.
4.2 RUBNIC OIL (PTY) Ltd: COMPANY BACKGROUND INFORMATION
Rubnic Oil contacted Sasol ChemCity, a business incubator, to assist them in
drafting a bankable business plan to be considered for funding by the Independent
Development Corporation of South Africa (IDC).
To provide insight into the background of the business, an excerpt from Rubnic
Oil’s business plan will follow.
4.2.1 Business description of Rubnic Oil
Rubnic Oil (Reg. No: 2007-028241/07) was previously known as Insol Solutions
(Reg. No: 1998-070198/23). This company was run by the Vermaak family and the
focus was on recycling of cleaner solvent, a chemical used in the paint industries.
The name was changed on 26 October 2007 to Rubnic Oil (PTY) Ltd, and its

65 | P a g e
shareholders were William Tsatsi (26%), Khorommbi Nelwamondo (25%), Phillip
Vermaak (29%) and Abrie Vermaak (20%). In late 2009, two of the directors
(Phillip and Abrie Vermaak) “sold” their shares to the remaining two directors at
Rubnic Oil. The payment for these shares will be made only when the company
makes a profit and the shares are to be made available to new equity partners.
With depleting crude oil stock and the effect of the crude oil price internationally,
recycling remains the most viable option. Capitalising on its existing technological
base, Rubnic Oil has identified this business opportunity. Rubnic possesses the
technological know-how to re-refine used lubricating oil back to its original form of
base oil, using a unique vacuum distillation process. This process, which has low
atmospheric emissions and immense process stability, will be patented upon
successful commissioning of the plant. Other products such as greases, rubber,
engine and hydraulic oils will also be produced. With generally low production
costs, high profit margins and basically no immediate opposition, Rubnic is
entering a niche market of opportunity. The company’s overall objective is to
satisfy the market segment that demands integrity and a quality product, and to
maintain a steady growth in sales volume that will sustain the company for more
than twenty years and create employment for 80 people.
Rubnic Oil focuses on the re-refining of used oil in South Africa. Rubnic Oil,
situated in Sasolburg, was formed with the aim of creating career opportunities for
willing, dynamic and capable people in light of the current economic situation,
where employment is in short supply and job creation is urgently needed.
The following were identified as Rubnic Oil’s strategic short-term and long-term
objectives:
� Short-term objectives (0-2 Years):
• Financial: Obtain funding to complete facility and achieve break-even production.
• Customer: Offer quality re-refined products.

66 | P a g e
• Internal processes: Adhere to relevant legal and Safety, Health,
Environmental, Risk and Quality (SHERQ) compliance. Optimise
efficiency. Establish the supply chain process.
• Skills and technology: Patent the process.
� Long-term objectives (3-10 Years):
• Financial: Increase profitability and achieve ROI.
• Customer: Increase customer base nationally and in Africa. Address
marketing needs.
• Internal processes: Receive ISO (International Organisation for
Standardisation) quality accreditation. Address operational and
resource efficiency.
• Skills and technology: Employ highly skilled staff in the solvent
recycling process.
4.2.2 Business risks as mentioned in Rubnic Oil’s business plan
In this business plan it was decided that a risk assessment would be completed
only after the completion of Rubnic Oil’s operations plant. During the feasibility
study the only possible risks foreseen were:
� the sourcing and price of obtained re-used oil;
� high transport costs; and
� technology which has not been tested and proved on a plant scale,
especially with regard to capacity.
This process of identifying risk used in this business plan did not follow a
recognised model.

67 | P a g e
4.3 ISO 31000, THE RECOMMENDED ENTERPRISE RISK MANAGEMENT MODEL
For the risk assessment of Rubnic Oil, the ISO 31000 standard (2009: 1) model
was used, because:
� This International Standard can be applied throughout the life of an
organisation.
� The model is applicable to a broad selection of activities, as well as
strategies and decisions, operations, processes, functions, projects,
products, services and assets.
� It can also be applied to any type of risk, no matter what its nature, whether
it has positive or negative consequences.
� This International Standard can be utilised to harmonise risk management
processes in existing and future standards.
� It provides a common approach in support of any other standards.
4.3.1 The risk management framework design
These are the risk process steps that were followed for the application:
� Step 1: Assign responsibilities, mandate and commitment.
� Step 2: Determine the business objective.
� Step 3: Conduct the risk assessment (identification, analysis and
evaluation).
� Step 4: Recommend risk treatment (analysis and mitigating
proposals). This will be discussed separately under the risk assessment of
each function.
The steps in the ERM process were adapted from the ISO 31000 model (Figure
3.1) and discussed in detail throughout Chapter 3. As part of the process, within
the design of the framework for risk management, a probability rating (Table 4.1),
an impact rating (Table 4.3) and a risk matrix diagram (Figure 4.2) are required.

68 | P a g e
Table 4.1:
Probability rating table
P1 P2 P3 P4 P5 P6 P7
QUALITATIVE DESCRIPTORS
Unforeseen Highly unlikely Very unlikely Low Possible Likely Almost Certain
PROBABILITY INTERVALS
0 - 1% 1 - 5% 5 - 10% 10 - 20% 20 - 50% 50 - 80% > 80%
Likelihood Definitions
The event is not foreseen to occur within the next 20 years
Small chance of the event occurring
once in every 20 years
The event may occur
once in every
10 - 20 years
The event may occur
once in every 5 - 10 years
The event may occur
once in every
2 - 5 years
The event is
expected to occur
within the next
1 - 2 years
The event will almost definitely occur at
least once or is
already occurring.
Source: adapted from a Sasol internal company document
“The risk probability rating table helps to forecast or describe the potential
likelihood of a risk event occurring” (Cortez, 2010:106).
“In risk management terminology, the word ‘likelihood’ is used to refer to the
chance of something happening, whether defined, measured or determined
objectively or un-objectively, qualitatively or quantitatively, and described using
general terms or mathematically (such as a probability or a frequency over a given
time period). NOTE 2: The English term ‘likelihood’ does not have a direct
equivalent in some languages; instead, the equivalent of the term ‘probability’ is
often used. However, in English, ‘probability’ is often narrowly interpreted as a
mathematical term. Therefore, in risk management terminology, ‘likelihood’ is used
with the intent that it should have the same broad interpretation as the term
‘probability’ has in many languages other than English” (ISO 31000, 2009:5).

69 | P a g e
Table 4.2:
Impact (severity) rating table
Impact Financial Safety & Health Environment HR Operations
I 1 < R100000
First aid / no injury
Limited impact within plant boundaries
Complaints/ dissatisfaction amongst workers
None
I 2 R100000- R250000
Medical treatment / restriction
Minor effects extending beyond boundaries of installation
Grievance Minor/ superficial damage to equipment No production loss
I 3 R250000- R600000
LWDC Moderate reversible short-term impact
Disputes/ marches/ organised stay-aways
Moderate damage to equipment/ facility Production loss < 1 week
I 4 R600000 - R1.0 m
Hospitalisation Serious but reversible short-term impact
High staff turnover
Major damage to facility Production loss <1 month
I 5
R1.0m - R1.5 m
Permanent disability
Local council fines
Skills shortage Future operations at site seriously affected >1 month loss
I 6
R1.5m - R4.5
One fatality Regional or national fines
Strike at facility Future operations untenable
I 7 >R4.5 m More than one fatality
Withdrawal of licence to operate
National union strike
Total loss of production
Source: adapted from a Sasol internal company document
“Severity is a risk management term that describes a potential loss when added
up, plus the cost associated with cleanup, contagion, and mitigation. From that
sum, subtract the amount of money you received, or saved, from the effect of
mitigation” (Cortez, 2010:98).

70 | P a g e
Figure 4.1:
Risk matrix plot diagram for application
IMP
AC
T (
imp
)
Imp 7 Level 4 Risk
Level 3 Risk
Level 3 Risk
Level 2 Risk
Level 1 Risk
Level 1 Risk
Level 1 Risk
Imp6 Level 4 Risk
Level 3 Risk
Level 3 Risk
Level 2 Risk
Level 2 Risk
Level 1 Risk
Level 1 Risk
Imp5 Level 5 Risk
Level 4 Risk
Level 3 Risk
Level 3 Risk
Level 2 Risk
Level 2 Risk
Level 2 Risk
Imp4 Level 6 Risk
Level 5 Risk
Level 4 Risk
Level 4 Risk
Level 3 Risk
Level 3 Risk
Level 3 Risk
Imp3 Level 6 Risk
Level 5 Risk
Level 5 Risk
Level 4 Risk
Level 4 Risk
Level 4 Risk
Level 4 Risk
Imp2 Level 6 Risk
Level 6 Risk
Level 6 Risk
Level 5 Risk
Level 5 Risk
Level 4 Risk
Level 4 Risk
Imp1 Level 6 Risk
Level 6 Risk
Level 6 Risk
Level 6 Risk
Level 6 Risk
Level 6 Risk
Level 6 Risk
PROBABILITY
P1 P2 P3 P4 P5 P6 P7
Source: adapted from a Sasol internal company document
The risk matrix (Figure 4.1) provides a quick snapshot of the risks, the likelihood of
each and the level of severity of each risk.
Risk matrices are created after each risk has been rated with respect to its
likelihood and its relative severity. Thereafter, it is plotted on a matrix of likelihood
or probability (X axis) versus impact (Y axis). Risk with both high impact and
high probability is high risk and, conversely, risk with low impact and
probability is rated as relatively low risk. The chart could be divided into
categories of risk. The high risk (top right corner), and the medium and low risk
(bottom left corner) are therefore grouped. The focus of the risk manager should

71 | P a g e
be on reducing the higher risk items (top right corner). The different levels of risk
are classified as follows:
� Level 1 to 2 risks are classified as primary risks and are rated high priority.
They are the critical risks that threaten the achievement of company objectives.
These risks are both significant in consequence and likely to occur. They
should be reduced or eliminated with preventative controls and should be
subject to control evaluation and testing. (Prevent at source).
� Level 3 to 4 risks are significant, but they are less likely to occur. Risk should
be monitored on a frequent basis. Detective controls should be put into place to
ensure that these high significance risks will be detected before they occur.
These risks are second priority. (Detect and monitor).
� Level 5 to 6 risks are unlikely to occur and not significant. They require
minimal monitoring and control unless subsequent risk assessments show a
substantial change, prompting a move to another risk category. (Low control).
The Rubnic Oil information applied in the risk assessment was obtained through an
interview with one of the business owners as well as by examining their business
plan, budget, financial forecasting and operational value chain. Because the
organisation had no policies or procedures, these could not be considered during
the data gathering.
4.4 RUBNIC OIL ENTERPRISE RISK MANAGEMENT ANALYSIS
4.4.1 Step 1: Assign responsibilities, mandate and commitment
The roles and responsibilities of the business directors are illustrated in Figure 4.2.
Distinct roles and responsibilities have been assigned to the portfolio of each one
of the directors (current scenario). The MD Financial (non-active member) and MD
Compliance are the current shareholders of Rubnic Oil. The marketing manager
also has an external role as the appointed agent for another company.

72 | P a g e
Figure 4.2:
Rubnic oil structure
Source: Rubnic Oil’s Business interview
Within this organisation it is apparent that some important functions in its business
design are not catered for. No provision was made for human resource
management, procurement, strategic planning or risk management. The lack of
these important functions could result in non-existent or inefficient procurement
policies, no signatories on procurement statements, no formal training, a lack of
cultural awareness, no change management, inefficient design of codes of conduct
and policy. Furthermore, no risk integration would occur during the strategic
planning processes.
No formal key performance indicators (KPIs) were available, although it is apparent
that actual production output compared to break-even financial analysis was
measured in the business operation.
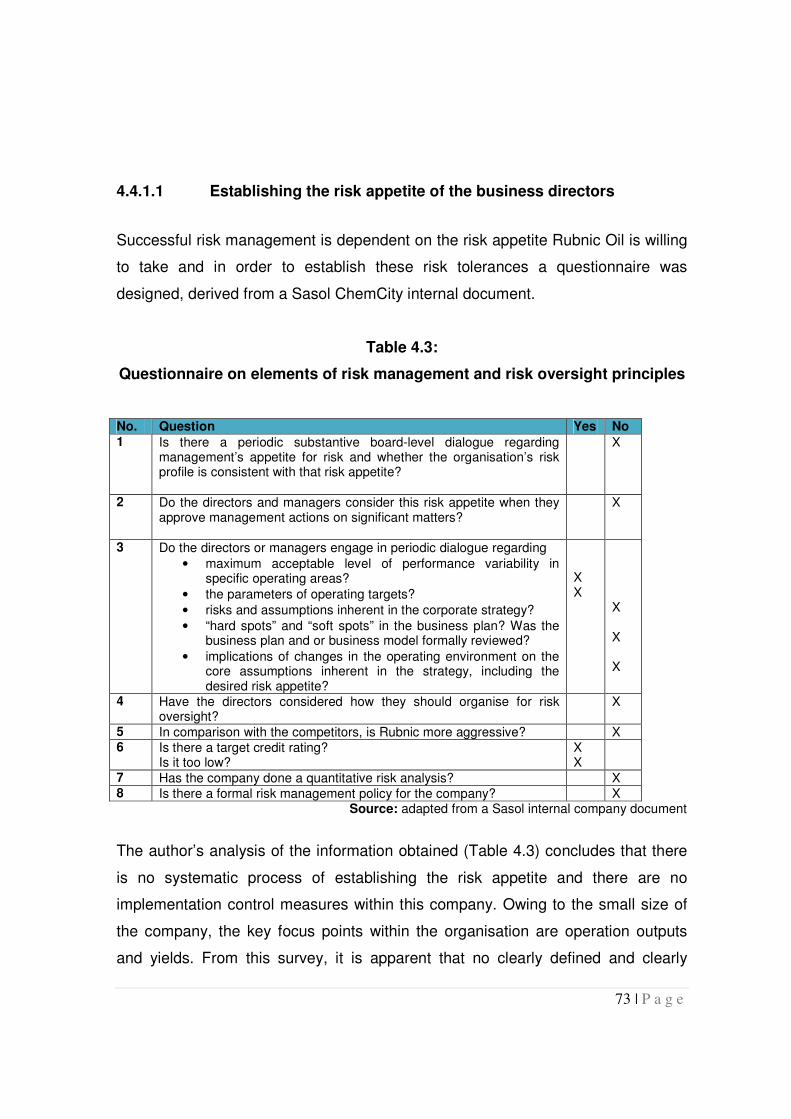
73 | P a g e
4.4.1.1 Establishing the risk appetite of the business directors
Successful risk management is dependent on the risk appetite Rubnic Oil is willing
to take and in order to establish these risk tolerances a questionnaire was
designed, derived from a Sasol ChemCity internal document.
Table 4.3:
Questionnaire on elements of risk management and risk oversight principles
No. Question Yes No 1 Is there a periodic substantive board-level dialogue regarding
management’s appetite for risk and whether the organisation’s risk profile is consistent with that risk appetite?
X
2 Do the directors and managers consider this risk appetite when they approve management actions on significant matters?
X
3 Do the directors or managers engage in periodic dialogue regarding
• maximum acceptable level of performance variability in specific operating areas?
• the parameters of operating targets?
• risks and assumptions inherent in the corporate strategy?
• “hard spots” and “soft spots” in the business plan? Was the business plan and or business model formally reviewed?
• implications of changes in the operating environment on the core assumptions inherent in the strategy, including the desired risk appetite?
X X
X X X
4 Have the directors considered how they should organise for risk oversight?
X
5 In comparison with the competitors, is Rubnic more aggressive? X 6 Is there a target credit rating?
Is it too low? X X
7 Has the company done a quantitative risk analysis? X 8 Is there a formal risk management policy for the company? X
Source: adapted from a Sasol internal company document
The author’s analysis of the information obtained (Table 4.3) concludes that there
is no systematic process of establishing the risk appetite and there are no
implementation control measures within this company. Owing to the small size of
the company, the key focus points within the organisation are operation outputs
and yields. From this survey, it is apparent that no clearly defined and clearly

74 | P a g e
communicated risk policy was incorporated after the start-up of the process. Some
gaps during the business incubating process resulted in a lack of emphasis being
placed on forecasting risk.
4.4.2 Step 2: Determining the business objective
4.4.2.1 External context
Due to the regulatory nature of the business, the macro environment of Rubnic Oil
has changed from what was described in the business plan, but the profile of
strengths, weaknesses, opportunities and threats (SWOT) stayed much the same
(Table 4.4).
Financial shortages occurred because of mismanagement of funds and
shareholders leaving the business. The new Rubnic Oil directors are on the
lookout for some external stakeholders and investment opportunities in the
business.
In establishing the external environment, it is imperative to guarantee that
stakeholders and their objectives will be considered when developing risk
management criteria and that externally generated threats and opportunities are
properly taken into account.
4.4.2.2 Internal context
Before a risk management activity is undertaken, it is necessary to understand the
business model and the operating functions. The business is under intense
pressure to optimise its current manufacturing operation and produce volumes for
sale. Rubnic Oil’s start-up was done without proper process manuals for all its
operations within the value chain. Although Rubnic Oil does have a simple
business model, the inherent culture of management was one of trial and error
after the departure of their key shareholder, who held the intellectual property
related to the operation. The current director, Mr Tstasi, has a positive attitude

75 | P a g e
regarding the training and education of the company’s personnel; however, this
training consists of on-the-job training, and no standard operating procedures exist
for any of the departments, namely, procurement, financial, marketing, operation
and quality control.
The current SWOT analysis is illustrated in Table 4.4
Table 4.4:
SWOT analysis
STRENGTHS WEAKNESSES
• Specialised process technology with high technical know-how
• Cost structure/efficient production process
• Location favourable - close to Sasol for sharing of technical and knowledge management
• Environmentally friendly process
• Strong relationship with key industries
• BBBEE compliant
• Little financial back-up
• Not an oil collector
• Lack of research funding
• Long product-development time.
• Poor brand awareness
• Need to comply with environmental and legal legislation
• Directors with key operational experience have left.
External
OPPORTUNITIES THREATS
• Emerging markets
• Growing demand
• Changing customer taste
• Expansion (exports) economies of scale (volume)
• Target farmers/agricultural sector
• Oil price fluctuation
• New competitors
• New technology
• Market saturation
• Suppliers of used oil must be Nora-SA accredited
• Larger collectors may have existing ties with current refiners
Source: Rubnic Oil business plan
Strategic risks and many other core operational and financial risks are usually
consolidated within the company’s SWOT analysis, where they can be easily
identified The SWOT analysis will also be used in the formal risk assessment of
Rubnic Oil.

76 | P a g e
4.4.3 Step 3: Risk assessment
4.4.3.1 External environment risks applicable to Rubnic Oil
To assist Rubnic Oil, branding and marketing materials have been developed by
Sasol ChemCity. The long-term strategy of Rubnic Oil is to:
� target national and African markets and
� incubate transport services to collect and deliver oil to the operation.
The risk assessment of the influences of the external environment (macro
environment) on Rubnic Oil is shown in Table 4.5.
Table 4.5:
External environment risk register
No. Function Risk No.
Risk Related to Hazard (Activity) / Incident Scenario
Probable causes
Consequence P I R
External environment
1.1 Economic 1A Organisation’s clients suffer financial hardship
Financial crisis
Debt increase Financial losses Losing sales
5 6 2
1B Electricity supply malfunction and load shedding (ESCOM)
ESCOM load shedding
Process stoppages Financial losses Improper process planning
6 6 1
1C Price fluctuation (Metal, feed material)
Economy of scale
Input cost price increase or decrease
6 2
4
1.2 Natural environment
2A Natural disasters (floods, winds)
Acts of God Process stoppages Financial losses
3 5 3
1.3 Political 3A Changes in tax laws that may affect the operation
Regulation changes
Fines and penalties 2 3
5
3B Legal landscape of the business might change
Regulation changes
Fines and penalties 6 6
1
1.4 Social 4A Impact of negative coverage from media, government, labour and other stakeholders
Negative situations at site
Poor public image Negative impact on shareholder perspective Financial impact
3 7 3
4B ROSE Foundation creates a negative impact on the operating environment
Negative situations in industry Lack of governance by ROSE Foundation
Poor public image Negative impact on shareholder perspective Financial impact
1 7
4

77 | P a g e
Figure 4.3:
External environment risk matrix plot diagram IM
PA
CT
Imp7
Level 4 Risk Level 3
Risk
Level 3 Risk Level 2
Risk Level 1
Risk Level 1 Risk
Level 1 Risk
Imp6 Level 4
Risk Level 3
Risk Level 3
Risk Level 2
Risk
Level 2 Risk
Level 1 Risk
Level 1 Risk
Imp5 Level 5
Risk Level 4
Risk Level 3
Risk
Level 3 Risk Level 2
Risk Level 2 Risk
Level 2 Risk
Imp4 Level 6
Risk Level 5
Risk Level 4
Risk Level 4
Risk Level 3
Risk Level 3 Risk
Level 3 Risk
Imp3
Level 6 Risk Level 5
Risk Level 5
Risk Level 4
Risk Level 4
Risk Level 4 Risk
Level 4 Risk
Imp2 Level 6
Risk Level 6
Risk Level 6
Risk Level 5
Risk
Level 5 Risk Level
4 Risk Level 4
Risk
Imp1 Level 6
Risk Level 6
Risk Level 6
Risk Level 6
Risk Level 6
Risk Level 6 Risk
Level 6 Risk
PROBABILITY
P1 P2 P3 P4 P5 P6 P7
Analysis and mitigation proposals (Step 4: risk treatment)
The excessively high strategic risk (level 1 and 2) applicable to the current
business and which may require immediate action is located in:
� Load shedding or power failure for excessively long periods. This will have a
severe impact on the business output and operating performance.
� The threat of legal changes is actually noted in the business plan. The risk
regarding applicable legal changes is due to the nature of the business and
operation (waste oil recycling). The current high frequency of changes by
government in relation to environmental management, such as the Clean Air
Bill and carbon tax laws, as well as national standards and applicable by-
laws, will have a major impact on the business and good corporate
governance requirements as described in KING III.
The risk of load shedding cannot be avoided or transferred but the impact of the
risk could be reduced by installing back-up equipment and evaluating energy-
1A 1B
1 C
2A
3A
4A 4B
3B

78 | P a g e
efficient implementation. This mitigation mechanism would be costly and may not
be viable at the moment.
The proposed treatment plan of mitigating possible legal changes can be done by
continuously monitoring the legal landscape associated with this industry. Sasol
ChemCity, the business incubator assigned to Rubnic Oil, is in a position to
provide assistance and to forward relevant legal drafts that are distributed for
public comment.
4.4.3.2 HR and personnel risk
Rubnic Oil creates numerous job opportunities, contributing to economic
development in Sasolburg. A further opportunity to incubate new collectors of used
oil will result in further job creation.
Table 4.6:
HR and personnel risk
No. Function Risk No.
Risk Related to Hazard (Activity)
Probable Causes
Consequence P I R
2.1 HR & personnel
A Lack of employee data integrity
Lack of management control of overtime worked
Legal non-compliance with Basic Conditions of Employment Act Injuries due to fatigue Excessive labour cost
4 3 4
B Lack of employment policies and operation requirements for employment
Lack of skilled resources to do the work
Legal non-compliance with Basic Conditions of Employment Act Uncontrolled strikes
4 5 3
C Compensation Employee dissatisfaction leads to higher staff turnover
High staff turnover 3 6 3
D Recognition Employees feel unrecognised, resulting in reduced focus on error rates
High incident and error rates
5 5 2

79 | P a g e
Figure 4.4:
HR and personnel risk matrix plot diagram
IMP
AC
T
Imp7 Level 4
Risk Level 3
Risk Level 3
Risk Level 2
Risk Level 1
Risk Level 1 Risk
Level 1 Risk
Imp6 Level 4
Risk Level 3
Risk
Level 3 Risk Level 2
Risk Level 2
Risk Level 1 Risk
Level 1 Risk
Imp5 Level 5
Risk Level 4
Risk Level 3
Risk
Level 3 Risk
Level 2 Risk Level
2 Risk Level 2
Risk
Imp4 Level 6
Risk Level 5
Risk Level 4
Risk Level 4
Risk Level 3
Risk Level 3 Risk
Level 3 Risk
Imp3 Level 6
Risk Level 5
Risk Level 5
Risk
Level 4 Risk Level 4
Risk Level 4 Risk
Level 4 Risk
Imp2 Level 6
Risk Level 6
Risk Level 6
Risk Level 5
Risk Level 5
Risk Level 4 Risk
Level 4 Risk
Imp1 Level 6
Risk Level 6
Risk Level 6
Risk Level 6
Risk Level 6
Risk Level 6 Risk
Level 6 Risk
PROBABILITY
P1 P2 P3 P4 P5 P6 P7
Analysis and mitigation proposals (Step 4: risk treatment)
The associated risk as plotted in the risk matrix is mostly in the medium (C and D)
risk category. Lack of job recognition (D) is foreseen as a high risk. The mitigation
suggestion for the human resource (HR) intervention should not be implemented in
isolation and the management mitigation plan should be holistically approached
and include all the risks identified under HR and personnel risk (A,B,C and D).
Rubnic Oil should therefore:
� Design and implement HR policies including, but not limited to:
• general policies relating to employee recognition programmes,
alcohol and drugs, working hours, performance planning and
evaluation, and
A
B
C
D

80 | P a g e
• compensation management with regard to holidays, remuneration,
leave policies and sick leave.
� Make deliberate efforts to develop the ability to:
• select people with essential knowledge and skills,
• upgrade or expand individual abilities,
• mould work products of individuals into a cooperative effort to create
organisational ability and
• create intellectual capital.
� Design a strategy for workforce planning and implementation.
� Evaluate the job design requirements, evaluating skill requirements, skill
variety, autonomy, task significance and task identification.
� Execute effective principles in the management of people, such as:
• behaviour modification,
• group thinking,
• reward systems,
• contingency planning for critical jobs, and
• managing individual and group performances.
4.4.3.3 Operation and production risk
With the capital borrowed, the company managed to complete only a section of the
plant. The upstream process of dewatering, defueling and thermal cracking is not
complete as piping and a new thermal cracker is required. The downstream
process has in the interim been used to re-refine used oil at a reduced rate. The
filter is the major bottleneck, largely due to the heavy components that should have
been removed in the centrifuge after the thermal cracking process.

81 | P a g e
Table 4.7:
Operations risk
No. Function Risk No.
Risk Related to Hazard (Activity)
Probable Causes Consequence P I R
2.2 Operation and production
A Operation process changes and re-engineering
Process modification and design changes without adequate change management policies or procedures
-Material damage Reduction production yield
7 5 2
B No lean production and manufacturing
High process waste JIT principles not applied
Inventory allocated into capital Cash flow problems
7 6 1
C High storage and inventory cost
No value chain mapping done Inappropriate production forecasting
Inventory allocated into capital Cash flow problems
7 5 2
D Delivery output not met
Production stoppages Production yields not met Inappropriate forecasting
Losing market share Financial
6 4 3
E Poor product quality Poor process design Lack of skilled labour Poor quality control
High rework Process wastes
5 3 4
F Poor maintenance control vs. critical equipment
No maintenance plan Lack of available equipment
Break stoppages Lack of data integrity Theft
5 4 3
G DOWNSTREAM -No contractual or service level agreement exists for vendors, clients and/or agents No market or reduction in market
Too reliant on the agent to sell product No market analysis
High inventory of final products
5 6 2
H Poor process output yields
Process management system does not exist High process waste Process quality
No yield calculations or monitoring plan
6 7 1
I UPSTREAM -Supplier of feedstock /critical equipment not being able to supply
No agreements with suppliers regarding critical equipment, feedstock. Sole supplier
No supplier profiles
5 5 2
J New technology and process design not working according to the R&D
R&D simulation not reflecting working conditions External environment influencing the operation Engineering design malfunction
Re-design required Loss of capital
4 7 2

82 | P a g e
Figure 4.5:
Operations and production risk matrix plot diagram
Analysis and mitigation proposals (Step 4: risk treatment)
It is evident that 80% of all the risk within the operations and manufacturing
function is classified as high risk and 20% is classified as medium risk. The high
risk identified which falls in levels 1 and 2 is located in the following:
� No lean production and manufacturing exists, which may result in
uncontrollable design changes without proper management of change
principles. This could result in a trial-and-error approach;
� Capital for operations is held in inventory or feed material because of
inappropriate production forecasting;
� The process design desired output is not being met;
� No customer agreements are in place;
� No service level agreements are in place with applicable agents or
feedstock suppliers (filters);
� The technical design of the process is not performing as simulated in the
piloted version.
Level 4 Level 3 Level 3 Level 2 Level 1
Level 1 Level 1 I7
Level 4 Level 3 Level 3 Level 2
Level 2 Level 1 Level 1
I6
Level 5 Level 4 Level 3 Level 3 Level 2 Level 2 Level 2
I5
Level 6 Level 5 Level 4 Level 4
Level 3 Level 3 Level 3 I4
Level 6 Level 5 Lel 5 Level 4
Level 4 Level 3 Level 3 I3
Level 6 Level 6 Level 6 Level 5 Level 5 Level 4 Level 4 I2
Level 6 Level 6 Level 6 Level 6 Level 6 Level 6 Level 6 I1
P1 P2 P3 P4 P5 P6 P7
J
I
H
G
F
E
D C
B
A

83 | P a g e
The potential sources of the operations risk were compiled and categorised as
described by Cortez (2010:204) and commonly known as the 4ME:
� materials: raw materials, wrong material for the job or lack of material;
� machinery/equipment: incorrect selection, poor design or maintenance,
defective equipment;
� environment: poor job design or work layout;
� management: no or poor management involvement, inattention to task,
stress demands, lack of process;
� methods: no or poor operating procedures, practices different form written
procedures, poor communication; and
� management systems: lack of training or education, poor employee
involvement, poor recognition of hazards, previously identified hazards not
eliminated.
The control or mitigation of any operation and manufacturing risks, especially
during business start-up, is not easy. Within the operations environment many
methods of risk mitigation are imperfect and two primary means of reducing the
likelihood of an operational risk event are insurance and outsourcing methods like
contracting (Cortez, 2010:205). Furthermore, the researcher recommends the
following mitigation methods for managing operations risks:
� Implementation of a business continuity plan and manual. The manual
should include the following key information:
• technical operating requirements,
• regulatory reporting requirements,
• critical staff contact information,
• contact information of general staff,
• contact information of clients and vendors,
• off-site data back-up and file storage,
• copies of insurance contracts and
• a list of critical material.
� Analysis of potential threats, impact scenario planning.

84 | P a g e
� Solution design, identifying the most cost-effective method to support the
main requirements identified during the impact analysis.
Some simple methods of risk mitigation are good corporate governance and
assigned responsibilities. It is apparent that the responsibility for operations
function is accounted for in the business organisation structure (Figure 4.3);
however, this position is responsible for the manual implementation or policy
making and managing the diverse potential exposures and choices, including:
� technology choices: batch versus real time, and
� timing of payment and delivery.
The operations manager should also apply lean manufacturing implementation
principles:
� Kanban pull: demand pull, reducing lot sizes;
� work with vendors: reduce lead times, frequent deliveries, project usage
requirements and quality expectations;
� reduce inventory: in storage and in transit;
� improve product design: standard product configuration, match process
design with product design, meet quality expectations;
� concurrently solve problems: root cause analysis, team approach,
continual education; and
� measure performance: emphasise improvements, track trends.
4.4.3.4 Technology Risk
Historically, the most successful technology for treating used oils was the acid-clay
process. With new legislation, the sludge is classified as a hazardous waste
requiring proper management and disposal. Consequently, the acid-clay process
technology has become uneconomical because of the high cost of managing the
residues, and its use is therefore diminishing.
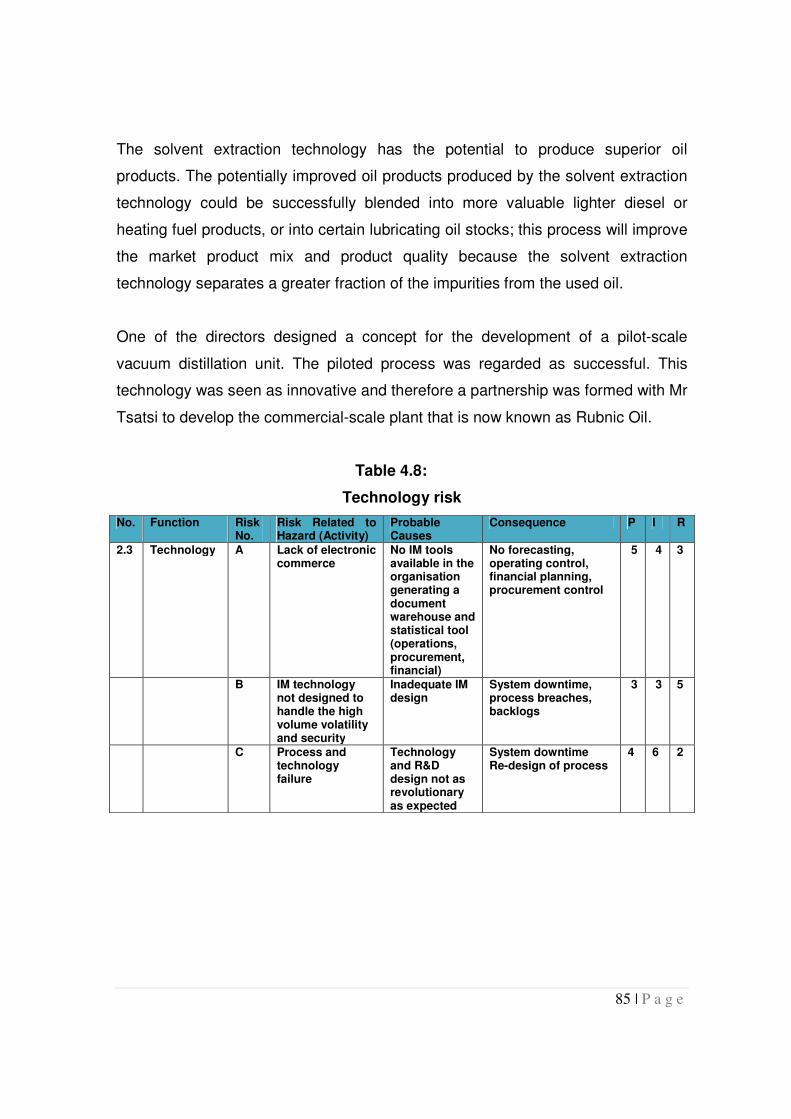
85 | P a g e
The solvent extraction technology has the potential to produce superior oil
products. The potentially improved oil products produced by the solvent extraction
technology could be successfully blended into more valuable lighter diesel or
heating fuel products, or into certain lubricating oil stocks; this process will improve
the market product mix and product quality because the solvent extraction
technology separates a greater fraction of the impurities from the used oil.
One of the directors designed a concept for the development of a pilot-scale
vacuum distillation unit. The piloted process was regarded as successful. This
technology was seen as innovative and therefore a partnership was formed with Mr
Tsatsi to develop the commercial-scale plant that is now known as Rubnic Oil.
Table 4.8:
Technology risk
No. Function Risk No.
Risk Related to Hazard (Activity)
Probable Causes
Consequence P I R
2.3 Technology A Lack of electronic commerce
No IM tools available in the organisation generating a document warehouse and statistical tool (operations, procurement, financial)
No forecasting, operating control, financial planning, procurement control
5 4 3
B IM technology not designed to handle the high volume volatility and security
Inadequate IM design
System downtime, process breaches, backlogs
3 3 5
C Process and technology failure
Technology and R&D design not as revolutionary as expected
System downtime Re-design of process
4 6 2

86 | P a g e
Figure 4.6:
Technology risk matrix plot diagram
Analysis and mitigation proposals (Step 4: risk treatment)
If any process technology or research and development (R and D) applications and
variables are not applied or tested to the maximum capacity, there is a risk of non-
performance. Although the business plan states that Rubnic Oil’s process is
revolutionary and groundbreaking, the risk of technology failure is high (level 2).
The risk (rating C) of process and technology is high because if the incident does
occur, it will have a serious impact (level 6 rating). It will most likely have an
irreversible effect on the sustainability of the business. The technology process
was tested only in a pilot plant and not on a large scale at full capacity.
Level 4 Level 3 Level 3 Level 2 Level 1 Level 1 Level 1 I7
Level 4 Level 3 Level 3 Level 2
Level 2 Level 1 Level 1 I6
Level 5 Level 4 Level 3 Level 3 Level 2 Level 2 Level 2 I5
Level 6 Level 5 Level 4 Level 4
Level 3 Level 3 Level 3 I4
Level 6 Level 5
Lel 5 Level 4 Level 4 Level 3 Level 3 I3
Level 6 Level 6 Level 6 Level 5 Level 5 Level 4 Level 4 I2
Level 6 Level 6 Level 6 Level 6 Level 6 Level 6 Level 6 I1
P1 P2 P3 P4 P5 P6 P7
B
A
C

87 | P a g e
4.5.3.5 Procurement and infrastructure risk
Table 4.9:
Procurement and infrastructure risk
No. Function Risk No.
Risk Related to Hazard (Activity)
Probable Causes
Consequence P I R
2.4 Procurement and infrastructure
A Unreliable supply of raw material / consumables
Planning inadequacy Late deliveries Procurement delays
Process downtime Poor service delivery
5 6 2
B Uncontrolled procurement occurrences (orders, payments)
No procurement policies and operating controls implemented Co-signatories
Financial loss 6 5 2
C Lack of supply chain infrastructure
No supply chain strategy plan
Infrequent feedstock delivery to operation and customers
4 4 4
Figure 4.7:
Procurement and infrastructure risk matrix plot diagram
Level 4 Level 3 Level 3 Level 2
Level 1 Level 1 Level 1 I7
Level 4 Level 3 Level 3 Level 2 Level 2 Level 1 Level 1 I6
Level 5 Level 4 Level 3 Level 3 Level 2
Level 2 Level 2 I5
Level 6 Level 5 Level 4 Level 4
Level 3 Level 3 Level 3 I4
Level 6 Level 5 Lel 5 Level 4 Level 4 Level 3 Level 3 I3
Level 6 Level 6 Level 6 Level 5 Level 5 Level 4 Level 4 I2
Level 6 Level 6 Level 6 Level 6 Level 6 Level 6 Level 6 I1
P1 P2 P3 P4 P5 P6 P7
C
B
A

88 | P a g e
Analysis and mitigation proposals (Step 4: risk treatment)
Most of the high risk associated with the procurement environment has negative
consequences such as medium- to long-term operation shutdown or financial
losses due to the unavailability of process material. This risk is common to new
business development because of the lack of procurement policies, assigned
responsibilities, information management tools, business software tools, inventory
re-ordering points, capital expenditure limitations and operating procedures
incorporated within the business start-up. This lack of procurement management
tools is usually not transformed from idea generation to implementation in the
business operation.
4.4.3.6 Financial Risk
Table 4.10:
Financial risk
No. Function Risk No.
Risk Related to Hazard (Activity)
Probable Causes Consequence P I R
2.5 Financial A No funds (cash flow) available to manage the operation
Gearing ratio too high Mismanagement of funds
Cash-out Liquidation
5 6 2
B Mismanagement of funds
Lack of financial strategy vs. capital budgeting (start-up to operation control)
Cash-out Liquidation
5 6 2
C No or minimum funds available for operation start-up
Poor capital budget forecasting (business plan)
Cash-out Liquidation
4 6 2
D Credit risk Creditors fail to meet their obligations
Financial loss 6 4 3
E Fraud Inadequate financial control (co-signatories) Internal audits lacking
Financial loss 6 5 2
There are currently only two directors (William Tsatsi and Khorommbi
Nelwamondo) and about 10 employees on site. The company started out as a 51%

89 | P a g e
black-owned company; however, two of the directors (operations) have left and a
49% shareholding is now available.
Figure 4.8:
Financial risk matrix plot diagram
Analysis and mitigation proposals (Step 4: risk treatment)
Four of the five financial risks (80%) fall within the high-risk group:
� no funds available to manage the operation (cash flow problems);
� mismanagement of funds;
� no funds available for operation start-up; and
� fraud.
Mismanagement of funds created cash flow problems during the physical start-up
of the business. This was due to inappropriate budget forecasting and
inappropriate control measures implemented regarding assigned responsibilities
and financial indicators.
Level 4 Level 3 Level 3
Level 2 Level 1 Level 1 Level 1 I7
Level 4 Level 3 Level 3 Level 2 Level 2
Level 1 Level 1 I6
Level 5 Level 4 Level 3 Level 3 Level 2 Level 2
Level 2 I5
Level 6 Level 5 Level 4 Level 4 Level 3 Level 3
Level 3 I4
Level 6 Level 5 Lel 5 Level 4 Level 4 Level 3 Level 3 I3
Level 6 Level 6 Level 6 Level 5 Level 5 Level 4 Level 4 I2
Level 6 Level 6 Level 6 Level 6 Level 6 Level 6 Level 6 I1
P1 P2 P3 P4 P5 P6 P7
C B
A
E
D

90 | P a g e
According to COSO (2004:87), within the components of enterprise risk
management, it is apparent that the chief financial officer is an important role
player in establishing objectives and strategy decisions, analysing risks, and
making decisions on how changes affecting the business will be managed. He or
she provides valuable input and direction and is positioned to focus on monitoring
and following up on decisions.
It is recommended that the financial executive of Rubnic Oil should develop an
entity-wide budget and appropriate financial plan. These plans should undergo
frequent track and performance analyses from operations, compliance, and
reporting perspectives.
Cortez (2010: 191) recommends certain procedures to mitigate this risk:
� Restrict the amount of capital lending. This will reduce the exposure
limits.
� Reduce the amount of stop loss limits. Keep a running count of losses and
apply limits to manufacturing, trading and take immediate remedial action.
� Combine buffers and reserves by setting aside money for expected loss
(reserves) and unexpected loss (capital and buffers).
� Apply financial hedging through contracting the demand for the product.
To apply this type of risk mitigation it is advisable to have inventory on hand.
4.4.3.7 Market Risk
Cortez (2010:320) describes market risk as “exposure to potential loss that results from changes in market prices and rates.” According to the business plan there are a few barriers to entering the waste oil
refining market, such as:
� higher feedstock prices paid;
� low demand for re-refined used oil;
� prices demanded by used oil collectors too high; and

91 | P a g e
� misconceptions in the market regarding the quality of used oil and its impact
on motor vehicles, equipment and machinery.
In Table 4.11, the analysis of competitors within the industry illustrates that the
competition in the used oil treatment facilities is highly diversified.
Table 4.12:
Rubnic Oil competitor analysis
Factor Rubnic Oil Competitor A Competitor B
Technology Process used oil to
original state
Treat, purify and process used lube oil into
various grades of industrial fuel oil
Process used oil into
industrial grade furnace fuel
Source: Rubnic Oil business plan
The recovery and recycling processes of Rubnic Oil’s competitors (Table 4.12)
range from simple collection and delivery for use as burner fuel to more
technologically advanced processes such as re-refining to lubricant products.
Products will be sold ex-factory to agents and not direct to end users. Contracts
with agencies will be developed.
No promotion strategy has been established for Rubnic Oil.

92 | P a g e
Table 4.12:
Market Risk
No. Function Risk No.
Risk Related to Hazard (Activity)
Probable Causes
Consequence P I R
2.6 Market risk
A No demand for the product
Not enough client base
No sale Drop in selling price
3 5 3
B Product selling price reduced by the agent
Differences in supply and demand
Profit margin decreased
3 4 4
C Selling done through sole agent
Little control over marketplace
Inflexible sales forecasting
7 3 3
D No demand for a specific product (one product in the basket)
Product mix not diversified
No sales resulting in negative profit margins
3 6 3
E Increased competition
New market entrant
Reduction in sales Loss in market share
3 6 3
Figure 4.9:
Market risk matrix plot diagram
Level 4 Level 3 Level 3 Level 2 Level 1 Level 1 Level 1 I7
Level 4 Level 3 Level 3
Level 2 Level 2 Level 1 Level 1 I6
Level 5 Level 4
Level 3 Level 3 Level 2 Level 2 Level 2 I5
Level 6 Level 5
Level 4 Level 4 Level 3 Level 3 Level 3
I4
Level 6 Level 5 Lel 5 Level 4 Level 4 Level 3 Level 3 I3
Level 6 Level 6 Level 6 Level 5 Level 5 Level 4 Level 4 I2
Level 6 Level 6 Level 6 Level 6 Level 6 Level 6 Level 6 I1
P1 P2 P3 P4 P5 P6 P7
C
B
A
D E

93 | P a g e
Analysis and mitigation proposals (Step 4: risk treatment)
The Rubnic Oil market risks are all categorised as medium risk and do not pose a
major threat to the business. The responsibility of creating a market demand and
selling the product is dependent on the appointed agent. An agent is accredited by
the National Oil Recycling Association of South Africa (NORA–SA), which also
regulates the market analysis and client registrations database. Rubnic Oil should
diversify the client market and product mix to minimise a potential threat.
4.4.3.8 Strategic Risk
Table 4.13:
Strategic Risk
No. Function Risk No.
Risk Related to Hazard (Activity)
Probable Causes Consequence P I R
2.7 Strategic Risk
A Skilled directors - (technology, operation) IP knowledge leaving the business
Financial constraints
No contingency planning
4 7 2
B Industry threats increased (Porter 5 forces)
No strategic plan and business model exist Business plan not amended
Market share loss
3 4 4
C No strategic plan or scenario planning with milestone management for the business exists
No balance scorecard, KPI and milestone management planning
Market share loss
6 4 3

94 | P a g e
Figure 4.10:
Strategic risk matrix plot diagram
Analysis and mitigation proposals (Step 4: risk treatment)
Only one risk is rated as relatively high (level 2), namely skilled directors. The risk
of directors leaving the business with knowledge or intellectual property (IP) during
or after the start-up of the business will have a severe impact on the sustainability
of the business. The revolutionary process, as described in the business plan, has
not been tested in full. Furthermore, the knowledge of how to implement the
process is linked to a specific director.
In line with the recommendations of Cortez (2010:185) in order to mitigate strategic
risks Rubnic must:
� conduct an industry analysis to evaluate the relationship between the
industry and Rubnic Oil, and
� increase awareness of the market, industry and consumers.
Level 4 Level 3 Level 3
Level 2 Level 1 Level 1 Level 1 I7
Level 4 Level 3 Level 3 Level 2 Level 2 Level 1 Level 1 I6
Level 5 Level 4 Level 3 Level 3 Level 2 Level 2 Level 2 I5
Level 6 Level 5
Level 4 Level 4 Level 3
Level 3 Level 3 I4
Level 6 Level 5 Lel 5 Level 4 Level 4 Level 3 Level 3 I3
Level 6 Level 6 Level 6 Level 5 Level 5 Level 4 Level 4 I2
Level 6 Level 6 Level 6 Level 6 Level 6 Level 6 Level 6 I1
P1 P2 P3 P4 P5 P6 P7
C B
A

95 | P a g e
4.4.3.9 Safety and security risk
Table 4.14:
Safety and security risk
No. Function Risk No.
Risk Related to Hazard (Activity)
Probable Causes Consequence P I R
2.8 Safety and security
A Lack of safety standards resulting in accidents
Non-compliance with internal and external safety standards applicable to the operation
Injuries, accidents,
6 6 1
B Fraudulent activities and theft
Lack of control, standards
Financial loss 6 4 3
C Unplanned disasters Uncontrollable events (fire, environmental spillages) Poor housekeeping
Process stoppages, financial loss, loss of market share
2 4 5
D Exposure of personnel to hazardous chemical substances, equipment and dangerous working environments
Lack of control Hazards not identified Non-adherence to PPE
Process stoppages, injuries, equipment damage
5 2 5
Figure 4.11:
Safety and security risk matrix plot diagram
Level 4 Level 3 Level 3 Level 2 Level 1 Level 1 Level 1 I7
Level 4 Level 3 Level 3 Level 2 Level 2 Level 1
Level 1 I6
Level 5 Level 4 Level 3 Level 3 Level 2 Level 2 Level 2 I5
Level 6 Level 5 Level 4 Level 4 Level 3
Level 3 Level 3 I4
Level 6 Level 5 Lel 5 Level 4 Level 4 Level 3 Level 3 I3
Level 6 Level 6 Level 6 Level 5 Level 5 Level 4 Level 4 I2
Level 6 Level 6 Level 6 Level 6 Level 6 Level 6 Level 6 I1
P1 P2 P3 P4 P5 P6 P7
C B
A
D
96 | P a g e
Analysis and mitigation proposals (Step 4: risk treatment)
Twenty five percent of the associated risk applicable to safety and security is
assessed as high risk due to its high probability and high impact capability. The
formal interview with Mr Tsatsi confirms that although the site operation did assign
safety and legal responsibilities to a director, there was no evidence of safety
standards or their strategic implementation. Any safety malpractice resulting in loss
of life can result in operational stoppages for an extended period of time. The
medium to low tolerable risk can be mitigated by applying Safety, Health and
Environmental (SHE) standards. The implementation of SHE standards could
could provide assurance of compliance with applicable legislation. It is also a
tool to enable the business to mitigate its operational and environmental risk
through implementing operating procedure and environmental landscape analyses.
4.4.3.10 Legal and environmental risk
The company requires additional funding to pave and bund the process area, to
install a water treatment plant and to ensure compliance with legal and
environmental standards with regard to emissions. This was not catered for in the
feasibility study or the business plan.
Several by-products are formed in the vacuum distillation process. The Waste Act
(No. 59 of 2008) seeks to encourage the prevention and minimisation of waste
generation, while promoting reprocessing of the waste and recommending that
disposal of waste to landfill be considered only as a last resort. A few
environmental emissions to the atmosphere and a water effluent stream have been
identified. Suitable equipment (a chiller and water scrubber) is required in order to
comply with applicable environmental standards.
The company’s intent is to follow all applicable legislation. This includes adhering
to the regulations of the Occupational, Health and Safety Act (OHSA), all
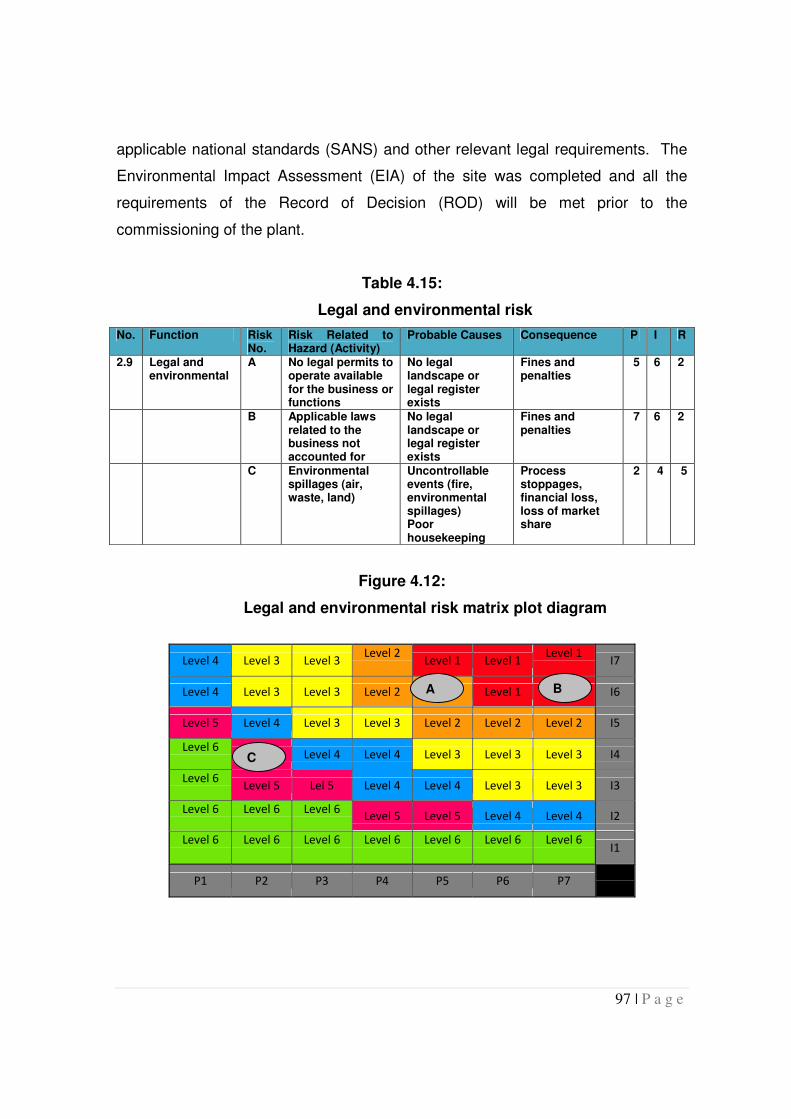
97 | P a g e
applicable national standards (SANS) and other relevant legal requirements. The
Environmental Impact Assessment (EIA) of the site was completed and all the
requirements of the Record of Decision (ROD) will be met prior to the
commissioning of the plant.
Table 4.15:
Legal and environmental risk
No. Function Risk No.
Risk Related to Hazard (Activity)
Probable Causes Consequence P I R
2.9 Legal and environmental
A No legal permits to operate available for the business or functions
No legal landscape or legal register exists
Fines and penalties
5 6 2
B Applicable laws related to the business not accounted for
No legal landscape or legal register exists
Fines and penalties
7 6 2
C Environmental spillages (air, waste, land)
Uncontrollable events (fire, environmental spillages) Poor housekeeping
Process stoppages, financial loss, loss of market share
2 4 5
Figure 4.12:
Legal and environmental risk matrix plot diagram
Level 4 Level 3 Level 3 Level 2
Level 1 Level 1 Level 1
I7
Level 4 Level 3 Level 3 Level 2 Level 2 Level 1 Level 1 I6
Level 5 Level 4 Level 3 Level 3 Level 2 Level 2 Level 2 I5
Level 6 Level 5 Level 4 Level 4 Level 3 Level 3 Level 3 I4
Level 6 Level 5 Lel 5 Level 4 Level 4 Level 3 Level 3 I3
Level 6 Level 6 Level 6 Level 5 Level 5 Level 4 Level 4 I2
Level 6 Level 6 Level 6 Level 6 Level 6 Level 6 Level 6 I1
P1 P2 P3 P4 P5 P6 P7
C
B A

98 | P a g e
Analysis and mitigation proposals (Step 4: risk treatment)
ChemCity have a legal support function that can provide information to Rubnic Oil
on new national laws and regulations that affect operating policies and compliance
managers, providing critical information on whether planned transactions or
protocols conform to legal and ethical requirements.
Owing to the nature of the chemical and waste oil business, the inherent risk
associated with complying with relevant legislation is very broad. A comprehensive
legal framework or legal register was not compiled during the business design.
The lack of such a legal framework or register increases the business risk. Mr
Tsatsi confirmed that applicable regulations for dangerous goods were not
integrated in the business design. This non-compliance has already had a negative
effect on capital and good corporate governance. Rubnic Oil now needs to apply
for additional capital in redesigning the plant infrastructure, such as adding bund
walls for containment.
4.5 RUBNIC OIL’S INHERENT RISK PROFILE SUMMARY
Figure 4.13 illustrates the spread of inherent risks per category and per impact
level for Rubnic Oil’s consolidated risk profile. When comparing the level of
inherent risk, it is noticeable that:
� of the total risk profile, 45% is within the high level (level 1 and 2);
� medium risk spread (level 3 and 4) makes up 45% of the total risk; and
� low risk makes up 10%. .

99 | P a g e
Figure 4.13:
Total inherent risk spread
Table 4.16 and Figure 4.14 give the total external and internal risk profile of Rubnic
Oil.
Table 4.16:
Total risk (internal and external) value
Level 6 Level 5 Level 4 Level 3 Level 2 Level 1 Total
External risk 0 1 2 2 1 2 8
Internal risk 0 4 6 12 16 3 41
Total 0 5 8 14 17 5 49
External risk accounts for 16% of the identified risk while 84% is internal. It is
therefore obvious that most of the mitigations will be externally focused. However,
the risk owner or director should not lose sight of the fact the level 1 risk is evenly
spread between the external and internal environment.

100 | P a g e
Figure 4.14:
Rubnic Oil – Total risk value profile
4.6 RISK GAP ANALYSIS: BUSINESS PLAN VS. APPLIED ERM MODEL
Rubnic Oil’s feasibility study identified three possible risks:
� the sourcing and price of obtained re-used oil;
� high transport costs; and
� technology which has not been tested and proved on a plant scale,
especially with regard to capacity.
By application, the ERM identified a total of forty nine (49) risks as illustrated in
Figure 4.15

101 | P a g e
Figure 4.15:
Risk identification comparison; Busines plan vs ERM approach
It is clear that by following a proper risk model not only the different risk that the
business face can be identified, the risk can also be rated according to levels to
give a true identication of the severity of the risk.
The spread of the risk is shown in Figure 4.16.
Figure 4.16:
ERM applied, total risk spread

102 | P a g e
After application of the ISO 31000 ERM, it is apparent that the risk spread of
Rubnic Oil is mostly within the level 2 risk category. In conclusion, from the
analysis profile it is evident that the risk portfolio of the business reflects a high to
medium risk.
Like so many business incubators, Sasol ChemCity assists entrepreneurs in both
the start-up and the development of their businesses. For this reason, Rubnic Oil
contacted Sasol ChemCity for its expert advice. It is apparent from the limited risk
identified in the Rubnic Oil business plan that Sasol Chemcity requires a
systematic approach to risk identification in order to properly assist businesses. It
is believed that this is not an isolated case and that many other business
incubators in South Africa do not have expert knowledge in assisting entrepreneurs
in risk recognition before business start-up.
4.7 CONCLUSION
In this chapter, an ERM model was applied to prepare a true risk profile for Rubnic
Oil. Several high risks were identified, such as lack of safety standards resulting in
accidents, non-compliance with regulations, the impact of electrical supply or load
shedding, financial restraints, lack of employee recognition, new design or process
not performing to design criteria, lack of service level agreements with suppliers
and clients, feedstock shortages, loss of IP and, finally, operating illegally .
With the same model, the following medium risks were identified: natural disasters,
negative media coverage, workers’ compensation, poor maintenance plan, poor
quality control, lack of information management systems, lack of supply chain
infrastructure, market associated risk and fraudulent activities.
By using this model it is clear that the company risk can be rated as medium to
high.

103 | P a g e
CHAPTER 5
CONCLUSIONS AND RECOMMENDATIONS
5.1 INTRODUCTION
The main objective of this mini-dissertation was to determine what is currently
available in the literature regarding ERM and its application in new business
development, and to recommend an ERM model to the new business developer.
The second objective was to establish what the gap was between the identifiable
risks written into the business plan and the true risk identified through an ERM
model approach. Utilising the ERM model would also identify to what extent the
entrepreneur or business incubator has evaluated the inherent business risk during
the new business development.
5.2 CONCLUSION
The importance of enterprise risk management in ensuring sustainability in new
business development in South Africa cannot be underestimated. It is an important
instrument for entrepreneurs and business incubators in ensuring that all risks are
identified and addressed throughout the new business development. A systematic
approach to risk management will support sustainable businesses and job
creation, address unemployment and provide sustainable growth for the economy
of South Africa. Trevor Manuel says “Small, medium and micro enterprises
represent an important vehicle to address the challenges of job creation, economic
growth and equity in our country” (GEM 2010).
However, businesses still fail in South Africa. According to the literature discussed
in Chapter 2, the most obvious reason for failure is that, although entrepreneurs

104 | P a g e
have a good understanding of their business portfolio, they do not have a good
understanding of their inherent risk because banks and business incubators do not
force them to draft a business plan that envisions all the risk, from idea generation
to start-up, by following a systematic ERM model approach.
The King III report for good corporate governance requirements in support of the
new Companies Act no. 71 of 2008 (‘the Act’) rates risk management as one of the
eleven focus points important for good management. Although KING III refers to a
few models in risk mitigation, the recently published ISO 31000 provides a practical
ERM for risk identification.
One of the main problems identified during the implementation of the business plan
is that a risk assessment would have been done only after the completion or start-
up of the operating plant. This implies that no proper model was followed in
identifying risk, as risk identification should have been done in the pre-feasibility
stage and long before the start-up of the process. It is obvious that the process that
was followed to identify the risk in the business plan was based on brainstorming
and not on a systematic ERM model process. The disadvantage of not following an
ERM process during business incubation is that it leads to budget constraints, as
many unforeseen events will lead to further capital investments.
From looking at the case study, the benefits of using a proper risk model like the
ISO 31000 are obvious when comparing the few risks that were mentioned in the
business plan versus the many detailed categorised (level of risk) risks that
emerged when applying an enterprise risk model.
5.3 RECOMMENDATION
Business managers who adopt a strategic management approach must tailor their
programmes to meet the company’s needs, as there is no one single method of
strategic risk management. Business incubators and business owners should work

105 | P a g e
in collaboration in analysing the new business development before formulating a
business plan. Identifying the risk correctly will ensure that the business owner
correctly applies capital, necessary resources, intervention and focus in mitigating
these risks.
To overcome key challenges in the implementation of ERM, the application should
be enterprise-wide and viewed holistically from the strategic to the functional
levels. The ERM model could be utilised throughout the development of the
business, from the initial point of idea generation, to the writing of a business plan
to successful implementation. For a new business developer to be successful, he
should scan the micro and macro environment for risks by applying the ISO 31000
ERM model. If the framework does not take a holistic view of the business, it fails
to cover the entire enterprise. The risk assessment should be linked to the
business strategy: a successful implementation of ERM is dependent on the
contribution of top management. After all, top management are the sole decision-
makers with regard to how to respond to risks, establish controls and meet the cost
associated with managing the risks.
A negative trend among new business developers or entrepreneurs is that they do
not willingly reveal the total risk profile of the business. This non-disclosure of the
total risk profile in a business plan could be due to the owner’s fear that the equity
funders or banks will not eagerly invest in the business. Educating the business
incubators to adopt a systematic ERM process would support the entrepreneur in
good corporate governance, risk identification and identification of further possible
opportunities. After all, risk management does not measure only the perceived
downside but also future opportunities.
106 | P a g e
5.4 ACHIEVEMENT OF OBJECTIVES
The measurement of the success of this study is based on upon the achievement
of the primary and secondary objectives, as presented in section 1.3 of the study.
5.4.1 Primary objective
The primary objective of this research is to conduct a theoretical and empirical
investigation, which addresses the following aspects:
� determining what is currently available in the literature regarding enterprise
risk management and its application in new business development;
o Evaluation: achieved in chapter 2 and chapter 3
� recommending a model for the improvement of the maturity level of a
business owner in terms of risk management, particularly in business
planning for implementation and sustainability.
o Evaluation: achieved in chapter 4
5.4.2 Secondary objectives
In order to achieve the primary objective, the following secondary objectives will be
pursued:
� establishing the gap between the risks identified as part of the business plan
and the true risk, and
o Evaluation: achieved in chapter 4
� identifying to what extent the entrepreneur or business incubator has
evaluated the inherent business risk during the new business development.
o Evaluation: achieved in chapter 4

107 | P a g e
5.5 RECOMMENDATION FOR FURTHER RESEARCH
The following areas requiring further research were identified:
� further empirical research into the enterprise risk appetite of new business
owners in South Africa;
� empirical research into company failures and the contributory factors as well
as the relationship between these failures and the lack of implementation of
proper risk management practices.

108 | P a g e
REFERENCES
ARMINAS, D. 2003. Managing risk set to be key task purchasers in 2003. Supply
Management.
AUSTRALIAN STANDARD. (AS/NZS) 1999. Risk management.
AUSTRALIAN/ NEW ZEALAND STANDARD. 2004. Risk management.
http://www.saiglobal.com.shop . Date of access: 16 September. 2009.
SOCIETY OF ACTUARIES. 2006. Enterprise Risk Management Specialty Guide,
http://www.soa.org/library/professional-actuarial-specialty-guides/enterprise-risk-
management/2005/august/spg0605erm.pdf. Date of access: 10 April 2010.
CASUALTY ACTUARIAL SOCIETY (CAS): 2003. Enterprise risk management
committee: overview of Enterprise Risk Management.
COFFIN, B. 2008. Risk and Insurance Management Society, (RIMS): Executive
Report, The 2008 financial crisis, a wake up call for Enterprise Risk Management
www.rims.org/.../MemberNewsletters/Documents/RIMSCOPE/RIMSCOPE_03-
09.PDF. Date of access: 05 July 2010
CORTEZ, A. 2010. Risk Management: the complete idiots guide. Penguin Group
(USA) Inc: Alpha. 346 p.
COMMITTEE OF SPONSORING ORGANISATIONS OF THE TREADWAY
COMMISSION.(COSO). 2004.
http://www.coso.org/Publications/ERM/COSO_ERM_ExecutiveSummary.pdf Date
of access: 27 Jul. 2010

109 | P a g e
DE LA ROSA, S. 2004. Integrating risk management and internal audit an internal
audit perspective. Internal Audit Advisor, 20-25. December.
DE VOS, A.S. 2002. Research of grass roots. Pretoria. Van Schaik
DEGRAEVE, Z. 2004. Risk: how to make decisions in an uncertain world. Format
publishing.
DELOACH, J. W. 2000. Enterprise-wide risk management: strategies for linking
risk and opportunity. Great Britain: Pearson Education Limited
DELOITTE. 2006. The risk intelligent enterprise: ERM done right.
DELOITTE. 2007. The risk intelligent chief audit executive. Risk Intelligence
Series.
DEPARTMENT OF TRADE AND INDUSTRY (DTI). 2005. integrated strategy on
the promotion of entrepreneurship and small enterprises.
http://www.thedti.gov.za/smme/strategy.pdf. Date of access: 10 October 2010
ENGELBRECHT, L. 2010. Implementing King III : aligned to the issues and
principles : corporate governance. Enterprise Risk.
GLOBAL ENTREPRENEURSHIP MONITOR (GEM). 2009 - tracking
entrepreneurship in south Africa; a GEM perspective, 174p
GRAY, I. & MANSON, S. 2005. The audit process: principles, practice and cases.
3rd
ed. London: Thomson. 891 p.
HERRINGTON, M. KEW, J, KEW, P. 2009. Global Entrepreneurship Monitor
(GEM) -tracking entrepreneurship in south Africa; a GEM perspective, 174p
110 | P a g e
http://www.coso.org/Publications/ERM/COSO_ERM_ExecutiveSummary.pdf. Date
of access: 27 July. 2010
INSTITUTE OF INTERNAL AUDITORS. 2002. Recommendations for improving
corporate governance.
INTERNATIONAL ORGANIZATION FOR STANDARDIZATION (ISO).
http://www.iso.org/iso/home.htm. Date of access: 18 March 2010
INTERNATIONAL RISK MANAGEMENT INSTITUTE INC.(IRMI) Risk
Management why and how, an illustrative introduction to risk management for
business executives htpp:/IRMI.com. Date of access; 22 November. 2009
INTERNATIONAL STANDARD. ISO/DIS 31000. 2009. Risk management –
Principles and Guidelines. Final Draft copy
KIRYTOPOULOS, LEOPOULOS and MALANDRAKIS. 2001, White Paper
presented at Fourth SMESME International Conference, Risk Management: A
powerful tool for improving efficiency of project oriented SMEs
JOURDAN, C & MICHAELSON, C. 2008. Extending Enterprise Risk Management
(ERM) to address emerging risks: managing known risk: exploring emerging risks.
PricewaterwaterhouseCoopers. http://pwc.com Date of access: 25 November.
2009
KING III REPORT ON CORPORATE GOVERNANCE FOR SOUTH AFRICA.
LAYTON, M. & FUNSTON, R. 2006. Deloitte - the risk intelligent enterprise: ERM
done right.

111 | P a g e
KPMG. 2008., Risk Management, methodology for implementing risk
management. http:/kpmg.ch. Date of access: 17 September. 2009
LEITCH, M. 2003. Risk management history and regulations (UK),
http://www.managedluck.co.uk/regulations/index.shtml Date of access: 12 August.
2010.
LUCOUW, P. 2004. CreaZing the more. Balancing on the tight rope to prosperous
existence. South Africa : Corals Publishers.
MARX, S., VAN ROOYEN, D.C., BOSCH, J.K., REYNDERS, H.J.J. 1998.
Business Management. 2nd edition. Van Schaik: Pretoria.
McKINSEY. 2008. Working papers in risk: Turning risk management into a true
competitive advantage, lessons from the recent crisis. September 2008.
NATIONAL SMALL BUSINESS ACT (102/996), Government Gazette, 15
December 2004.
OLSON C. 2002. Risk management in emerging markets. How to survive and
prosper. London: Pearson education limited
PRICEWATERHOUSECOOPERS. 2008. A practical guide to risk assessment,
how principles-based risk assessment enables organizations to take the right risks.
http://www.pwc.com/en_US/us/issues/enterprise-risk-
management/assets/risk_assessment_guide.pdf. Date of access: 25 November.
2009
PRICEWATERHOUSECOOPERS. 2008. Seizing opportunity Linking risk and
performance, http://pwc.com/us/managing_risk Date of access: 15 May 2010

112 | P a g e
PUSCHAVER, L. & ECCLES, R.G. 1998. In pursuit of the upside: the new
opportunity in risk management. In pursuit of the upside: leading thinking on issues
of risk management. A collection of PWC Risk Professionals. South Africa: The
Institute of Internal Auditors
REPUBLIC OF SOUTH AFRICA. Department of Trade and lndustry. 1995. White
Paper on National Strategy for the Development and Promotion of Small Business
in South Africa. Government Gazette, 16317:l-35,28 March.
RUBNIC OIL. (2010), Business plan.
SADGROVE, K (1996), The complete guide to business risk management, Gower
Ltd.
SAMMER, J. 2001. Looking for risk in all the right places. http://wwwbfmag.
com/magazine/archives/article. html?articleD=13736. Date of access: 17 June.
2010
SASOL CHEMCITY, Catalyst for change. www.chemcity.co.za. Date of access; 01
December 2009
SMALL ENTERPRISE DEVELOPMENT AGENCY (SEDA). 2009. The Small
Business monitor, Volume 5, Number 1. http//seda.org.za. Date of access: 23
March 2010
SMALL ENTERPRISE DEVELOPMENT AGENCY (SEDA). 2009. Xhariep SMME:
development and support plan. http//seda.org.za. Date of access: 17 August. 2010.
SOBEL, P & REDING, K.F. 2004. Aligning corporate governance with enterprise
risk management. Management Accounting Quarterly. 5(2): 31. Winter.

113 | P a g e
THE COMMITTEE OF SPONSORING ORGANIZATIONS OF THE TREADWAY
COMMISSION (COSO). 2004. Enterprise Risk Management–Integrated
Framework and Application. September. 2004.
THE ENTREPRENEURIAL DIALOGUES. 2009. State of Entrepreneurship in
South Africa. http//fnb.co.za. Date of access: 27 July 2010.
THE INSTITUTE OF RISK MANAGEMENT (IRM). 2010. A structured approach to
enterprise risk management and the requirement of ISO 31000.
http://www.theirm.org/documents/SARM_FINAL.pdf. Date of access: 21 August.
2010
TIMMONS, J.A. SPINELLI, S. 2007. New venture creation: entrepreneurship for
the 21st century. 7th ed. New York: McGraw Hill. 658 p.
ULICK, J. 2002. WorldCom's financial bomb.
http://www.money.cnn.com/2002/06/25 news/worldcom/. Date of access: 16
March. 2007.
VAUGHAN, E.J. 1997. Risk Management. USA: John Wiley & Sons, Inc.
VALSAMAKIS, A.C., VIVIAN, R.W. & DU TOIT, G.S. 2005. Risk management:
managing enterprise risks. 3rd
ed. Sandton: Heinemann Higher.
WHITE PAPER, Enterprise Risk Management Program (ERMP), Allen Diep. 2003