Application of Advanced 2-D TDLAS diagnostics for the Optimization...
13
1 Application of Advanced 2-D TDLAS diagnostics for the Optimization of Combustion in Steam Methane Reformers Andrew Sappey, David Giltner, Jim Howell, Pat Masterson, and Mike Estes Zolo Technologies, Inc. 4946 N.63 rd Street Boulder, CO 80301 We present results from two separate demonstration installations of the ZoloBOSS TDLAS sensor system on Steam Methane Reformers. The ZoloBOSS provides two-dimensional information on temperature and species concentration distributions (O2, CO, and H2O) inside the operating SMR furnace. This unique data set allows the operator to balance the temperature distribution in the furnace as well as insuring that the desired distribution of O2 and fuel is realized. The value of such a system for operating SMRs includes contributions from improved efficiency, longer tube life, increased catalyst life, reduced emissions, remote monitoring, and safety. Results at both nominally well-run plants indicate that: 1) significant combustion profile imbalances were initially present in both furnaces upon installation, 2) the data provided by the ZoloBOSS can be used to improve balance by manually tuning burners, and 3) significant ROI will be realized as a result of long-term implementation and optimization.
-
Upload
vuongnguyet -
Category
Documents
-
view
217 -
download
0
Transcript of Application of Advanced 2-D TDLAS diagnostics for the Optimization...

1
Application of Advanced 2-D TDLAS diagnostics for the Optimization of Combustion in Steam Methane
Reformers
Andrew Sappey, David Giltner, Jim Howell, Pat Masterson, and Mike Estes
Zolo Technologies, Inc.
4946 N.63rd Street
Boulder, CO
80301
We present results from two separate demonstration installations of the ZoloBOSS TDLAS sensor system
on Steam Methane Reformers. The ZoloBOSS provides two-dimensional information on temperature
and species concentration distributions (O2, CO, and H2O) inside the operating SMR furnace. This unique
data set allows the operator to balance the temperature distribution in the furnace as well as insuring
that the desired distribution of O2 and fuel is realized. The value of such a system for operating SMRs
includes contributions from improved efficiency, longer tube life, increased catalyst life, reduced
emissions, remote monitoring, and safety. Results at both nominally well-run plants indicate that: 1)
significant combustion profile imbalances were initially present in both furnaces upon installation, 2) the
data provided by the ZoloBOSS can be used to improve balance by manually tuning burners, and 3)
significant ROI will be realized as a result of long-term implementation and optimization.

2
Introduction
Combustion provides energy to drive many endothermic industrial processes. Industries as diverse as
petroleum refining, cement, glass, aluminum, steel, and paper manufacturing as well as the production
of chemicals such as hydrogen, ammonia, and ethylene rely on combustion. These processes have
traditionally been run without much thought about combustion efficiency. However, competition,
emissions regulations, higher fuel costs, and concern regarding global warming have conspired to cause
manufacturers to focus attention on process efficiency. One of the largest cost inputs for any large-scale
production facility is fuel. For instance, in the hydrogen production industry, a typical steam methane
reformer (SMR) produces 100 mmscf/day (112 Nm3/hr) hydrogen with a heat input of 15,000 mmBTUs.
The fuel is typically natural gas (4.00 US$/mmBTU in the USA and 8.00 US$/mmBTU in Europe); in some
other countries, fuels such as naphtha may be used at a cost of greater than 16 US$/mmBTU. A fuel
savings of 0.5%, even in the United States where fuel is relatively inexpensive, is sufficient to spur
interest in improving combustion efficiency. Along with reduced fuel consumption, optimized
combustion can lead to higher process efficiency, increased tube life, reduced emissions and increased
asset availability as well as improved safety.
In 2004, Zolo developed the ZoloBOSS, a laser-based combustion monitoring system that has the
capability to measure temperature and species concentrations in the combustion environment, and so
offers the possibility of optimization of the combustion process to improve efficiency. The ZoloBOSS
architecture allows the user to monitor combustion parameters along multiple paths (currently up to
30) and this capability enables the calculation of two-dimensional (2D) species concentration and
temperature profiles. The resulting 2D data provides the operator with the information required to
homogenize combustion allowing reduced excess air and better optimized operating temperatures for
better efficiency while maintaining required safety margins. Elimination of hot spots typically improves
asset run time between unplanned outages.
Over 50 ZoloBOSS systems have been installed worldwide, primarily in coal-fired power plants.
Efficiency improvements of up to 1% have been demonstrated straightforwardly leading to similar
reductions in greenhouse gases such as CO2 and often with concomitant reductions in NOx (up to 30%).
Recently, we have undertaken an initiative to apply the ZoloBOSS technology in other combustion-
driven applications such as SMRs, electric arc furnaces (EAFs), steel reheat and glass furnaces. Here we
talk about initial results from two SMR furnaces.
The ZoloBOSS for Steam Methane Reforming
The ZoloBOSS has been described in detail elsewhere.1 Here we focus on aspects unique to installation
in an SMR. SMRs produce hydrogen via a two-step process in which CH4 reacts with steam over a
catalyst at high temperature to produce a mixture of H2, CO, and CO2 along with some unreacted CH4
and H2O. The product H2 is typically separated from this mixture using a pressure swing adsorber (PSA).
The PSA off-gas contains a significant combustible content, including unreacted CH4, CO, and some
remaining H2. The PSA off-gas typically provides about 80% of the energy content required to fire the
furnace, so pure natural gas is added as a make-up fuel to provide the remaining energy required.
However, the ratio of natural gas to PSA off-gas can change over time making optimization of the
3
burners challenging without real time feedback control. In addition, the PSA off-gas pressure changes
during its cycling causing the fuel flow to the burners to swing in a roughly periodic manner as a result.
We shall see that this pressure oscillation is easily observed in the ZoloBOSS data.
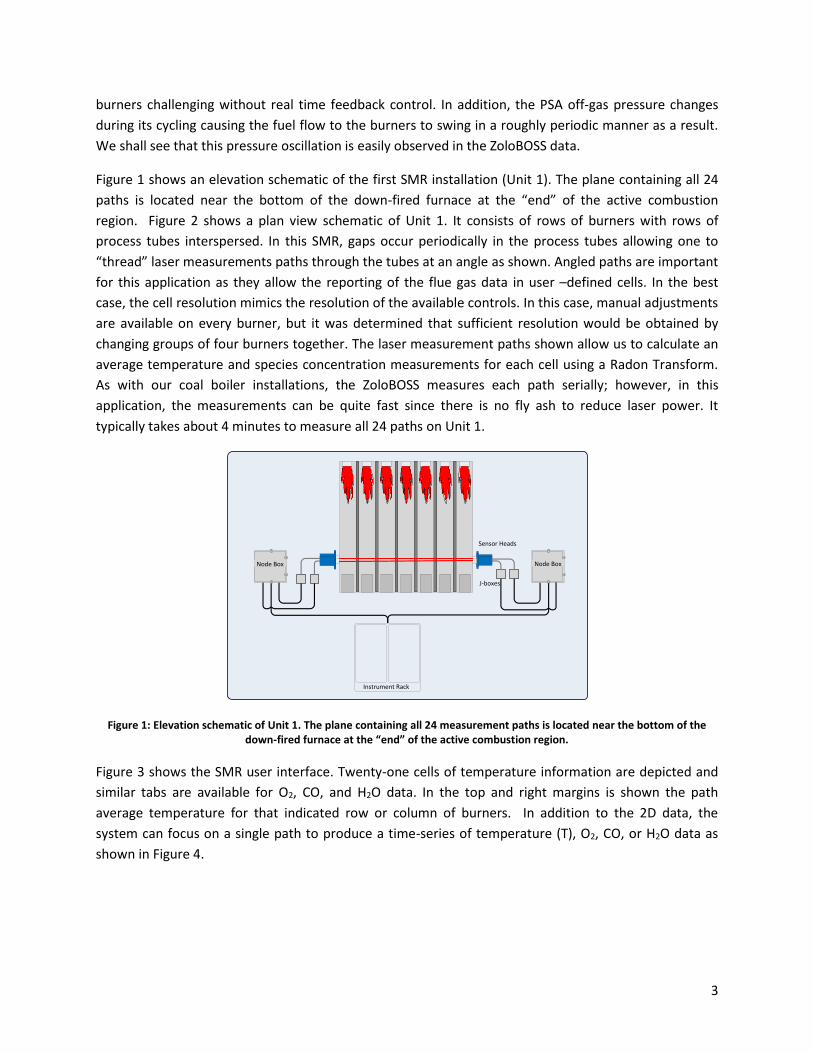
Figure 1 shows an elevation schematic of the first SMR installation (Unit 1). The plane containing all 24
paths is located near the bottom of the down-fired furnace at the “end” of the active combustion
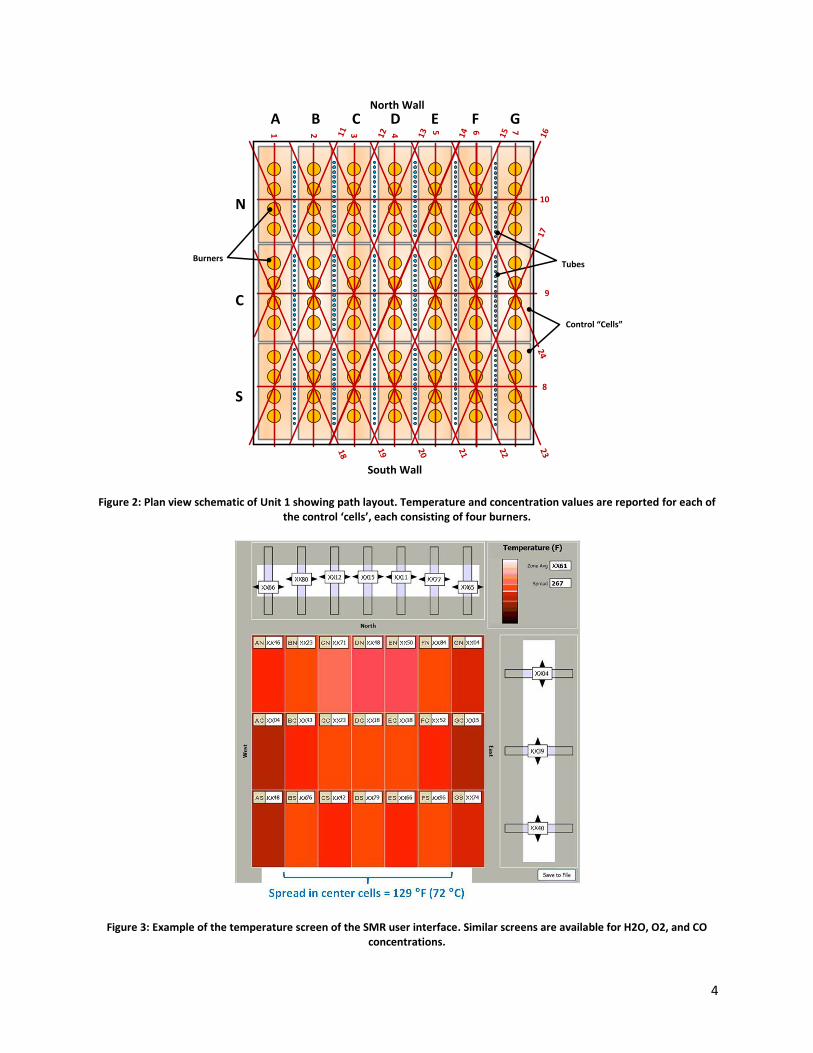
region. Figure 2 shows a plan view schematic of Unit 1. It consists of rows of burners with rows of
process tubes interspersed. In this SMR, gaps occur periodically in the process tubes allowing one to
“thread” laser measurements paths through the tubes at an angle as shown. Angled paths are important
for this application as they allow the reporting of the flue gas data in user –defined cells. In the best
case, the cell resolution mimics the resolution of the available controls. In this case, manual adjustments
are available on every burner, but it was determined that sufficient resolution would be obtained by
changing groups of four burners together. The laser measurement paths shown allow us to calculate an
average temperature and species concentration measurements for each cell using a Radon Transform.
As with our coal boiler installations, the ZoloBOSS measures each path serially; however, in this
application, the measurements can be quite fast since there is no fly ash to reduce laser power. It
typically takes about 4 minutes to measure all 24 paths on Unit 1.
Figure 1: Elevation schematic of Unit 1. The plane containing all 24 measurement paths is located near the bottom of the down-fired furnace at the “end” of the active combustion region.
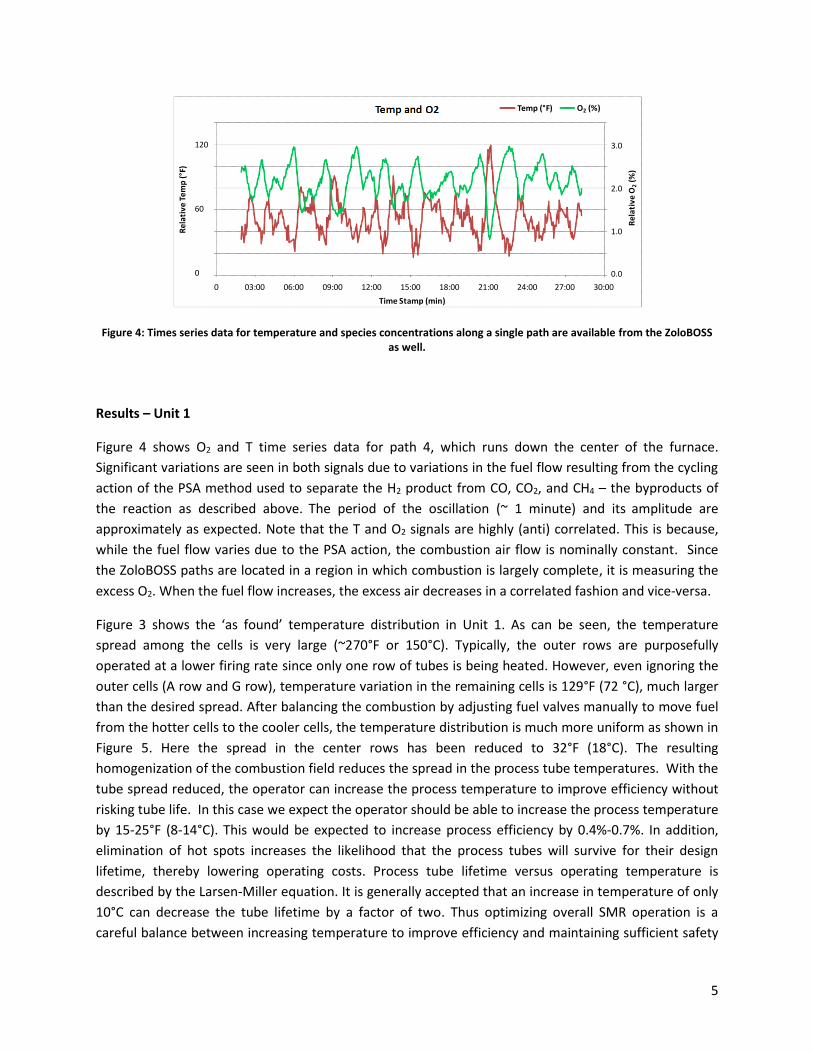
Figure 3 shows the SMR user interface. Twenty-one cells of temperature information are depicted and
similar tabs are available for O2, CO, and H2O data. In the top and right margins is shown the path
average temperature for that indicated row or column of burners. In addition to the 2D data, the
system can focus on a single path to produce a time-series of temperature (T), O2, CO, or H2O data as
shown in Figure 4.
Node BoxNode Box
Sensor Heads
Instrument Rack
J-boxes
4
Figure 2: Plan view schematic of Unit 1 showing path layout. Temperature and concentration values are reported for each of the control ‘cells’, each consisting of four burners.
Figure 3: Example of the temperature screen of the SMR user interface. Similar screens are available for H2O, O2, and CO concentrations.
South Wall
North Wall
1 2 4 5 63 7
10
9
8
11 12 13 14 15 1617
18
19 20 21 22 2324
A B C D E F G
N
C
S
BurnersTubes
Control “Cells”
5
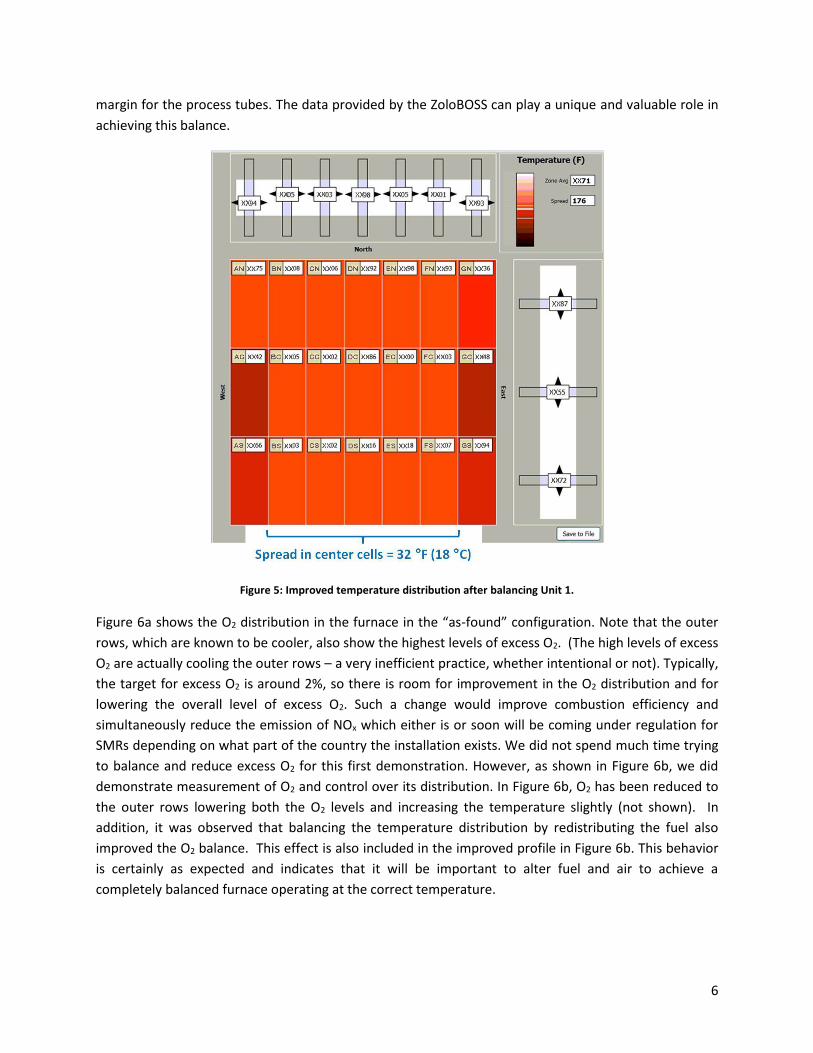
Figure 4: Times series data for temperature and species concentrations along a single path are available from the ZoloBOSS as well.
Results – Unit 1
Figure 4 shows O2 and T time series data for path 4, which runs down the center of the furnace.
Significant variations are seen in both signals due to variations in the fuel flow resulting from the cycling
action of the PSA method used to separate the H2 product from CO, CO2, and CH4 – the byproducts of
the reaction as described above. The period of the oscillation (~ 1 minute) and its amplitude are
approximately as expected. Note that the T and O2 signals are highly (anti) correlated. This is because,
while the fuel flow varies due to the PSA action, the combustion air flow is nominally constant. Since
the ZoloBOSS paths are located in a region in which combustion is largely complete, it is measuring the
excess O2. When the fuel flow increases, the excess air decreases in a correlated fashion and vice-versa.
Figure 3 shows the ‘as found’ temperature distribution in Unit 1. As can be seen, the temperature
spread among the cells is very large (~270°F or 150°C). Typically, the outer rows are purposefully
operated at a lower firing rate since only one row of tubes is being heated. However, even ignoring the
outer cells (A row and G row), temperature variation in the remaining cells is 129°F (72 °C), much larger
than the desired spread. After balancing the combustion by adjusting fuel valves manually to move fuel
from the hotter cells to the cooler cells, the temperature distribution is much more uniform as shown in
Figure 5. Here the spread in the center rows has been reduced to 32°F (18°C). The resulting
homogenization of the combustion field reduces the spread in the process tube temperatures. With the
tube spread reduced, the operator can increase the process temperature to improve efficiency without
risking tube life. In this case we expect the operator should be able to increase the process temperature
by 15-25°F (8-14°C). This would be expected to increase process efficiency by 0.4%-0.7%. In addition,
elimination of hot spots increases the likelihood that the process tubes will survive for their design
lifetime, thereby lowering operating costs. Process tube lifetime versus operating temperature is
described by the Larsen-Miller equation. It is generally accepted that an increase in temperature of only
10°C can decrease the tube lifetime by a factor of two. Thus optimizing overall SMR operation is a
careful balance between increasing temperature to improve efficiency and maintaining sufficient safety
Temp (°F) O2 (%)
Re
lati
ve T
em
p (°
F)
Re
lati
ve
O2
(%)
Time Stamp (min)
120
60
0
3.0
2.0
1.0
0.0
0 03:00 06:00 09:00 12:00 15:00 18:00 21:00 24:00 27:00 30:00
6
margin for the process tubes. The data provided by the ZoloBOSS can play a unique and valuable role in
achieving this balance.
Figure 5: Improved temperature distribution after balancing Unit 1.
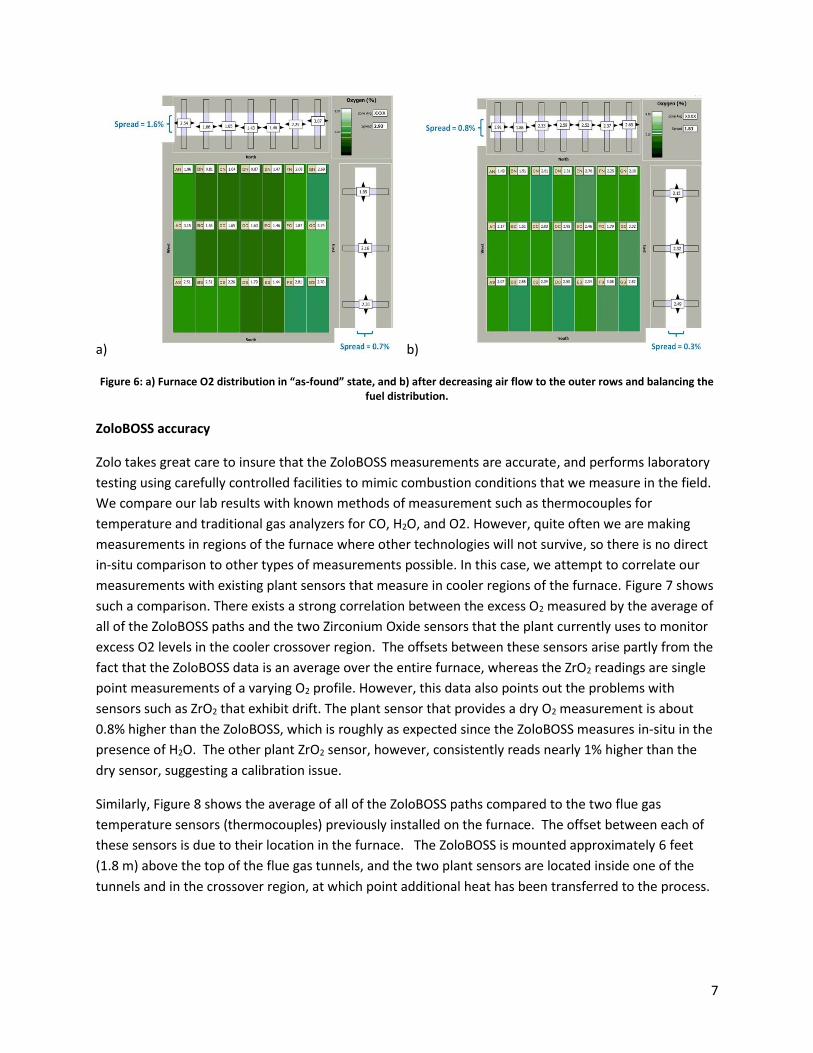
Figure 6a shows the O2 distribution in the furnace in the “as-found” configuration. Note that the outer
rows, which are known to be cooler, also show the highest levels of excess O2. (The high levels of excess
O2 are actually cooling the outer rows – a very inefficient practice, whether intentional or not). Typically,
the target for excess O2 is around 2%, so there is room for improvement in the O2 distribution and for
lowering the overall level of excess O2. Such a change would improve combustion efficiency and
simultaneously reduce the emission of NOx which either is or soon will be coming under regulation for
SMRs depending on what part of the country the installation exists. We did not spend much time trying
to balance and reduce excess O2 for this first demonstration. However, as shown in Figure 6b, we did
demonstrate measurement of O2 and control over its distribution. In Figure 6b, O2 has been reduced to
the outer rows lowering both the O2 levels and increasing the temperature slightly (not shown). In
addition, it was observed that balancing the temperature distribution by redistributing the fuel also
improved the O2 balance. This effect is also included in the improved profile in Figure 6b. This behavior
is certainly as expected and indicates that it will be important to alter fuel and air to achieve a
completely balanced furnace operating at the correct temperature.
7
a) b)
Figure 6: a) Furnace O2 distribution in “as-found” state, and b) after decreasing air flow to the outer rows and balancing the fuel distribution.
ZoloBOSS accuracy
Zolo takes great care to insure that the ZoloBOSS measurements are accurate, and performs laboratory
testing using carefully controlled facilities to mimic combustion conditions that we measure in the field.
We compare our lab results with known methods of measurement such as thermocouples for
temperature and traditional gas analyzers for CO, H2O, and O2. However, quite often we are making
measurements in regions of the furnace where other technologies will not survive, so there is no direct
in-situ comparison to other types of measurements possible. In this case, we attempt to correlate our
measurements with existing plant sensors that measure in cooler regions of the furnace. Figure 7 shows
such a comparison. There exists a strong correlation between the excess O2 measured by the average of
all of the ZoloBOSS paths and the two Zirconium Oxide sensors that the plant currently uses to monitor
excess O2 levels in the cooler crossover region. The offsets between these sensors arise partly from the
fact that the ZoloBOSS data is an average over the entire furnace, whereas the ZrO2 readings are single
point measurements of a varying O2 profile. However, this data also points out the problems with
sensors such as ZrO2 that exhibit drift. The plant sensor that provides a dry O2 measurement is about
0.8% higher than the ZoloBOSS, which is roughly as expected since the ZoloBOSS measures in-situ in the
presence of H2O. The other plant ZrO2 sensor, however, consistently reads nearly 1% higher than the
dry sensor, suggesting a calibration issue.
Similarly, Figure 8 shows the average of all of the ZoloBOSS paths compared to the two flue gas
temperature sensors (thermocouples) previously installed on the furnace. The offset between each of
these sensors is due to their location in the furnace. The ZoloBOSS is mounted approximately 6 feet
(1.8 m) above the top of the flue gas tunnels, and the two plant sensors are located inside one of the
tunnels and in the crossover region, at which point additional heat has been transferred to the process.

8
Figure 7: Graph of the excess O2 measured by the ZoloBOSS compared to the two plant oxygen sensors, located in the crossover region.
Figure 8: Graph of the average temperature measured by the ZoloBOSS compared to the two existing flue gas temperature sensors, located inside one of the flue gas tunnels and in the crossover section.
1.0
1.5
2.0
2.5
3.0
3.5
4.0
4.5
5.0
5.5
6.0
12:00 AM 12:00 PM 12:00 AM 12:00 PM 12:00 AM 12:00 PM 12:00 AM
Re
lati
ve O
xyge
n (
%)
Zolo O2 vs. Plant Sensors Avg O2 (Zolo)
ZrO2 #1 (wet)
ZrO2 #2 (dry)
Time stamp
1400
1450
1500
1550
1600
1650
1700
1750
1800
1850
12:00 AM 12:00 AM 12:00 AM 12:00 AM 12:00 AM 12:00 AM 12:00 AM 12:00 AM 12:00 AM
Zolo Temperature vs. Plant Sensors Avg temp (Zolo)
Local temp (Plant sensor 1)
Local temp (Plant sensor 2)
400
300
200
100
0
Re
lati
ve t
em
pe
ratu
re (
F)
Time stamp
9
Results – Unit 2
The second SMR installation (Unit 2) was less oriented towards operational benefit and more focused on
research and development interests and characterizing the furnace profile. As a result, and because the
configuration of the SMR prevented installation of angled paths, 2D resolution at the level shown above
was not feasible. Even so, results were obtained that indicate that significant savings from correct
balancing are possible. Another major difference is that tube temperature data is available from the
second test, and this data clearly shows that balancing the temperature profile of the flue gas in the
furnace leads to more uniform tube wall temperatures. Physics certainly dictates that this must be the
case, but it is nevertheless comforting to see that this is observed empirically as well. More uniform tube
temperatures reduce failures and enable higher operating outlet temperatures leading to higher process
efficiency.
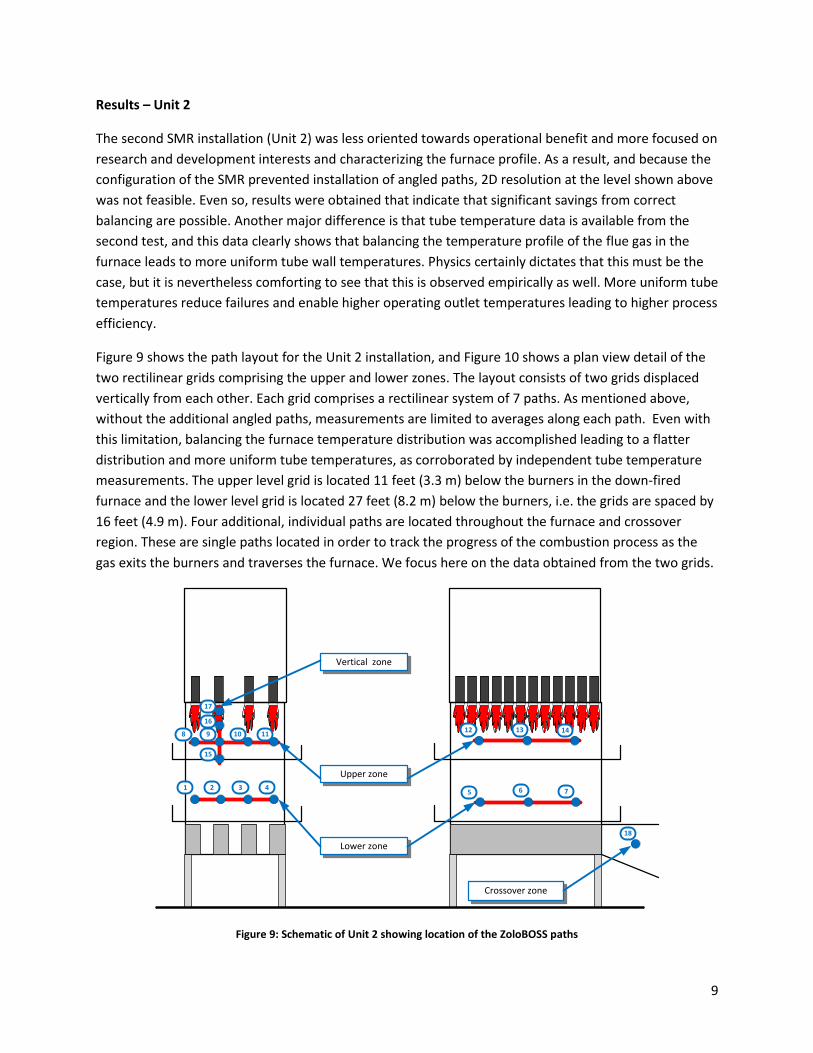
Figure 9 shows the path layout for the Unit 2 installation, and Figure 10 shows a plan view detail of the
two rectilinear grids comprising the upper and lower zones. The layout consists of two grids displaced
vertically from each other. Each grid comprises a rectilinear system of 7 paths. As mentioned above,
without the additional angled paths, measurements are limited to averages along each path. Even with
this limitation, balancing the furnace temperature distribution was accomplished leading to a flatter
distribution and more uniform tube temperatures, as corroborated by independent tube temperature
measurements. The upper level grid is located 11 feet (3.3 m) below the burners in the down-fired
furnace and the lower level grid is located 27 feet (8.2 m) below the burners, i.e. the grids are spaced by
16 feet (4.9 m). Four additional, individual paths are located throughout the furnace and crossover
region. These are single paths located in order to track the progress of the combustion process as the
gas exits the burners and traverses the furnace. We focus here on the data obtained from the two grids.
Figure 9: Schematic of Unit 2 showing location of the ZoloBOSS paths
Upper zone
Lower zone
Vertical zone
Crossover zone
1 2 3 4
17
16
765
15
8 9 10 11 141312
18

10
Figure 10: Rectilinear grid configuration for the upper and lower measurement zones installed in Unit 2. The upper zone is 11 feet (3.3 m) below the burners and the lower zone is 27 feet (8.2 m) below the burners.
Controlling the flue gas temperature by changing the burner fuel valves was straightforward and
predictable. With a series of balancing steps, it was possible to significantly alter the flue gas
temperature profile. Figure 11 shows the measured path-averaged temperatures before and after
balancing. As can be seen, the initial spread in the East-West (92°F/51°C) and North-South (132°F/73 °C)
directions was reduced substantially (16°F/9°C) and (7°F/4°C).
Figure 11: Path-averaged temperatures before and after balancing at the lower level. Significant improvements in the gas temperature distribution are observed.
Since hot spots in the flue gas cause overheated process tubes, and regions of cooler flue gas lead to
reduced process conversion and high methane slip, balancing the flue gas can lead to significant
improvements in both reliability and efficiency. The tube temperature profiles in Figure 12 demonstrate
P1 P2 P3 P4
Burners
Process Tubes
P7
P6
P5
Lower Zone
Tube Row: 1 2 3
P8 P9 P10 P11
P14
P13
P12
Upper Zone
Tube Row: 1 2 3
P1 P2 P3 P4
1930 1843 1845 1935
1888
1904
1772 P5
P7
P6
1700
1800
1900
2000
P1 P2 P3 P4
East-West
1700 1800 1900 2000
P5
P6
P7
North-South
Spread: 92 F (51 C) Spread: 132 F (73 C) Spread: 16 F (9 C) Spread: 7 F (4 C)
Starting point Balanced Profiles
P1 P2 P3 P4
1887 1877 1871 1875
1869 P7
P6
1815 P5
1868
1700
1800
1900
2000
P1 P2 P3 P4
East-West
1700 1800 1900 2000
P5
P6
P7
North-South
P4
1847
1860 P7
1857 P6
1853 P5
P4 1700 1800 1900 2000
P5
P6
P7
North-South
XX
XX
XX
XX
XX
XX
XX XX XX XX XX XX XX XX
-100 0 100 200-100 0 100 200
200
100
0
-100
200
100
0
-100

11
the significant improvement in tube temperature profile that can be achieved by adjusting the flue gas
profile.
Figure 12: Typical measured tube temperature profiles with unbalanced flue gas and balanced flue gas, showing that a significant reduction in tube spread can be achieved by balancing the flue gas temperature profile.
Value
The ability to control and improve the flue gas temperature distribution can provide value to SMR
operation in a number of areas:
Improved Efficiency: Balancing the flue gas temperature profile will reduce the spread of tube wall
temperatures, allowing the overall process temperature to be increased without pushing some
tubes above the desired maximum operating temperature. This allows an improvement in the
process efficiency without a decrease in reliability. In addition, for plants that do not produce large
amounts of steam, combustion efficiency improvements can be obtained by reducing excess oxygen
to the desired optimal levels. The ZoloBOSS allows operators to bring the entire furnace into the
optimal excess oxygen range, rather than simply the limited regions measured by the conventional
plant sensors, leaving the risk that other regions are operating either above or below the optimal
range.
Based on industry standards, a 30-50°F (16-28°C) reduction in the tube temperature spread through
better balance can allow the plant to operate at a 15-25°F (8-14°C) increase in reformer outlet
temperature (ROT) without damaging tube life or impacting reliability. Additional improvements in
combustion efficiency may be obtained by balancing and reducing excess O2. As a result, a process
efficiency gain of 1.5-2.5 btu/scf can be achieved, which provides US$200,000 to US$350,000 per
year in savings for a 100 mmscf/day (112 Nm3/hr) reformer, based on a natural gas price of 4.00
US$/mmBTU.
Longer Tube Life: The high performance process tubes installed in SMRs have a lifetime that is
highly temperature dependent, as described by the Larson-Miller relationship. It is generally
accepted that a 10°C increase in the operating temperature can reduce the tube life up to 50%.
-75
0
75
0 10 20 30
Re
lati
ve T
em
pe
ratu
re (F
)
Tube Number
Tube temperature profile - unbalanced
Tube Row 1 Tube Row 2 Tube Row 3
-75
0
75
0 10 20 30
Re
lati
ve T
em
pe
ratu
re (F
)
Tube Number
Tube temperature profile - balanced
Tube Row 1 Tube Row 2 Tube Row 3
Spread: 89 F (49 C) Spread: 51 F (28 C)

12
Therefore, reducing the tube wall temperature spread by balancing the flue gas temperature can
eliminate the need to inspect and replace individual tubes that are prematurely approaching their
design life. Eliminating the high temperatures on only 10-15% of the tubes can reduce maintenance
costs (i.e. tube replacement) by over US$100,000 per year on a 100 mmscf/day reformer.
Additional value will be realized from the significantly reduced risk of a premature tube failure.
Increased Catalyst Life: Narrowing the spread in tube temperatures has an added benefit in that it
reduces premature catalyst degradation that results from overheating. Reducing the temperature
spread for catalyst in different tubes will produce more consistent utilization and increase the
overall catalyst life. Savings of up to US$50,000 per year may be achieved by less frequent catalyst
changes.
Remote Monitoring: Typical steam methane reformers have a wide array of sensors for measuring
fuel and air/flue gas properties before and after the combustion region, but there are very few
sensors available for directly inside the furnace. The ZoloBOSS combustion sensor provides the first
quantitative sensor that measures real-time and directly in the furnace, where the process is taking
place. This compliments operator observations and pyrometer measurements of tube
temperatures. As an example, a sudden increase in the Temperature and H2O as measured by the
ZoloBOSS can provide an early warning of a tube leak and prevent further damage to adjacent
tubes.
Safety: The real-time measurement capability of the ZoloBOSS provides real-time status of the
furnace so operators can identify poor combustion conditions or dangerous situations in the safety
of the control room. For example, excessive CO levels measured in-situ by the ZoloBOSS can be a
signal of a dangerous combustion condition. Quantitative measurements can be configured to
trigger alarms if certain limits are exceeded.
Summary
We have installed the ZoloBOSS on two SMRs and demonstrated the straightforward balancing of the
temperature and air distributions in the furnace. The results demonstrated here should lead to large
improvements in furnace efficiency as well as tube and catalyst lifetime. This leads to significant
savings, as summarized in Table 1:
Value Annual savings
4.00 US$/mmBTU 8.00 US$/mmBTU 16.00 US$/mmBTU
Efficiency $200k to $350k $400k to $700k $800k to $1.4M
Tube Life $100k $100k $100k
Catalyst Life $50k $50k $50k
Remote Monitoring $TBD $TBD $TBD
Safety $TBD $TBD $TBD
Net: $350k to $500k $550k to $850k $950k to $1.55M
Table 1: Summary of the value that can be achieved on a 100 mmscf/day reformer by balancing combustion with the ZoloBOSS.
13
In addition, the measurements provide a window into the safe operation of a very valuable and
expensive asset where none existed before.
References:
1. Andrew D. Sappey, Pat Masterson, Eric Huelson, Jim Howell, Mike Estes, Henrik Hofvander and Atilio Jobson “Results of Closed-Loop Coal-Fired Boiler Operation Using a TDLAS Sensor and Smart Process Control Software” Combustion Science and Technology, Vol. 183, Issue 11, pages 1282-1295 (2011).