Application Note: UV/VIS Spectroscopy in Microplates
8
www.gbo.com/bioscience Application Note UV/VIS Spectroscopy in Microplates UV-Star ® , µClear ® , MICROLON ® and CELLSTAR ®
-
Upload
greiner-bio-one -
Category
Documents
-
view
624 -
download
0
description
Transparent microplates (CELLSTAR®, MICROLON®) ormicroplates with a clear film bottom (μClear®, UV-Star®) arefrequently used in ultraviolet-visible spectroscopy (UV/VIS).UV/VIS is a subclass of spectroscopy which uses visible lightand adjacent near ultraviolet (UV) ranges for the determinationof the concentrations and the characterisation of dissolvedsubstances.
Transcript of Application Note: UV/VIS Spectroscopy in Microplates
www.gbo.com/bioscience
AApppplliiccaattiioonn NNootteeUUVV//VVIISS SSppeeccttrroossccooppyy iinn MMiiccrrooppllaatteessUUVV--SSttaarr®®,, µµCClleeaarr®®,, MMIICCRROOLLOONN®® aanndd CCEELLLLSSTTAARR®®

Transmission and transmittance are often used as synonyms.In spectroscopy the physical phenomenon of light transmissionthrough a sample can be described by the fraction of light at aspecific wavelength λ that passes through the sample. If I0 isthe intensity of the incident light and I1 the intensity of the trans-mitted light, then the transmittance T can be defined as:
In parallel, the transmittance can be described by the lightabsorbance Aλ or optical density ODλ:
The higher the optical density of the sample, the higher the ab-sorption and the lower is the transmission of light. Often thetransmission is given as a percentage (Fig. 2a). Although theabsorbance or optical density does not have true units, it iscustomarily reported in absorbance units (AU) (Fig. 2b).
The absorbance or optical density depends on thewavelength λ and the pathlength d (Fig. 1). In order to be ableto compare measurements the optical density is oftencalibrated to a defined pathlength, typically 1 cm.
Optical densities above 1.0 should be avoided in a sensitivemeasurement as even large differences in the optical densityreadouts represent only minor modifications in the transmission(Table 1). It is recommended to dilute samples with a highoptical density in order to achieve results below 1.0.
Aλ = ODλ = -log10 (2)I1I0
1. Introduction to UV/VIS spectroscopy
Transparent microplates (CELLSTAR®, MICROLON®) ormicroplates with a clear film bottom (µClear®, UV-Star®) arefrequently used in ultraviolet-visible spectroscopy (UV/VIS).UV/VIS is a subclass of spectroscopy which uses visible lightand adjacent near ultraviolet (UV) ranges for the determinationof the concentrations and the characterisation of dissolvedsubstances.
Most dissolved molecules absorb light in the visible or UV rangeat specific wavelengths. The absorption of light (Fig. 1) is aphysical process where the amount of absorbed light dependson the concentration of the substance c, the thickness of theliquid layer d and a specific absorption coefficient α at a definedwavelength λ.
Different terms define the process of light absorbance. For abetter overview the most frequently used terms are listed anddefined in section 1.1.
1.1 Definition of different terms in UV/VIS spectroscopy
2 8 www.gbo.com/bioscience
Figure 1: Principle of UV/VIS spectroscopy
I0: Intensity of the light beam before passing thesample
I1: Intensity of the transmitted light(Light beam that has passed through the sample)
c: Concentration of the dissolved molecule
α: Molar extinction coefficient
d: Length of the sample (pathlength)
Optical density Transmission
1.5 3 %
1.7 2 %
2.0 1 %
Wavelength / nm
Tran
smis
sio
n/
%
solid bottom, 1 mm
µClear®, 200 µm
µClear®, 75 µm
UV-Star®, 140 µm
Figure 2a: Transmission in solid bottom polystyrene (1 mm bottomthickness), µClear® (200 µm and 75 µm polystyrene film bottom) andUV-Star® (140 µm film bottom) microplates
T = (1)
Table 1: Optical density above 1.0 and their relation to the transmission
I0I1
c, α
d
I1I0

An example for the determination of the molar extinctioncoefficient of adenosine 5’-tri-phosphate (ATP) is given inexample 1.
3 8www.gbo.com/bioscience
1.2 Optical background of Greiner Bio-One solid bottompolystyrene, µClear® and UV-Star® Microplates in trans-mission measurements
As evidenced in figures 2a and 2b, the high transmission ofstandard polystyrene microplates drops off sharply atapproximately 400 nm, whereas µClear® plates extenddetection capabilities down to 340 nm. UV-Star® Microplatesdemonstrate the highest transmission within the lowerUV range down to 230 nm. Conversely, optical density increasesproportionally in accordance with transmittance wavelengthvalues indicated for the corresponding microplate type.
1.3 Lambert-Beer’s Law
The absorption of light in a sample solution is dependent on theconcentration c of the dissolved molecule, the specific molarextinction coefficient α at a defined wavelength λ and the path-length d.
With known extinction coefficient and pathlength, theconcentration of a sample can be determined by using theLambert-Beer’s equation (3). As well, Lambert-Beer’s law canbe used to determine the molar extinction coefficient (4).
Lambert-Beer’s Law
Aλ = -log10 = αλ • c • d (3)
c Concentration of the dissolved absorbing molecule. Typically definedas [mol • dm-3] or [mol • l-1]
αλ Molar extinction coefficient which is for the absorbing molecule aspecific dimension at a defined wavelength λ. It can be dependenton the solvent and e.g. pH of the solution. The dimension of theextinction coefficient is dm3 or l
mol • cm mol • cm
d Distance light has to pass through the material [cm]
Determination of the molar extinction coefficient
αλ = (4)
Example 1:Determination of the molar extinction coefficient of ATP
ATP was solved in water at pH 7 and measured at 260 nm[1]. The OD260 of different ATP concentrations wasdetermined and calibration curves for UV-Star®
Microplates and cuvettes were generated (Fig. 3).
The absorbance (A260) of a 30 µM/l ATP solution (c) was0.407. The pathlength d of the sample was 1 cm. Based onthe data the molar extinction coefficient was calculatedusing equation (4).
αλ = (4)
Absorption Aλ = 0.407 AUConcentration c = 30 µM/lPathlength d = 1 cm
αλ =
αλ = 13.57 • 10-3
Wavelength / nm
Op
tical
Den
sity
/A
U
solid bottom, 1 mm
µClear®, 200 µm
µClear®, 75 µm
UV-Star®, 140 µm
Figure 2b: Optical density in solid bottom polystyrene (1 mm bottomthickness), µClear® (200 µm and 75 µm polystyrene film bottom) andUV-Star® (140 µm film bottom) microplates
I1I0
Aλc • d
0.407 l30 µM • cm
lµM • cm
Figure 3: ATP was dissolved in water at pH 7 and measured at roomtemperature at 260 nm
ATP concentration in µM/l
Op
tical
Den
sity
/A
U
Cuvette / 1 cm pathlength
Half Area Microplate / 170 µl /1 cm pathlength
Half Area Microplate / 80 µl /0.5 cm pathlength
y = 0.0138x + 0.0198
y = 0.0069x + 0.0051
y = 0.0134x + 0.0025
[ [] ]
Aλ
c • d
2. UV/VIS of nucleic acids and proteins
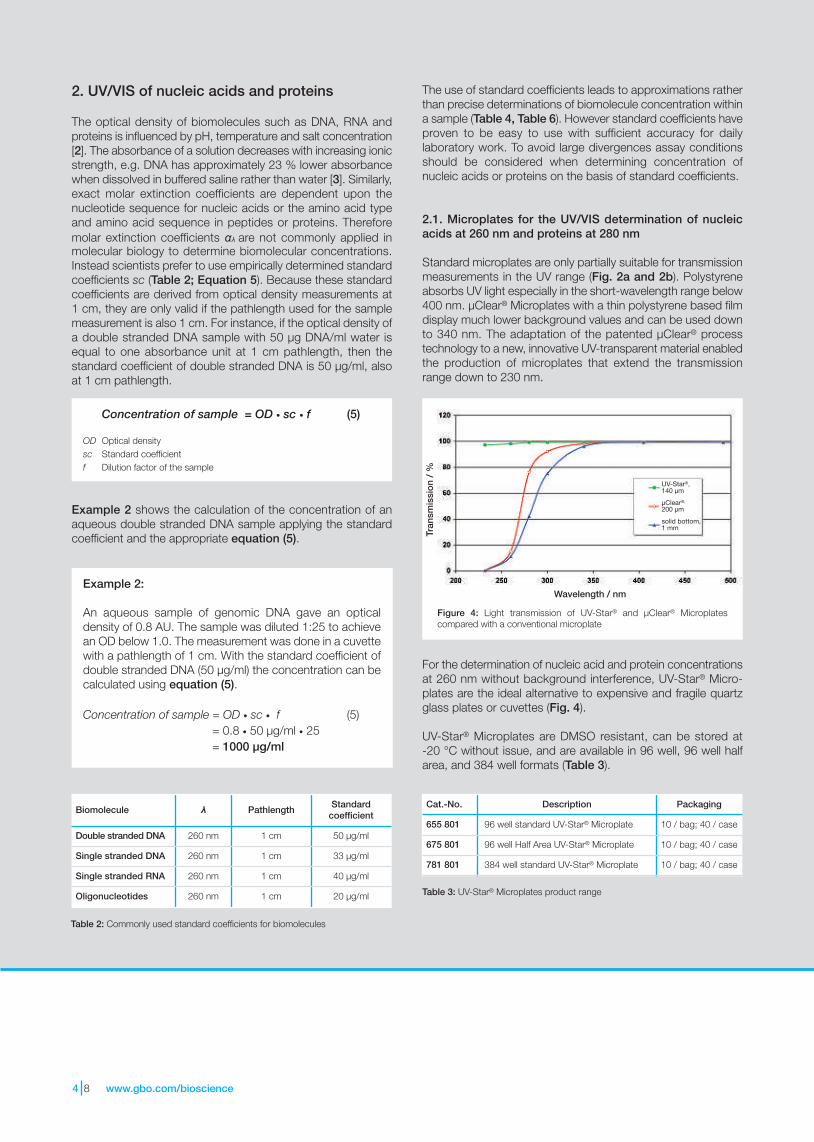
The optical density of biomolecules such as DNA, RNA andproteins is influenced by pH, temperature and salt concentration[2]. The absorbance of a solution decreases with increasing ionicstrength, e.g. DNA has approximately 23 % lower absorbancewhen dissolved in buffered saline rather than water [3]. Similarly,exact molar extinction coefficients are dependent upon thenucleotide sequence for nucleic acids or the amino acid typeand amino acid sequence in peptides or proteins. Thereforemolar extinction coefficients αλ are not commonly applied inmolecular biology to determine biomolecular concentrations.Instead scientists prefer to use empirically determined standardcoefficients sc (Table 2; Equation 5). Because these standardcoefficients are derived from optical density measurements at1 cm, they are only valid if the pathlength used for the samplemeasurement is also 1 cm. For instance, if the optical density ofa double stranded DNA sample with 50 µg DNA/ml water isequal to one absorbance unit at 1 cm pathlength, then thestandard coefficient of double stranded DNA is 50 µg/ml, alsoat 1 cm pathlength.
Example 2 shows the calculation of the concentration of anaqueous double stranded DNA sample applying the standardcoefficient and the appropriate equation (5).
4 8 www.gbo.com/bioscience
The use of standard coefficients leads to approximations ratherthan precise determinations of biomolecule concentration withina sample (Table 4, Table 6). However standard coefficients haveproven to be easy to use with sufficient accuracy for dailylaboratory work. To avoid large divergences assay conditionsshould be considered when determining concentration ofnucleic acids or proteins on the basis of standard coefficients.
2.1. Microplates for the UV/VIS determination of nucleicacids at 260 nm and proteins at 280 nm
Standard microplates are only partially suitable for transmissionmeasurements in the UV range (Fig. 2a and 2b). Polystyreneabsorbs UV light especially in the short-wavelength range below400 nm. µClear® Microplates with a thin polystyrene based filmdisplay much lower background values and can be used downto 340 nm. The adaptation of the patented µClear® processtechnology to a new, innovative UV-transparent material enabledthe production of microplates that extend the transmissionrange down to 230 nm.
For the determination of nucleic acid and protein concentrationsat 260 nm without background interference, UV-Star® Micro-plates are the ideal alternative to expensive and fragile quartzglass plates or cuvettes (Fig. 4).
UV-Star® Microplates are DMSO resistant, can be stored at-20 °C without issue, and are available in 96 well, 96 well halfarea, and 384 well formats (Table 3).
Concentration of sample = OD • sc • f (5)
OD Optical densitysc Standard coefficientf Dilution factor of the sample
Example 2:
An aqueous sample of genomic DNA gave an opticaldensity of 0.8 AU. The sample was diluted 1:25 to achievean OD below 1.0. The measurement was done in a cuvettewith a pathlength of 1 cm. With the standard coefficient ofdouble stranded DNA (50 µg/ml) the concentration can becalculated using equation (5).
Concentration of sample = OD • sc • f (5)= 0.8 • 50 µg/ml • 25= 1000 µg/ml
Biomolecule λ PathlengthStandard
coefficient
Double stranded DNA 260 nm 1 cm 50 µg/ml
Single stranded DNA 260 nm 1 cm 33 µg/ml
Single stranded RNA 260 nm 1 cm 40 µg/ml
Oligonucleotides 260 nm 1 cm 20 µg/ml
Figure 4: Light transmission of UV-Star® and µClear® Microplatescompared with a conventional microplate
Wavelength / nm
Tran
smis
sio
n/
%
UV-Star®,140 µm
µClear®,
200 µm
solid bottom,1 mm
Cat.-No. Description Packaging
655 801 96 well standard UV-Star® Microplate 10 / bag; 40 / case
675 801 96 well Half Area UV-Star® Microplate 10 / bag; 40 / case
781 801 384 well standard UV-Star® Microplate 10 / bag; 40 / case
Table 2: Commonly used standard coefficients for biomolecules
Table 3: UV-Star® Microplates product range

Figure 5: Variable pathlength in a microplate well (A) compared to a fixpathlength in a cuvette (B)
Figure 6: Resultant pathlengths with different sample volumes within thewell of a 96 well half area microplate
3. UV/VIS spectroscopy in microplates
The pathlength of a sample in a transmission measurement in astandard cuvette is normally 1 cm, as almost all cuvettes havea standardised pathlength of 1 cm.
This is not the case for measuring optical density withinmicroplates. Here the pathlength is determined by the amountand corresponding height of liquid sample filled in each well(Fig. 5 and 6). For a direct comparison of an OD measurementmade in a microplate well with an OD measurement made in acuvette, the results of the microplate well must be recalculatedto a pathlength of 1 cm.
The recalculation can then be carried out using equation 6:
3.1 Adaptation to 1 cm pathlength
Several options are available to achieve the pathlengthcorrection to 1 cm.
3.1.1 Mathematical approach
The simplest method to recalculate the absorbance in amicroplate well to a pathlength of 1 cm is by using a mathe-matical approach.
Depending on the geometry of the specific microplate well(i.e. customarily cylindrical shaped in the case of round welltops; rectangular in the case of square well tops), the adequateformula must be used (Fig. 7a). The dimensions of the wells ofmost Greiner Bio-One microplates are listed in our catalogue orcan be downloaded from our website (www.gbo.com/bioscience).
The calculation of the liquid height using the mathematicalapproach is shown in example 3 and example 4. Due to aslight tapering in the well geometry, the mean diameter of a filledwell can only be estimated, and the meniscus of the liquid in thewell cannot be taken into account either. However the mathe-matical approach is simple, without need for any specialdevices, with final results comparable to measurementsperformed with a cuvette (Table 4).
0.25 cm= 39 µL
0.5 cm= 80 µL
1 cm= 170 µL
5 8www.gbo.com/bioscience
A B
c, α
I0 I1
c, α
d
39 µL80 µL
170 µL
0.25 cm0.5 cm
1 cmFigure 7a: Volume of diverse bodies
h = (7)
This formula can be used forcalculating the filling level inrelation to the filling volume in a 96well microplate with cylindricalwells.
h = (8)
This formula can be used forcalculating the filling level inrelation to the filling volume in 384and 1536 well microplates withrectangular wells.
4 • Vπ • d2
Va • b
Figure 7b: Well geometry of a96 well half area microplate
Figure 7c: Well geometry of a384 well standard microplate
I1
I0
d
ODλ 1cm = (6)ODλ sample
d [cm]

3.1.2 Absorption of water in the near infrared (NIR) asreference for a pathlength correction
Water is essentially transparent from 200 to 900 nm (Fig. 8) butin the near infrared (NIR), it has a distinctive absorption peaknear 977 nm [4]. This specific absorbance band, in a spectralregion where most biological molecules have little or noabsorbance, can be used to measure the pathlength of lightthrough an aqueous sample [3, 5, 6].
Since the absorbance (i.e. optical density) of water Areference forthe pathlength of 1 cm dreference can be determined in ameasurement in a standard cuvette or in a measurement in areference well of the used microplate, filled with water equivalentto 1 cm pathlength, it can be used as a reference.
The absorbance of water Areference can be set in relation to theabsorbance of the sample Asample leading to the actual path-length of the sample dsample.
As the absorption of water is temperature dependent, samplemeasurements may be subject to error if they are not made atexactly the same temperature as the reference. To avoid theseerrors, reference measurements can be conducted at or near1000 nm (e.g. 997 nm). At this wavelength, the isosbestic pointof water, the temperature has a minor influence on theabsorbance of water [3, 5]. Nevertheless, 977 nm is closeenough to the isosbestic point to get decent reduction of thetemperature dependence.
6 8 www.gbo.com/bioscience
dsample = • 1 cm (9)
dsample Unknown pathlength of the sampleAsample Absorption of aqueous sample with unknown pathlength dsample
Areference Absorption of water (reference) with 1 cm pathlength
Half Area Microplate
OD 0.43
Pathlength 100 µL 0.6 cm
OD corrected to 1 cm (OD1cm) 0.72
Calculated DNAconcentration
36 µg/ml
Quartz Glass Cuvette
OD 1 cm 0.68
Calculated DNAconcentration
34 µg/ml
Figure 8: Absorption scan of water
Wavelength / nm
Op
tical
den
sity
/A
U
Example 3:
The volume of 100 µl is equivalent to a liquid height of5.8 mm in a well of a half area microplate.
h = (7)
h = = 5.8 mm
Example 4:
The volume of 100 µl is equivalent to a liquid height of8.2 mm in a standard 384 well microplate.
h = (8)
h = = 8.2 mm
4 • Vπ • d2
4 • 100 mm3
3.14 • (4.69 mm)2
Va • b
100 mm3
(3.5 mm)2
Table 4: Final calculated DNA concentration
Asample
Areference
Calculation of the concentration of an aqueous DNAsample
Measurements taken in a half area microplate well (Cat.-No.675 801) with a sample volume of 100 µl were compared withthose from a quartz glass cuvette (1 cm pathlength, 1000 µlsample volume). The pathlength of the half area microplate wellwas calculated using equation (7) with the dimensions given infigure 7b.
The final DNA concentration was calculated using the standardcoefficient of DNA (50 µg/ml). The results are listed in table 4.

For a more precise measurement the background of theaqueous sample should be considered by deducting theabsorption at 900 nm. So equation (9) may be modified to:
In parallel to the absorption measurement at 977/997 nm and900 nm the absorption (Aλ sample) of the aqueous sample shouldbe measured at the wavelength λ whereas λ is defined as thespecific wavelength necessary for the determination of theconcentration of the substance (i.e. for DNA the wavelength ofdetection is 260 nm).
With the determined pathlength of the sample (dsample), theabsorption of the sample (Aλ sample) can be corrected to 1 cm(Aλ sample 1cm) as follows:
dsample = • 1 cm (10)
dsample Unknown pathlength of the sample(A977-A900)sample Difference of the absorption of aqueous sample with
unknown pathlength dsample measured at 977 nm and900 nm
(A977-A900)reference Difference of the absorption of water (reference) with 1cmpathlength measured at 977 nm and 900 nm
Aλ sample 1cm = (11)
Aλ sample 1cm Absorbance of substance to be measured at specificwavelength λ corrected to 1 cm
Aλ sample Absorbance of the sample at the specific wavelength λdsample Determined pathlength of the sample
Using equation (10) the pathlength of the sample can bedetermined:
dsample = • 1 cm (10)
= • 1 cm
= 0.61 cm
Using equation (11) the optical density of the sample canbe corrected to 1 cm:
Aλ sample 1cm = (11)
=
= 0.66
Using the standard coefficient and equation (5) the finalDNA concentration of the sample can be calculated:
Concentration of sample = OD • sc • f (5)
= 0.66 • 50 µg/ml • 1
= 33 µg/ml
7 8www.gbo.com/bioscience
(A977 - A900)sample
(A977 - A900)reference
Aλ sample • 1cmdsample
Aλ sample • 1 cmdsample
0.40 • 1 cm0.61 cm
Example 5:
In example 5 the calculation for the concentration of doublestranded DNA using the pathlength correction is explained.The absorption of an aqueous DNA sample of 100 µl in awell of a half area microplate (Cat.-No. 675 801) at 977 nmwas 0.15 AU, the background at 900 nm was 0.04 AU. Theabsorption of the reference (water) was 0.24 AU at 977 nmand the background at 900 nm was 0.06 AU. The ab-sorption of the sample at 260 nm was 0.47 AU, and thebackground 0.07 AU.
(A977 - A900)sample = 0.15 - 0.04 = 0.11
(A977 - A900)reference = 0.24 - 0.06 = 0.18
Aλ sample = 0.47 - 0.07 = 0.40
(A977 - A900)sample
(A977 - A900)reference
0.110.18
3.1.3 Microplate readers with pathlength correction
In 1994 Molecular Devices Inc. (Molecular Devices Inc., Sunny-vale, CA, USA; www.moleculardevices.com) introduced a newmicroplate reader equipped with a monochromator, rather thanbandpass filters, for flexible wavelength selection [5]. Anothermonochromator based reader, the PowerWave™, was intro-duced by BioTek Instruments Inc. (BioTek Instruments Inc.,Winooski, VT, USA; www.biotek.com) [6]. The innovativetechnology of both readers facilitated readouts below 340 nmand supported the high-throughput measurement of nucleicacids and proteins in microplates, in tandem with the increasingimportance of genomic and proteomic research projects.
Both manufacturers supply software programs to enable a path-length correction to 1 cm. The basis of the pathlength correc-tion in both devices is a reference measurement of theabsorbance of water in the near infrared (NIR) as described insection 3.1.2.The usage of a device with an integrated software program iscertainly the most popular and most convenient method todetermine the absorbance of a sample at 1 cm. Moreinformation about the reader technology of Molecular DevicesInc. and BioTek Instruments Inc. can be found on their websitesand in application notes [5, 6].

4. Conclusion
The various strategies described in this application note tomeasure and calculate unknown DNA concentrations ofaqueous samples all yielded results of sufficient accuracy fordaily laboratory work, with only negligible differences betweenresults obtained with microplates vs. cuvettes (Table 6).
Compared to measurements with cuvettes, microplates allowthe measurement of many samples in parallel with samplevolumes down to 30 µl. The samples can be easily retrieved andeven stored within the microplates. Therefore disposablemicroplates offer an ideal alternative to expensive and fragilequartz glass cuvettes or quartz glass microplates.
___________________References
[1] Bock R. M., N.S. Ling, D.A. Morell, S.H. Lipton: Ultraviolet Absorption Spectraof Adenosin-5’-Triphosphate and Related 5’-Ribonucleotides. Archives ofBiochemistry and Biophysics (1952): 62, 253-264.
[2] Willfinger W. W.: Effect of pH and Ionic Strength on the SpectrophotometricAssessment of Nucleic Acid Purity. BioTechniques (1997), Vol. 22, No. 3;474-481.
[3] Mc Gown E. L.: UV Absorbance Measurements of DNA in Microplates.BioTechniques (2000): Vol. 28, No.1, 60-64.
[4] Palmer K. F. and D. Williams: Optical properties of water in the near infrared.Journal of the Optical Society of America (1974): 64, 1107-1110.
[5] Making optical density measurements automatically corrected to a 1 cm path-length in the SPECTRAmax® Plus Microplate spectrophotometer. (The three P’s ofPathcheck™: Principles, Procedures and Precautions. Molecular DevicesCorporation. Application Note 25.
[6] Rieger, A. and P. G. Held: Quantifizierung von Nukleinsäuren und Proteinen imMicroplate-Format. GIT Laborfachzeitschrift (9/2001): 898-902.
www.gbo.com/bioscience
Germany (Main office)Greiner Bio-One GmbHPhone: (+49) 7022 948-0E-Mail: [email protected]
AustriaGreiner Bio-One GmbHPhone: (+43) 7583 6791-0E-Mail: [email protected]
BelgiumGreiner Bio-One N. V.Phone: (+32) 2-4 61 09 10E-Mail: [email protected]
NetherlandsGreiner Bio-One B. V.Phone: (+31) 172-42 09 00E-Mail: [email protected]
FranceGreiner Bio-One SASPhone: (+33) 169-86 25 50E-Mail: [email protected]
UKGreiner Bio-One Ltd.Phone: (+44) 1453-82 52 55E-Mail: [email protected]
JapanGreiner Bio-One Co. Ltd.Phone: (+81) 3-35 05-88 75E-Mail: [email protected]
USAGreiner Bio-One North America Inc.Phone: (+1) 704-261-78 00E-Mail: [email protected]
Revision: April 2008 - 073 041
DNAconcentration
Mathematical approach,Half Area Microplate (Cat.-No. 675 801)
36 µg/ml
Pathlength correction,Half Area Microplate (Cat.-No. 675 801)
33 µg/ml
Calibration standards, 1 cm pathlength,Half Area Microplate (Cat.-No. 675 801)
32 µg/ml
Calibration standards,quartz glass cuvette
33 µg/ml
Table 6: Comparison of the results based on the mathematical approach(section 3.1.1), pathlength correction (section 3.1.2) and the calibration standards(section 3.1.4)
3.1.4 Standard curve on the basis of calibrated standards
Finally, the most classical method to determine the con-centration of a sample in UV/VIS spectroscopy is theimplementation of references to establish a standard curve.Calibrated standards with known concentrations are used tocreate a straight line (Fig. 9). If the sample volume remainsconstant for all measurements, the pathlength has not to beconsidered for this type of calibrated standard determination. Inaddition, determinations made from both cuvettes andmicroplates will give the same results when the same standardsare used (Fig. 9, Table 5). The advantage of this method isobvious: No special devices, optical filters, monochromators orcomplicated and time consuming calculations are necessary.The method is simple and precise.
Figure 9: The measurement of DNA based on calibrated standards
DNA concentration / µg/ml
Op
tical
den
sity
/A
U
Cuvette
Half Area Microplate / 170 µl / 1 cm pathlength
Half Area Microplate / 80 µl / 0.5 cm pathlength
y = 0.0198x + 0.0277
y = 0.0102x + 0.0038
y = 0.0201x - 0.0015
CuvetteHalf Area
170 µlHalf Area
80 µl
Opticaldensity [y]
0.668 0.669 0.342
Linearregression
x = x = x =
DNA concen-tration [x]
33 µl/ml 32 µg/ml 33 µg/ml
Table 5: Determination of DNA concentrations in half area microplates(Cat.-No. 675 801) and quartz glass cuvettes based on calibrated standards(Fig. 9)
y + 0.00150.0201
y - 0.02770.0198
y - 0.00380.0102