Appliance Energy Efficiency Labels in Costa Rica Energy Efficiency Labels in Costa Rica ... This...
148
WORCESTER POLYTECHNIC INSTITUTE Appliance Energy Efficiency Labels in Costa Rica Interactive Qualifying Project Submitted to: C. Bernhardt Johst Cámara de Industrias de Costa Rica Submitted by: Benjamin Fletcher, Syed Asaad Hussain, Christopher Keane, and Hanna Schmidtman Submitted on: May 7, 2014 Faculty Advisors: Prof. Reinhold Ludwig and Prof. Holly K. Ault REL 9042 This report represents the work of four WPI undergraduate students submitted to the faculty as evidence of completion of a degree requirement. WPI routinely publishes these reports on its website without editorial or peer review. For more information about the projects program at WPI, please see http://www.wpi.edu/Academics/Projects
Transcript of Appliance Energy Efficiency Labels in Costa Rica Energy Efficiency Labels in Costa Rica ... This...

WORCESTER POLYTECHNIC INSTITUTE
Appliance Energy Efficiency Labels in Costa Rica
Interactive Qualifying Project
Submitted to:
C. Bernhardt Johst
Cámara de Industrias de Costa Rica
Submitted by:
Benjamin Fletcher, Syed Asaad Hussain, Christopher Keane, and Hanna Schmidtman
Submitted on:
May 7, 2014
Faculty Advisors:
Prof. Reinhold Ludwig and Prof. Holly K. Ault
REL 9042
This report represents the work of four WPI undergraduate students submitted to the faculty as evidence of completion
of a degree requirement. WPI routinely publishes these reports on its website without editorial or peer review. For more
information about the projects program at WPI, please see http://www.wpi.edu/Academics/Projects

i
Abstract
Despite Costa Rica’s goal to become carbon neutral by 2021, the country burns
increasing amounts of imported fuel to meet its energy demands. This creates a need for
measures to reduce the amount of energy consumed in the country. The goal of this project,
sponsored by the Cámara de Industrias de Costa Rica (CICR), was to develop an energy
efficiency label to inform consumers of the energy consumption of household appliances. To do
this, we surveyed consumers to assess their opinions on labels and to evaluate features of labels.
We next met with organizations involved in the implementation of labels to understand the
current process and develop recommendations of improvements. We created a new label that
can be used in Costa Rica to help consumers make informed appliance purchasing decisions.
This label can be implemented and standardized through the collaboration of all related
organizations. Our research furthermore identified several flawed aspects of the current
implementation process, which led to recommendations of standardization, communication, and
education.

ii
Acknowledgements
We would like to thank and acknowledge the following people for their help and contributions to
our project:
Bernhardt Johst, our sponsor, for organizing our project, facilitating all necessary resources,
and providing direction for our project
Luisa Díaz Sánchez, for providing thoughtful insights to our project and organizing interviews
Professors Reinhold Ludwig and Holly Ault, our project advisors, for their advice and insight
that led to this report
Martha Castillo Díaz, for allowing us the opportunity to work with the CICR on this project
Mayeni Rivera Valverde, for constantly helping us with resources necessary for surveys and
meetings
Laura Cornejo, for coordinating our trips to local appliance stores
Virgilio Jiménez and Heyleen Villalta Maietta, for the explanations of ICE’s responsibilities
and the informative tour of the Energy Efficiency Laboratory
Johanna Acuña Loría, Humberto Mora Murillo, and Ilse Delgado Delgado for giving us
useful insight into the functions and goals of ECA
Alexandra Rodríguez and Diego Cordero Jiménez for clarifying the responsibilities of
INTECO
Yorleny Rojas Lopéz and José Manuel Campos, for meeting with us to discuss the role that
MEIC plays in the implementation of efficiency labels
Professor Robert Traver, for teaching us how to write a professional, social science study and
helping to shape our project through ID 2050
Marcela and Jimmy Music, our project coordinators, for arranging the project and ensuring a
comfortable stay in Costa Rica
Worcester Polytechnic Institute, for providing the opportunity to travel abroad while gaining
experience about the sponsor-team relationship that mimics situations of industry

iii
Authorship Page The content and information provided in the following IQP report represents the knowledge and
understanding of all members of the team. Everyone gave input on the organization and material
of each section. Also, the strengths of our team warranted an unusual paper-writing system: Syed
Asaad Hussain wrote general ideas that were then clarified by Hanna Schmidtman. Finally,
continuity and clarity were ensured by Benjamin Fletcher, who also translated selected material
to Spanish. Christopher Keane meanwhile was responsible for all of the data analysis. A more
detailed breakdown of authorship is found in the following table:
SECTION PRIMARY
AUTHOR(S)
PRIMARY
EDITOR(S)
ABSTRACT Hanna All
EXECUTIVE SUMMARY Hanna All
INTRODUCTION Ben All
LITERATURE REVIEW: 2.1 Cámara de Industrias de
Costa Rica
Ben All
LITERATURE REVIEW: 2.2 Electricity Demands and
Energy Efficiency in Costa Rica
Asaad All
LITERATURE REVIEW: 2.3 Energy Efficiency Labels Hanna and Chris All
OBJECTIVES All Ben
METHODOLOGY All Ben
ANALYSIS AND RESULTS: 5.1 Consult Implementation
Bodies
Hanna and
Asaad
Ben
ANALYSIS AND RESULTS: 5.2 Comparative Analysis Chris and Hanna Ben and Asaad
ANALYSIS AND RESULTS: 5.3 Assess Local Opinions Chris Ben and Asaad
ANALYSIS AND RESULTS: 5.4 Implementation of Label Chris and Asaad Ben and Asaad
CONCLUSION Asaad and
Hanna
Hanna
RECOMMENDATIONS: 7.1 Steps for Future
Implementation of an Efficiency Label in Costa Rica
Asaad Hanna
RECOMMENDATIONS: 7.2 Final Label Chris Hanna
APPENDICES Chris All

iv
Table of Contents
Abstract ............................................................................................................................................ i
Acknowledgements ......................................................................................................................... ii
Authorship Page ............................................................................................................................. iii
Definitions of Commonly Used Terms .......................................................................................... xi
Executive Summary ..................................................................................................................... xiii
Resumen Ejecutivo en Español .................................................................................................... xvi
Chapter 1: Introduction ................................................................................................................. 19
Chapter 2: Literature Review ........................................................................................................ 21
2.1 Cámara de Industrias de Costa Rica .................................................................................... 21
2.2 Electricity Demands and Energy Efficiency in Costa Rica ................................................. 21
2.3 Energy Efficiency Labels .................................................................................................... 24
2.3.1 United States ................................................................................................................. 24
2.3.2 European Union ............................................................................................................ 30
Chapter 3: Objectives .................................................................................................................... 33
Chapter 4: Methodology ............................................................................................................... 34
4.1 Consult Implementation Bodies .......................................................................................... 34
4.2 Comparative Analysis ......................................................................................................... 35
4.3 Assess Local Perspectives ................................................................................................... 35
4.3.1 Survey Consumers ........................................................................................................ 36
4.3.2 Survey Sales Representatives: ...................................................................................... 38
4.3.3 Analysis ........................................................................................................................ 38
4.4 Label Designs and Evaluation ............................................................................................. 39
Chapter 5: Analysis and Results ................................................................................................... 41
5.1 Consult Implementation Bodies .......................................................................................... 41
5.1.1 The Law LEY 7447 ...................................................................................................... 41
5.1.2 Current Process of Certification ................................................................................... 43
5.1.3 Flaws within the Current Implementation Process ....................................................... 48
5.2 Comparative Analysis ......................................................................................................... 52
5.2.1 Results of Case Studies................................................................................................. 52

v
5.2.2 Correlations from Survey Data Regarding Label Drafts .............................................. 53
5.2.3 Explanation of Error and Bias ...................................................................................... 60
5.3 Assess Local Opinions ........................................................................................................ 61
5.3.1 Public Opinions of Appliance Features ........................................................................ 61
5.3.2 Sales Representative Data ............................................................................................ 64
5.4 Implementation of Label ..................................................................................................... 66
5.4.1 Final Design Drafts ....................................................................................................... 66
5.4.2 Evaluation of Drafts...................................................................................................... 68
Chapter 6: Conclusions ................................................................................................................. 71
Chapter 7: Recommendations ....................................................................................................... 73
7.1 Steps for Future Implementation of an Efficiency Label in Costa Rica ............................. 73
7.1.1 Collaboration ................................................................................................................ 73
7.1.2 Standardized Mandatory Label System ........................................................................ 75
7.1.3 Education ...................................................................................................................... 76
7.1.4 Government Involvement ............................................................................................. 78
7.2 Standardized Label based on Consumer Input and Ley 7447 ............................................. 80
Resumen de Recomendaciones en Español .................................................................................. 82
Appendix A: ENERGY STAR Refrigerator Standards ................................................................ 86
Appendix B: Consumer Awareness and Comparative Analysis Survey ...................................... 87
Demographic Data..................................................................................................................... 87
Part 1 – Buying Tendencies ...................................................................................................... 89
Part 2 – International Label Comparison .................................................................................. 98
Part 3 – Label features ............................................................................................................. 105
EnergyGuide (Etiqueta A) Features .................................................................................... 107
European Union Energy Efficiency Label (Etiqueta B) Features ....................................... 109
ENERGY STAR Question .................................................................................................. 111
ENERGICE Question .......................................................................................................... 111
Correlation Matrix ................................................................................................................... 113
Appendix C: Survey of Sales Representatives............................................................................ 116
Appendix D: Draft Label Designs .............................................................................................. 126

vi
Appendix E: Survey for Label Features and Designs ................................................................. 132
Demographic Data................................................................................................................... 132
Part 1 – Importance of Energy Efficiency ............................................................................... 132
Part 2 – Classification System ................................................................................................. 134
Part 3 – Label Title .................................................................................................................. 135
Part 4 – Label Color ................................................................................................................ 138
Part 5 – Label Arrangement .................................................................................................... 140
Part 6 – Draft Label Designs ................................................................................................... 142
References ................................................................................................................................... 144

vii
Table of Figures
Figure 1: Energy Source Distribution in Costa Rica .................................................................... 23
Figure 2: Example of Energy Efficiency Label in the US: ENERGY STAR Label ................... 26
Figure 3: Annotated EnergyGuide Label ...................................................................................... 28
Figure 4: Transitional EnergyGuide Label ................................................................................... 29
Figure 5: The European Union Energy Label ............................................................................... 32
Figure 6: Example of Current Label that Meets Legal Requirements .......................................... 42
Figure 7: Flow Chart of the Inter-Relationships of Label Implementation Organizations ........... 44
Figure 8: The ENERGICE Label .................................................................................................. 46
Figure 9: Example of Refrigerator with Multiple Energy Efficiency Labels in Store.................. 52
Figure 10: Recognition of International Labels in Costa Rica ..................................................... 54
Figure 11: Percentages of Purchase Preference Based on International Label ............................. 56
Figure 12: Most Visually Appealing Example Label ................................................................... 56
Figure 13: Number of Times EnergyGuide and EU Label Features Were Misunderstood .......... 57
Figure 14: Average Usefulness rating of six of the EnergyGuide Label Features ....................... 58
Figure 15: Average Usefulness Rating of Six of the European Union Energy Label Features .... 59
Figure 16: Percentage of Participants Who Had Seen Energy Efficiency Labels ........................ 61
Figure 17: Average Rate of Importance for Seven Appliance Features ....................................... 62
Figure 18: Rating of Importance of Energy Efficiency When Not Compared to Other Features 63
Figure 19: Influence on Label Preference Based on Information or Design ................................ 64
Figure 20: Recognition of International Labels between the General Public and Sales Reps ...... 65
Figure 21: Six Possible Label Designs (A – F) Used in Evaluations of Consumer Preference ... 67
Figure 22: i) Net Selection of Possible Scaling Systems, ii) Favorite Scaling Option ................. 68
Figure 23: i) Net Selection of Possible Titles, ii) Favorite Title Option....................................... 69
Figure 24: i) Net Selection of Possible Label Designs, ii) Favorite Label Design Option ........... 70
Figure 25: Final Recommended Label Design ............................................................................. 81
Figure 26: Average Importance Rating of Factors when Shopping for Home Appliances .......... 90
Figure 27: Number of Times Each Factor was Rated as Most Important .................................... 90
Figure 28: Average Importance of Factors when Shopping for Home Appliances vs. Gender ... 91
Figure 29: Average Importance of Factors when Shopping for Home Appliances vs. Income ... 91
Figure 30: Importance of Energy Efficiency when Rated on a Scale of 1 to 5 ............................ 92
Figure 31: Importance of Energy Efficiency on a Scale of 1 to 5 vs. Age of Respondent ........... 93
Figure 32: Those Surveyed who Had and Had Not Seen Energy Efficiency Labels ................... 94
Figure 33: Locations where Consumers Obtain Information when Shopping for Appliances ..... 96
Figure 34: Those who Would Pay More for a Product if it was Recycled ................................... 97
Figure 35: Those who Knew that Products can be Returned to Manufacturers to be Recycled... 98
Figure 36: Example of International Energy Efficiency Labels Compared in Part 2 ................... 98
Figure 37: Those Who Recognized At Least One of the International Labels ............................. 99
Figure 38: Distribution of International Labels that Were Recognized During Our Survey ........ 99

viii
Figure 39: Distribution of International Labels that Grabbed the Respondent’s Attention First 100
Figure 40: International Labels That Consumers Thought were Most Visually Appealing ....... 101
Figure 41: Most Visually Appealing Label vs. Sex of Respondent ............................................ 101
Figure 42: Participants that Found Information or Design of the Label Most Important ........... 102
Figure 43: Preferences of Design or Information on a Label vs. Sex of Respondent ................. 102
Figure 44: Distribution of International Labels that Participants Found Most Informative ....... 103
Figure 45: Distribution of International Labels that Participants Found Most Understandable . 103
Figure 46: International Labels that Participants Thought Displayed the Most Information ..... 104
Figure 47: Iternational Labels for Which Participants Would Buy the Product ......................... 104
Figure 48: International Labels which Participants Considered their Favorite Label Type ....... 105
Figure 49: Specific Characteristics of Energy Efficiency Label Features Examined ................. 106
Figure 50: EnergyGuide Features Participants Found Useful .................................................... 107
Figure 51: Number of Times a Feature of EnergyGuide was Not Understood .......................... 108
Figure 52: Number of Times Each Feature of EnergyGuide was Rated as Most Useful ........... 108
Figure 53: Usefulness of European Union Label Features ......................................................... 109
Figure 54: Number of Times a Feature of the European Union Label Was Not Understood .... 110
Figure 55: Number of Times Each Feature of the European Label Was Rated Most Useful ..... 110
Figure 56: Consumers Who Would Buy an Appliance with ENERGY STAR .......................... 111
Figure 57: The ENERGICE Label Developed by ICE ............................................................... 111
Figure 58: Distribution of Participants Who Had and Had Not Seen the ENERGICE Label .... 112
Figure 59: Important of Energy Efficiency to Consumers Acording to Sales Reps ................... 119
Figure 60: Sales Reps that Use Energy Efficiency to Persuade Consumers to Buy Appliances 120
Figure 61: Sales Reps that Think a Standardized Energy Efficiency Label Would be Useful ... 121
Figure 62: Sales Reps that Think a Energy Efficiency Label Would Promote Products? .......... 123
Figure 63: Draft Label A, Minimalist and Highly Informative Law Complaint Except Title .... 126
Figure 64: Draft Label B, Designed to be Informative and Simple, but Not Law Compliant .... 127
Figure 65: Draft Label C, Designed to Test Extremely Simple Label, but Not Law Compliant 128
Figure 66: Draft Label D, Designed to Test Unique Label Shapes, butNot Law Compliant ..... 129
Figure 67: Draft Label E, Incorporate as Many Colors as Possible andFully law compliant..... 130
Figure 68: Draft Label F, Official and Fully Law Compliant Except for Label Title ................ 131
Figure 69: Response Count of Each Level of Energy Efficiency Importance ............................ 133
Figure 70: Those Who had Seen Energy Efficiency Labels Before ........................................... 133
Figure 71: Visual aid for Energy Efficiency Comparison Scale Systems for Survey Two ........ 134
Figure 72: Number of Responses for Best and Worst Scale System .......................................... 135
Figure 73: Net Response to Each Type of Scale System ............................................................ 135
Figure 74: Visual aid for Potential Label Titles for Second Survey ........................................... 136
Figure 75: Number of Responses for Best and Worst Label Title .............................................. 137
Figure 76: Net Response to Each Label Title ............................................................................. 137
Figure 77: Visual Aid for Potential Label Colors for Second Survey ........................................ 138
Figure 78: Number of Responses for Best and Worst Label Color ............................................ 139
ix
Figure 79: Net Response to Each Possible Label Color ............................................................. 139
Figure 80: Visual Aid for Potential Label Content Arrangements for Second Survey .............. 140
Figure 81: Number of Responses for Best and Worst Label Arrangements ............................... 141
Figure 82: Net Response to Each Label Layout ......................................................................... 141
Figure 83: Number of Responses for Best and Worst Draft Label Designs ............................... 142
Figure 84: Net Response to Each Example Draft Label ............................................................. 143

x
Table of Tables
Table 1: Locations Where Surveys were Conducted in San José, Costa Rica ............................. 36
Table 2: Suggested Committee Members, Roles, and Responsibilities ........................................ 74
Table 3: ENERGY STAR Energy Efficiency Criteria for Residential Fridges and Freezers ...... 86
Table 4: Percentage of Survey Respondents by Age Range ........................................................ 87
Table 5: Percentage of Survey Respondents by Average Monthly Income ................................. 88
Table 6: Percentage of Survey Respondents by Sex ..................................................................... 88
Table 7: Average Importance of Energy Efficiency when Rated on a Scale from 1 to 5 ............. 92
Table 8: Those who Found the Information from Energy Efficiency Labels Helpful .................. 94
Table 9: Those whose Buying Decisions were Influenced by Energy Efficiency Labels ............ 94
Table 10: Locations where Consumers Obtain Information when Shopping for Appliances ...... 96
Table 11: Where do you Find Information when Looking for Buy an Appliance? ...................... 97
Table 12: Example Data Entry Columns for Equation (1) ......................................................... 113
Table 12: Factors that Sales Representatives Believe are Most Important to Consumers .......... 116
Table 13: Word Count for Responses for Factors Most Important to Consumers ..................... 117
Table 14: Feature of Products That Sales Reps Use to Persuade Consumers ............................ 117
Table 15: Word Count of Features of Products That Sales Representatives Use to Sell ............ 118
Table 16: Statistical Averages for the Importance of Energy Efficiency to Consumers ............ 118
Table 17: Information that Sales representatives Use to Market Efficient Products .................. 120
Table 18: Word Count for Responses to Information that Sales reps Use to Market Efficiency 121
Table 19: Info in Labels that Will Persuade Consumers to Purchase Effciecnt Appliances ...... 122
Table 20: Word Count in Response to the Information of Labels that Will Persuade ............... 123
Table 21: Sales Representative Responses of Information Which Would be Useful on Label .. 124
Table 22: Word Count in Response to Information Which Would be Useful on Energy Label 124
Table 23: Where Sales Representatives Find Information that they Use to Sell Products ......... 125
Table 24: Word Count for Where Sales Reps Find Information that they Use to Sell Products 125
Table 25: Sex of those Surveyed in Survey Two ........................................................................ 132
Table 26: Average Importance of Energy Efficiency ................................................................. 132
Table 27: Word Count for Why Favorite Label was Chosen ..................................................... 143

xi
Definitions of Commonly Used Terms
ASEGIRE Company that promotes the responsible management of electronic waste
(Asociación de Empresarios para la Gestión Integral de Residuos Electrónicos)
CICR Chamber of Industry of Costa Rica (Cámara de Industrias de Costa Rica)
unites the industrial sector and works to improve industrial and economic
conditions for their member businesses
Decreto 29751 Costa Rican decree that requires specific information to be listed on the label
DOE Department of Energy of the United States
ECA Costa Rican Entity of Accreditation (Ente Costarricense de Acreditación) is
internationally recognized to accredit processes within Costa Rica
ENERGICE Seal of approval developed by ICE that demonstrates an appliance complies
with the energy efficiency standards by placing stars for the percentage of
improvement over the baseline-standard
ENERGY
STAR
Program in the United States that places the blue seal-of-approval to indicate
that a product is among the 10% of energy efficiency
EnergyGuide Energy efficiency label required by law to be placed on all appliances. Can be
recognized by its yellow background and bold black lettering
EPA Environmental Protection Agency of the United States
EPCA The Energy Policy Conservation Act of the United States that established a
minimum energy conservation standard
EU European Union (Unión Europea)
EU label Appliance label created in the European Union that ranks products on a
colorful “A+++” to “D” scale
FTC Federal Trade Commission of the United States
ICE Costa Rican Institute of Electricity (Instituto Costarricense de Electricidad) is a
large multifunctional corporation that is involved in the distribution of
electricity, and testing of energy efficiency, maintenance of water,
transportation, and telecommunications throughout the country

xii
INTECO Institute of Technical Norms of Costa Rica (Instituto de Normas Técnicas de
Costa Rica) is responsible for organizing the creation of technical standards for
Costa Rica
LEY 7447 Costa Rican law that mandates the clear display of energy efficiency labels on
appliances
MEIC Ministry of Economy, Industry, and Commerce (Ministero de Economía,
Industria, y Comercio)
MINAE Ministry of Environment and Energy (Ministerio de Ambiente y Energía)
Producers In our paper, we simplified the group that includes “manufacturers,”
“importers,” and “distributors” to be known simply as “producers”

xiii
Executive Summary
The majority of Costa Rica’s electricity is provided by renewable resources. Although these
means are less detrimental to the environment, they can be an unreliable source of energy.
Currently, 75% of the country’s power is supplied through hydroelectric plants. Unfortunately, in
2013, Costa Rica has experienced less rainfall than expected, which increases the demand for
imported fuels for electricity production (Rico, 2014). The use of these fuels is more expensive
for the consumer, and thus the price of electricity has been increasing, a situation that stresses the
need for alternative methods to reduce energy consumption.
Our sponsor, the Cámara de Industrias de Costa Rica, requested the development of an
informative label to display information about power consumption of home appliances. It is
hoped this label will encourage consumers to purchase more energy-efficient appliances, reduce
household electricity consumption, and create a demand that promotes competition in the
domestic market. To accomplish this, we set four objectives: 1) consult implementation bodies to
understand the existing label process, 2) compare existing labels, 3) assess local perspectives on
labels, and finally, 4) design a label and implementation process for Costa Rica.
In order to complete these objectives, we gathered feedback from executives in the
implementation process, Costa Rican consumers, and appliance sales representatives. To
understand the current label processes in Costa Rica, we interviewed employees at the Instituto
Costarricense de Electricidad (ICE), the Ente Costarricense de Acreditación (ECA), the Instituto
de Normas Técnicas de Costa Rica (INTECO), and the Dirección de Apoyo al Consumidor del
Ministerio de Economía, Industria, y Comercio (MEIC). ICE is a semi-privatized, large
corporation involved in the distribution of electricity; we consulted with an engineer at its
Energy Efficiency Lab to understand the testing of appliances. ECA is the main body that

xiv
accredits testing and certification bodies in Costa Rica, which includes ICE’s testing laboratory
and INTECO. INTECO creates standards for the energy efficiency of appliances, in addition to
the certification of appliances. The Department of Consumer Protection of MEIC works with the
Ministerio de Ambiente y Energía (MINAE) to regulate labels and enforce regulations.
To identify the importance of energy efficiency and the viability of a label, we surveyed 190
participants in two separate sets of surveys. The first survey revealed general views pertaining to
the importance of energy efficiency and general ideas about label design. We visited local
appliance stores, where we gained perspectives about consumer priorities when purchasing
appliances, and obtained recommendations from sales representatives. The results found from
the second survey led to the final design of a label.
Using the data collected, as well as our personal observations, we were able to identify
improvements that could be made to the label implementation process. These suggested
improvements are:
Collaboration of implementation bodies
Improve communication across implementation process to unify current labeling projects
Form an advisory committee comprised of government and industry representatives to
establish a standardized label implementation process
Mandate and standardize a label system
Update regulations to clarify the responsibility of the enforcement of labels
Mandate a standard testing procedure to determine the information on labels
Standardize the format and design of labels

xv
Educate consumers about energy efficiency
Conduct a mass media campaign for TV, radio, internet, product advertisements, as well
as child enrichment programs
Train sales representatives to promote energy-efficient appliances to consumers
Provide in-store graphics to educate consumers about the availability of energy efficiency
labels and how to use them in order to make informed decisions
Government involvement
Establish a program that mandates that the government purchase only appliances that
meet certain energy efficiency standards
Create tax exemptions for producers that obtain energy efficiency certifications and
utilize renewable resources in manufacturing

xvi
Resumen Ejecutivo en Español
La mayoría de la electricidad de Costa Rica viene de los recursos renovables. Aunque
estos recursos hacen menos daño al medio ambiente, a veces no son fiables como fuentes de
energía. Actualmente, setenta y cinco por ciento de la energía del país es suministrado por las
fábricas hidroeléctricas. Lastimosamente, en el año 2013, Costa Rica recibió menos lluvia que
fue previsto, y la demanda por los combustibles importados fue aumentado por su uso en la
producción de electricidad (Rico, 2014). El uso de estos combustibles es más caro para el
consumidor, y también el costo de electricidad sigue aumentando. Esta situación crea una
necesidad de métodos alternativas para reducir el consumo doméstico.
Nuestro patrocinador, la Cámara de Industrias de Costa Rica, pidió el desarrollo de un
etiquetado informativo para mostrar información sobre el consumo de los electrodomésticos. Es
esperado que esta etiqueta anime a los consumidores a comprar electrodomésticos más
eficientes. También espera reducir el consumo de electricidad de los hogares y crear una
demanda que promueve la competición entre los fabricantes costarricenses en el mercado. Para
cumplir con estas expectativas, fijamos cuatro objetivos primarios: 1) consultar con las
organizaciones de implementación para entender el proceso de etiquetados actual, 2) comparar
las etiquetas que ya existen, 3) evaluar las perspectivas locales sobre etiquetas, y 4) diseñar una
etiqueta y un proceso de implementación para Costa Rica.
Para cumplir con estos objetivos, coleccionamos opiniones de los ejecutivos en el
proceso de implementación de las etiquetas, los consumidores costarricenses, y las
representantes de ventas para los electrodomésticos. Para entender el proceso actual de
etiquetados en Costa Rica, entrevistamos a unos empleados del Instituto Costarricense de
Electricidad (ICE), el Ente Costarricense de Acreditación (ECA), el Instituto de Normas
xvii
Técnicas de Costa Rica (INTECO), y la Dirección de Apoyo al Consumidor del Ministerio de
Economía, Industria, y Comercio (MEIC). ICE es una corporación grande que está involucrada
en la distribución de electricidad, y hablamos con una ingeniera en su Laboratorio de Eficiencia
Energética para entender las pruebas de los electrodomésticos. ECA es la empresa primaria que
acredita las organizaciones de pruebas y certificación en Costa Rica. Estas incluyen el
laboratorio de pruebas de ICE y la certificación de INTECO. INTECO crea las normas para la
eficiencia energética de los electrodomésticos, además de llevar a cabo la certificación. La
Dirección de Apoyo al Consumidor de MEIC trabaja con el Ministerio de Ambiente y Energía
(MINAE) para regular las etiquetas y poner en ejecución las leyes sobre las etiquetas.
Para identificar la importancia de la eficiencia energética y la viabilidad de una etiqueta,
conducimos 190 encuestas de consumidores costarricenses en dos encuestas separadas. Los
resultados de la primera encuesta demostraron perspectivas generales sobre la importancia de la
eficiencia energética y nos dio opiniones sobre el diseño de las etiquetas. Visitamos unas
tiendas locales para aprender sobre las prioridades de los consumidores cuando compran los
electrodomésticos. También hablamos con las representantes de ventas de estas tiendas para
obtener sus recomendaciones sobre las etiquetas. Los resultados de nuestra segunda encuesta nos
dirigieron al diseño final de la etiqueta.
Usamos los datos coleccionados en adición a nuestras observaciones personales para
identificar los mejoramientos que son necesarios para el proceso de la implementación de las
etiquetas. Estos mejoramientos sugeridos son descritos abajo:
Colaboración de las organizaciones de implementación
Mejorar la comunicación en todas partes del proceso de la implementación para unir los
proyectos actuales de etiquetados

xviii
Formar un comité que consiste de representantes de gobierno e industria para trabajar a
establecer un proceso normalizada de implementación de las etiquetas
Imponer y estandarizar un etiquetado
Actualizar las regulaciones para clarificar la responsabilidad de la aplicación de las
etiquetas
Imponer un procedimiento estándar de pruebas para determinar la información en las
etiquetas
Estandarizar el formato y el diseño de un etiquetado
Educar los consumidores sobre la eficiencia energética
Campaña en los medios de comunicación de los anuncios
Programas para educar a los niños sobre la eficiencia y el ahorro de energía
Capacitación para representantes de ventas para promover los electrodomésticos
eficientes a los consumidores en las tiendas
Carteles en las tiendas para educar los consumidores sobre la disponibilidad de las
etiquetas de eficiencia energética y el uso de estas para ayudarles a hacer decisiones
informados de compras
Participación del gobierno
Establecer un programa para requerir que todos los electrodomésticos comprados por el
gobierno cumplan con ciertas normas para la eficiencia energética
Crear exenciones para los productores que obtienen las certificaciones de eficiencia
energética y que utilizan los recursos renovables en la fabricación

19
Chapter 1: Introduction
Costa Rica is a small, geologically diverse country nestled in Central America. This
geographical diversity allows the country to rely heavily upon renewable resources.
Approximately 91% of Costa Rica’s electricity is generated from these renewable resources,
including geothermal, hydroelectric, and wind power plants (Mainieri, Alfredo 2000). Use of
these sources is considered an important step for the country to achieve carbon neutrality. In June
of 2007, President and Nobel Laureate Óscar Arias started a green initiative to make Costa Rica
100% carbon neutral by 2021.
One major source of carbon emissions is from domestic power consumption. While most
of Costa Rica’s electricity comes from renewable energy, these sources cannot keep up with
consumer demands. Hydroelectric plants are responsible for producing 75% of Costa Rica’s
energy (Mainieri, Alfredo 2000). However, hydroelectric power generation is also highly
dependent on weather conditions. In 2013, Costa Rica experienced significantly less rainfall
than expected, which causes the hydroelectric power plants to be less productive (Rico, 2014).
This, in turn, increased the amount of energy generated by imported fuels up to 13% in the last
year, which simultaneously increased electricity prices. Also, the national electrical distribution
system tripled in size in 14 years (Chavez, 2013). All these factors have resulted in an
exponential growth of power consumption. As the gross domestic product of Costa Rica rises, so
will energy consumption (Chavez, 2013). To meet the demand the remaining 9% of power is
supplemented from burning imported oil during peak power times.
Many government and private agencies have attempted to reduce electricity consumption.
Corporativo del Instituto Costarricense de Electricidad (ICE), the government operated
electricity and telecommunications provider, has taken steps to educate the public about energy
20
usage and cost. Electricity providers have raised prices to discourage excessive use of power.
Despite these efforts, renewable resources alone have yet to meet the power consumption
demands. An alternative approach to solving the energy crisis involves reducing the amount of
energy used via households.
Our sponsor, the Cámara de Industrias de Costa Rica (CICR), is a private organization
that represents the industrial sector and works to improve the competitiveness of its member
businesses. One of the recent objectives of the CICR is to reduce energy consumption and create
sustainable business practices. The CICR hopes to promote the use of energy-efficient appliances
to reduce national energy consumption by implementing a standardized energy label in Costa
Rica. This label intends to educate and inform residential consumers about efficient appliances.
21
Chapter 2: Literature Review
In the following section, we provide background information to create a context for our
project. We will explain Costa Rica’s electrical consumption issues, as well as attempts to reduce
consumption by proposing an effective energy labeling system for major electric appliances.
This section will also cover data collection that is necessary for the comparative analysis of
existing energy label systems.
2.1 Cámara de Industrias de Costa Rica
The Cámara de Industrias de Costa Rica (CICR), founded in 1943, is an organization that
works to unite the industrial sector of Costa Rica and improve industrial and economic
conditions. Similar to the Better Business Bureau in the United States, the CICR has many
member institutions. The CICR’s goal is to increase each member’s competitiveness in the
modern marketplace (Cámara de Industrias de Costa Rica, 2009).
In recent years, the CICR has begun to expand its work to create sustainable business
practices. Faced with a need to change practices to preserve the environment, the CICR has
started a new initiative to develop renewable energy and energy-saving methods. One recent
program is the “Energy Manager” training program. This program is used to teach business
employees about energy efficiency and ways to manage energy use (Cámara de Industrias de
Costa Rica, 2012). Specifically, it supports the CICR’s goals to increase business
competitiveness and to promote sustainable industry.
2.2 Electricity Demands and Energy Efficiency in Costa Rica
Costa Rica is a country that prides itself on efficiency and the use of sustainable
practices. Electricity costs are lower in Costa Rica than in most other Latin American countries
(Chavez, 2013). Its national electrical distribution system tripled in size from 1985 to 1999 due
22
to a steady growth in gross domestic product (GDP). The national grid system expanded to
40,000 kilometers (Chavez, 2013). This has resulted in an exponential growth of power
consumption. Presently, Costa Rica is attempting to reduce electrical costs and become more
efficient. Óscar Arias, a previous president of Costa Rica launched a “Peace with Nature” green
initiative that requires the country to become carbon neutral by 2021 (Dobles, 2007). As the
gross domestic product of Costa Rica rises, so will energy consumption (Chavez, 2013). Without
clear conservation efforts, Costa Rica will continue to burn fossil fuels to satisfy electrical
demand.
The current cost of energy in Costa Rica is significantly higher than the United States and
other industrialized nations. It currently costs 81 colones (approximately $0.16 US) per kilowatt
hour (kWh) for the first 200 kWh of consumption. After 200 kWh, the rate nearly doubles to 146
colones ($0.29 US) per kWh ("Current Residential Rates", ICE). In 2012, the national average
price of electricity in the United States was $0.11 per kWh (U.S. Energy Information
Administration, 2013). After 200 kWh, Costa Ricans pay nearly three times more for electricity
than the average American. Due to this high electrical cost, consumers in Costa Rica are very
conscientious of their power usage. Even though electricity is in heavy demand, Costa Rica
continues to stay persistent in its use of renewable resources.
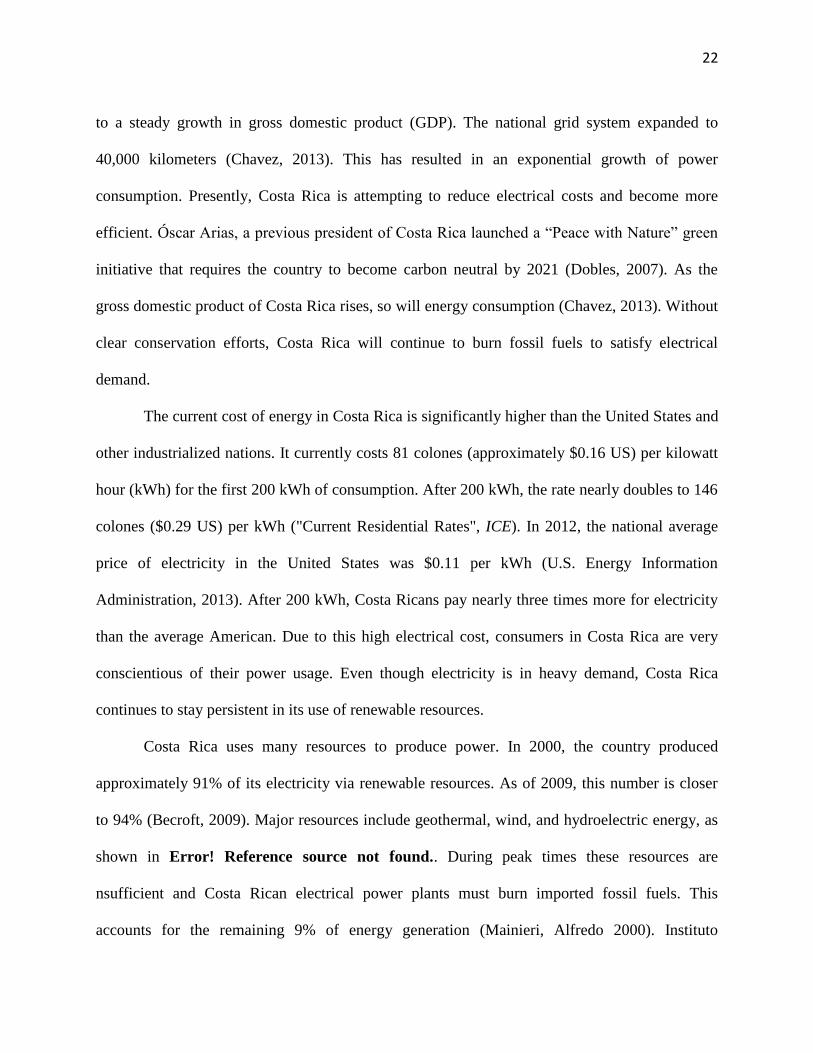
Costa Rica uses many resources to produce power. In 2000, the country produced
approximately 91% of its electricity via renewable resources. As of 2009, this number is closer
to 94% (Becroft, 2009). Major resources include geothermal, wind, and hydroelectric energy, as
shown in Error! Reference source not found.. During peak times these resources are
nsufficient and Costa Rican electrical power plants must burn imported fossil fuels. This
accounts for the remaining 9% of energy generation (Mainieri, Alfredo 2000). Instituto

23
Costarricense de Electricidad,
(ICE) has considered building
more hydroelectric and wind
power plants to replace the fossil
fuels. The development of more
renewable energy power plants
will take a toll on the
environment (Becroft, 2009).
More of Costa Rica’s rivers will need to be dammed to build additional hydroelectric power
plants. This will likely restrict the natural water flow. Consequently, it has the potential to alter
the habitats of the rivers, rendering them unsuitable to support life (Clarkson, 2000). Building
more wind or hydroelectric power plants may cause deforestation of Costa Rica’s land. This can
destroy the biodiversity hotspot that exists in Costa Rica. It is argued that the country cannot
afford to build more power plants. These resources can also be highly dependent on the climate
and weather. For example, a signification portion of Costa Rica’s electricity is generated via
hydroelectric plants. The energy production of these plants is variable depending on the weather.
Costa Rica has experienced much less rainfall than expected in recent years. This has resulted in
higher electricity prices for the consumers especially during dry seasons. It must seek alternative
ways to lower the demand for electricity (Becroft, 2009).
To discourage unnecessary use of electricity, electricity providers raised their prices
dramatically (Becroft, 2009). “In Costa Rica, 250 kWh would be enough to satisfy the monthly
needs of low- and middle-income households” (Chavez 2013). The majority of Costa Rican
citizens fall in this category. Examining residential information provided by ICE, “the average
2%
9%
14%
75%
Wind
Fossil Fuels
Geothermal
Hydro
Figure 1: Energy Source Distribution in Costa Rica
(Mainieri, Alfredo 2000)

24
domestic consumption in 2009 was slightly above 224 kWh (Chavez, 2013)”. The demand for
power dictates the prices of electricity. Looking at this information the average worker must
dedicate 14.6% of his/her salary to pay for electrical costs (Chavez 2013). The Costa Rican
government and power suppliers have worked to reduce the amount of electricity used by their
consumers.
Industrial and household energy conservation efforts by Costa Ricans could significantly
lower the demand for electricity in Costa Rica in the aggregate. Even simple measures, such as
buying more efficient appliances, would lower electricity demands. This could be encouraged by
introducing a standardized labeling system that displays energy efficiency information (Sammer
& Wüstenhagen, 2006). Currently, Costa Rica has no standardized labeling system for
appliances.
2.3 Energy Efficiency Labels
Other areas, including the United States and the European Union, have encouraged the
production of energy-efficient products. In order to create a standardized labeling system that
will be effective in Costa Rica, we will examine the success of these systems.
2.3.1 United States
There are nearly twenty labeling programs that evaluate a broad variety of products in the
US (Banerjee & Solomon, 2003). Four appliance labels are Green Seal, Scientific Certification
Systems, EnergyGuide, and ENERGY STAR. Green Seal and Scientific Certification Systems
are independent organizations, and thus have a nearly insignificant effect on the market,
according to Banerjee and Solomon. Therefore, this analysis of the labels used in the United
States will focus primarily on the government-regulated ENERGY STAR and EnergyGuide
systems.
25
ENERGY STAR
In 1993, ENERGY STAR was created by the Environmental Protection Agency (EPA)
“to promote high-efficiency office equipment” (Webber, Brown, & Koomey, 2000). It originally
began by labeling computers, monitors, and printers. Many of these devices already had energy
saving features, but the features were not default settings. ENERGY STAR simply suggested
enabling these energy-saving settings. President Bill Clinton issued Executive Order 12845,
which required all federal microcomputers, monitors, and printers to comply with ENERGY
STAR standards. This created a large demand, and manufacturers volunteered to participate in
the program (Webber, Brown, & Koomey, 2000). The EPA then allied with the Department of
Energy (DOE) in 1996. The DOE expanded the ENERGY STAR label to be used for
refrigerators, room air conditioners, washing machines, and dishwashers. ENERGY STAR now
saves homeowners expenses for heating, cooling, water heating, appliances, lighting, electronics,
and other household products ("Where Does My Money Go?” 2009).
In order to promote the most efficient appliances, the DOE and EPA launched the
ENERGY STAR Most Efficient program. This label includes the standard ENERGY STAR
logo, the words “MOST EFFICIENT,” and the year that the appliance met the top tier of energy
efficiency. The DOE regulates all testing and determines the energy usage of appliances. The
EPA then sets the ENERGY STAR energy efficiency requirements. For example, current
ENERGY STAR standards for residential refrigerators can be found on the EPA’s website and
Appendix A: ENERGY STAR Refrigerator Standards (EPA Office of Air and Radiation, 2014a,
2014b). These requirements are periodically updated when fifty percent of appliances in the
market share meet them. If an appliance adheres to the ENERGY STAR requirements, it then is
able to display the emblem (EPA Office of Air and Radiation, 2014a, 2014b).

26
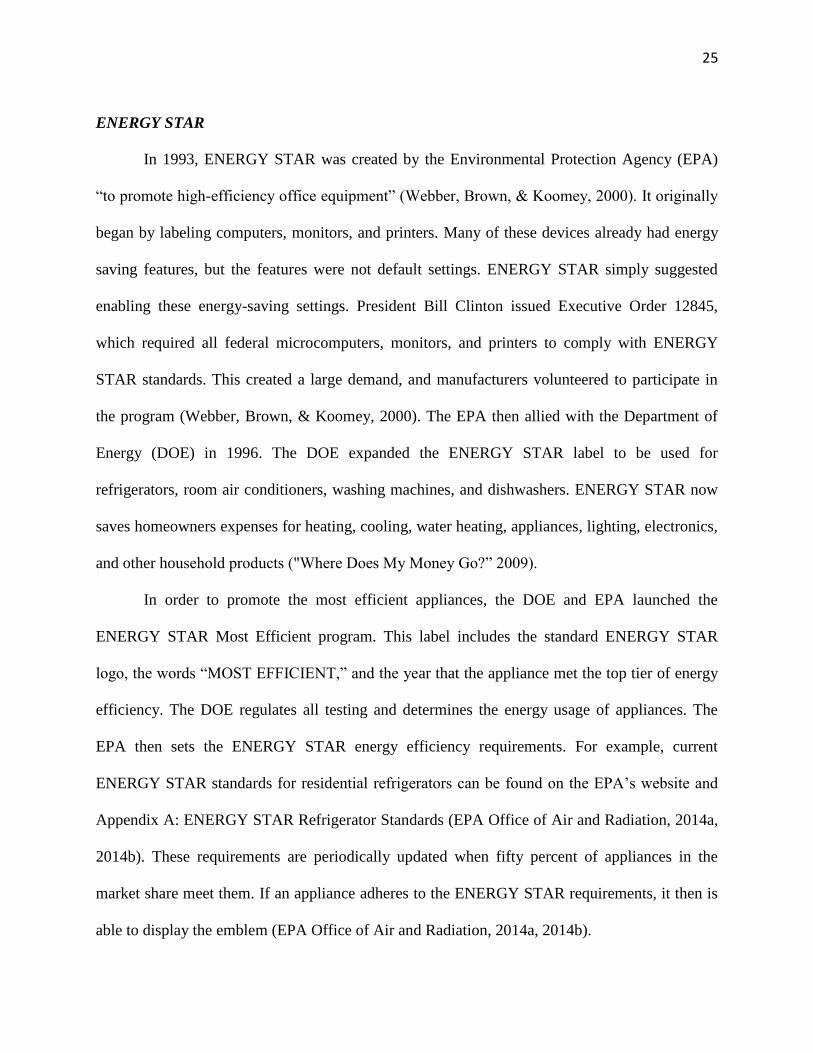
As seen in Figure 2, the ENERGY STAR label is not very
informative. Instead of listing pertinent facts about the energy usage
of an appliance, like EnergyGuide, ENERGY STAR relies on brand
identification to promote its energy goals. In 2012, the Consortium
of Energy Efficiency (CEE) surveyed consumers to determine their
awareness of the ENERGY STAR program. The results were
published by the EPA on the ENERGY STAR website as the
“National Awareness of ENERGY STAR for 2012” publication.
In summary, a significant population of the United States (87%) is able to identify the
ENERGY STAR logo. Large percentages (82%) of respondents were able to state the logo’s
purpose, while fewer were able to relate it with energy efficiency. Those that did buy ENERGY
STAR labeled appliances were at least aware of the ENERGY STAR qualities. Finally, 18% of
households that knowingly purchased ENERGY STAR labeled products had a financial
incentive, though many of them stated they would purchase the product without the financial
incentive (EPA Office of Air and Radiation, 2013). Although the logo does not display
information, it is effective at communicating ENERGY STAR’s goal. The same cannot be said
about effectiveness of EnergyGuide’s very detailed, informational logo.
EnergyGuide
The United States began regulating energy usage in the 1970s. The Energy Policy and
Conservation Act (EPCA), created in 1975, established a minimum energy conservation
standard. The EPCA primarily focuses on conserving energy by reducing fuel consumption. It
required the Federal Trade Commission (FTC) to prescribe the test procedures and applicable
labeling standards (Energy Policy and Conservation Act, 1975). Although the initial act specified
Figure 2: Example of
Energy Efficiency Label in
the US: ENERGY STAR
Label (EPA, 2014)

27
standards for petroleum waste, the idea expanded to include many other devices and services.
This mandate is the predecessor of EnergyGuide. Subsequent acts have established and expanded
the standards for many household appliances.
According to the DOE, the Appliance and Equipment Standards program includes
approximately ninety percent of home energy use (U.S. Department of Energy, 2013). This
evolution of energy efficiency standards is advertised to the public through energy efficiency
labels. This creates quantifiable energy savings. “The cumulative energy savings of standards
phased in through 2012 will be about seventy quadrillion British thermal units (quads) of energy
through 2020, and will amount to one hundred twenty quads through 2030. (The US consumes a
total of about one hundred quads of energy per year.) The cumulative utility bill savings to
consumers from these standards are estimated to be over nine hundred billion dollars by 2020,
growing to over $1.6 trillion through 2030” (U.S. Department of Energy, 2013).
Unlike ENERGY STAR, EnergyGuide participation is federally required. Many domestic
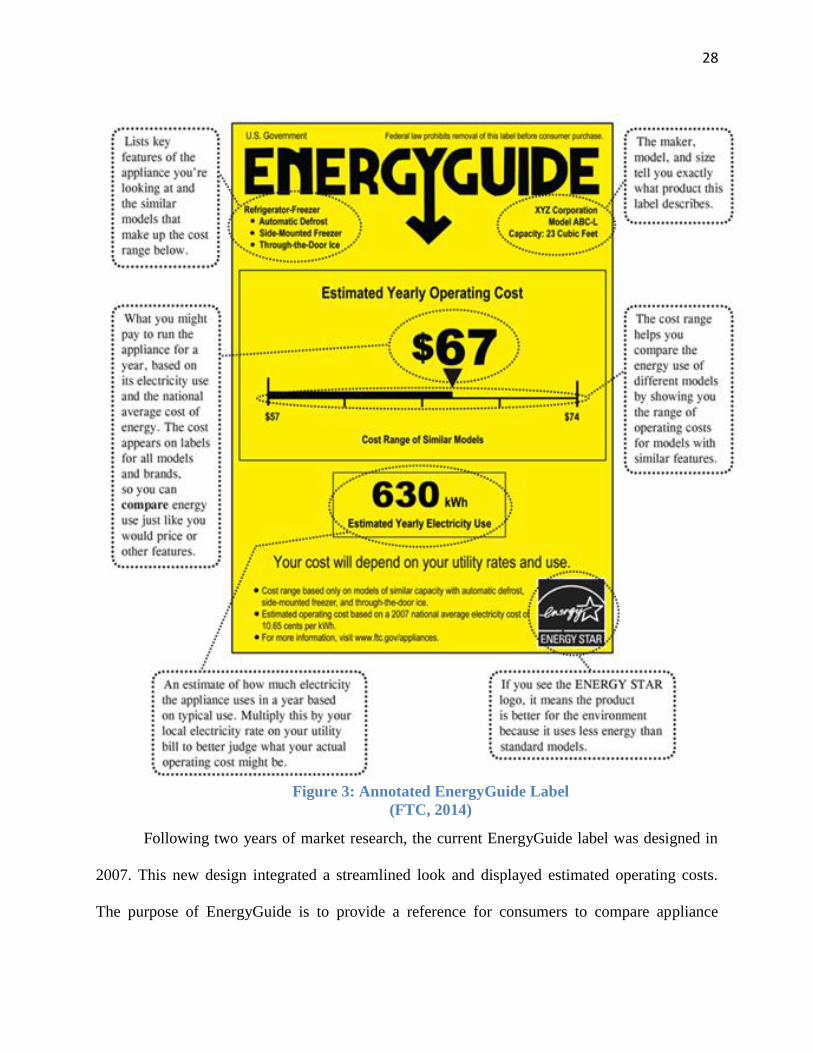
appliances are mandated by the EPCA to display the EnergyGuide label (FTC, 2014).
EnergyGuide also displays much more information than the seal-of-approval ENERGY STAR
logo. Figure 3 is an annotated illustration that identifies the variety of information presented on
the label. The facts displayed are determined by standard testing procedures regulated by the
DOE. The EnergyGuide label attempts to provide a neutral factual reference. This allows
consumers to make informed decisions when purchasing appliances.
28
Following two years of market research, the current EnergyGuide label was designed in
2007. This new design integrated a streamlined look and displayed estimated operating costs.
The purpose of EnergyGuide is to provide a reference for consumers to compare appliance
Figure 3: Annotated EnergyGuide Label
(FTC, 2014)

29
energy efficiencies. This allows consumers to consider the trade-offs of energy efficiency and the
initial cost of appliances (Federal Trade Commission, 2007). It should also be noted that not all
EnergyGuide labels are the same. In 2014, a new edition of the label was released, as seen in
Figure 4. It now features information as yellow text on a black background and a new testing
system (FTC, 2014). The FTC notes that appliances should only be compared to those with
similar labels (FTC, 2014). For example, if a consumer considers a refrigerator with the standard
yellow EnergyGuide label and another with the transitional label, the information will not
directly correlate. The transitional label could potentially cause consumer confusion.
Figure 4: Transitional EnergyGuide Label
(FTC, 2014)
30
Several studies have questioned the effectiveness of the EnergyGuide label. In a 1999
Wisconsin survey, 70% of the responses claimed they had seen or heard of the label. When
asked to provide the information on the label, only 49% were able to describe important details
(Banerjee & Solomon, 2003). In another survey, the respondents were given an option of five
variations of the EnergyGuide label. Each had the standard yellow background and the same
header, but the information format was rearranged. Only 12% of the respondents were able to
correctly identify the current label (Banerjee & Solomon, 2003). “More recently, American
Council for an Energy-Efficient Economy conducted research that indicated that for some
consumers, comprehension is problematic, but that a more overarching problem is that
consumers perceive the current label to be ‘boring, overly technical and unmotivating’
(Banerjee & Solomon, 2003).” Although EnergyGuide is a non-biased display of information,
many consumers do not understand its importance or cannot use its information.
2.3.2 European Union
The European Union (EU) has also made efforts to inform consumers about the
efficiency of their appliances. Europe obtains the majority of its electrical power from
nonrenewable sources. Approximately 55% of all of the power comes from combustible fuels
including coal, natural gas and petroleum (European Commission, 2014). The average cost of
household electricity is currently 0.19 Euro, or $0.26 per kilowatt hour (European Commission,
2014). It is also important to note that individual household energy use in the EU has increased
by 15% in the last four years. This increase is credited to low replacement rates of inefficient
equipment. The European Commission suggests that convincing consumers to switch to efficient
appliances will reduce the environmental impact and energy cost (European Commission, 2014).

31
The need for an energy labeling system was recognized in 1992 when the EU established
the “EU Energy Label” (Council Directive 92/75/EEC, 1992). This label must be displayed on
goods including cars, light bulbs, and appliances. The EU uses a system of classes, lettered “A”
through G, to indicate the efficiency of the product. The letter “A” marks the most efficient
devices. In addition to this information, labels are also required to include the model of the
product, the product’s power consumption, and the noise levels it produces when operating.
There are standards for each type of product to determine the letter grade each should receive.
For example, washing machines are rated in kilowatt hour per kilogram of washed material at 60
degrees Celsius (Energy Labeling of products, 2013). As more efficient products were
introduced, the product rating scale expanded to include “A+,” “A++,” and “A+++” (Directive
2010/30/EU, 2010). This can be seen in Figure 5. Unfortunately, this change has been
determined to actually reduce the effectiveness of the label rather than enhance it. It occurred
because consumers considered all “A” grade appliances to be equal regardless of the plus system
(Heinzle & Stefanie Lena, 2012).
There have been several comparative studies of the EU label and its success in the
market. One of these was a discrete choice analysis of buying washing machines (Sammer &
Wüstenhagen, 2006). In this study, various washing machines were proposed to consumers with
and without the energy label. The consumer was then given a choice to “buy” his or her favorite
product. The study found that seventy-four percent of the consumers were able to recall the
energy label of the product. Among those consumers, fifty-four percent of them considered
energy efficiency in their choice of product. With the energy label in place, consumers were
significantly more willing to buy a more expensive product for energy savings. For the example
product, there was a thirty percent initial cost increase to go from a C level energy rating to an A

32
Figure 5: The European Union Energy
Label
(CECED, 2014)
level. The savings over the lifetime of the product
did not make up for this premium. Yet there was still
a forty percent increase in choice of the high-
efficiency product with the label versus without the
label (Sammer & Wüstenhagen, 2006). This German
study shows that the use of a labeling system
influences consumers to purchase energy-efficient
appliances.

33
Chapter 3: Objectives
Our overall goals for this project were to develop a standardized energy efficiency
labeling system and to create recommendations to improve the implementation process of this
system. We formulated four main objectives in order to achieve these goals for appliance labels
in Costa Rica. These are as follows.
1. Consult Implementation Bodies
We gathered information pertaining to the process that would constitute a successful
implementation of energy efficiency labels in Costa Rica by interviewing executives of
implementation bodies.
2. Comparative Analysis of Existing Labels
We identified and analyzed efficiency labeling systems from other countries and their
effectiveness in encouraging consumers to purchase energy-efficient appliances.
3. Assess Local Perspectives
We gathered information about public knowledge of energy efficiency labels in Costa Rica
through surveys and summarized the analysis of the surveys.
4. Implementation of Label
We designed a label to be used in Costa Rica and suggested a process for its implementation.
The approach we pursued to accomplish our objectives will be discussed in detail in the next
chapter.

34
Chapter 4: Methodology
The objectives aided us in our effort to accomplish our overall goals. The following
chapter explains how we carried out these objectives to develop a standardized efficiency label
and generate recommendations for the label implementation process in Costa Rica. The chapter
is divided into four sections that explain the methods that were used to accomplish each
objective.
4.1 Consult Implementation Bodies
To understand the current labeling system in Costa Rica, we interviewed businesses
involved in implementing and regulating a labeling system. Specifically, we interviewed
employees at the Instituto Costarricense de Electricidad (ICE), the Ente Costarricense de
Acreditación (ECA), the Instituto de Normas Técnicas de Costa Rica (INTECO), and the
Dirección de Apoyo al Consumidor del Ministerio de Economía, Industria, y Comercio (MEIC).
ICE is a semi-privatized, large corporation involved in the distribution of electricity. We
consulted with an engineer at its Energy Efficiency Lab to understand the testing of appliances.
ECA is the main body that accredits testing and certification bodies in Costa Rica. This includes
ICE’s lab and INTECO. INTECO creates standards for the energy efficiency of appliances, in
addition to certifying appliances. The Department of Consumer Protection of MEIC works with
the Ministerio de Ambiente y Energía (MINAE) to regulate labels and enforce regulations. We
researched the goals of each individual company to understand which goals contributed to the
implementation of a standardized appliance labeling system. It was important for us to
understand 1) the current processes used by each institution, 2) how the institutions contributed
to the implementation of the label, and 3) any problems and suggestions regarding the current
system.

35
4.2 Comparative Analysis
Several countries around the world have implemented energy efficiency standards and
labels. To determine which labeling system was most effective, we examined various case
studies of implemented systems. Several case studies have been conducted to determine how
consumers react to the information conveyed by these labels. In section 2.4.2, we briefly
explained the results of the studies conducted on the ENERGY STAR, EnergyGuide, and
European Union labels.
Data collected from previous case studies was used to determine features of appliance
labels consumers found most useful. For example, although the ENERGY STAR label does not
display any information, its brand name and easily identifiable logo helps the consumer
understand its significance. The case studies determined particular features that are the most
easily understood.
We used information from these case studies to develop questions for our consumer
surveys. The information helped us gain knowledge on how Costa Ricans’ will understand
energy labels and their specific features. These case studies showed that years of exposure and
understanding of the purpose of energy efficiency labels have made these labels successful.
However, consumers in Costa Rica have not been exposed to these labels for extended periods of
time. Our survey questions provided us with information about the comprehension of label
features with little or no prior education about the labels.
4.3 Assess Local Perspectives
In addition to interviews with implementation bodies, we surveyed consumers using
questions developed from case studies of international labels. We used our surveys to assess the
knowledge and awareness of energy efficiency in Costa Rica. ENERGY STAR, EnergyGuide,

36
and European Union labels were used to gain perspective on consumer knowledge and label
feature comprehension. We also interviewed sales representatives at appliance stores to
understand the information that is used to influence the decisions of consumers when purchasing
appliances.
4.3.1 Survey Consumers
Our goal from surveying was to understand features of energy efficiency labels which
Costa Rican consumers find important when purchasing appliances. We also determined the type
of labeling system that is most useful for consumers. Our survey sample consisted of consumers
at appliance stores and public areas. This provided a variety of demographic information. In
order to do this, we conducted 140 surveys in appliance stores and parks in San José listed in
Table 1: Locations. These locations were chosen with the help of Laura Cornejo, the director of
ASEGIRE. ASEGIRE is a company that promotes the responsible management of electronic
waste, and that has close ties with the CICR. They work with many local companies, including
Grupo Monge, a local group of appliance stores. She was able to help us gain access to these
locations for our surveys.
Table 1: Locations Where Surveys were Conducted in San José, Costa Rica
Name Category Location
Importadora Monge Appliance Store San Pedro
Importadora Monge Appliance Store Multiplaza del Este
Importadora Monge Appliance Store Multiplaza de Escazú
Play Appliance Store Zapote
Plaza Juan Mora
Fernández
Public Area Centro de San José
Plaza de la Cultura Public Area Centro de San José

37
Our survey was divided into three sections and consisted of two types of questions,
multiple choice and ranking questions. This allowed us to collect numerical data. Numerical data
is easy to analyze statistically. Also, we attempted to ensure that our surveys were simple to
complete, in order to encourage consumers to participate (Fowler 2014).
Through the first section of the survey, we gathered information about which appliance
features are important to Costa Ricans in the purchasing process. Responses included ranking
features such as price, size, color, and efficiency in order of importance to the consumer. We also
asked where consumers find information about appliances. This helped us determine information
that should be included on an energy efficiency label and the importance of energy efficiency to
consumers.
The second section of the survey focused on label design. We tested the EnergyGuide,
ENERGY STAR, and European Union labeling systems to compare different types of labeling
systems. This gave us information about the label design that is the most visually appealing and
easily understood for consumers. The example labels are shown in Appendix B: Consumer
Awareness and Comparative Analysis Survey. During this part of the survey, we showed
participants images of the three international labels. We asked them questions regarding prior
knowledge, visual appearance, information, and comprehensibility of these labels.
In the third section of the survey, we asked consumers questions to determine the
usefulness and comprehensibility of individual label features. We showed participants images of
the EnergyGuide and European Union labels with important features circled. This can be seen in
Appendix B: Consumer Awareness and Comparative Analysis Survey. We then asked them to
rank the features in order of importance. We supplemented this by asking participants to mark
specific features that they did not understand at all. This information helped us identify specific

38
features to be included in a standardized label for Costa Rica. This ensured the usefulness and
clarity of features selected. The complete survey used is found in Appendix B: Consumer
Awareness and Comparative Analysis Survey.
4.3.2 Survey Sales Representatives:
While surveys helped us acquire quantitative data, qualitative data was also valuable
information for our recommendation and label design. Appliance sales representatives have
direct contact with consumers and influence purchase decisions. Through surveys with sales
representatives at Grupo Monge appliance stores in San José, we gained insight into consumers’
priorities when purchasing appliances. Using this information, we designed a label that sales
representatives can use to encourage consumers to purchase energy-efficient appliances. Sales
representatives were asked about their sales pitch, impressions of consumer opinions, and
training programs. The full list of survey questions asked to sales representatives can be found in
Appendix C: Survey of Sales Representatives.
4.3.3 Analysis
Once we gathered information from certification bodies, consumers, and sales
representatives, we analyzed the results. The majority of our surveys consisted of quantitative
data used to generate graphs and tables. Analysis of the survey data was completed using Excel
worksheets and common statistical methods. The data was transformed into numerical values
and a standard correlation function was applied to all of the survey responses. The correlations
indicated areas for further review and investigation. Specific results and more details of the
numerical analysis are found in section 5.2.2.
Information from interviews with sales representatives was also considered to develop a
clear and useful label. Perspectives from appliance store employees were useful in designing a

39
label that is helpful to consumers. This would also help representatives to promote energy-
efficient appliances. This was also used to supplement our data from consumer surveys to
demonstrate which information is most important to consumers on energy efficiency labels, and
ways to create a label that is easy to use and interpret.
Surveys with consumers and sales representatives gave us information about consumer’s
top priorities when purchasing appliances, useful label features, and overall label design.
However, our interviews with implementation bodies gave us information about the existing
energy efficiency labeling process in Costa Rica. This information helped us to understand the
role of each company in the process of implementing labels. We also gathered opinions from
employees about the flaws in the current implementation systems. This data was considered in
the development of our recommendations for the implementation of a standardized energy
efficiency label in the future.
4.4 Label Designs and Evaluation
We used the results of the comparative analysis, the survey data, and the interview data to
draft several label designs. From the analysis of the survey data, we identified the most important
information to consumers, label features that are clear and understandable, and the most
appealing visual designs to encourage consumers to purchase energy-efficient appliances. These
features were included in several possible label designs. We designed the labels in Adobe
Illustrator. Illustrator is software that is commonly used in design and graphics in large
businesses. It will allow our design to be transferred to professionals within Costa Rica.
We evaluated label designs based on perspectives from consumers and businesses
involved in the implementation of energy efficiency labels. We surveyed 50 consumers with our

40
label designs in a similar process as the initial consumer survey. We developed questions to test
separate elements of our label design. These include layout, title, color, rating system, and
overall design. Our survey asked consumers to identify the most and least useful labels features
out of the options provided. This survey can be found in Appendix E: Survey for Label Features
and Designs. Using the results of this survey, we designed a final draft to be recommended. This
was done by using the most popular option in each of the questions and combining these
elements into one final design.

41
Chapter 5: Analysis and Results
The methodology described in Chapter 4 was used to accomplish our four objectives for
this project. This chapter presents the results that we developed to meet each of our objectives.
Specifically, they were: 1) to interview businesses involved in labeling implementation, 2) to
analyze existing labels and their usefulness in Costa Rica, 3) to survey consumers and sales
representatives about energy efficiency awareness and useful label features, and 4) to create a
final label design based on findings and evaluation of drafts.
5.1 Consult Implementation Bodies
5.1.1 The Law LEY 7447
During an interview with ICE, we learned that a law exists in Costa Rica that requires
manufacturers to display information related to energy efficiency on appliances. LEY 7447 is the
Law Regulating the Rational Use of Energy (Ley Nº 7447, 1996). The objective of this law is to
promote the rational use of energy, establish mechanisms to achieve the efficient use of energy,
and replace these mechanisms as needed. The law, along with subsequent regulations and
amendments, requires that manufacturers, importers, and distributors provide clear information
about the energy usage of their products. It also specifies that the label must be easily visible on
the product. In particular, Decreto 29751 enumerates the required aspects for the label. This
executive order mandates features such as average energy usage in kilowatt-hours (kWh) per
year, maximum energy usage due to volume, legal documentation, brand, model, and other
physical features of the household appliance to be clearly presented on the label. A label
showing these features and which complies with LEY 7447 is shown in Figure 6.

42
Figure 6: Example of Current Label that Meets Legal Requirements Found in Wal-Mart
Zapote, Costa Rica

43
5.1.2 Current Process of Certification
Each organization that we interviewed contributes to the implementation of a
standardized energy label. Our research discovered that the process of implementation is a
complex interaction of a number of organizations. These interactions can be so complex, that
some organizations have overlapping responsibilities and unclear tasks. These relationships are
summarized in the flow chart seen in Figure 7.

44
Figure 7: Flow Chart of the Inter-Relationships of Label Implementation Organizations and Their Roles

It is instructive to analyze how the label implementation is carried out. The sequence of steps is
as follows:
1. Producers bring samples to INTECO.
Manufacturers, importers, and distributors send three samples of a product to INTECO to
be tested and certified. It is not mandatory to be certified by INTECO, although it is beneficial
for manufacturers to announce the quality of a product. If manufacturers do not wish to be
specifically certified by INTECO, displaying information pertaining to the energy consumption
is still required by LEY 7447.
2. INTECO sends the samples to be tested.
INTECO is a company that was created by the CICR to coordinate the creation of
technical standards for Costa Rica. INTECO inspects standards developed by the International
Organization for Standardization (ISO). It then organizes a meeting with technical experts to
decide if the standards are achievable in Costa Rica. If they are not, it devises a reasonable,
attainable standard for the country. After developing standards, INTECO can ask MINAE to
begin the process of developing a regulation that enforces their use. INTECO also has the power
to certify products and processes of other companies.
3. Examinations are completed at the ICE Energy Efficiency Laboratory.
Samples are next sent to ICE’s Energy Efficiency Laboratory, where they are tested and
their energy usage characteristics are compared to INTECO’s standards. ICE is a large
multifunctional corporation that is involved in the distribution of electricity, maintenance of
water, transportation, and telecommunications throughout the country. For our project, we were

46
specifically concerned with the facility responsible for testing electrical products: ICE’s Energy
Efficiency Laboratory.
We visited the Energy Efficiency Laboratory in Pavas, San José and spoke with Heyleen
Villalta Maietta, a Testing Engineer for the laboratory. She provided us with valuable
information including products that are currently tested, products that can be tested in the future,
and information that is used to create a standardized label for appliances. ICE currently has the
ability to test the efficiency of compact fluorescent light bulbs, street lights, refrigerators, electric
motors, and electric ranges. At present, manufacturers bring products to ICE voluntarily, and
ICE works to accommodate the testing of all products it receives. The product testing could be
expanded in the future based on requested testing, but is limited by available equipment.
When speaking with Ms. Villalta, we also discovered that ICE developed its own seal-of-
approval label named “ENERGICE.” This label is shown in Figure 8. It is currently not used
widely in the market and can only be found on fluorescent lights. The label uses a star system to
rate the energy efficiency of appliances, using the
minimum standards for energy efficiency
generated by INTECO for specific appliances. If
an appliance uses less energy than the standard by
a certain amount, it gains stars on the label. One
star is 5% above the minimum efficiency, two
stars is 10% above the standard, three stars is 15%
above the standard, and four stars is 20% or more
above the standard. This is a standardized label Figure 8: The ENERGICE Label
(ICE, 2008)

47
currently in development. Interestingly, as we discovered through our interviews many of the
other implementation bodies are unaware of its existence. Obviously, this hinders the labeling
system from being expanded to other products.
We also spoke with Johanna Acuña Loría, the director of ECA, which is the organization
that accredits ICE’s Energy Efficiency Laboratory, as well as INTECO’s ability to certify
products. ECA works with ICE to accredit the testing processes used to determine the energy
efficiency information shown on labels, including the ENERGICE label.
4. The results from the tests are then returned to INTECO.
INTECO sets the minimum standards for energy efficiency and determines the efficiency
rating of a product based on the information it receives from ICE’s testing laboratory.
Irrespective of whether or not the product has been certified, INTECO releases the information
obtained by ICE about the product’s energy consumption to the manufacturers.
5. Manufacturers are responsible for displaying the information on their appliances in
stores.
LEY 7447 specifies that manufacturers are required to display information on their
appliances. However, the law does not explicitly state the arrangement and format of this
information. Manufacturers receive information about the energy efficiency of their products.
They then have creative freedom to display the required information in any manner they choose.
This information can be received from INTECO if the manufacturers choose, and can include the
ENERGICE label if the appliance meets the specified efficiency standards.

48
6. Regulatory bodies ensure validity of information displayed on products.
We visited the Department of Consumer Protection of the Ministry of Economy,
Industry, and Commerce (MEIC) to find more information about the regulatory process of LEY
7447. Generally, the Department of Consumer Protection completes investigations within the
market and determines how products affect consumers. This office works with the Ministry of
Environment and Energy (MINAE) to ensure that the energy consumption information displayed
by manufactures is correct. However, MINAE can only act, if a complaint is filed; they will then
investigate to determine the validity of the information on the labels. MINAE and MEIC have
the ability to penalize those not complying with the law with a fine. According to Yorleny Rojas,
the Head of the Administrative Department of Procedures, the penalty is the equivalent to
$4,000. They inspect each level of the chain of production to discover who is responsible for the
misinformation and who must pay the fine. At the time of writing this report, only one
investigation has been conducted by MEIC. The investigation was successful in identifying the
lack of consistent labeling on appliances in stores. The investigation gave a recommendation to
ensure that the mandated information on labels is displayed clearly. However, according to
Yorleny Rojas, the Department of Consumer Protection appears to have insufficient resources to
carry out this recommendation to enforce the mandatory label information in LEY 7447.
5.1.3 Flaws within the Current Implementation Process
From the contacted organizations, we learned that there is a process of implementing
energy efficiency labels in Costa Rica. This system has yet to standardize testing procedures or
label format. Our interviews helped us to identify the weaknesses in the current system and how
the procedural issues could be fixed. The five major problems we have found are:

49
1. Consumers are not always well informed
2. Regulations have not been updated recently
3. Responsibility of a governmental body to enforce LEY 7447 and the certification of
appliances is unclear
4. There is little communication within the implementation process
5. A standardized format to display information about energy efficiency on a product has
not yet been developed or mandated
Informed consumers create a demand for energy-efficient appliances. Many consumers
do not possess the knowledge that energy-efficient appliances will save them money over the
lifetime of the appliance. These appliances can have environmentally friendly effects by
reducing electrical consumption of the residential sector within Costa Rica. This knowledge is
often needed to persuade consumers to purchase energy-efficient appliances. With little demand
for efficient products, manufacturers are not encouraged to supply more efficient products. To
create this encouragement, consumers should be informed about energy efficiency labels and
how they can be used to select products that will save them money in the long term.
Currently there are regulations in place that require manufacturers to display specific
information about their appliances, as stated in LEY 7447. This requires manufacturers to test
their products and display energy efficiency information on labels. Both MINAE and MEIC
currently collaborate to enforce the regulation of energy efficiency labels. Unfortunately, neither
government department has a clearly defined responsibility. According to Yorleny Rojas, MEIC
and MINAE are in the process of defining the precise roles for label regulation.

50
From the ambiguity in responsibility stems the problem of enforcement. Currently the
process to be certified, for example through INTECO, is voluntary. With no specific organization
taking responsibility of the regulation of product certification and label enforcement,
manufacturers are not encouraged to comply with LEY 7447. Without this, a standardized label
system is limited because of manufacturers’ reluctance to have products certified. Products that
are not certified have not been tested using the same standards as other appliances. Since the
information from different testing protocols is not directly comparable, it limits the success of
the entire standardized labeling system. For a standardized label, similar products must go
through the same verification process, to generate equal information to be clearly displayed for
comparison. In the current system, certification of appliances is not required. Thus the displayed
information on different labels is not comparable, leaving consumers highly confused and unable
to properly compare.
The fourth major issue we found was that there appeared to be little communication
between organizations involved in the implementation of efficiency labels. Many of these
organizations were not aware of the projects that were being led by other organizations. For
example, ENERGICE is an energy efficiency label created by ICE in 2008, but many other
organizations were not aware of its existence. When the CICR organized its own project in 2014
to develop a standardized energy efficiency label in Costa Rica, its executives were unaware of
ICE’s efforts. While each organization operates independently, the lack of communication
creates the duplication of efforts and lax oversight. Also, the existence of ENERGICE was not
known to MEIC. This body responsible for the regulation of labels was unaware of a labeling
project developed by another organization in the implementation process. Without the enforcing
body being aware of labeling projects, these labels will not be successful.

51
Along with little communication, there is currently no standard format to display the
information acquired from testing. Manufacturers have the ability to display the information in a
manner they choose. This leads to a variety of label formats, displaying similar information in
different ways. Without a standard display of information, it is more difficult for consumers to
make informed purchase decisions based on energy efficiency between multiple products.
As a case in point, when visiting appliance stores in Costa Rica, we noticed that most
refrigerators did not have clearly displayed energy efficiency labels. For instance, we discovered
that out of 40 refrigerators in one store, only four had easily viewed labels. Upon further
investigation, 31 refrigerators had labels that were obscured by advertisements or were hidden
inside the product. Moreover, of the four refrigerators with clear labels, two had multiple labels
showing different numerical information because of differing testing procedures. This is shown
in Figure 9: Example of Refrigerator with Multiple Energy Efficiency Labels in Store. Five of
the refrigerators had no efficiency labels, and several labels did not match the model of
refrigerator to which they were attached. This inconsistency of labeling makes it difficult,
perhaps impossible, for consumers to make informed decisions when comparing the energy
efficiency of appliances.
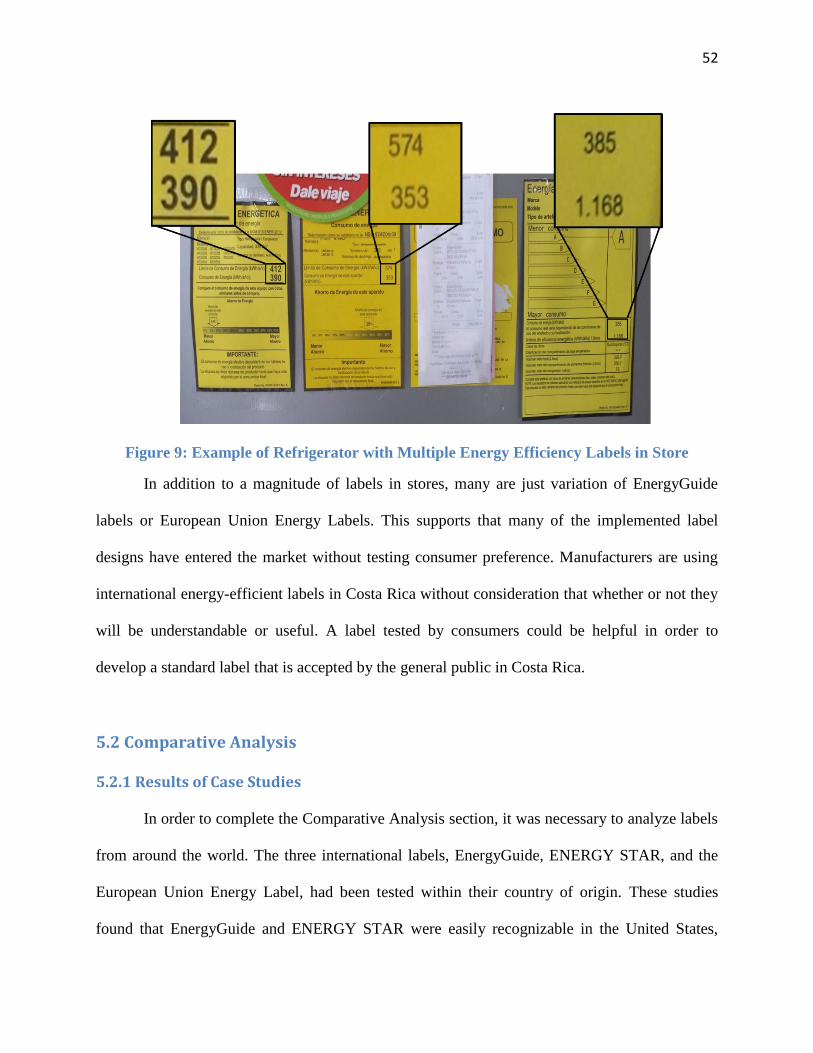
52
Figure 9: Example of Refrigerator with Multiple Energy Efficiency Labels in Store
In addition to a magnitude of labels in stores, many are just variation of EnergyGuide
labels or European Union Energy Labels. This supports that many of the implemented label
designs have entered the market without testing consumer preference. Manufacturers are using
international energy-efficient labels in Costa Rica without consideration that whether or not they
will be understandable or useful. A label tested by consumers could be helpful in order to
develop a standard label that is accepted by the general public in Costa Rica.
5.2 Comparative Analysis
5.2.1 Results of Case Studies
In order to complete the Comparative Analysis section, it was necessary to analyze labels
from around the world. The three international labels, EnergyGuide, ENERGY STAR, and the
European Union Energy Label, had been tested within their country of origin. These studies
found that EnergyGuide and ENERGY STAR were easily recognizable in the United States,

53
although some participants did not necessarily understand their significance. EnergyGuide in
particular was found to be ineffective. To prove this point, a study was conducted where
shoppers were shown five labels with different information, and were then required to select the
official label. Only 12% were able to correctly identify the actual label. Meanwhile, the study of
the European Union label found that consumers were able to recall the energy label of the
product. Both studies showed approximately 40% increase in selection for more expensive
energy-efficient appliances, when energy-efficient labels were provided. These studies showed
the success of labels in their respective countries, but this does not necessarily apply to the Costa
Rican community.
5.2.2 Correlations from Survey Data Regarding Label Drafts
As described in section 4.2, we used the results of case studies of existing labels to
determine the questions for our consumer surveys. These were used to understand the features of
labels that are most useful in Costa Rica.
We surveyed a total of 140 participants in public areas and appliance stores. Although
this number appears low in light of the fact that the greater San José metropolis features about
900,000 residents, it nonetheless is sufficient to reveal important trends. Once all the data was
collected, we analyzed it via statistical methods. The data was transformed into numerical values
and a standard correlation function was applied to all of the survey responses. The correlation
matrix generated from this step was then used to further investigate the relations between
question responses and demographic data. In order to investigate specific relationships, the
surveyed population was broken down by one factor of the correlation and then compared to the
other, as shown in Appendix B. For discrete data this was done using the conditional COUNTIF
function in Excel, while statistical means for a population were determined using the

54
AVERAGEIF function. Analysis of non-correlated data was completed with simple mean,
median and mode analysis (Albright, 2011), and the standard deviation of data subsets was also
investigated. With these analysis tools, we were able to generate useful results for our study.
One of the first questions we asked consumers in Costa Rica was whether or not they
recognized the international labels. ENERGY STAR proved to be the most recognized of the
labels with slightly over half of those surveyed indicating they had previously seen it.
EnergyGuide was the second most recognized label, and finally the European Union label was
the least recognized of the example labels. This is shown in Figure 10. It should be noted that
during our investigation of labels in stores, it became apparent that this reflected the Costa Rican
appliance market well. There were no official European Union labels found within stores, but
there were various labels which were similar in design. EnergyGuide was found on several
refrigerators, and the ENERGY STAR label was even found in some advertisements for
appliances. From a study obtained from MEIC (Estudio Comparativo de Etiquetas Energéticas
en Refrigeradores en el Comercio Nacional), it was shown that the EnergyGuide label was
relatively prevalent in Costa Rican stores.
Figure 10: Recognition of International Labels in Costa Rica
0
20
40
60
80
100
120
140
Any EU Label EnergyGuide ENERGY STAR
Nu
mb
er o
f R
esp
on
ses
Example Label
Yes
No
55
After determining which international labels have been seen by consumers, we
investigated responses to compare the three label types. EnergyGuide uses specific numerical
information about energy efficiency. ENERGY STAR is a seal of approval label placed only on
appliances that meet certain standards. The European Union (EU) label uses a ranking scale to
compare the efficiency of appliances. It was found that of the 140 consumers surveyed, 53%
preferred EnergyGuide over the other label types. The European Union label was the second
most preferred label (33%), and finally ENERGY STAR came in last with only 14% of the
responses. Of those surveyed, 80% said they would purchase the appliance with their preferred
type of energy efficiency label. However those who thought that ENERGY STAR was the best
type of label did not follow this trend as closely. This occurred because as a seal of approval
style label, consumers felt that it did not contain sufficient information to make a buying
decision. Figure 11 shows that 59% of those surveyed would purchase a refrigerator with the
EnergyGuide label over a similar appliance with the other international labels. This was the
largest percentage difference for any question that compared EnergyGuide, ENERGY STAR,
and the EU label. Surprisingly, consumers preferred information, and were not put off by denser
text.

56
Figure 11: Percentages of Purchase Preference Based on International Label
Although the majority of consumers chose EnergyGuide as their preferred label type, it
was not the most visually attractive in the opinions of the participants. 39% of those surveyed
felt that the EU label was the most attractive. Participants in the survey would often cite the
bright rainbow colors of the rating system, clean layout, and minimal writing as attracting their
attention. Figure 12 demonstrates this.
Figure 12: Most Visually Appealing Example Label
31%
59%
9%
1%
EU Label
EnergyGuide
ENERGY STAR
No Response
39%
29%
31%
1%
EU Label
EnergyGuide
ENERGY STAR
No Response
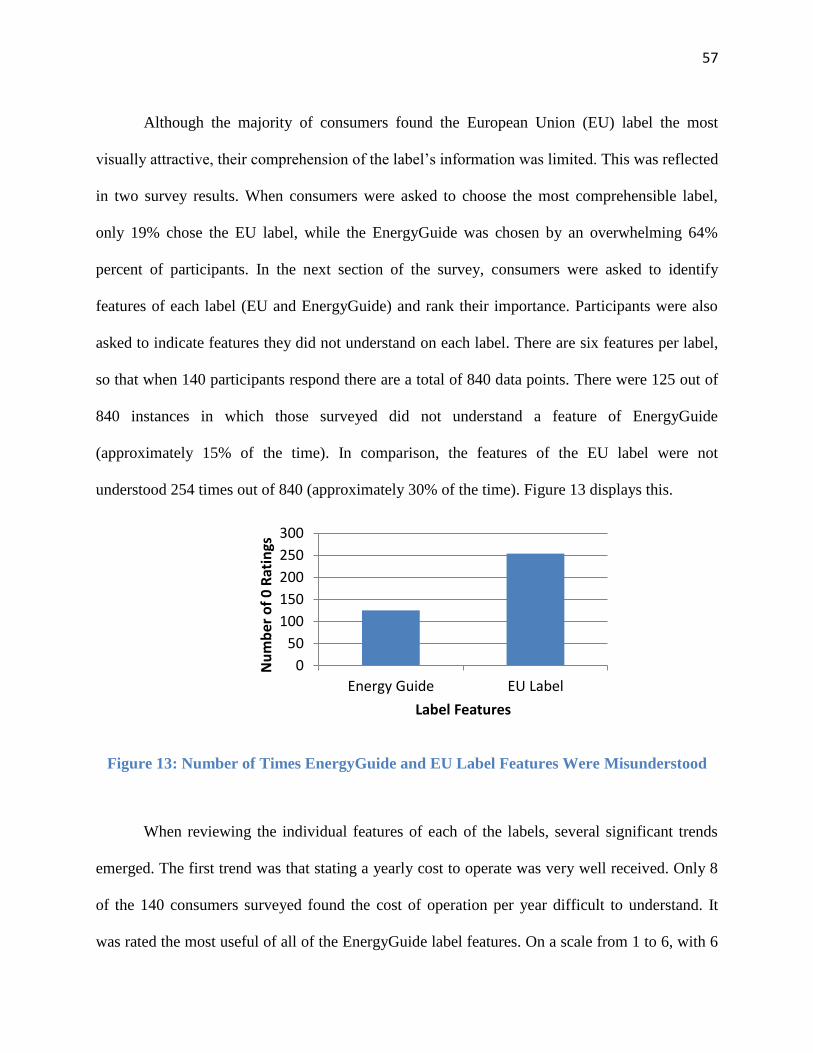
57
Although the majority of consumers found the European Union (EU) label the most
visually attractive, their comprehension of the label’s information was limited. This was reflected
in two survey results. When consumers were asked to choose the most comprehensible label,
only 19% chose the EU label, while the EnergyGuide was chosen by an overwhelming 64%
percent of participants. In the next section of the survey, consumers were asked to identify
features of each label (EU and EnergyGuide) and rank their importance. Participants were also
asked to indicate features they did not understand on each label. There are six features per label,
so that when 140 participants respond there are a total of 840 data points. There were 125 out of
840 instances in which those surveyed did not understand a feature of EnergyGuide
(approximately 15% of the time). In comparison, the features of the EU label were not
understood 254 times out of 840 (approximately 30% of the time). Figure 13 displays this.
Figure 13: Number of Times EnergyGuide and EU Label Features Were Misunderstood
When reviewing the individual features of each of the labels, several significant trends
emerged. The first trend was that stating a yearly cost to operate was very well received. Only 8
of the 140 consumers surveyed found the cost of operation per year difficult to understand. It
was rated the most useful of all of the EnergyGuide label features. On a scale from 1 to 6, with 6
0
50
100
150
200
250
300
Energy Guide EU Label
Nu
mb
er o
f 0
Rat
ings
Label Features

58
being the most useful feature, cost of operation received an average rating of 5.68 out of 6. The
second most useful label feature was the energy usage per year. Finally, as can be seen in Figure
14, the various other features of the EnergyGuide label were considered less important, with an
average rating of 4.0. While EnergyGuide is a bit more complex, Costa Ricans preferred it for its
detailed information, and found it more comprehendible while translated into Spanish.
Figure 14: Average Usefulness rating of six of the EnergyGuide Label Features
The European Union label showed similar trends as the EnergyGuide label. The EU label
does not display yearly cost of operation. Energy usage per year was the most important feature
to consumers, with an average rating of 5.08 out of 6, with 6 being the most important. The most
surprising result from this section of the survey was the significant lack of comprehension of the
grade rating and scale system (features A and B in Figure 15). Although respondents found that
the color of the scale attracted their attention, 40% of those surveyed did not understand the
meaning of the scale. Those who did understand the scale, did not rate it very highly. The letter

59
grade rating (feature B) was the lowest rated of any feature of either label. It had an average
rating of 3.32 out of 6. This likely occurred because in Costa Rica, letter grading systems are not
used, and therefore an “A” rating would have little meaning to the average consumer. Features
D, E, and F for the EU label were also rated poorly for their usefulness to participants. These
features were misunderstood a total of 117 times across 140 surveys. These three features use
symbols to convey information, and Costa Rican consumers are likely unfamiliar with these
symbols. While the EU label was created to be universal, for Costa Ricans, more written
information is preferred.
Figure 15: Average Usefulness Rating of Six of the European Union Energy Label Features
We determined features that conveyed information well, in addition to features that were
not helpful to consumers. We learned that respondents prefer a label with bright colors and that
also includes detailed numerical information. A complete summary of the data found from our
initial surveys can be found in Appendix B: Consumer Awareness and Comparative Analysis

60
Survey. As will be discussed below, using the data gathered in this section, we designed a
second set of surveys to evaluate our own label design drafts.
5.2.3 Explanation of Error and Bias
There were several sources of error that could have affected our survey. The greatest
challenge we encountered while performing this survey was explaining questions using a ranking
system to participants. Several of the respondents only filled in their favorite or least favorite
selections, and did not rank the other categories. This data could still be included in the final data
set without significantly affecting the results. Non-responders lowered the overall number of data
points collected.
We also encountered the possibility of nonresponse bias in our survey. Several of the
respondents selectively did not reply to certain questions. However, this was very minimal and
only occurred once or twice on each question out of 140 respondents. This did not significantly
affect the overall outcome of each question. We recalculated averages needed for our results with
and without response errors. The difference between the averages was insignificant.
Finally, the largest error that may exist in this survey is that from inconsistency in the
way in which the survey was presented and explained. During the first surveying session, two
separate teams of two members were created to survey separately for time and efficiency.
Unfortunately, there was no predefined method of whether to read the survey to the consumer or
to hand it to them and allow them to read and interpret the survey separately. After
approximately twenty surveys, this problem was addressed and corrected with a standard
surveying method and explanation.
The most recent population size of Costa Rica is 4.8 million residents. Based on our
survey sample size of 140 residents, our confidence level was 85%, with a confidence interval of

61
+/- 6.0% (Albright, 2011). This confidence interval is a reasonable size and was considered when
reviewing data from the survey.
5.3 Assess Local Opinions
5.3.1 Public Opinions of Appliance Features
In addition to questions about specific label features, we asked questions about the
opinions of consumers during the process of purchasing appliances to understand what is
important to them.
When we asked the general public whether or not they had seen energy efficiency labels,
68% of those surveyed reported they had seen energy efficiency labels in stores. Of this 68%
percent, 82% of participants found information on labels useful, and 78% percent reported that
the labels affected their buying decision. However, 32% of those surveyed had not seen energy
efficiency labels, and were not aware of their availability. This leads us to believe that consumers
could be more informed about energy efficiency. This is depicted in Figure 16.
Figure 16: Percentage of Participants Who Had Seen Energy Efficiency Labels
Consumers were next asked to rate seven product characteristics, including price, size,
and visual appearance, in order of importance on a scale from one to seven; seven being the most
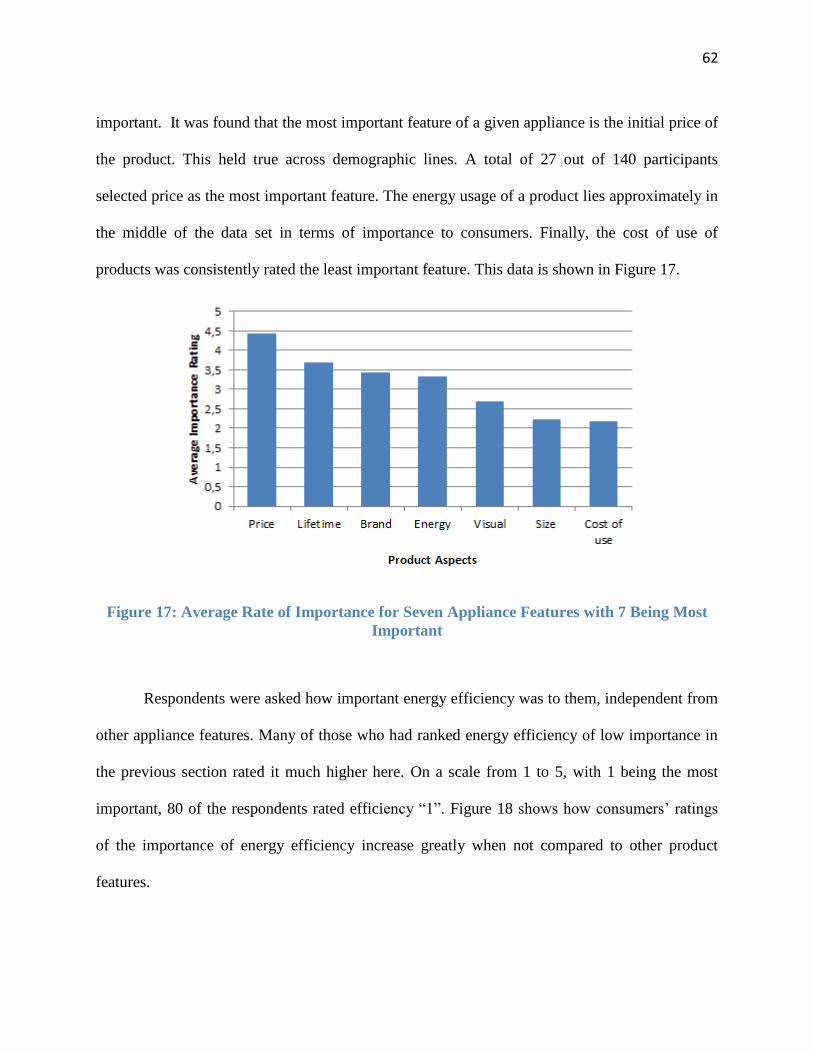
62
important. It was found that the most important feature of a given appliance is the initial price of
the product. This held true across demographic lines. A total of 27 out of 140 participants
selected price as the most important feature. The energy usage of a product lies approximately in
the middle of the data set in terms of importance to consumers. Finally, the cost of use of
products was consistently rated the least important feature. This data is shown in Figure 17.
Figure 17: Average Rate of Importance for Seven Appliance Features with 7 Being Most
Important
Respondents were asked how important energy efficiency was to them, independent from
other appliance features. Many of those who had ranked energy efficiency of low importance in
the previous section rated it much higher here. On a scale from 1 to 5, with 1 being the most
important, 80 of the respondents rated efficiency “1”. Figure 18 shows how consumers’ ratings
of the importance of energy efficiency increase greatly when not compared to other product
features.

63
Figure 18: Rating of Importance of Energy Efficiency When Not Compared to Other
Appliance Features
From this section of the survey, it is clear that consumers were very enthusiastic about
energy efficiency when asked directly about this feature. When compared to other product
features, energy efficiency is no longer within the top priorities of most consumers when buying
appliances.
Finally, participants were asked to indicate a preferred label from the three international
labels. Once selected, we asked whether the information or design of the label influenced their
decision more. Of the consumers surveyed, 54% selected information as more important, while
46% selected design. Figure 19 displays this data.
0
10
20
30
40
50
60
70
80
90
Important Neutral Unimportant
Nu
mb
er
of
Rat
ings
Importance Rating
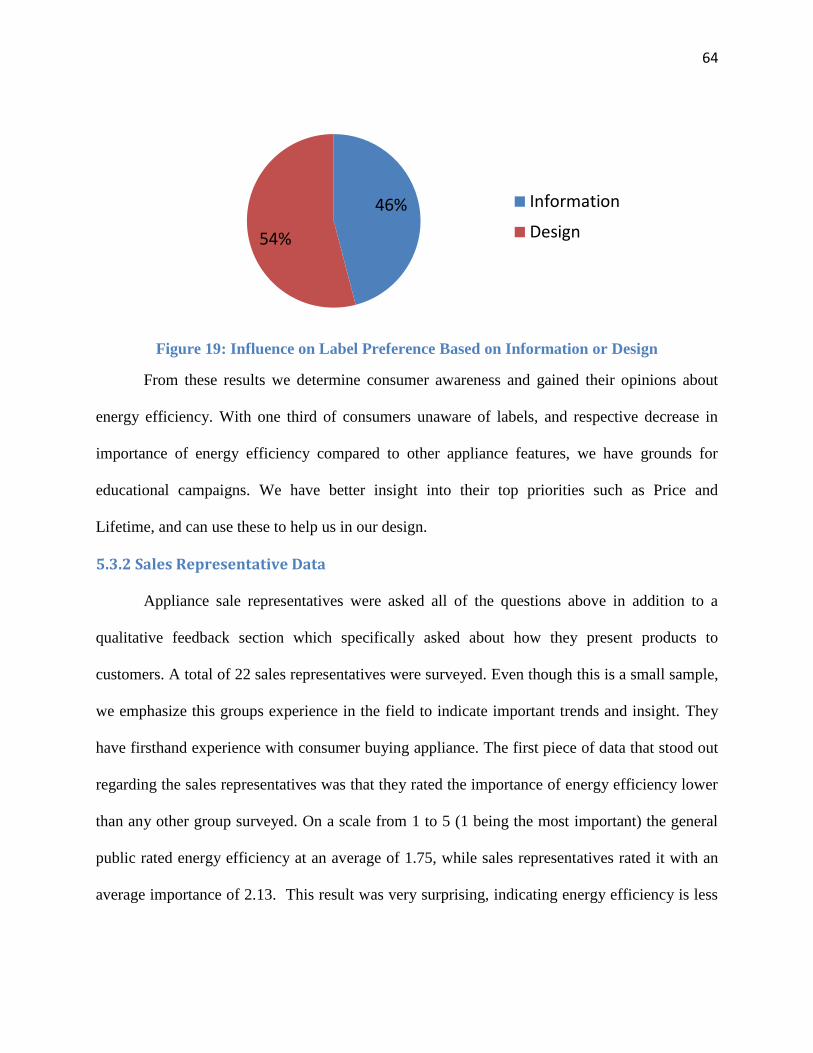
64
Figure 19: Influence on Label Preference Based on Information or Design
From these results we determine consumer awareness and gained their opinions about
energy efficiency. With one third of consumers unaware of labels, and respective decrease in
importance of energy efficiency compared to other appliance features, we have grounds for
educational campaigns. We have better insight into their top priorities such as Price and
Lifetime, and can use these to help us in our design.
5.3.2 Sales Representative Data
Appliance sale representatives were asked all of the questions above in addition to a
qualitative feedback section which specifically asked about how they present products to
customers. A total of 22 sales representatives were surveyed. Even though this is a small sample,
we emphasize this groups experience in the field to indicate important trends and insight. They
have firsthand experience with consumer buying appliance. The first piece of data that stood out
regarding the sales representatives was that they rated the importance of energy efficiency lower
than any other group surveyed. On a scale from 1 to 5 (1 being the most important) the general
public rated energy efficiency at an average of 1.75, while sales representatives rated it with an
average importance of 2.13. This result was very surprising, indicating energy efficiency is less
46%
54%
Information
Design

65
of a priority to sales representatives. Ideally, we would want those selling appliances to hold
energy efficiency above other features.
When we asked appliance sales representatives whether they had seen energy efficiency
labels, 3 of the 22 (13%) surveyed reported that they did not recall seeing them at all. However,
when shown the example labels from other countries, sales representatives responded
significantly more positively than the general public. Of the sales representatives, 91%
recognized at least one of the labels, 20% more than the general public. This data is shown in
Figure 20. As a disclaimer, the sample size of sales representatives was much smaller than that of
our general public. This data may not represent the total population of sales representatives in
Costa Rica.
Figure 20: Recognition of International Labels between the General Public and Sales
Representatives
In the additional open response section for sales representatives, there were some clear
trends in the information they use to persuade consumers to purchase appliances. The most
0
0,1
0,2
0,3
0,4
0,5
0,6
0,7
0,8
0,9
1
Any EU Label EnergyGuide ENERGY STARPer
cen
tage
wh
ich
Rec
ogn
ize
d L
abel
Example International Label
Recognition of International Labels
General Public
Sales Representatives

66
common selling point was price, with 68% of the sales representatives mentioning price during
the related open-response question. The second most common word mentioned through all of the
open response-questions was consumption. This word was often included in the phrase
“consumption of energy,” or electricity. Between all 18 open-response surveys, consumption was
mentioned a total of 53 times. The specific phrase “energy efficiency” was only mentioned once
across all of the open-response question results. The complete data gather from sales
representatives can be found in Appendix C: Survey of Sales Representatives.
5.4 Implementation of Label
5.4.1 Final Design Drafts
Based on the responses from the initial consumer surveys, six label drafts were created to
test label design and comprehension for a final recommended label that has in our opinion the
highest appeal for Costa Rican residents. The data included in these label drafts was determined
by the survey results in Section 5.2. These labels attempted to include all of the information
found useful by the consumers in Section 5.3.1, as well as create a simple design. This
specifically led us to include the numerical cost of operation per year and energy consumption
per year.
In addition to incorporating the findings of our initial surveys, several of the labels were
designed to conform with LEY 7447 pertaining to energy efficiency labeling. This law requires
13 label features to be displayed, including a specific name, appliance volume, and two forms of
energy usage per year. Label drafts were created with and without this data to determine if it
made the label too visually busy. The six draft labels are seen in
Figure 21, and larger versions can be reviewed in Appendix D.

67
Figure 21: Six Possible Label Designs (A – F) Used in Evaluations of Consumer Preference
We wanted to create a variety of designs to test among consumers. These six designs
were inspired by observations we made while surveying, and strong trends in the results from our
initial survey. Many of the features chosen in these possible designs options were things we
associated with energy efficiency. For variety, we added un-orthodox features to some designs.
This ensured that we didn’t leave out possible ideas that Costa Rican may like. The star design of
option “D” and the gauge scale in option “B” are example of un-orthodox features but can appeal
to Costa Ricans.
A B C
E D F

68
5.4.2 Evaluation of Drafts
The draft labels shown in Figure 20 were tested with 50 consumers as part of a public
survey. This survey covered five major elements of our recommended labels. Four of these were
specific label features and the final section included responses to the complete draft labels. For
each of these questions, participants were asked to choose the best and worst options based on
their opinions. All of the question choices can be found in Appendix E.
Different visual scaling systems were the first label features tested. This label feature
provides a visual means for consumers to understand how efficient an appliance is without
having to read the numerical data. This also allows consumers to easily compare products based
on their energy efficiency. Of the five scaling systems tested the most well-received feature was
an analog gauge system, similar to a fuel gauge in a vehicle. Of those who participated, 40%
chose the gauge as the best scale system. Figure 22 shows the net responses for each of the
surveyed scales, and the chosen scale type. The net response count is the number of times the
example label was chosen as the best label minus the number of times it was chosen as the worst
label.
i) ii)
Figure 22: i) Net Selection of Possible Scaling Systems, ii) The Scaling Option That Was
Most Approved
-15
-10
-5
0
5
10
15
20
A: GradeScale
B: Gauge C: CostScale
D: Stars E: Grade
Ne
t R
esp
on
se C
ou
nt
Type of Scale System

69
The next label feature tested in our surveys was the title of the label. This included both
the title name as well as the logo design. It should be noted that Ley 7447 requires that the label
be entitled “Etiqueta Energética,” or “Energy Label.” However, this title received the lowest
rating of all tested choices. This may indicate that the government does not sample consumers
for their thoughts and opinions. The most positively received title was “Ahorros Energéticos,” or
“Energy Savings.” This title also includes a reference to “Ticos,” or the name in Spanish used to
refer to Costa Ricans. The chosen title and logo, as well as a graph of the net responses to the
titles are shown in Figure 23.
Figure 23: i) Net Selection of Possible Titles, ii) The Title Option That Was Most Approved
After the title, consumers were tested on label color and label layout. As expected, Costa
Rican consumers favored more colorful labels. A label with a rainbow colored background was
considered the most attractive. Solid green received the next highest net rating. The label layout
had far more pronounced results than the color preferences. The majority of those surveyed
preferred a portrait layout with a minimal number of boxes containing numerical information.
The least preferred label layout was a star-shaped label with a minimal amount of data. The
numerical results of these survey sections and specific questions can be found in Appendix E.
ii) i)

70
For the final question of the survey, the six draft labels shown in Section 5.4.1. were
presented to the respondent. Unsurprisingly, the label which received the highest ratings
incorporated the most popular title, scaling system, and layout. The only feature not incorporated
in the highest rated label from the results of previous questions was the background color.
However, the second most popular label was extremely colorful. The highest rated label and net
response count is depicted in Figure 24. Additional data and other label drafts can be found in
Appendix E.
Figure 24: i) Net Selection of Possible Label Designs, ii) The Label Design Option That Was
Most Approved
i) ii)

71
Chapter 6: Conclusions
From our research, we drew four main conclusions pertaining to each objective.
1. Communication between implementation bodies could be improved
2. The existing system for the implementation of energy efficiency labels is inefficient
3. The public was generally not knowledgeable of energy efficiency labels
4. Features of labels that are attractive and comprehensible to consumers should be
developed
The first conclusion was the most obvious when communicating to the individual
organizations involved in the implementation body. Many of them were not aware of the projects
that were being led by their partners. An example of this is the lack of knowledge about the
ENERGICE label by other organizations. ICE pointed out that enforcement was a main flaw in
standardizing a label. MEIC, which is a member of the enforcement body and investigates the
market pertaining to labels, was not aware of ENERGICE. MEIC and MINAE are the bodies
responsible for enforcement. They are currently discussing the delegation of tasks to begin
enforcement, but it appears that neither organization is assuming responsibility. We concluded
that there is an obvious disconnect between organizations within the implementation process.
The second conclusion was established after meeting with all of the implementation
organizations. We were introduced to LEY 7447, which requires thirteen specific aspects to be
displayed on an energy efficiency label for appliances. However, this law does not specify a
standardized testing procedure, nor does it mandate a specific design to display the information.
Clearly, this leads to different results from energy efficiency testing and a confusing variety of
labels. A single government body responsible for its enforcement is also needed. The absence of
enforcement is due to outdated regulations, lack of resources to regulate the market, and
72
miscommunication between organizations. The underlying issues tie with our previous
conclusion: a general lack of effective communication.
Our third conclusion was determined via survey results assessing public opinions on
energy efficiency. The top priorities for Costa Ricans when buying appliances, in order of
importance, are: price, lifetime of product, brand, energy efficiency, visuals, size, and cost of
use. Energy efficiency was of rather low importance when compared to other appliance features.
Interestingly, results show that about one-third of the sample had not seen energy efficiency
labels at all. This indicates that one-third of the surveyed consumers are unaware that energy
efficiency labels are supposed to help them make informed decisions. To create a demand for
energy-efficient appliances, consumers need to understand how appliances can save money in
the long term of their usage.
Our fourth conclusion was also determined via survey results. After testing three types of
labels, we determined that Costa Ricans preferred a more informative energy efficiency label. On
average, 59% of Costa Ricans would have purchased a refrigerator with an EnergyGuide label
rather than the ENERGY STAR or European Union label. Results also showed participants
preferred a label that is law-compliant, displays cost of operation per year, has an analog gauge
comparative image, has the title “Ahorros EnergéTICOS”, utilizes rainbow colors, uses large
font, and uses a simple layout. This may indicate insufficient research by the government and by
manufacturers on consumer preference when the law was initially created.

73
Chapter 7: Recommendations
7.1 Steps for Future Implementation of an Efficiency Label in Costa Rica
After interviewing the companies involved in the implementation process, we observed
specific areas that need improvement. When interviewing employees from each of the
implementing organization, we inquired about the flaws of the system and how they could be
improved. With information from implementation companies, research into existing labels,
survey results, and our observations of the current system in Costa Rica, we developed
recommendations for a standardized label system. These recommendations should make labels
more effective and useful for consumers. The labels will help consumers make informed
decisions when buying appliances, while promoting energy-efficient appliances. The four main
recommendations include:
1. Collaboration
2. Standardized, Mandatory, Label System
3. Consumer Education
4. Government Involvement
7.1.1 Collaboration
From our observations and interviews with CICR, ASEGIRE, ICE, ECA, INTECO, and
MEIC, many of the organizations do not update each other with regards to ongoing energy
efficiency projects. While each organization operates independently, the lack of communication
creates duplication of efforts and lax oversight. Case in point: the CICR was unaware of ICE’s
project to develop a label and initiated this study duplicating the process. Also, the lack of
communication between MEIC and MINAE has prevented strong enforcement of regulations. To

74
successfully implement a standardized label system, these organizations need to hold closer ties
with each other.
In order to persuade these organizations to collaborate effectively towards the goal of
standardizing an energy efficiency label in Costa Rica, we suggest forming a standing committee
with regularly scheduled meeting times. Organizations present in this committee should include
producing companies, accreditation companies, testing laboratories, and enforcement bodies. In
this committee, members will be informed of all projects pertaining to the implementation of a
label. This will provide an opportunity for organizations to collaborate to improve the
standardized labeling system. The committee will also ensure that each organization will be
involved in the label implementation process, rather than the current situation of several
companies trying to standardize several different labels. It is expected that this will reduce the
number of labels in the market and lower confusion among consumers. Our suggestions for the
companies to be included in this committee, as well as their responsibilities, are detailed in Table
2.
Table 2: Suggested Committee Members, Roles, and Responsibilities
Company Name Category of Company Responsibility
CICR Management Encourage member institutions to cooperate with
program
ICE Testing Laboratory Test appliances and confirm validity of label
information
ECA Accreditation Certify ICE and INTECO procedures
INTECO Accreditation Create standards for product quality
MEIC Enforcement Educate consumers through media campaigns
MINAE Enforcement Investigate label compliance and fine offenders,
create initiatives for updated regulations
ASEGIRE Management Encourage member institutions to cooperate with
program
Manufacturer Producer Provide quality products that abide by the law
Appliance
Retailer
Distributer Promote label use in stores; sales rep. training

75
7.1.2 Standardized Mandatory Label System
Once a committee has been formed, the tasks needed to create a comprehensive labeling
system can be articulated and delegated to the individual organizations. Each organization will
be responsible for tasks to properly implement and sustain an effective standardized energy
efficiency label. The committee should be guided by two objectives: 1) to update regulations that
specify responsibility to enforce LEY 7447 and 2) to mandate standard testing procedures to
ensure comparable results and a standardized label design.
To complete the first objective, the committee must update the regulations that declare
who is responsible for the enforcement of LEY 7447. Currently, both MEIC and MINAE are
accountable for the enforcement of labels in the market. We expect that under the joint
supervision, clear regulations will emerge that delegates enforcement responsibilities.
We recommend that MINAE should take the lead in creating a more proactive
enforcement body. Presently, MEIC’s purpose is mainly to educate consumers, receive consumer
complaints, and investigate the validity of complaints. This organization, however, lacks the
resources to enforce labels in stores. MINAE, however, is responsible for the technical aspects
and validity of the information on the energy efficiency labels. Ideally, MINAE will work with
ICE to test the accuracy of the information provided by manufacturers. If the information is
incorrect, MINAE would be responsible for penalizing the appropriate party. The fines will go
towards funding the implementation process. Since there is currently no law directly stating this
responsibility, this leads to confusion between MEIC and MINAE about their specific roles. An
updated law would solve the issue of miscommunication and delegate responsibilities for label
implementation.
76
With an active enforcement body regulating energy efficiency labels in the market,
manufacturers will be more likely to comply with the law. Currently MEIC and MINAE are
discussing the development of a sanction for placing invalid information on energy efficiency
labels. Therefore, manufacturers will have an incentive to become certified and to place a
standardized label on their appliances. MEIC and MINAE must update the regulation, and make
label regulation an essential priority.
To complete the second objective, we recommend that the proposed committee petition
the government to introduce a new regulation: it should require all appliances (domestic and
imported) to be certified within Costa Rica. This regulation should mandate that all similar
appliances undergo a standardized testing procedure. It should also decree that all required
information is displayed on a standardized label design. This would allow consumers to
consistently find information in the same location on labels. Using one standardized label
required by the government would furthermore eliminate the existence of multiple labels on
appliances. This will reduce the amount of misleading information available in the market.
7.1.3 Education
Our survey showed that approximately one-third of our participants had not seen energy
efficiency labels at all. To create a demand for energy-efficient appliances, consumers need to
understand their impact on the environment and how they can lead to saving money. These
examples lead us to recommend that educational programs are launched that focus on the
following topics:
● Mass media campaign
● Training of sales representatives
● Informational graphics in-store

77
We recommend a series of three campaigns to meet these needs.
The first campaign is to inform consumers of the benefits of energy-efficient products
through mass media. The content will educate consumers about appliances that cost less money
to operate and reduce the total impact on environment. This campaign could be done via
television, radio commercials, internet campaigns, product advertisement campaigns, and child
enrichment programs in schools. Many people watch television, listen to radio, and use the
internet. Using these resources allows the campaign to reach a wide audience in a quick manner.
Encouraging manufacturers to use information relating to energy efficiency in their
advertisement campaigns and commercials will emphasize its importance to consumers.
Child enrichment programs promote conservation of energy to school students. Educating
younger generations about ways to reduce energy consumption will promote energy-efficiency
within their households. Equipped with specific information about energy-efficient appliances,
children can have substantial impact on their families’ daily habits. Convincing children that this
is an important issue will also encourage energy-efficient practices in the future.
The mass media campaign should be managed by MEIC. This follows the department’s
objectives of giving consumers the information needed to make informed decisions.
The second campaign focuses on educating sales representatives. They should be aware
of the advantages of energy-efficient products, how to interpret energy efficiency labels, and
how to use this information to persuade consumers to buy efficient appliances. Energy efficiency
should be made a priority for these employees. They are responsible for convincing consumers to
purchase energy-efficient appliances. They furthermore assist consumers in comparing important
features of products. Energy efficiency should become one of these important features. This
program can be implemented by CICR and ASEGIRE contacting their member institution and

78
stores, and encouraging stores such as Play and Importadora Monge to add training focused on
energy efficiency labels.
The third campaign focuses on educating consumers on the existence of energy efficiency
labels. It should also indicate an official label and how to use the features to compare products.
Consumers need to be made aware of the availability of this information. This information
should encourage a demand among consumers for more efficient appliances. Consequently, the
demand should promote competition among providers who supply these appliances. To achieve
this, we suggest a large, explanatory poster in appliance stores. These posters will draw attention
to the labels, and highlight their features. It will give a detailed illustration and description of
features to increase understanding among consumers. Highlighting the importance of the features
will give consumers the tools to make proper comparisons in appliances. The previously
mentioned committee dedicated to improving the standardize label system should be responsible
for creating these posters and distributing them to appliance stores.
In summary, these education campaigns will promote energy-efficient appliances, create
demand for efficient appliances, and increase competitiveness between manufactures to make
better products.
7.1.4 Government Involvement
Our final recommendation is for the government to initiate programs and policies that
will encourage manufacturers to become certified through a Costa Rica company and use an
official, standardized label. In the United States, ENERGY STAR can attribute its success to a
similar program. An U.S. Executive Order required the government to purchase only office
equipment that was compliant with ENERGY STAR standards. The amount of products used by
the government created a large demand for energy-efficient appliances. This encouraged

79
manufacturers to produce more ENERGY STAR compliant appliances to meet the government
demand. The availability of these appliances then led to consumers purchasing more efficient
appliances.
We recommend a program in which the government exclusively uses appliances that are
certified in Costa Rica. Governments are one of the largest consumers in the market. A program
similar to that developed in the United States would encourage Costa Rican manufacturers to
improve the energy efficiency of their products to remain competitive in the market. Once
companies begin to produce appliances that meet government requested energy efficiency
standards, they will become more widely available to consumers. Then, educational campaigns
such as those described above can be used to encourage consumers to purchase these efficient
appliances.
Another important contribution the Costa Rican government could make is to offer tax
exemptions for importers and domestic manufacturers that meet energy efficiency standards, and
use environmental friendly procedures in production. Ideally, these tax incentives will save
manufacturers money. Those savings should trickle down and reflect in the prices of the product.
If energy-efficient products cost less, more consumers will buy them. This will conserve
electricity and thereby result in increased demand for efficient appliances.
Currently, the problem is verifying which products are compliant with the standards. We
recommend that INTECO develops the standards that manufacturers are required to achieve and
organizes the entirety of the certification process. For example, companies could bring products
to INTECO, which in turn will work with ICE to complete energy consumption analysis. Then,
INTECO will certify the product and issue the completed, standardized label to the
manufacturer. When INTECO accredits that appliance, it can also determine if the product is

80
approved for a tax exemption, and if it meets the qualities of the government program. With one
company responsible for these functions, the certification and label implementation process
would become a straight-forward, transparent procedure.
7.2 Standardized Label based on Consumer Input and Ley 7447
In addition to recommending improvements to the current energy efficiency labeling
systems in Costa Rica, we also recommend a single standardized label design. In order to outline
the process we have created an example label that fully integrates the consumer preference into
its design. This ensures understanding of key features and usefulness of the label. Our same
methodology can be applied on a larger scale to adapt the best energy efficiency label for Costa
Rica. This would allow the public to accept the label and to have confidence and ownership in it.
This prototype label was created using crucial information gathered from consumer
surveys, feedback from sales representatives, and includes input from implementing bodies.
Several key features are incorporated into the final suggested label including law compliance,
cost of operation per year, bright visual appearance, and clear explanations of technical data.
It would be in the best interest of Costa Rican appliance labeling, if the recommended
label meets the 13 features stipulated by Decreto 29751. Although we do not agree with all
points of the law, compliance with it would allow for more rapid implementation. Even though
the law demands a large amount of data to be displayed, it could be included without creating an
overwhelmingly complex technical label. An example of this is the preferred label design from
our second round of surveys: it was the most highly rated label design and it was almost fully
law compliant. The only area where our design differs is the title. By law the label is required to
be named “Etiqueta Energética”. However, as mentioned earlier this title was very poorly

81
received by the public. For this reason the recommended example label design does not include
this title. The final recommended standardized label design can be seen in Figure 25.
Figure 25: Final Recommended Label Design

82
Resumen de Recomendaciones en Español
Después de entrevistar las organizaciones involucradas en el proceso de la
implementación de los etiquetados, observamos problemas específicos que necesitan
mejoramiento. Preguntamos los empleados de las organizaciones sobre los defectos en el
sistema actual de la implementación y sus sugerencias para arreglarlos. De estas sugerencias y
nuestras observaciones, hemos diseñado las recomendaciones siguientes:
1. Colaboración de las organizaciones de implementación
De nuestras observaciones y entrevistas con la CICR, ASEGIRE, ICE, ECA, INTECO,
MEIC, y MINAE, algunas de las organizaciones no son conscientes de los proyectos que fueron
iniciados por otras organizaciones. La falta de comunicación impide la tasa de desarrollo para
estandarizar una etiqueta de eficiencia energética.
Sugerimos la formación de un comité que sea dedicado a la estandarización de una
etiqueta de eficiencia energética. Este comité constará de representantes del gobierno y de la
industria, incluso todas partes del proceso de la implementación de las etiquetas. Estos miembros
incluyen las organizaciones de regulación, acreditación, certificación, y pruebas de
electrodomésticos. En el comité, los miembros serán informados sobre todos los proyectos en
relación a la implementación de un etiquetado. También recomendamos que el comité asegure
que cada organización sea involucrada en el proceso de la implementación. Esto reducirá la
cantidad de confusión entre las organizaciones sobre sus responsabilidades. Sugerimos que cada
organización trabaje en partes específicas del proceso para estandarizar y mejorar el sistema.

83
Miembros, Papeles y Responsabilidades Sugeridos para el Comité de Establecimiento de
un Etiquetado Normalizado
Nombre de
Organización
Categoría de
Organización
Responsabilidad
CICR Gerencia Animar a las empresas a usar las etiquetas de
eficiencia energética y promover el proceso de
crear el sistema normalizado
ICE Pruebas Probar los electrodomésticos confirmar la validez
de la información mostrado en las etiquetas
ECA Acreditación Certificar los procedimientos de ICE e INTECO
INTECO Acreditación Crear normas para la calidad y eficiencia de los
electrodomésticos
MEIC Seguridad del estado Educar a los consumidores mediante las campañas
de los medios de comunicación
MINAE Seguridad del estado Investigar la conformidad a las leyes en relación a
las etiquetas y crear iniciativas para actualizar las
regulaciones
ASEGIRE Gerencia Animar a las empresas a usar las etiquetas de
eficiencia energética y promover el proceso de
crear el sistema normalizado
Productores Producción Fabricar productos de alta calidad que siguen los
reglamentos de la ley
2. Estandarizar y requerir el uso de un etiquetado de eficiencia energética
A causa de las regulaciones anticuadas, hay confusión entre las organizaciones sobre el
departamento que sea responsable para la regulación de las etiquetas según la LEY 7447.
También la ley no requiere ni una prueba para la eficiencia energética de los electrodomésticos
ni un diseño normalizado de una etiqueta. Recomendamos que el comité trabaje para actualizar
las regulaciones que especifican la responsabilidad de hacer cumplir los reglamentos de LEY
7447. También sugerimos que requiera un diseño normalizado para las etiquetas y un
procedimiento estandarizado de pruebas para proveer los resultados comparables en los
electrodomésticos.

84
Es necesario que las direcciones de MEIC y MINAE actualicen las regulaciones y que
hagan la regulación de las etiquetas una prioridad. Además, una regulación nueva es
necesaria para requerir que todos los electrodomésticos similares reciban el procedimiento
estandarizado de pruebas. Este reglamento necesita requerir la muestra de la información en
un diseño normalizado de las etiquetas.
3. Educar a los consumidores
Los resultados de nuestras encuestas demostraron que aproximadamente un tercio de
nuestros participantes no han visto las etiquetas de eficiencia energética. Para crear una
demanda para los electrodomésticos eficientes, es necesario que los consumidores entiendan la
eficiencia energética y sus beneficios para ahorrar el dinero y dañar menos el medio ambiente.
Para hacer esto, sugerimos el uso de tres campañas educacionales para informar los
consumidores sobre los beneficios de la eficiencia energética y la disponibilidad y uso de las
etiquetas de eficiencia energética. Las campañas recomendadas son:
Una campaña de los medios de comunicación de anuncions
La capacitación de las representantes de ventas
Los gráficos informativos y carteles en las tiendas
4. Participación del gobierno
Hemos desarrollado otra recomendación para iniciar los programas gubernamentales y
políticas para animar a los fabricantes a obtener certificaciones para sus productos a través de
una empresa costarricense. También es importante que los fabricantes muestren una etiqueta
oficial y normalizada en sus productos. Sugerimos un reglamento que requiere que el gobierno

85
compre sólo los electrodomésticos que son certificados en Costa Rica y que cumplen con ciertas
normas mínimas de eficiencia energética. Un programa similar fue muy exitoso en la creación de
la publicidad de la etiqueta ENERGY STAR en los Estados Unidos. Otra contribución posible e
importante del gobierno es el ofrecimiento de las exenciones de impuestos para los importadores
y fabricantes domésticos que producen electrodomésticos que cumplen con los requisitos
mínimos de eficiencia energética.

86
Appendix A: ENERGY STAR Refrigerator Standards
Table 3: ENERGY STAR Energy Efficiency Criteria for Residential Refrigerators and
Freezers

87
Appendix B: Consumer Awareness and Comparative Analysis Survey
The following appendix demonstrates the responses of our first survey. The first
part of survey was to determine how knowledgeable Costa Rican consumers were about
energy efficiency and their priorities when shopping for home appliances. The second part
of the survey determined their preferences between the three international labels we
studied. Finally, the third section tested consumers’ preferences and understanding of the
individual characteristics of the label. This appendix shows the questions and results of
each of these survey sections.
Demographic Data
In this section of the survey the demographic data of participants was collected, this
included age, income and sex.
Edad: __ Menos de 20 años __ 20-29 __ 30-39 __ 40-49 __ Más de 50
Age: __Less than 20 years of age __20-29 __30-39 __40-49 __Above 50
Table 4: Percentage of Survey Respondents by Age Range
Age Count Percentage
<20 11 7,86%
20-29 62 44,60%
30-39 23 16,67%
40-49 24 17,52%
>50 14 10,29%
Declined 6 4,44%

88
Ingreso por mes:
__ Menos de ¢ 500.000 __ Entre ¢ 500.000 y 1.000.000 __ Más de ¢ 1.000.000
Income per month:
__Less than 500,000 colones __Between 500,000 & 1,000,000 colones
__ More than 1,000,000 colones
Table 5: Percentage of Survey Respondents by Average Monthly Income
Income per Month in
Colones
Count Percentage
<500,000 64 48,12%
500,000-1,000,000 33 25,00%
>1,000,000 12 9,16%
Declined 31 23,85%
Sexo: __ Hombre __ Mujer
Gender: __ Male __ Female
Table 6: Percentage of Survey Respondents by Sex
Sex Count Percentage
Male 84 65,63%
Female 51 40,16%
Declined 5 3,97%

89
Part 1 – Buying Tendencies
Question 1
Enumere del 1 al 7 los siguientes factores con respecto a la importancia a usted cuando
compra los electrodomésticos: 1 es el más importante y 7 es el menos importante. Por
favor, use todos los números una vez.
__ Tamaño __ Precio
__ Apariencia visual (colores, diseño, etc.) __ Vida útil
__ Eficiencia y consumo de energía __ Marca
__ Costos durante su uso
Please rank the following 7 factors in order of importance when buying appliances. (1 is
best and 7 is the worst). Please use each number only once.
__ Size __ Price
__ Visual appearance (color,design, etc.) __ Lifetime
__ Efficiency and energy consumption __ Brand
__ Costs during use

90
Figure 26: Average Importance Rating of Factors when Shopping for Home
Appliances. Higher Values Indicate Greater Importance
Figure 27: Number of Times Each Factor was Rated as Most Important
0
0,5
1
1,5
2
2,5
3
3,5
4
4,5
5
Precio Vida útil Marca Eficienciade energía
Aparienciavisual
Tamaño Costosdurante su
uso
Ave
rage
Im
po
rtan
ce R
atin
g
Factors Considered when Shopping
0
10
20
30
40
50
60
Precio Vida útil Marca Eficienciade energía
Aparienciavisual
Tamaño Costosdurante su
uso
Sum
of
Nu
mb
er
1 R
atin
gs
Factors Considered when Shopping

91
Figure 28: Average Importance of Factors when Shopping for Home Appliances vs.
Gender of Respondents. Higher Values Indicate Greater Importance
Figure 29: Average Importance of Factors when Shopping for Home Appliances vs.
Income of Respondents. Higher Values Indicate Greater Importance
0
0,5
1
1,5
2
2,5
3
3,5
4
4,5
5
Precio Vida útil Marca Eficienciade energía
Aparienciavisual
Tamaño Costosdurantesu uso
Ave
rage
Im
po
rtan
ce R
atin
g
Factors Considered when Shopping
Male
Female
0
0,5
1
1,5
2
2,5
3
3,5
4
4,5
5
Precio Vida útil Marca Eficienciade energía
Aparienciavisual
Tamaño Costosdurantesu uso
<500,000
500,000-1,000,000
>1,000,000
Income per month in Colones

92
Question 2
¿Qué tan importante es la eficiencia energética para usted en una escala de 1a 5? 1 es el
más importante y 5 es el menos importante.
Encierre sólo uno: 1 2 3 4 5
On a scale from 1 to 5, how important is energy efficiency to you?
1 2 3 4 5
Figure 30: Importance of Energy Efficiency when Rated on a Scale of 1 to 5
Table 7: Average Importance of Energy Efficiency when Rated on a Scale from 1 to 5
Mean Median Mode Standard Deviation
1,854015 1 1 1,223494
0
10
20
30
40
50
60
70
80
1 2 3 4 5
Nu
mb
er
of
Re
spo
nse
s
Importance Rating (1 is most important)

93
Figure 31: Importance of Energy Efficiency on a Scale of 1 to 5 vs. Age of Respondent
Question 3
¿Ha visto usted etiquetas de eficiencia en los electrodomésticos? Encierre uno: SÍ o
NO
Si contestó sí:
a. ¿Le transmitió alguna información? SÍ o NO
b. ¿Influyó esto en su compra? SÍ o NO
Have you seen any labels on products?
If yes: YES or NO
Did you learn new information from the label? Circle one: YES or NO
Did it influence your decision on which product to purchase?
Circle one: YES or NO
1
1,2
1,4
1,6
1,8
2
2,2
<20 20-29 30-39 40-49 >50
Imp
ort
ane
of
Ene
rgy
Effc
iecn
y
Age Range

94
Figure 32: Percentage of Those Surveyed who Had and Had Not Seen Energy
Efficiency Labels before our Survey
Table 8: Those who Found the Information from Energy Efficiency Labels Helpful
Demographic # of Responses Percentage
Yes No Yes No
All 77 17 81,91% 18,09%
Sex:
Male 48 10 82,76% 17,24%
Female 25 7 78,13% 21,88%
Age:
<20 5 1 83,33% 16,67%
20-29 29 11 72,50% 27,50%
30-39 16 2 88,89% 11,11%
40-49 16 3 84,21% 15,79%
>50 7 0 100,00% 0,00%
Sales Rep 18 1 94,74% 5,26%
Table 9: Those whose Buying Decisions were Influenced by Energy Efficiency Labels
Demographic # of Responses Percentage
Yes No Yes No
All 71 20 78,02% 21,98%
Sex:
Male 43 15 74,14% 25,86%
Female 26 5 83,87% 16,13%
Age:
<20 4 1 80,00% 20,00%
20-29 32 10 76,19% 23,81%
30-39 11 4 73,33% 26,67%
40-49 17 2 89,47% 10,53%
>50 4 3 57,14% 42,86%
Sales Rep 16 3 84,21% 15,79%
68%
32% Yes
No

95
Question 4
Cuando compra electrodomésticos, ¿dónde encuentra la información sobre los
electrodomésticos? Encierre todas las que aplican:
a. Dentro de la tienda sin ayuda de un representante de ventas
b. Dentro de la tienda con ayuda de un representante de ventas
c. En internet
d. Recomendaciones de amigos o familia
e. Otras fuentes :
When you purchase appliances, where do you usually find information?
a. In the store without help
b. In the store with help from sales representatives
c. Online
d. Recommendations from friends or family
e. Other sources : ___________________

96
Table 10: Locations where Consumers Obtain Information when Shopping for
Appliances
Demographic Number of Responses Percentage
Store, no
rep
Store,
rep
Internet Friends,
family
Store, no
rep
Store,
rep
Internet Friends,
family
All 30 94 66 31 13,57% 42,53% 29,86% 14,03%
Age:
<20 2 8 4 4 11,11% 44,44% 22,22% 22,22%
20-29 11 44 38 11 10,58% 42,31% 36,54% 10,58%
30-39 4 14 9 4 12,90% 45,16% 29,03% 12,90%
40-49 7 15 10 7 17,95% 38,46% 25,64% 17,95%
>50 6 10 4 2 27,27% 45,45% 18,18% 9,09%
Sex:
Male 16 60 40 19 11,85% 44,44% 29,63% 14,07%
Female 13 32 25 11 16,05% 39,51% 30,86% 13,58%
Income:
<500,000 10 51 28 18 9,35% 47,66% 26,17% 16,82%
500-1,000 5 19 21 7 9,62% 36,54% 40,38% 13,46%
>1,000,000 5 5 6 1 29,41% 29,41% 35,29% 5,88%
Sales Rep 2 17 11 5 5,71% 48,57% 31,43% 14,29%
Figure 33: Locations where Consumers Obtain Information when Shopping for
Appliances
0
10
20
30
40
50
60
70
80
90
100
Store with salesrepresentative
Store withoutsales
representative
Internet Friends, family
Nu
mb
er
of
Re
spo
nse
s
Where information about appliances is found

97
Table 11: Additional Responses to Question: Where do you Find Information when
Looking for Buy an Appliance?
Location Number of
Responses
Television 5
Appliance Manual 2
Newspaper 1
Media 1
Radio 1
Labels 1
Sales representatives 1
Question 5
¿Pagaría más si un producto pudiera ser reciclado en una manera amigable con el medio
ambiente?
If a product can be recycled in an environmentally friendly way, would you pay more for
it?
Figure 34: Those who Would Pay More for a Product if it was Recycled in an
Environmentally Friendly Manner
Question 6
¿Sabe que los fabricantes pueden reciclar los productos si los devuelve?
Are you aware that you can return products to the manufacturer to be recycled?
82%
18%
Yes
No

98
Figure 35: Those who Knew that Products can be Returned to Manufacturers to be
Recycled
Part 2 – International Label Comparison For this portion of the survey the image below was displayed to the consumer.
Figure 36: Example of International Energy Efficiency Labels Compared in Part 2 of
Our Survey
43%
57%
Yes
No

99
Question 1
¿Ha visto estas etiquetas u otras etiquetas antes?
Have you seen any of these labels before?
Figure 37: Those Who Recognized At Least One of the International Labels Used as
Examples
Question 2
Si contestó sí, ¿cuáles?
If so, which?
Figure 38: Distribution of International Labels that Were Recognized During Our
Survey
72%
28% Yes
No
0
20
40
60
80
100
120
140
Any EU Label EnergyGuide ENERGY STAR
Nu
mb
er o
f R
esp
on
ses
Example Label
Yes
No

100
Question 3
¿Cuál etiqueta le llamo primero la atención?
Which label did you notice first?
Figure 39: Distribution of International Labels that Grabbed the Respondent’s
Attention First
Question 4
¿Cuál etiqueta le gustó más visualmente?
Which label do you think looks the best visually?
25%
43%
31%
1%
EU Label
EnergyGuide
ENERGY STAR
No Response

101
Figure 40: Distribution of International Labels That Consumers Thought were Most
Visually Appealing
Figure 41: Most Visually Appealing Label vs. Sex of Respondent
39%
29%
31%
1%
EU Label
EnergyGuide
ENERGY STAR
No Response
0,00%
5,00%
10,00%
15,00%
20,00%
25,00%
30,00%
35,00%
40,00%
45,00%
50,00%
EU Label EnergyGuide ENERGY STAR
Pe
rce
nta
ge o
f P
op
ula
tio
n
Energy Efficency Label
Male n=83
Female n=51

102
Question 5
¿Qué le llama más la atención en una etiqueta: Encierre uno:
INFORMACIÓN o DISEÑO
Which calls your attention more in a label, the design or information?
INFORMATION or DESIGN
Figure 42: Distribution of Participants that Found Information or Design of the Label
Most Important
Figure 43: Preferences of Design or Information on a Label vs. Sex of Respondent
46%
54%
Information
Design
0%
10%
20%
30%
40%
50%
60%
70%
Information Design
Po
pu
lati
on
Pe
rcan
tage
Most Influential part of a Label
Male n=80
Female n=51

103
Question 6
¿Cuál etiqueta fue la más informativa?
Which label provides you the most helpful information?
Figure 44: Distribution of International Labels that Participants Found Most
Informative
Question 7
¿Cuál etiqueta fue la más comprensible?
Which label was the easiest to understand?
Figure 45: Distribution of International Labels that Participants Found Most
Understandable
36%
61%
3%
EU Label
EnergyGuide
ENERGY STAR
19%
64%
16%
1%
EU Label
EnergyGuide
ENERGY STAR
No Response

104
Question 8
¿Cuál etiqueta le da mayor información sobre la eficiencia energética del electrodoméstico?
Which label gives you more information about energy efficiency in appliances?
Figure 46: Distribution of International Labels that Participants Thought Displayed
the Most Information about Energy Efficiency of the Appliance
Question 9
Basado en la información mostrada por la etiqueta, ¿cuál producto compraría?
Based on information provided by the label, which product would you choose?
Figure 47: Distribution of International Labels for Which Participants Would Buy the
Product Based on the Information Provided by the Label
43%
54%
3%
EU Label
EnergyGuide
ENERGY STAR
31%
59%
9%
1%
EU Label
EnergyGuide
ENERGY STAR
No Response

105
Question 10
¿Cuál de estos tipos de etiquetas prefiere?
Which of these three types of labels do you prefer?
Figure 48: Distribution of International Labels which Participants Considered their
Favorite Label Type
Part 3 – Label features
For this portion of the survey the image below was displayed to the consumer.
33%
53%
14%
EU Label
EnergyGuide
ENERGY STAR

106
Figure 49: Specific Characteristics of Energy Efficiency Label Features Examined in
the Third Part of Our Survey

107
EnergyGuide (Etiqueta A) Features
Para esta etiqueta, por favor enumere los aspectos del 1 al 6 en orden de utilidad para usted
siendo: 1 el más importante y 6 el menos importante. Use todos los números una vez.
También escriba un cero para los aspectos que no entiende.
For the following labels, please rate the aspects that are useful to you according to the
diagram. 1 is the most useful and 6 is the least useful. Please also write 0 for the aspects
you do not understand.
Figure 50: Distribution of EnergyGuide Features Participants Found Useful. Higher
Values Indicate More Useful
3
3,5
4
4,5
5
5,5
6
A -Características
B - Modelo y lasespecificaciones
C - Costo poraño
D - Gama demodelossimilares
E - Consumo deenergía por año
F - CertificaciónENERGY STAR
Ave
rage
Use
fuln
ess
Rat
ing
Label Features

108
Figure 51: Number of Times a Feature of EnergyGuide was Not Understood
Figure 52: Number of Times Each Feature of EnergyGuide was Rated as The Most
Useful Characteristic
0
10
20
30
40
50
60
A -Características
B - Modelo y lasespecificaciones
C - Costo poraño
D - Gama demodelossimilares
E - Consumerde energía por
año
F - CertificaciónENERGY STAR
Nu
mb
er
of
0 R
atin
gs
Label Aspects
0
10
20
30
40
50
60
A -Características
B - Modelo y lasespecificaciones
C - Costo poraño
D - Gama demodelossimilares
E - Consumer deenergía por año
F - CertificaciónENERGY STAR
Nu
mb
er
of
1s
Label Aspects

109
European Union Energy Efficiency Label (Etiqueta B) Features
Para esta etiqueta, por favor enumere los aspectos del 1 al 6 en orden de utilidad para usted
siendo: 1 el más importante y 6 el menos importante. Use todos los números una vez.
También escriba un cero para los aspectos que no entiende.
For the following labels, please rate the aspects that are useful to you according to the
diagram. 1 is the most useful and 6 is the least useful. Please also write 0 for the aspects
you do not understand.
Figure 53: Usefulness of European Union Label Features. Higher Values Indicate
Greater Usefulness
3
3,5
4
4,5
5
5,5
6
A - Rango decalificaciones
B - Nota C - Consumode energía por
año
D - Capacidaddel
refrigerador
E - Capacidaddel
congelador
F - Nivel deruido
Ave
rage
Use
fuln
ess
Rat
ing
Label Feature

110
Figure 54: Number of Times a Feature of the European Union Label Was Not
Understood
Figure 55: Number of Times Each Feature of the European Label Was Rated as the
Most Useful Characteristic
0
10
20
30
40
50
60
A - Rango decalificaciones
B - Nota C - Consumode energía
por año
D - Capacidaddel
refrigerador
E - Capacidaddel
congelador
F - Nivel deruido
Nu
mb
er
of
0 R
atin
gs
Label Aspects
0
10
20
30
40
50
60
A - Rango decalificaciones
B - Nota C - Consumode energía
por año
D - Capacidaddel
refrigerador
E - Capacidaddel
congelador
F - Nivel deruido
Nu
mb
er
of
1s
Label Aspects

111
ENERGY STAR Question
La etiqueta 3 representa el mejor diez por ciento de la eficiencia energética de los
electrodomésticos. Si un electrodoméstico tiene esta etiqueta, ¿escogería usted comprarlo
en vez de un aparato sin esta etiqueta?
Label 3 represents the highest ten percent of appliances with respect to energy efficiency.
If an appliance has this label, are you more likely to buy it instead of an appliance without
the label?
Figure 56: Consumers Who Would Buy an Appliance with ENERGY STAR Instead
of Another Appliance Without It
ENERGICE Question
¿Ha visto esta etiqueta?
Have you seen this label?
Figure 57: The ENERGICE Label Developed by ICE
72%
28% Yes
No

112
Figure 58: Distribution of Participants Who Had and Had Not Seen the ENERGICE
Label
15%
85%
Yes
No

113
Correlation Matrix The correlation coefficient between the results of each question can be calculated
via: ( ) ∑( ̅)( ̅)
√∑( ̅) ∑( ̅) (1)
Equation (1) is used to determine the relationship between any two elements in two arrays
A and B. The higher the absolute value of the correlation coefficient, the stronger the
relationship between the results of the two questions.
An example with a simple data set will illustrate the use of Equation (1). In Table 12:
Example Data Entry Columns for Equation (1) column A holds the numerical results from
5 survey questions arbitrary set as (3, 2, 4, 5, 6); Ā is the average of all results from
column A. Column B holds the numerical results from 5 survey questions arbitrary set as
(9, 7, 12, 15, 17); ̅ is the average of all results from column B.
Table 12: Example Data Entry Columns for Equation (1)
A B
1 Data1 Data2
2 3 9
3 2 7
4 4 12
5 5 15
6 6 17
7 Formula Description (Result)
8 =CORREL(A2:A6,:B2:B6) Correlation coefficient of the two data sets above (0.997054)
Using data sets A and B in conjunction with Equation (1), we obtain:
( )

114
The result from Equation (1) is a coefficient representing the degree to which there
is a relationship between the data in column A and the data in column B. The closer to 1 the
coefficient is, the stronger the relationship. The closer to 0 the coefficient, the weaker the
relationship. Moreover, the closer to -1 the coefficient is, the stronger the inverse
relationship.
In the above example, data sets A and B are strongly related. The correlation
coefficient computed via Equation (1) makes this relationship evident: all values of data set
B are approximately three times that of data set A.
The following correlation matrix was our basis for our results pertaining to the
public’s general knowledge and awareness of energy efficiency.

115
Surv
ey ID
Age
Inco
me
Sex
Size
Vis
ual
Ener
gy
Co
st o
f u
se
Pri
ce
Life
tim
e
Bra
nd
Imp
ort
ance
of
Ener
gy E
ffic
ien
cy
Hav
e yo
u s
een
lab
els
?
Use
ful i
nfo
?
Infl
uen
ced
?
In s
tore
, no
rep
Sto
re, r
ep
Inte
rnet
Frie
nd
s, f
amily
Pay
mo
re if
rec
ycle
d?
Kn
ow
can
ret
urn
?
Hav
e yo
u s
een
th
ese?
Seen
EU
Seen
En
ergy
gu
ide
Seen
En
ergy
Sta
r
Wh
ich
fir
st?
Pre
ttie
st?
Info
v. D
esig
n
Mo
st In
form
ativ
e?
Mo
st U
nd
erst
and
able
?
Wh
ich
is t
he
mo
st e
ne
rgy
Effc
ien
t?
Wh
ich
wo
uld
yo
u b
uy?
Wh
ich
typ
e d
o y
ou
pre
fer?
A -
Fri
dge
Fea
ture
s
B -
Fri
dge
mo
del
, sp
ecs
C -
Co
st p
er y
ear
D -
Ran
ge o
f si
mila
r m
od
els
E -
Ener
gy u
sage
per
yea
r
F -
Ener
gy S
tar
Cer
tifi
cati
on
A -
Gra
din
g ra
nge
B -
Gra
de
rati
ng
C -
En
ergy
usa
ge p
er y
ear
D -
Fri
dge
cap
acit
y
E -
Free
zer
cap
acit
y
F -
No
ise
Are
yo
u m
ore
like
ly t
o b
uy
w/
E St
ar?
Hav
e yo
u s
een
ICE
lab
el?
Loca
tio
n
Sale
s R
epre
sen
tati
ve?
Survey ID 1,00 -0,05 0,11 0,09 0,24 0,20 0,18 0,34 0,00 0,15 0,34 0,11 -0,15 0,06 0,14 -0,03 -0,02 -0,20 0,20 0,13 0,09 -0,13 0,01 -0,31 -0,05 -0,11 -0,19 -0,16 0,10 0,09 0,05 -0,06 -0,06 0,11 0,25 0,08 0,14 -0,13 0,05 -0,05 0,11 0,11 0,13 0,14 0,05 -0,05 0,11 0,90 0,46
Age -0,05 1,00 0,29 -0,02 -0,04 -0,02 0,00 0,04 -0,03 0,14 -0,07 0,06 -0,02 -0,01 0,06 -0,20 0,01 0,08 0,08 0,01 0,09 0,01 -0,10 -0,09 0,26 -0,25 -0,17 0,02 -0,02 -0,08 -0,08 -0,05 -0,12 -0,25 -0,26 -0,14 -0,14 -0,10 -0,18 -0,13 -0,05 -0,05 0,10 -0,04 -0,17 -0,05 0,02 0,01 -0,10
Income 0,11 0,29 1,00 -0,04 0,03 0,03 0,08 0,21 0,06 0,20 -0,05 -0,03 -0,04 0,08 0,15 0,01 0,13 -0,16 0,03 -0,08 0,01 -0,13 -0,10 -0,14 0,02 -0,16 -0,06 0,06 0,00 -0,13 -0,10 -0,13 -0,16 -0,04 0,03 -0,03 0,13 0,03 0,12 -0,08 0,04 0,05 0,20 0,10 -0,02 -0,08 0,02 0,13 -0,02
Sex 0,09 -0,02 -0,04 1,00 0,13 0,28 0,11 0,12 0,00 -0,10 0,18 -0,12 0,06 -0,03 -0,05 -0,07 0,02 -0,06 0,01 0,04 0,06 0,15 0,10 0,10 0,04 0,04 -0,05 -0,04 -0,04 -0,03 -0,08 -0,02 -0,07 0,07 0,01 -0,04 0,14 0,00 -0,03 0,10 0,07 0,07 -0,02 0,01 0,05 0,16 0,01 0,04 -0,01
Size 0,24 -0,04 0,03 0,13 1,00 0,45 0,19 0,30 0,03 0,02 0,09 -0,01 -0,06 0,14 0,19 -0,11 -0,14 -0,17 0,08 0,04 -0,07 -0,05 0,01 -0,02 -0,08 -0,02 0,02 0,04 -0,02 0,11 0,06 -0,10 -0,07 0,05 0,17 0,01 0,22 -0,01 0,18 0,04 0,09 0,05 0,13 0,05 0,10 -0,07 -0,09 0,19 0,10
Visual 0,20 -0,02 0,03 0,28 0,45 1,00 0,14 0,30 0,11 0,03 0,24 -0,04 -0,01 -0,02 -0,02 0,03 -0,20 -0,31 0,06 -0,02 -0,11 -0,06 -0,07 -0,08 -0,03 -0,01 0,07 -0,12 -0,09 0,04 -0,12 -0,02 -0,07 0,09 0,14 0,09 0,19 0,02 0,16 0,04 0,11 0,15 0,16 0,14 0,19 -0,06 -0,04 0,12 -0,02
Energy 0,18 0,00 0,08 0,11 0,19 0,14 1,00 0,47 0,02 0,26 0,04 0,20 0,07 -0,03 0,05 -0,01 -0,08 -0,06 -0,08 0,08 -0,04 -0,02 0,03 -0,12 0,12 -0,01 0,09 0,18 0,09 -0,05 0,03 -0,01 -0,06 0,03 0,14 -0,02 0,17 0,10 0,20 0,10 0,03 0,00 0,08 0,09 0,13 0,00 0,04 0,13 -0,04
Cost of use 0,34 0,04 0,21 0,12 0,30 0,30 0,47 1,00 0,07 0,29 0,22 0,15 -0,12 0,12 0,15 -0,05 -0,05 -0,14 0,05 0,11 0,03 -0,21 -0,10 -0,28 -0,04 0,04 0,01 0,06 -0,01 -0,03 -0,07 0,03 -0,08 0,15 0,22 -0,02 0,32 0,10 0,30 0,14 0,22 0,11 0,25 0,23 0,26 -0,05 0,05 0,28 0,12
Price 0,00 -0,03 0,06 0,00 0,03 0,11 0,02 0,07 1,00 0,13 0,17 -0,06 0,08 -0,11 -0,05 0,13 -0,05 -0,28 -0,13 -0,10 -0,02 -0,14 -0,04 -0,12 -0,10 -0,02 0,01 0,03 -0,12 0,01 -0,10 0,04 -0,02 0,15 0,17 0,23 0,05 -0,06 0,09 -0,03 0,09 0,05 0,00 -0,06 0,00 -0,16 -0,21 -0,06 -0,07
Lifetime 0,15 0,14 0,20 -0,10 0,02 0,03 0,26 0,29 0,13 1,00 0,23 0,09 -0,13 0,15 0,21 -0,09 0,02 0,02 -0,10 0,11 -0,01 -0,20 0,01 -0,21 -0,13 -0,13 -0,05 0,08 0,09 -0,05 -0,02 0,03 0,01 0,05 0,13 0,01 0,12 0,04 0,10 0,13 0,08 -0,19 0,12 0,06 0,17 -0,15 -0,01 0,11 0,01
Brand 0,34 -0,07 -0,05 0,18 0,09 0,24 0,04 0,22 0,17 0,23 1,00 -0,02 -0,10 0,05 0,06 0,05 -0,18 -0,06 0,08 0,03 0,11 -0,14 -0,10 -0,21 -0,15 0,03 0,07 -0,08 0,14 -0,04 0,08 0,11 0,05 0,10 0,26 0,03 0,10 -0,12 0,04 -0,03 0,04 -0,01 0,09 0,07 0,13 0,00 -0,01 0,24 0,21
Importance of Energy Efficiency 0,11 0,06 -0,03 -0,12 -0,01 -0,04 0,20 0,15 -0,06 0,09 -0,02 1,00 0,04 -0,02 -0,02 -0,05 -0,03 -0,13 0,03 0,11 0,03 -0,13 0,04 -0,07 -0,04 0,04 0,12 -0,04 0,05 -0,06 -0,06 0,10 0,13 0,07 0,04 -0,05 0,08 0,00 -0,12 0,06 -0,03 0,01 -0,07 -0,02 0,03 -0,01 0,04 0,13 0,11
Have you seen labels? -0,15 -0,02 -0,04 0,06 -0,06 -0,01 0,07 -0,12 0,08 -0,13 -0,10 0,04 1,00 -0,71 -0,72 -0,05 0,04 0,10 -0,04 0,08 0,00 0,39 0,15 0,28 0,27 0,06 0,23 0,29 0,06 0,09 0,04 0,12 0,19 -0,16 0,00 0,01 0,02 0,10 0,08 -0,02 0,06 0,12 -0,10 -0,10 -0,04 -0,06 -0,09 -0,19 -0,17
Useful info? 0,06 -0,01 0,08 -0,03 0,14 -0,02 -0,03 0,12 -0,11 0,15 0,05 -0,02 -0,71 1,00 0,75 0,05 0,01 -0,06 0,04 -0,07 -0,02 -0,27 0,00 -0,20 -0,19 0,03 -0,11 -0,16 -0,02 0,02 -0,10 -0,07 -0,07 0,02 -0,12 -0,06 0,03 0,01 0,01 0,07 0,06 -0,06 0,09 0,12 0,18 0,13 0,12 0,09 0,08
Influenced? 0,14 0,06 0,15 -0,05 0,19 -0,02 0,05 0,15 -0,05 0,21 0,06 -0,02 -0,72 0,75 1,00 0,10 -0,06 -0,08 -0,04 0,01 -0,02 -0,26 -0,03 -0,19 -0,16 -0,05 -0,16 -0,14 0,01 -0,05 -0,07 -0,19 -0,09 0,15 0,02 0,04 0,02 -0,09 -0,06 0,04 -0,03 -0,07 0,07 0,06 0,06 0,11 0,07 0,18 0,13
In store, no rep -0,03 -0,20 0,01 -0,07 -0,11 0,03 -0,01 -0,05 0,13 -0,09 0,05 -0,05 -0,05 0,05 0,10 1,00 -0,26 0,03 -0,07 -0,02 -0,01 -0,02 0,09 -0,12 -0,08 0,23 0,15 -0,09 0,06 0,03 0,15 0,02 0,09 0,05 0,03 0,06 -0,06 0,03 0,04 -0,05 -0,08 0,04 -0,04 0,00 0,05 0,14 0,14 -0,07 0,13
Store, rep -0,02 0,01 0,13 0,02 -0,14 -0,20 -0,08 -0,05 -0,05 0,02 -0,18 -0,03 0,04 0,01 -0,06 -0,26 1,00 -0,19 -0,21 -0,07 -0,02 0,04 -0,02 0,11 0,01 -0,04 -0,07 0,06 -0,07 -0,03 -0,09 -0,07 -0,06 -0,11 -0,10 -0,06 -0,03 0,04 -0,04 -0,09 0,03 0,01 0,02 0,03 0,05 -0,10 0,05 -0,07 -0,09
Internet -0,20 0,08 -0,16 -0,06 -0,17 -0,31 -0,06 -0,14 -0,28 0,02 -0,06 -0,13 0,10 -0,06 -0,08 0,03 -0,19 1,00 0,01 0,17 0,11 0,11 -0,06 0,12 0,22 0,00 -0,10 0,10 0,21 0,04 0,13 0,11 0,08 -0,10 -0,15 -0,11 -0,17 0,05 -0,04 -0,02 -0,06 -0,13 -0,19 -0,13 -0,16 0,26 -0,02 -0,17 -0,02
Friends, family 0,20 0,08 0,03 0,01 0,08 0,06 -0,08 0,05 -0,13 -0,10 0,08 0,03 -0,04 0,04 -0,04 -0,07 -0,21 0,01 1,00 -0,01 -0,09 -0,09 0,03 -0,07 -0,02 -0,11 -0,28 0,02 0,02 0,11 -0,02 -0,21 -0,12 0,02 0,10 0,03 0,13 -0,01 0,00 -0,11 -0,09 0,08 0,05 0,06 0,14 -0,07 0,09 0,24 -0,01
Pay more if recycled? 0,13 0,01 -0,08 0,04 0,04 -0,02 0,08 0,11 -0,10 0,11 0,03 0,11 0,08 -0,07 0,01 -0,02 -0,07 0,17 -0,01 1,00 0,18 0,01 0,10 -0,05 -0,15 -0,04 -0,09 0,14 0,13 0,08 -0,01 0,06 0,02 0,09 0,11 -0,08 0,00 -0,05 -0,02 0,14 0,05 -0,03 0,05 0,04 0,09 0,02 0,12 0,12 -0,01
Know can return? 0,09 0,09 0,01 0,06 -0,07 -0,11 -0,04 0,03 -0,02 -0,01 0,11 0,03 0,00 -0,02 -0,02 -0,01 -0,02 0,11 -0,09 0,18 1,00 0,04 0,09 -0,03 0,02 -0,04 -0,07 0,06 0,08 -0,05 -0,01 0,09 0,05 0,05 0,19 -0,18 -0,04 -0,09 0,14 -0,08 0,09 0,02 0,00 -0,01 -0,05 0,01 0,03 0,11 0,11
Have you seen these? -0,13 0,01 -0,13 0,15 -0,05 -0,06 -0,02 -0,21 -0,14 -0,20 -0,14 -0,13 0,39 -0,27 -0,26 -0,02 0,04 0,11 -0,09 0,01 0,04 1,00 0,25 0,56 0,63 -0,18 0,03 0,03 -0,03 0,06 0,00 -0,01 0,01 -0,21 -0,15 0,02 -0,06 -0,02 -0,05 -0,05 -0,06 0,12 -0,31 -0,16 -0,17 0,12 -0,07 -0,16 -0,18
Seen EU 0,01 -0,10 -0,10 0,10 0,01 -0,07 0,03 -0,10 -0,04 0,01 -0,10 0,04 0,15 0,00 -0,03 0,09 -0,02 -0,06 0,03 0,10 0,09 0,25 1,00 0,16 -0,05 0,13 0,08 0,11 0,09 0,14 0,11 0,07 0,16 -0,12 -0,03 -0,05 -0,07 0,11 -0,05 0,06 -0,12 0,04 -0,30 -0,25 -0,14 0,01 0,08 0,02 -0,16
Seen Energy guide -0,31 -0,09 -0,14 0,10 -0,02 -0,08 -0,12 -0,28 -0,12 -0,21 -0,21 -0,07 0,28 -0,20 -0,19 -0,12 0,11 0,12 -0,07 -0,05 -0,03 0,56 0,16 1,00 0,20 -0,02 -0,04 0,09 0,00 0,06 -0,15 -0,10 0,01 -0,11 -0,18 0,03 -0,09 0,08 -0,08 -0,03 -0,09 0,12 -0,19 -0,15 -0,06 0,05 0,06 -0,32 -0,28
Seen Energy Star -0,05 0,26 0,02 0,04 -0,08 -0,03 0,12 -0,04 -0,10 -0,13 -0,15 -0,04 0,27 -0,19 -0,16 -0,08 0,01 0,22 -0,02 -0,15 0,02 0,63 -0,05 0,20 1,00 -0,34 -0,10 -0,08 -0,08 -0,08 -0,02 -0,05 -0,11 -0,26 -0,19 -0,05 -0,10 -0,11 -0,11 -0,20 -0,13 0,11 -0,26 -0,13 -0,21 0,14 -0,11 -0,04 -0,15
Which first? -0,11 -0,25 -0,16 0,04 -0,02 -0,01 -0,01 0,04 -0,02 -0,13 0,03 0,04 0,06 0,03 -0,05 0,23 -0,04 0,00 -0,11 -0,04 -0,04 -0,18 0,13 -0,02 -0,34 1,00 0,53 0,11 0,14 0,17 0,11 0,26 0,45 0,11 0,07 0,08 0,07 -0,02 -0,02 0,20 0,16 0,20 0,08 0,09 0,18 0,09 0,04 -0,14 0,03
Prettiest? -0,19 -0,17 -0,06 -0,05 0,02 0,07 0,09 0,01 0,01 -0,05 0,07 0,12 0,23 -0,11 -0,16 0,15 -0,07 -0,10 -0,28 -0,09 -0,07 0,03 0,08 -0,04 -0,10 0,53 1,00 0,28 0,17 0,09 0,14 0,36 0,47 -0,09 0,02 -0,07 0,05 -0,03 0,01 0,05 0,12 0,07 0,03 -0,10 0,04 -0,01 -0,08 -0,19 -0,07
Info v. Design -0,16 0,02 0,06 -0,04 0,04 -0,12 0,18 0,06 0,03 0,08 -0,08 -0,04 0,29 -0,16 -0,14 -0,09 0,06 0,10 0,02 0,14 0,06 0,03 0,11 0,09 -0,08 0,11 0,28 1,00 -0,04 0,08 -0,16 -0,02 0,07 0,01 0,22 -0,08 0,05 0,07 0,20 -0,01 -0,01 -0,11 0,02 -0,13 0,00 -0,14 -0,01 -0,12 -0,24
Most Informative? 0,10 -0,02 0,00 -0,04 -0,02 -0,09 0,09 -0,01 -0,12 0,09 0,14 0,05 0,06 -0,02 0,01 0,06 -0,07 0,21 0,02 0,13 0,08 -0,03 0,09 0,00 -0,08 0,14 0,17 -0,04 1,00 0,38 0,37 0,33 0,45 -0,03 0,13 -0,02 0,07 0,04 0,06 -0,02 -0,02 -0,04 0,03 0,00 0,00 0,04 0,15 0,10 0,13
Most Understandable? 0,09 -0,08 -0,13 -0,03 0,11 0,04 -0,05 -0,03 0,01 -0,05 -0,04 -0,06 0,09 0,02 -0,05 0,03 -0,03 0,04 0,11 0,08 -0,05 0,06 0,14 0,06 -0,08 0,17 0,09 0,08 0,38 1,00 0,11 0,25 0,25 0,12 0,13 0,08 0,14 0,14 0,14 0,08 0,07 0,15 0,09 0,04 0,01 0,03 0,15 0,05 0,09
Which is the most energy Efficient? 0,05 -0,08 -0,10 -0,08 0,06 -0,12 0,03 -0,07 -0,10 -0,02 0,08 -0,06 0,04 -0,10 -0,07 0,15 -0,09 0,13 -0,02 -0,01 -0,01 0,00 0,11 -0,15 -0,02 0,11 0,14 -0,16 0,37 0,11 1,00 0,27 0,23 -0,03 0,01 0,06 0,05 -0,02 0,03 -0,11 0,00 -0,22 -0,12 -0,08 -0,14 -0,03 0,01 0,05 0,18
Which would you buy? -0,06 -0,05 -0,13 -0,02 -0,10 -0,02 -0,01 0,03 0,04 0,03 0,11 0,10 0,12 -0,07 -0,19 0,02 -0,07 0,11 -0,21 0,06 0,09 -0,01 0,07 -0,10 -0,05 0,26 0,36 -0,02 0,33 0,25 0,27 1,00 0,65 0,05 -0,02 -0,04 0,14 -0,07 -0,02 0,05 0,14 -0,06 -0,01 -0,04 -0,08 -0,10 -0,05 -0,11 0,07
Which type do you prefer? -0,06 -0,12 -0,16 -0,07 -0,07 -0,07 -0,06 -0,08 -0,02 0,01 0,05 0,13 0,19 -0,07 -0,09 0,09 -0,06 0,08 -0,12 0,02 0,05 0,01 0,16 0,01 -0,11 0,45 0,47 0,07 0,45 0,25 0,23 0,65 1,00 0,02 -0,05 -0,02 0,11 -0,12 -0,07 0,03 0,01 -0,01 -0,05 -0,04 -0,01 -0,05 0,04 -0,07 0,03
A - Fridge Features 0,11 -0,25 -0,04 0,07 0,05 0,09 0,03 0,15 0,15 0,05 0,10 0,07 -0,16 0,02 0,15 0,05 -0,11 -0,10 0,02 0,09 0,05 -0,21 -0,12 -0,11 -0,26 0,11 -0,09 0,01 -0,03 0,12 -0,03 0,05 0,02 1,00 0,53 0,09 0,35 -0,15 0,30 0,32 0,23 0,11 0,33 0,33 0,26 -0,18 -0,16 0,07 0,27
B - Fridge model, specs 0,25 -0,26 0,03 0,01 0,17 0,14 0,14 0,22 0,17 0,13 0,26 0,04 0,00 -0,12 0,02 0,03 -0,10 -0,15 0,10 0,11 0,19 -0,15 -0,03 -0,18 -0,19 0,07 0,02 0,22 0,13 0,13 0,01 -0,02 -0,05 0,53 1,00 0,08 0,39 0,01 0,42 0,20 0,22 0,09 0,29 0,21 0,24 -0,08 -0,15 0,22 0,19
C - Cost per year 0,08 -0,14 -0,03 -0,04 0,01 0,09 -0,02 -0,02 0,23 0,01 0,03 -0,05 0,01 -0,06 0,04 0,06 -0,06 -0,11 0,03 -0,08 -0,18 0,02 -0,05 0,03 -0,05 0,08 -0,07 -0,08 -0,02 0,08 0,06 -0,04 -0,02 0,09 0,08 1,00 0,23 0,14 -0,01 0,10 0,02 0,14 0,04 0,05 0,08 -0,05 0,00 0,02 0,02
D - Range of similar models 0,14 -0,14 0,13 0,14 0,22 0,19 0,17 0,32 0,05 0,12 0,10 0,08 0,02 0,03 0,02 -0,06 -0,03 -0,17 0,13 0,00 -0,04 -0,06 -0,07 -0,09 -0,10 0,07 0,05 0,05 0,07 0,14 0,05 0,14 0,11 0,35 0,39 0,23 1,00 0,15 0,44 0,30 0,32 0,28 0,34 0,33 0,35 -0,19 -0,07 0,11 0,22
E - Energy usage per year -0,13 -0,10 0,03 0,00 -0,01 0,02 0,10 0,10 -0,06 0,04 -0,12 0,00 0,10 0,01 -0,09 0,03 0,04 0,05 -0,01 -0,05 -0,09 -0,02 0,11 0,08 -0,11 -0,02 -0,03 0,07 0,04 0,14 -0,02 -0,07 -0,12 -0,15 0,01 0,14 0,15 1,00 0,27 -0,02 0,03 0,20 0,05 0,07 0,13 0,02 0,08 -0,12 -0,09
F - Energy Star Certification 0,05 -0,18 0,12 -0,03 0,18 0,16 0,20 0,30 0,09 0,10 0,04 -0,12 0,08 0,01 -0,06 0,04 -0,04 -0,04 0,00 -0,02 0,14 -0,05 -0,05 -0,08 -0,11 -0,02 0,01 0,20 0,06 0,14 0,03 -0,02 -0,07 0,30 0,42 -0,01 0,44 0,27 1,00 0,25 0,35 0,08 0,39 0,36 0,45 -0,04 0,00 0,04 0,03
A - Grading range -0,05 -0,13 -0,08 0,10 0,04 0,04 0,10 0,14 -0,03 0,13 -0,03 0,06 -0,02 0,07 0,04 -0,05 -0,09 -0,02 -0,11 0,14 -0,08 -0,05 0,06 -0,03 -0,20 0,20 0,05 -0,01 -0,02 0,08 -0,11 0,05 0,03 0,32 0,20 0,10 0,30 -0,02 0,25 1,00 0,52 0,19 0,32 0,35 0,40 0,15 -0,13 -0,09 0,06
B - Grade rating 0,11 -0,05 0,04 0,07 0,09 0,11 0,03 0,22 0,09 0,08 0,04 -0,03 0,06 0,06 -0,03 -0,08 0,03 -0,06 -0,09 0,05 0,09 -0,06 -0,12 -0,09 -0,13 0,16 0,12 -0,01 -0,02 0,07 0,00 0,14 0,01 0,23 0,22 0,02 0,32 0,03 0,35 0,52 1,00 0,39 0,38 0,38 0,46 0,10 -0,17 0,10 0,25
C - Energy usage per year 0,11 -0,05 0,05 0,07 0,05 0,15 0,00 0,11 0,05 -0,19 -0,01 0,01 0,12 -0,06 -0,07 0,04 0,01 -0,13 0,08 -0,03 0,02 0,12 0,04 0,12 0,11 0,20 0,07 -0,11 -0,04 0,15 -0,22 -0,06 -0,01 0,11 0,09 0,14 0,28 0,20 0,08 0,19 0,39 1,00 0,23 0,30 0,24 0,00 0,01 0,05 0,08
D - Fridge capacity 0,13 0,10 0,20 -0,02 0,13 0,16 0,08 0,25 0,00 0,12 0,09 -0,07 -0,10 0,09 0,07 -0,04 0,02 -0,19 0,05 0,05 0,00 -0,31 -0,30 -0,19 -0,26 0,08 0,03 0,02 0,03 0,09 -0,12 -0,01 -0,05 0,33 0,29 0,04 0,34 0,05 0,39 0,32 0,38 0,23 1,00 0,61 0,57 -0,11 -0,05 0,10 0,15
E - Freezer capacity 0,14 -0,04 0,10 0,01 0,05 0,14 0,09 0,23 -0,06 0,06 0,07 -0,02 -0,10 0,12 0,06 0,00 0,03 -0,13 0,06 0,04 -0,01 -0,16 -0,25 -0,15 -0,13 0,09 -0,10 -0,13 0,00 0,04 -0,08 -0,04 -0,04 0,33 0,21 0,05 0,33 0,07 0,36 0,35 0,38 0,30 0,61 1,00 0,61 -0,04 -0,11 0,13 0,15
F – Noise 0,05 -0,17 -0,02 0,05 0,10 0,19 0,13 0,26 0,00 0,17 0,13 0,03 -0,04 0,18 0,06 0,05 0,05 -0,16 0,14 0,09 -0,05 -0,17 -0,14 -0,06 -0,21 0,18 0,04 0,00 0,00 0,01 -0,14 -0,08 -0,01 0,26 0,24 0,08 0,35 0,13 0,45 0,40 0,46 0,24 0,57 0,61 1,00 0,07 -0,03 0,02 0,10
Are you more likely to buy w/ E Star? -0,05 -0,05 -0,08 0,16 -0,07 -0,06 0,00 -0,05 -0,16 -0,15 0,00 -0,01 -0,06 0,13 0,11 0,14 -0,10 0,26 -0,07 0,02 0,01 0,12 0,01 0,05 0,14 0,09 -0,01 -0,14 0,04 0,03 -0,03 -0,10 -0,05 -0,18 -0,08 -0,05 -0,19 0,02 -0,04 0,15 0,10 0,00 -0,11 -0,04 0,07 1,00 0,09 -0,04 -0,08
Have you seen ICE label? 0,11 0,02 0,02 0,01 -0,09 -0,04 0,04 0,05 -0,21 -0,01 -0,01 0,04 -0,09 0,12 0,07 0,14 0,05 -0,02 0,09 0,12 0,03 -0,07 0,08 0,06 -0,11 0,04 -0,08 -0,01 0,15 0,15 0,01 -0,05 0,04 -0,16 -0,15 0,00 -0,07 0,08 0,00 -0,13 -0,17 0,01 -0,05 -0,11 -0,03 0,09 1,00 0,12 -0,02
Location 0,90 0,01 0,13 0,04 0,19 0,12 0,13 0,28 -0,06 0,11 0,24 0,13 -0,19 0,09 0,18 -0,07 -0,07 -0,17 0,24 0,12 0,11 -0,16 0,02 -0,32 -0,04 -0,14 -0,19 -0,12 0,10 0,05 0,05 -0,11 -0,07 0,07 0,22 0,02 0,11 -0,12 0,04 -0,09 0,10 0,05 0,10 0,13 0,02 -0,04 0,12 1,00 0,49
Sales Representative? 0,46 -0,10 -0,02 -0,01 0,10 -0,02 -0,04 0,12 -0,07 0,01 0,21 0,11 -0,17 0,08 0,13 0,13 -0,09 -0,02 -0,01 -0,01 0,11 -0,18 -0,16 -0,28 -0,15 0,03 -0,07 -0,24 0,13 0,09 0,18 0,07 0,03 0,27 0,19 0,02 0,22 -0,09 0,03 0,06 0,25 0,08 0,15 0,15 0,10 -0,08 -0,02 0,49 1,00
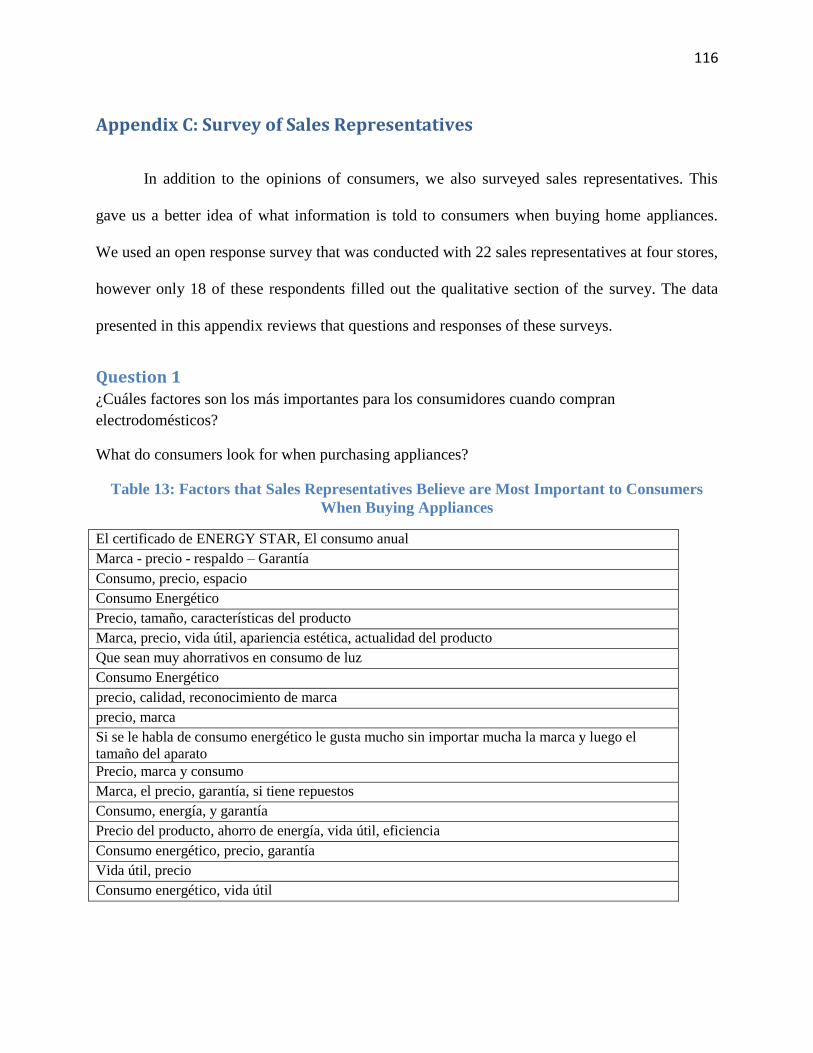
116
Appendix C: Survey of Sales Representatives
In addition to the opinions of consumers, we also surveyed sales representatives. This
gave us a better idea of what information is told to consumers when buying home appliances.
We used an open response survey that was conducted with 22 sales representatives at four stores,
however only 18 of these respondents filled out the qualitative section of the survey. The data
presented in this appendix reviews that questions and responses of these surveys.
Question 1 ¿Cuáles factores son los más importantes para los consumidores cuando compran
electrodomésticos?
What do consumers look for when purchasing appliances?
Table 13: Factors that Sales Representatives Believe are Most Important to Consumers
When Buying Appliances
El certificado de ENERGY STAR, El consumo anual
Marca - precio - respaldo – Garantía
Consumo, precio, espacio
Consumo Energético
Precio, tamaño, características del producto
Marca, precio, vida útil, apariencia estética, actualidad del producto
Que sean muy ahorrativos en consumo de luz
Consumo Energético
precio, calidad, reconocimiento de marca
precio, marca
Si se le habla de consumo energético le gusta mucho sin importar mucha la marca y luego el
tamaño del aparato
Precio, marca y consumo
Marca, el precio, garantía, si tiene repuestos
Consumo, energía, y garantía
Precio del producto, ahorro de energía, vida útil, eficiencia
Consumo energético, precio, garantía
Vida útil, precio
Consumo energético, vida útil

117
Table 14: Word Count for Responses for Factors that Sales Representatives Believe are
Most Important to Consumers When Buying Appliances
Word # of uses Word # of uses
precio 11 útil 4
consumo 10 el 4
marca 7 y 3
de 5 producto 3
energético 5 energía 3
vida 4 le 2
garantía 4 si 2
del 4 tamaño 2
Question 2
¿Cuáles aspectos de los electrodomésticos usa usted para persuadir a los consumidores a
comprarlos?
What aspects of the appliances do you use to persuade consumers to purchase appliances?
Table 15: Feature of Products That Sales Representatives Use to Persuade Consumers to
Buy New Appliances
Precio incluyendo las ventajas o beneficios y el ahorro
Los beneficios que le aporta el electrodoméstico
Consumo, precio, espacio y calidades
Ahorro de energía
la calidad del mismo, marca y garantía
Beneficios del producto
Que tiene el sistema de ENERGY STAR
ahorro de la energía
marca, precio
marca, lo resistible, lo duradero
Ahora se puede convencer más por el consumo energético y luego por alguno plus de acuerdo a
las marcas
características propias del producto más calidades del mismo
marca, precio, garantía
Consumo y garantía
Precio y calidad de producto
Consumo energético, precio, garantía
Beneficios, garantía
Garantía, vida útil, consumo energético

118
Table 16: Word Count for the Responses of Feature of Products That Sales
Representatives Use to Persuade Consumers to Buy New Appliances
Word # of uses Word # of uses
precio 13 producto 4
consumo 12 útil 4
y 9 la 3
garantía 9 le 3
marca 9 que 3
de 9 lo 2
energético 7 tiene 2
del 6 por 2
el 6 se 2
calidad 5 luego 2
energía 4 más 2
vida 4 si 2
beneficios 4 mismo 2
ahorro 4 las 2
Question 3
¿Qué tan importante es la eficiencia energética para los consumidores en una escala de 1a 5? 1 es
el más importante y 5 es el menos importante.
Encierre sólo uno: 1 2 3 4 5
How important is energy efficiency to the consumer on a scale of 1 to 5? 1 is most important and
5 is least important.
Circular one: 1 2 3 4 5
Table 17: Statistical Averages for the Importance of Energy Efficiency to Consumers,
According to Sales Representative
Mean Median Mode Standard Deviation
1,833333 1,5 1 0,957427

119
Figure 59: Distribution of the Important of Energy Efficiency to Consumers on a Scale of 1
to 5, According to Sales Representative. 1 is the Most Important
Question 4
¿Usa la eficiencia energética para persuadir a los consumidores al momento de comprar
electrodomésticos específicos? SÍ o NO
a. Si contestó sí ¿cuál información usa para persuadir a los consumidores a comprar
electrodomésticos eficientes?
Do you use energy efficiency to persuade consumers to purchase specific home appliances?
a. If yes, what information do you use to persuade consumers to buy specific
appliances?
0
2
4
6
8
10
1 2 3 4 5
Nu
mb
er
of
resp
on
ses
Importance rating

120
Figure 60: Distribution of Sales Representatives that Use Energy Efficiency to Persuade
Consumers to Buy New Appliances
Table 18: Information that Sales representatives Use to Market Efficient Products
Sí, En que aunque el producto sea de mayor costo se ahorra un % del consumo energético ya que es lo más caro ahora
Sí, Comparación de los datos de consumo eléctrico
Sí, Su consumo va a ser más barato
Sí, Con menos consumo menos paga electricidad
No
Sí, ahorro monetario contra costo, desempeño y eficiencia del producto
Sí, el consumo de luz, la vida útil, y la marca
Sí, el sello de ENERGY STAR
Sí, que consume muy poca energía aparte que tiene un precio muy cómodo y que es muy bueno en vida útil.
Sí, por su utilidad, satisfacción al cliente
Sí, le hago la comparación entre marcas y en capacidades
Sí, consumo anual marcado en la etiqueta amarilla
No
Sí, consumo anual
Sí, certificado ENERGY STAR y consumo anual
Sí, informarlos sobre el consumo energético y el ahorro que pueden tener por año
Sí, el ahorro de energía al usarlos
Sí, kWh por año, comparativo energético con otras marcas
89%
11%
Yes
No

121
Table 19: Word Count for Responses to Information that Sales representatives Use to
Market Efficient Products
Word # of uses Word # of uses
consumo 10 su 2
y 6 útil 2
de 6 vida 2
que 6 comparación 2
el 6 costo 2
la 4 al 2
en 4 con 2
ahorro 4 del 2
energía 4 más 2
anual 3 año 2
por 3 star 2
muy 3 un 2
energético 3 marcas 2
producto 2 menos 2
Question 5
En su opinión, ¿sería útil para los consumidores una etiqueta normalizada de eficiencia
energética? SÍ o NO
In your opinion, would a standardized energy efficiency label be useful to consumers?
Figure 61: Distribution of Sales Representatives that Think a Normalized Energy
Efficiency Label Would be Useful to Consumers
94%
6%
Yes
No

122
Question 6
¿Cuál información en una etiqueta atraería a los consumidores al momento de comprar
electrodomésticos eficientes?
What information of the label would attract consumers when purchasing appliances?
Table 20: Information of Labels that Will Persuade Consumers to Purchase Effciecnt
Appliances, According to Sales Representatives
Cuanto consume si tiene luz LED, si tiene discos expandibles
Mostrar el ahorro en colones
La cual muestra el bajo consumo y el costo
que es el consumo anual o mensual
Consumo mensual por uso de 24 horas
Consumo bajo, ahorro monetario, marca de elite (conocida y alta calidad demostrada)
la amarilla que es la más informativa
ahorro de energía
lo primero que les van a durar y van a ahorrar en no estar cambiandolos tan seguido
que traen más información, son más útiles a la hora de que una persona entre a una tienda, trae satisfacción al cliente
El consumo mensual ya que por año las personas no entiende y también no siempre saben a cuanto equivale en dinero
Consumo eléctrico y gasto monetario
precio en colones de consumo por día
Calculo anual de consumo en colones
Consumo anual
Información de consumo
Cuanto ahorra a la un año en total del uso en comparación a otro artículo
Uso electricidad anual, corto operación anual

123
Table 21: Word Count in Response to the Information of Labels that Will Persuade
Consumers to Purchase Effciecnt Appliances, According to Sales Representatives
Word # of uses Word # of uses
consumo 10 más 3
en 7 ahorro 3
de 7 mensual 3
que 6 información 2
y 5 tiene 2
la 5 monetario 2
anual 5 año 2
el 5 una 2
uso 3 si 2
cuanto 3 bajo 2
colon 3 l 2
por 3 van 2
Question 7
En su opinión, ¿sería útil promocionar un producto utilizando una etiqueta estándar de eficiencia
energética? Encierre uno: SÍ o NO
In your opinion, would a standardized energy efficiency label be useful to promote a product?
Figure 62: Distribution of Sales Representatives that Think an Energy Efficiency Label
Would be Useful to Promote Products?
83%
17%
Yes No

124
Question 8
¿Qué información sería útil implementar en la etiqueta estandarizada de eficiencia energética
para anunciar el producto?
What information would be useful to show on a standard energy efficiency label to promote a
product?
Table 22: Sales Representative Responses of Information Which Would be Useful on an
Energy Label
el consumo es lo más importante como el voltaje
Capacidad - consumo máximo y mínimo porcentaje de ahorro
Costo y cantidad kWh por año
Consumos y ahorro
El porcentaje de ahorro mensual
Beneficios para uso personal y/o familiar
el consumo de kWh por año
cuanto consume por año
dibujos ya que muchas veces se comprende mejor con ejemplos ilustrativos y más clara la información
El consumo por mes, el costo en dinero promedio y comparación con otras marcas
Consumo en dinero por año kilovatio
Precio en colones de consumo por día
Consumo disminuido
Sencillo visualmente, reales de consumo anual
Consumo, modelo
Consumo anual y ahorro de este
Uso electricidad anual, información de forma atractiva y llamativa
Table 23: Word Count in Response to Information Which Would be Useful on an Energy
Label
Word # of uses Word # of uses
consumo 10 en 3
y 7 uso 2
de 7 costo 2
por 6 información 2
el 6 con 2
año 4 dinero 2
ahorro 4 porcentaje 2
anual 3 kwh 2
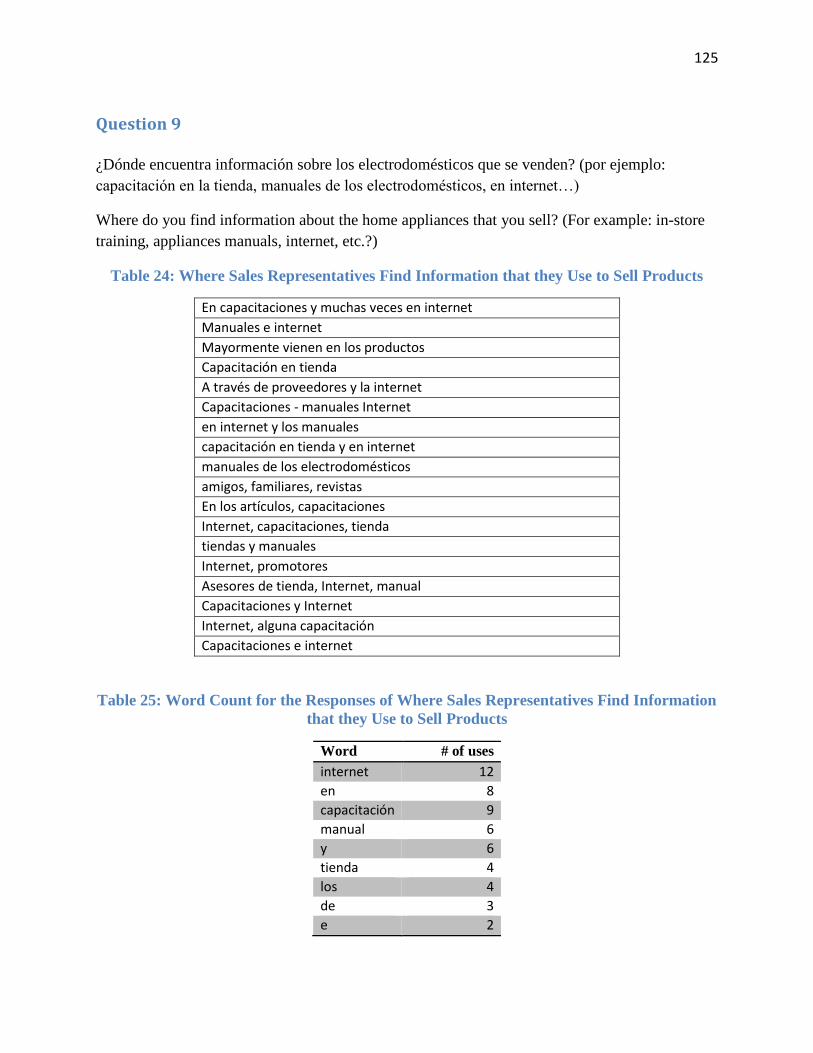
125
Question 9
¿Dónde encuentra información sobre los electrodomésticos que se venden? (por ejemplo:
capacitación en la tienda, manuales de los electrodomésticos, en internet…)
Where do you find information about the home appliances that you sell? (For example: in-store
training, appliances manuals, internet, etc.?)
Table 24: Where Sales Representatives Find Information that they Use to Sell Products
En capacitaciones y muchas veces en internet
Manuales e internet
Mayormente vienen en los productos
Capacitación en tienda
A través de proveedores y la internet
Capacitaciones - manuales Internet
en internet y los manuales
capacitación en tienda y en internet
manuales de los electrodomésticos
amigos, familiares, revistas
En los artículos, capacitaciones
Internet, capacitaciones, tienda
tiendas y manuales
Internet, promotores
Asesores de tienda, Internet, manual
Capacitaciones y Internet
Internet, alguna capacitación
Capacitaciones e internet
Table 25: Word Count for the Responses of Where Sales Representatives Find Information
that they Use to Sell Products
Word # of uses
internet 12
en 8
capacitación 9
manual 6
y 6
tienda 4
los 4
de 3
e 2

126
Appendix D: Draft Label Designs The labels shown in this appendix were used to test Costa Rican opinions on label
designs and experiment with various possible designs. This include different titles, systems of
classification and means of displaying the information.
Figure 63: Draft Label A, Designed to be Minimalist and Highly Informative. Law
Complaint Except for Title

127
Figure 64: Draft Label B, Designed to be Informative and Simple, but Not Law Compliant

128
Figure 65: Draft Label C, Designed to Test Extremely Simple Label, but Not Law
Compliant

129
Figure 66: Draft Label D, Designed to Test Unique Label Shapes, butNot Law Compliant

130
Figure 67: Draft Label E, Designed to Incorporate as Many Colors as Possible andFully
law compliant

131
Figure 68: Draft Label F, Designed To Look Official and Fully Law Compliant Except for
Label Title

132
Appendix E: Survey for Label Features and Designs
Demographic Data In this section of the survey the sex of the respondents was collected if permitted.
SECCIÓN OPCIONAL: Sexo: __ Hombre __ Mujer
Sex: ___ Male ____Female
Table 26: Sex of those Surveyed in Survey Two
Sex Count Percentage
Male 25 50,00%
Female 25 50,00%
Part 1 – Importance of Energy Efficiency
Question 1
¿Qué tan importante es la eficiencia energética para usted en una escala de 5 – 1. 1 siendo el
más importante y 5 siendo el menos importante.
Encierre sólo uno: 1 2 3 4 5
How important is energy efficiency to you, on a scale from 5-1? 1 is the most important and 5 is
the least important.
Circle one: 1 2 3 4 5
Table 27: Average Importance of Energy Efficiency, Lower Values Indicate More
Importance
Mean Median Mode Std. Dev.
2,367347 2 1 1,531173

133
Figure 69: Response Count of Each Level of Energy Efficiency Importance
Question 2
¿Ha visto usted etiquetas de eficiencia en los electrodomésticos?
Encierre uno: SÍ o NO
Have you seen energy efficiency labels on home appliances?
Circle one: YES or NO
Figure 70: Those Who had Seen Energy Efficiency Labels Before
0
5
10
15
20
25
1 2 3 4 5
Nu
mb
er
of
Re
spo
nse
s
Importance of Energy Efficiency (1 is most important)
54% 42%
4% Yes
No
No Response

134
Part 2 – Classification System
For this section those being surveyed were shown the image below containing five different
energy efficiency classification systems and asked to choose the best and worst.
Figure 71: Visual aid for Energy Efficiency Comparison Scale Systems for Survey Two
Question 1
En su opinión, ¿cuál sistema de clasificación es el MEJOR?
In your opinion, which ranking system is the BEST?
Question 2
En su opinión, ¿cuál sistema de clasificación es el PEOR?
In your opinion, which ranking system is the WORST?

135
Figure 72: Number of Responses for Best and Worst Scale System
Figure 73: Net Response to Each Type of Scale System. Calculated by Subtracting the
Number of Negative Responses for Each from the Number of Positive Responses
Part 3 – Label Title
For this section those being surveyed were shown the image below containing four different
label titles and asked to choose the best and worst.
-20
-15
-10
-5
0
5
10
15
20
25
A: GradeScale
B: Gauge C: Cost Scale D: Stars E: Grade
Re
spo
nse
Co
un
t
Type of Classification System
Best Scale
Worst Scale
-15
-10
-5
0
5
10
15
20
A: Grade Scale B: Gauge C: Cost Scale D: Stars E: Grade
Ne
t R
esp
on
se C
ou
nt
Type of Scale System

136
Figure 74: Visual aid for Potential Label Titles for Second Survey
Question 1
En su opinión, ¿cuál título es el MEJOR para una etiqueta para los electrodomésticos?
In your opinion, which title is the BEST for a label for home appliances?
Question 2
En su opinión, ¿cuál título es el PEOR para una etiqueta para los electrodomésticos?
In your opinion, which title is the WORST for a label for home appliances?

137
Figure 75: Number of Responses for Best and Worst Label Title
Figure 76: Net Response to Each Label Title. Calculated by Subtracting the Number of
Negative Responses for Each from the Number of Positive Responses
-25
-20
-15
-10
-5
0
5
10
15
20
25
A: AhorrosEnergeticos
B: AhorrosEnergeticos
C: EficiénciaEnergetica
D: Energetico
Re
spo
nse
Co
un
t
Label Logo and Title
Worst Title
Best Title
-20
-15
-10
-5
0
5
10
15
20
A: AhorrosEnergeticos
B: AhorrosEnergeticos
C: EficiénciaEnergetica
D: Energetico
Net
Res
po
se C
ou
nt
Label Logo and Title

138
Part 4 – Label Color
For this section those being surveyed were shown the image on the next page containing six
identical labels with different background colors and patterns and asked to choose the best and
worst.
Figure 77: Visual Aid for Potential Label Colors for Second Survey. Same Design Repeated
Only Differing in Background Color
Question 1
¿Cuál etiqueta le llama MÁS la atención?
Which label calls your attention the MOST?

139
Question 2
¿Cuál etiqueta le llama MENOS la atención?
Which label calls your attention the LEAST?
Figure 78: Number of Responses for Best and Worst Label Color
Figure 79: Net Response to Each Possible Label Color. Calculated by Subtracting the
Number of Negative Responses for Each from the Number of Positive Responses
-15
-10
-5
0
5
10
15
20
A: Blue B: Green C: Yellow D: Rainbow E: Green toYellow
F: Orangeto Yellow
Worst Color
Best Color
-8
-6
-4
-2
0
2
4
6
A: Blue B: Green C: Yellow D: Rainbow E: Green toYellow
F: Orange toYellow
Ne
t R
esp
on
ses
Label Color

140
Part 5 – Label Arrangement
In this section those being surveyed were shown the image below containing four label
information arrangements and asked to choose the best and worst.
Figure 80: Visual Aid for Potential Label Content Arrangements for Second Survey
Question 1
En su opinión, ¿cuál formato de la etiqueta es el MEJOR?
In your opinion, which format of the label is the BEST?
Question 2
En su opinión, ¿cuál formato de la etiqueta es el PEOR?
In your opinion, which format of the label is the WORST?

141
Figure 81: Number of Responses for Best and Worst Label Arrangements
Figure 82: Net Response to Each Label Layout. Calculated by Subtracting the Number of
Negative Responses for Each from the Number of Positive Responses
-30
-20
-10
0
10
20
30
A: MinimalPortrait
B: OfficialPortrait
C: Landscape D: Star Design
Worst Composition
Best Composition
-30
-25
-20
-15
-10
-5
0
5
10
15
20
25
A: Minimal Portrait B: Official Portrait C: Landscape D: Star Design
Ne
t R
esp
on
ses
Label Layout

142
Part 6 – Draft Label Designs
In this section those being surveyed were shown the labels in Appendix D and asked to choose
the best and worst label design as well as why they choose their favorite label.
Question 1
En su opinión, ¿cuál etiqueta es la MEJOR?
In your opinion, which label is the BEST?
Figure 83: Number of Responses for Best and Worst Draft Label Designs
Question 2
En unas palabras, ¿por qué escogió esta etiqueta?
In your own words, why did you choose this label?
-20
-15
-10
-5
0
5
10
15
20
A:Energeticoswith stars
B:Energeticoswith gauge
C: EnergeticaMinimalist
D: StarDesign
E: MulticolorLabel
F: Officialstyle
Worst Label
Best Label

143
Table 28: Word Count for Why Favorite Label was Chosen
Word # of uses Word # of uses
más 14 presentación 3
porque 12 en 3
la 11 llamativa 3
mejor 10 clara 2
es 8 su 2
y 6 electricidad 2
por 6 pero 2
atención 6 escala 2
información 5 ser 2
llama 5 explica 2
tiene 4 ve 2
se 4 bandera 2
de 4 gusta 2
el 4 claridad 2
Question 3
En su opinión, ¿cuál etiqueta es la PEOR?
In your opinion, which label is the WORST?
Figure 84: Net Response to Each Example Draft Label. Calculated by Subtracting the
Number of Negative Responses for Each from the Number of Positive Responses
-20
-15
-10
-5
0
5
10
15
A:Energeticoswith stars
B:Energeticoswith gauge
C:EnergeticaMinimalist
D: StarDesign
E:Multicolor
Label
F: Officialstyle
Net
Res
po
nse
Co
un
t
Example Label

144
References
Albright, S. Christian., Wayne L. Winston, and Christopher J. Zappe. Data Analysis and Decision
Making. Fourthed. Mason, OH: South-Western/Cengage Learning, 2011. Print.
Banerjee, A., & Solomon, B. D. (2003). Eco-labeling for energy efficiency and sustainability: a
meta-evaluation of US programs. Energy Policy, 31(2), 109-123. doi:
http://dx.doi.org/10.1016/S0301-4215(02)00012-5
Becroft, D., Jimenez, E., & Turner, Q. (2009). Designing a clean Energy and Energy Conservation
Website for Costa Rican Schoolchildren (pp. 2-6).
Cámara de Industrias de Costa Rica. (2009). Reseña Histórica. Retrieved from
http://cicr.com/index.php?option=com_content&view=article&id=189&Itemid=8
Cámara de Industrias de Costa Rica. (2012). Instituto de Excelencia Empresarial. Retrieved from
http://cicr.com/index.php?option=com_content&view=article&id=219&Itemid=13
Carrigan, M., & Attalla, A. (2001). The myth of the ethical consumer–do ethics matter in purchase
behaviour? Journal of consumer marketing, 18(7), 560-578.
Chavez, D. (2013). The Costa Rican Electricity Institute (ICE): An exceptional public in an atypical
social democracy: Transnational Institute.
Council. (1992). Council Directive 92/75/EEC of 22 September 1992 on the indication by labelling
and standard product information of the consumption of energy and other resources by
household appliances. EUR-Lex: Europa.
Council. (2010). Directive 2010/30/EU of the European Parliament and of the Council of 19 May
2010 on the indication by labelling and standard product information of the consumption of
energy and other resources by energy-related products. EUR-Lex: Europa.
145
Derby, E. A. (2001). Appliance Standards Transplantation: Applicability of a U.S.-Based Energy
Efficiency Standards Model in Costa Rica: University of California Berkeley.
"Electricity production, consumption and market overview" - Statistics Explained. (2012). Retrieved
from
http://epp.eurostat.ec.europa.eu/statistics_explained/index.php/Electricity_production,_consu
mption_and_market_overview#
Energy Policy and Conservation Act, Pub. L. No. P.L 94-969, 89 Stat. 871 Stat. (U.S. Government
Printing Office 1975).
Environmental Protection Agency Office of Air and Radiation, C. P. P. D. (2013). National
Awareness of ENERGY STAR for 2012: Analysis of 2012 CEE Household Survey. In U.S.
Environmental Protection Agency (Ed.).
Environmental Protection Agency Office of Air and Radiation, C. P. P. D. (2014a). ENERGY STAR
Most Efficient 2014 Criteria. Retrieved from
http://www.energystar.gov/index.cfm?c=partners.most_efficient_criteria
Environmental Protection Agency Office of Air and Radiation, C. P. P. D. (2014b). Product
Specifications Search. Retrieved from http://www.energystar.gov/products/specs/
European Committee of Domestic Equipment Manufacturers (2014). The New EU Energy Label: A
Guide for Retailers. Retrieved from http://www.newenergylabel.com/index.php/uk/home/
European Commission. (2013). Energy Labelling of Products. Retrieved from
http://ec.europa.eu/energy/efficiency/labelling/labelling_en.htm
European Commission. (2014). Energy prices and costs in Europe Communication From The
Commission To The European Parliament, The Council, The European Economic And Social
Committee And The Committee Of The Regions (Vol. SWD(2014) 19). Brussels: europa.

146
Federal Trade Commission. (2007). Concluding Two-Year Rulemaking, FTC Announces New
EnergyGuide Label. Will Display Estimated Yearly Operating Costs Prominently on Most
Appliances.
Federal Trade Commission. (2014). Shopping for Home Appliances? Use the EnergyGuide Label.
Retrieved from http://www.consumer.ftc.gov/articles/0072-shopping-home-appliances-use-
energyguide-label#whyshould
Heinzle, S. L., & Wüstenhagen, R. (2012). Dynamic Adjustment of Eco‐labeling Schemes and
Consumer Choice–the Revision of the EU Energy Label as a Missed Opportunity? Business
Strategy and the Environment, 21(1), 60-70.
Instituto Costarricense de Electricidads (2014). Current Residential Rates.
Ley Nº 7447. La Gaceta Contraloría General de la República de Costa Rica, San José, Costa
Rica, August 11 1996
Mahlia, T. M. I., Masjuki, H. H., & Choudhury, I. A. (2002). Theory of energy efficiency standards
and labels. Energy Conversion and Management, 43(6), 743-761. doi:
http://dx.doi.org/10.1016/S0196-8904(01)00073-5
Mainieri, A. (2000). Costa Rica Country Update (pp. 313-318). San Jose, Costa Rica: Instituto
Costarricense de Electricidad.
Meier, A. K., & Hill, J. E. (1997). Energy test procedures for appliances. Energy and Buildings,
26(1), 23-33. doi: http://dx.doi.org/10.1016/S0378-7788(96)01022-5
Rico (22 Jan 2014). Lower Rainfall this Year Could Mean Higher Electricity Rates. Q Costa Rica.
Retrieved from http://www.qcostarica.com/2014/01/22/lower-rainfall-this-year-could-mean-
higher-electricity-rates/

147
Sammer, K., & Wüstenhagen, R. (2006). The influence of eco‐labelling on consumer behaviour–
Results of a discrete choice analysis for washing machines. Business Strategy and the
Environment, 15(3), 185-199.
U.S. Department of Energy, Office of Energy Efficiency & Renewable Energy. History and Impacts.
Retrieved from http://energy.gov/eere/buildings/history-and-impacts
U.S. Energy Information Administration (2013). 2012 Utility Bundled Retail sales-Residential: U.S.
Energy Information Administration.
Webber, C. A., Brown, R. E., & Koomey, J. (2000). Savings estimates for the Energy Star®
voluntary labeling program. Energy Policy, 28(15), 1137-1149. doi:
http://dx.doi.org/10.1016/S0301-4215(00)00083-5
Where Does My Money Go? Retrieved from
https://www.energystar.gov/index.cfm?c=products.pr_where_money