Applebee's Nutrition Information · Nutrition Information. The Dietary Guidelines for Americans...
21
NUTRITION INFORMATION Applebee’s® is committed to serving delicious food- just the way you like it. We are proud to offer a variety of delicious favorites. As a good neighbor, we understand that choice is a priority for Guests who are watching what they eat. Please use the nutritional facts in this document to help you make your dining decisions. While we are committed to providing as accurate nutritional information as possible, there may be differences between the actual nutritional content of your freshly prepared menu item and the nutritional values provided in this document. The nutritional values stated may reflect content for a menu item in its entirety (e.g. including sides) or by separate menu item component. Please refer to the description in the menu category heading to identify which values are being reflected. The nutritional values we provide are derived using an industry standard database, but do not account for the natural variability that occurs within ingredients, variation that occurs due to the hand-crafted nature of each plate or variation that may occur due to substitutions that Guests request. Please keep this in mind when making dining decisions. We are happy to make any modifications or substitutions to your meal that you request, although these adjustments will impact the nutritional information detailed in this document. Applicable Only To The U.S.A. Document Is Subject To Updates. Please Check Back Regularly. Applebee’s Guest Relations 888-59APPLE (888-592-7753) Information As Of 3/4/19. Good Thru 05/19/19. 3/8/2019 1 of 21
Transcript of Applebee's Nutrition Information · Nutrition Information. The Dietary Guidelines for Americans...

NUTRITION INFORMATION
Applebee’s® is committed to serving delicious food- just the way you like it. We are proud to offer a
variety of delicious favorites. As a good neighbor, we understand that choice is a priority for Guests who
are watching what they eat. Please use the nutritional facts in this document to help you make your
dining decisions.
While we are committed to providing as accurate nutritional information as possible, there may be
differences between the actual nutritional content of your freshly prepared menu item and the
nutritional values provided in this document. The nutritional values stated may reflect content for a
menu item in its entirety (e.g. including sides) or by separate menu item component. Please refer to the
description in the menu category heading to identify which values are being reflected. The nutritional
values we provide are derived using an industry standard database, but do not account for the natural
variability that occurs within ingredients, variation that occurs due to the hand-crafted nature of each
plate or variation that may occur due to substitutions that Guests request. Please keep this in mind
when making dining decisions.
We are happy to make any modifications or substitutions to your meal that you request, although these
adjustments will impact the nutritional information detailed in this document.
Applicable Only To The U.S.A. Document Is Subject To Updates. Please Check Back Regularly.
Applebee’s Guest Relations 888-59APPLE (888-592-7753)
Information As Of 3/4/19. Good Thru 05/19/19.
3/8/2019 1 of 21

Nutrition Information
The Dietary Guidelines for Americans recommend consuming less than 10 percent of calories per day from saturated fat and less than 2,300 milligrams per day of sodium for a typical adult eating 2,000 calories daily. Recommended limits may be higher or
lower depending on daily calorie consumption. Variations and substitutions will increase or decrease stated nutritional values. Nutritional information on this supplement is accurate as of the date of printing. Items listed may not be available at all restaurants.
Appetizers Total CaloriesCalories from
FatTotal Fat (g)
Saturated Fat
(g)Trans Fat (g)
Cholesterol
(mg)Sodium (mg)
Total
Carbohydrates
(g)
Fiber (g) Sugars (g) Protein (g)
Boneless Wings (without sauce or dressing) 660 300 33 6 0 100 1550 49 4 2 40
Classic Buffalo Sauce 180 170 19 7 0 0 2300 4 1 0 0
Honey BBQ Sauce 220 5 0 0 0 0 920 54 3 42 1
Sweet Asian Chile Sauce 250 20 2 0 0 0 1520 55 2 21 3
Bleu Cheese Dressing 220 200 22 4 0 20 240 3 0 1 1
Ranch Dressing 200 180 20 3 0 15 320 3 0 1 1
Brew Pub Pretzels & Beer Cheese Dip 1200 430 48 15 0.5 50 4470 154 7 19 38
Brisket Quesadilla 950 560 62 27 1.5 130 2460 58 4 7 39
Chipotle Lime Chicken Quesadilla 890 510 57 24 1 130 2430 58 4 6 38
Chicken Wonton Tacos 560 240 27 5 0 105 1500 45 3 16 35
Chips & Salsa 620 250 27 5 0 0 2270 85 8 6 9
Crunchy Onion Rings 1250 500 56 10 0 5 3050 173 10 54 15
Double Crunch Bone-In Wings (without sauce or dressing) 660 360 40 9 0 295 1430 11 1 1 64
Classic Buffalo Sauce 180 170 19 7 0 0 2300 4 1 0 0
Honey BBQ Sauce 220 5 0 0 0 0 920 54 3 42 1
Sweet Asian Chile Sauce 250 20 2 0 0 0 1520 55 2 21 3
Bleu Cheese Dressing 220 200 22 4 0 20 240 3 0 1 1
Ranch Dressing 200 180 20 3 0 15 320 3 0 1 1
French Fries Basket 680 290 32 6 0 5 1520 91 7 1 8
Mozzarella Sticks 860 390 44 18 1 75 2670 78 6 15 38
Neighborhood Nachos 1970 1140 126 56 2.5 285 5250 124 12 14 86
Neighborhood Nachos (with Chipotle Lime Chicken) 1780 990 110 48 2 280 5150 119 10 11 79
Spinach & Artichoke Dip 940 520 57 16 0.5 25 2560 86 6 5 19
Taco Topped Queso & Chips 1100 580 64 26 1.5 115 3320 90 7 8 42
White Queso Dip & Chips 930 480 54 21 1 70 2720 86 6 6 27
The Classic Combo (without sauce or dressing) 2220 1150 128 42 1.5 190 6040 186 13 16 82
Classic Buffalo Sauce 90 80 9 3.5 0 0 1150 2 1 0 0
Honey BBQ Sauce 110 0 0 0 0 0 460 27 2 21 1
Sweet Asian Chile Sauce 130 10 1 0 0 0 760 28 1 11 1
Bleu Cheese Dressing 220 200 22 4 0 20 240 3 0 1 1
Ranch Dressing 200 180 20 3 0 15 320 3 0 1 1
The Classic Combo (with brisket quesadilla) (without sauce or dressing) 2260 1190 132 43 2 190 6050 186 13 16 82
Classic Buffalo Sauce 90 80 9 3.5 0 0 1150 2 1 0 0
Honey BBQ Sauce 110 0 0 0 0 0 460 27 2 21 1
Sweet Asian Chile Sauce 130 10 1 0 0 0 760 28 1 11 1
Bleu Cheese Dressing 220 200 22 4 0 20 240 3 0 1 1
Ranch Dressing 200 180 20 3 0 15 320 3 0 1 1
Variations in ingredients and preparation, as well as substitutions, will increase or decrease any stated nutritional values. Items may vary by restaurant, may not be available at all locations, and are subject to change. Applicable only in the U.S.A. Menu items,
ingredients and preparation may differ outside the U.S.A.
Information As Of 3/4/19. Good Thru 05/19/19.
Applicable Only To The U.S.A. Document Is Subject To Updates. Please Check Back Regularly.
3/8/2019 2 of 21
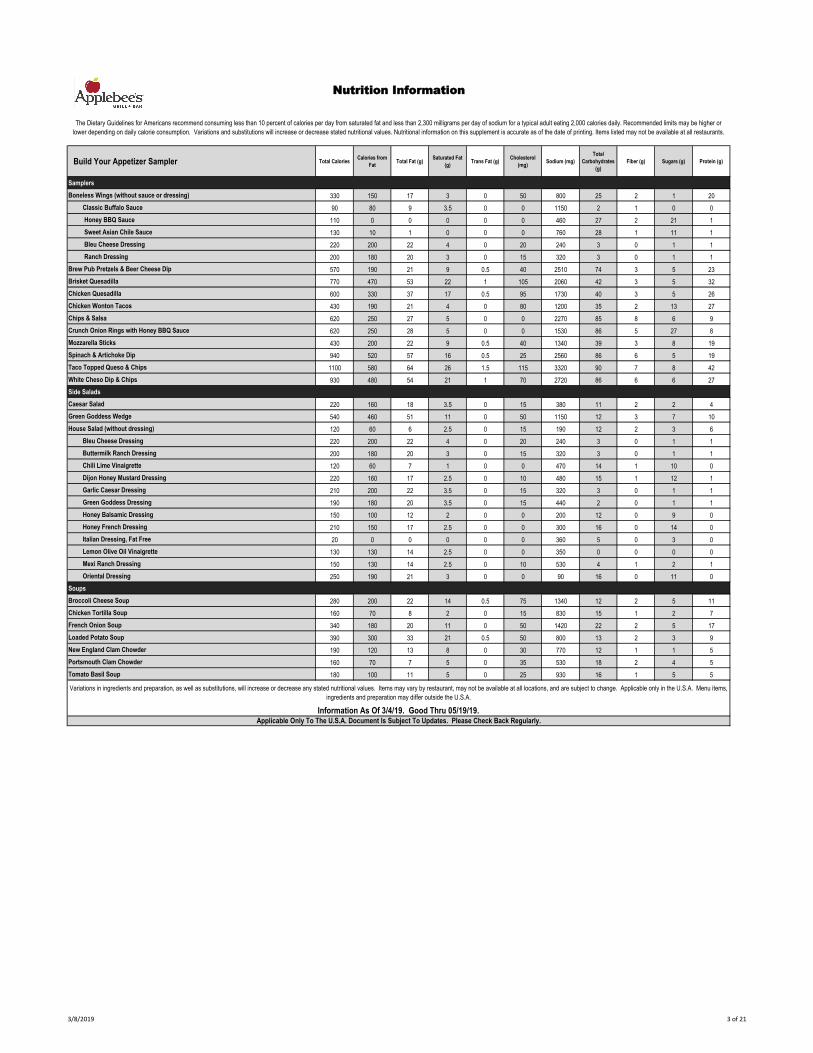
Nutrition Information
The Dietary Guidelines for Americans recommend consuming less than 10 percent of calories per day from saturated fat and less than 2,300 milligrams per day of sodium for a typical adult eating 2,000 calories daily. Recommended limits may be higher or
lower depending on daily calorie consumption. Variations and substitutions will increase or decrease stated nutritional values. Nutritional information on this supplement is accurate as of the date of printing. Items listed may not be available at all restaurants.
Build Your Appetizer Sampler Total CaloriesCalories from
FatTotal Fat (g)
Saturated Fat
(g)Trans Fat (g)
Cholesterol
(mg)Sodium (mg)
Total
Carbohydrates
(g)
Fiber (g) Sugars (g) Protein (g)
Samplers
Boneless Wings (without sauce or dressing) 330 150 17 3 0 50 800 25 2 1 20
Classic Buffalo Sauce 90 80 9 3.5 0 0 1150 2 1 0 0
Honey BBQ Sauce 110 0 0 0 0 0 460 27 2 21 1
Sweet Asian Chile Sauce 130 10 1 0 0 0 760 28 1 11 1
Bleu Cheese Dressing 220 200 22 4 0 20 240 3 0 1 1
Ranch Dressing 200 180 20 3 0 15 320 3 0 1 1
Brew Pub Pretzels & Beer Cheese Dip 570 190 21 9 0.5 40 2510 74 3 5 23
Brisket Quesadilla 770 470 53 22 1 105 2060 42 3 5 32
Chicken Quesadilla 600 330 37 17 0.5 95 1730 40 3 5 26
Chicken Wonton Tacos 430 190 21 4 0 80 1200 35 2 13 27
Chips & Salsa 620 250 27 5 0 0 2270 85 8 6 9
Crunch Onion Rings with Honey BBQ Sauce 620 250 28 5 0 0 1530 86 5 27 8
Mozzarella Sticks 430 200 22 9 0.5 40 1340 39 3 8 19
Spinach & Artichoke Dip 940 520 57 16 0.5 25 2560 86 6 5 19
Taco Topped Queso & Chips 1100 580 64 26 1.5 115 3320 90 7 8 42
White Cheso Dip & Chips 930 480 54 21 1 70 2720 86 6 6 27
Side Salads
Caesar Salad 220 160 18 3.5 0 15 380 11 2 2 4
Green Goddess Wedge 540 460 51 11 0 50 1150 12 3 7 10
House Salad (without dressing) 120 60 6 2.5 0 15 190 12 2 3 6
Bleu Cheese Dressing 220 200 22 4 0 20 240 3 0 1 1
Buttermilk Ranch Dressing 200 180 20 3 0 15 320 3 0 1 1
Chili Lime Vinaigrette 120 60 7 1 0 0 470 14 1 10 0
Dijon Honey Mustard Dressing 220 160 17 2.5 0 10 480 15 1 12 1
Garlic Caesar Dressing 210 200 22 3.5 0 15 320 3 0 1 1
Green Goddess Dressing 190 180 20 3.5 0 15 440 2 0 1 1
Honey Balsamic Dressing 150 100 12 2 0 0 200 12 0 9 0
Honey French Dressing 210 150 17 2.5 0 0 300 16 0 14 0
Italian Dressing, Fat Free 20 0 0 0 0 0 360 5 0 3 0
Lemon Olive Oil Vinaigrette 130 130 14 2.5 0 0 350 0 0 0 0
Mexi Ranch Dressing 150 130 14 2.5 0 10 530 4 1 2 1
Oriental Dressing 250 190 21 3 0 0 90 16 0 11 0
Soups
Broccoli Cheese Soup 280 200 22 14 0.5 75 1340 12 2 5 11
Chicken Tortilla Soup 160 70 8 2 0 15 830 15 1 2 7
French Onion Soup 340 180 20 11 0 50 1420 22 2 5 17
Loaded Potato Soup 390 300 33 21 0.5 50 800 13 2 3 9
New England Clam Chowder 190 120 13 8 0 30 770 12 1 1 5
Portsmouth Clam Chowder 160 70 7 5 0 35 530 18 2 4 5
Tomato Basil Soup 180 100 11 5 0 25 930 16 1 5 5
Variations in ingredients and preparation, as well as substitutions, will increase or decrease any stated nutritional values. Items may vary by restaurant, may not be available at all locations, and are subject to change. Applicable only in the U.S.A. Menu items,
ingredients and preparation may differ outside the U.S.A.
Information As Of 3/4/19. Good Thru 05/19/19.Applicable Only To The U.S.A. Document Is Subject To Updates. Please Check Back Regularly.
3/8/2019 3 of 21

Nutrition Information
The Dietary Guidelines for Americans recommend consuming less than 10 percent of calories per day from saturated fat and less than 2,300 milligrams per day of sodium for a typical adult eating 2,000 calories daily. Recommended limits may be higher or
lower depending on daily calorie consumption. Variations and substitutions will increase or decrease stated nutritional values. Nutritional information on this supplement is accurate as of the date of printing. Items listed may not be available at all restaurants.
Steaks & Ribs Total CaloriesCalories from
FatTotal Fat (g)
Saturated Fat
(g)Trans Fat (g)
Cholesterol
(mg)Sodium (mg)
Total
Carbohydrates
(g)
Fiber (g) Sugars (g) Protein (g)
6 oz. USDA Select Sirloin 200 70 7 3 0 90 970 1 1 0 33
8 oz. USDA Select Sirloin 270 90 10 4 0 120 1090 1 1 0 45
Applebee's Riblets Platter (without sauce) (includes side) 1290 670 74 22 0 280 1860 75 7 14 81
Honey BBQ Sauce 370 5 0.5 0 0 0 1530 89 5 70 2
Texas Style BBQ Sauce 390 30 3.5 2 0 0 950 88 2 51 2
Applebee's Riblets Plate (without sauce) (includes side) 900 450 50 14 0 175 1430 61 5 3 52
Honey BBQ Sauce 220 5 0 0 0 0 920 54 3 42 1
Texas Style BBQ Sauce 230 20 2 1 0 0 570 53 1 31 1
Bourbon Street Steak (includes side) 650 290 32 10 1 135 1200 41 6 5 51
Double-Glazed Baby Back Ribs, Full Rack (without sauce) 950 640 71 28 0 340 500 1 1 1 78
Honey BBQ Sauce 150 0 0 0 0 0 610 36 2 28 1
Texas Style BBQ Sauce 160 10 1.5 0.5 0 0 380 35 1 20 1
Double-Glazed Baby Back Ribs, Half Rack (without sauce) 470 320 35 14 0 170 250 0 1 0 39
Honey BBQ Sauce 70 0 0 0 0 0 310 18 1 14 0
Texas Style BBQ Sauce 80 5 0.5 0 0 0 190 18 0 10 0
Shrimp 'N Parmesan Sirloin 560 310 34 19 1.5 265 2000 5 2 2 58
Shrimp 'N Parmesan Sirloin (6 oz.) 490 280 32 18 1 235 1890 5 2 2 46
Toppers
Crispy Onion Tanglers 190 120 14 2.5 0 0 125 14 1 2 2
Grilled Onions 45 25 2.5 0 0 0 280 5 1 2 1
Sauteed Garlic Mushrooms 170 130 15 7 0 25 430 6 1 2 3
Shrimp N Parm Topper 290 220 24 15 1 140 910 5 1 2 13
Add On
Grilled Shrimp Skewer 120 80 9 4 0 120 540 1 0 0 10
Add Grilled Shrimp 150 80 8 4 0 150 1000 4 1 1 16
Add Fried Shrimp 500 300 33 6 0 100 1800 37 3 13 14
Choice of Sides
Baked Potato 400 220 24 12 0.5 60 1090 40 3 2 6
Classic Fries 430 180 20 3.5 0 0 960 57 4 0 5
Fire-Grilled Veggies 150 110 12 4.5 0 15 410 9 3 6 2
Four-Cheese Mac & Cheese with Bacon 490 260 29 15 1 80 1210 35 2 3 24
Garlic Mashed Potatoes 250 100 11 2.5 0 5 650 35 3 3 4
Garlicky Green Beans 180 130 14 7 0 20 310 11 4 2 3
Loaded Baked Potato 480 280 31 15 0.5 80 1330 41 3 3 12
Loaded Garlic Mashed Potatoes 390 210 23 8 0 45 900 36 3 4 11
Steamed Broccoli 100 70 8 4.5 0 20 210 6 2 2 3
Variations in ingredients and preparation, as well as substitutions, will increase or decrease any stated nutritional values. Items may vary by restaurant, may not be available at all locations, and are subject to change. Applicable only in the U.S.A. Menu items,
ingredients and preparation may differ outside the U.S.A.
Information As Of 3/4/19. Good Thru 05/19/19.
Applicable Only To The U.S.A. Document Is Subject To Updates. Please Check Back Regularly.
Please note that entrees are listed without choice of side unless otherwise noted; nutrition information for sides is available, separately.
3/8/2019 4 of 21

Nutrition Information
The Dietary Guidelines for Americans recommend consuming less than 10 percent of calories per day from saturated fat and less than 2,300 milligrams per day of sodium for a typical adult eating 2,000 calories daily. Recommended limits may be higher or
lower depending on daily calorie consumption. Variations and substitutions will increase or decrease stated nutritional values. Nutritional information on this supplement is accurate as of the date of printing. Items listed may not be available at all restaurants.
Chicken Total CaloriesCalories from
FatTotal Fat (g)
Saturated Fat
(g)Trans Fat (g)
Cholesterol
(mg)Sodium (mg)
Total
Carbohydrates
(g)
Fiber (g) Sugars (g) Protein (g)
Bourbon Street Chicken & Shrimp 610 240 26 7 0 220 2000 42 7 5 52
Cedar Grilled Lemon Chicken 600 230 25 4.5 0 135 2590 51 5 16 44
Chicken Fried Chicken 1180 550 61 16 0.5 150 2810 103 9 6 59
Chicken Tenders Platter 1450 720 80 14 0 115 3270 132 9 23 50
Chicken Tenders Plate 1140 570 63 11 0 85 2650 106 7 13 37
Chicken Wonton Stir Fry 790 180 20 4 0 135 2690 104 7 25 52
Classic Chicken Parmesan (without breadstick) 1370 510 57 18 1 175 2900 136 15 18 81
Breadstick 190 60 7 2 0 5 290 25 1 2 5
Fiesta Lime Chicken® 1120 530 58 14 0.5 185 3660 93 7 9 57
Grilled Chicken Breast (choice of side not included) 190 30 3.5 1 0 135 980 1 1 0 39
Variations in ingredients and preparation, as well as substitutions, will increase or decrease any stated nutritional values. Items may vary by restaurant, may not be available at all locations, and are subject to change. Applicable only in the U.S.A. Menu items,
ingredients and preparation may differ outside the U.S.A.
Information As Of 3/4/19. Good Thru 05/19/19.Applicable Only To The U.S.A. Document Is Subject To Updates. Please Check Back Regularly.
3/8/2019 5 of 21

Nutrition Information
The Dietary Guidelines for Americans recommend consuming less than 10 percent of calories per day from saturated fat and less than 2,300 milligrams per day of sodium for a typical adult eating 2,000 calories daily. Recommended limits may be higher or
lower depending on daily calorie consumption. Variations and substitutions will increase or decrease stated nutritional values. Nutritional information on this supplement is accurate as of the date of printing. Items listed may not be available at all restaurants.
Seafood Total CaloriesCalories from
FatTotal Fat (g)
Saturated Fat
(g)Trans Fat (g)
Cholesterol
(mg)Sodium (mg)
Total
Carbohydrates
(g)
Fiber (g) Sugars (g) Protein (g)
Baked Haddock (without sides) 590 370 41 18 1.5 190 890 12 2 3 46
Blackened Tilapia 500 210 24 10 0 100 1550 43 8 4 32
Cedar Salmon with Maple Mustard Glaze (choice of side not included) 370 110 12 2 0 90 1530 27 2 19 38
Double Crunch Shrimp 1170 450 50 9 0 180 4030 144 10 33 34
Fish & Chips (Menu item varies per location) 1420 860 96 17 0 115 3460 102 9 13 38
Fish & Chips (Menu item varies per location) 1730 1150 128 23 0 125 3190 101 9 13 43
Fish & Chips (Menu item varies per location) 1750 1150 128 23 0.5 160 3940 98 8 13 52
Shrimp Wonton Stir Fry 680 150 17 3 0 145 2670 105 7 24 28
Variations in ingredients and preparation, as well as substitutions, will increase or decrease any stated nutritional values. Items may vary by restaurant, may not be available at all locations, and are subject to change. Applicable only in the U.S.A. Menu items,
ingredients and preparation may differ outside the U.S.A.
Information As Of 3/4/19. Good Thru 05/19/19.
Applicable Only To The U.S.A. Document Is Subject To Updates. Please Check Back Regularly.
3/8/2019 6 of 21

Nutrition Information
The Dietary Guidelines for Americans recommend consuming less than 10 percent of calories per day from saturated fat and less than 2,300 milligrams per day of sodium for a typical adult eating 2,000 calories daily. Recommended limits may be higher or
lower depending on daily calorie consumption. Variations and substitutions will increase or decrease stated nutritional values. Nutritional information on this supplement is accurate as of the date of printing. Items listed may not be available at all restaurants.
Salads Total CaloriesCalories from
FatTotal Fat (g)
Saturated Fat
(g)Trans Fat (g)
Cholesterol
(mg)Sodium (mg)
Total
Carbohydrates
(g)
Fiber (g) Sugars (g) Protein (g)
Crispy Chicken Tender Salad (with Crispy Chicken) 1170 710 79 21 0.5 315 2360 69 7 30 48
Crispy Chicken Tender Salad (with Grilled Chicken) 960 550 62 18 0.5 395 2370 42 6 30 62
Fiesta Chopped Salad 850 410 45 12 0.5 100 1260 75 11 21 38
Grilled Chicken Caesar Salad (with Grilled Chicken) 780 490 55 11 0 175 1950 26 7 6 49
Grilled Chicken Caesar Salad (with Blackened Shrimp) 660 470 52 10 0 185 1930 27 7 6 25
Grilled Steak Caesar Salad 730 500 56 12 0 100 1810 26 6 6 33
Oriental Chicken Salad (with Crispy Chicken) 1430 870 96 15 0 60 1510 109 11 37 37
Oriental Chicken Salad (with Grilled Chicken) 1310 750 83 13 0 135 2140 94 10 47 52
Southwestern Salad (with Steak) 980 600 66 17 0.5 105 1930 58 10 8 40
Southwestern Salad (with Grilled Chicken) 1030 580 65 16 0.5 175 2460 58 10 8 57
Thai Shrimp Salad 380 170 19 2.5 0 145 1510 30 8 14 25
Variations in ingredients and preparation, as well as substitutions, will increase or decrease any stated nutritional values. Items may vary by restaurant, may not be available at all locations, and are subject to change. Applicable only in the U.S.A. Menu items,
ingredients and preparation may differ outside the U.S.A.
Information As Of 3/4/19. Good Thru 05/19/19.
Applicable Only To The U.S.A. Document Is Subject To Updates. Please Check Back Regularly.
3/8/2019 7 of 21
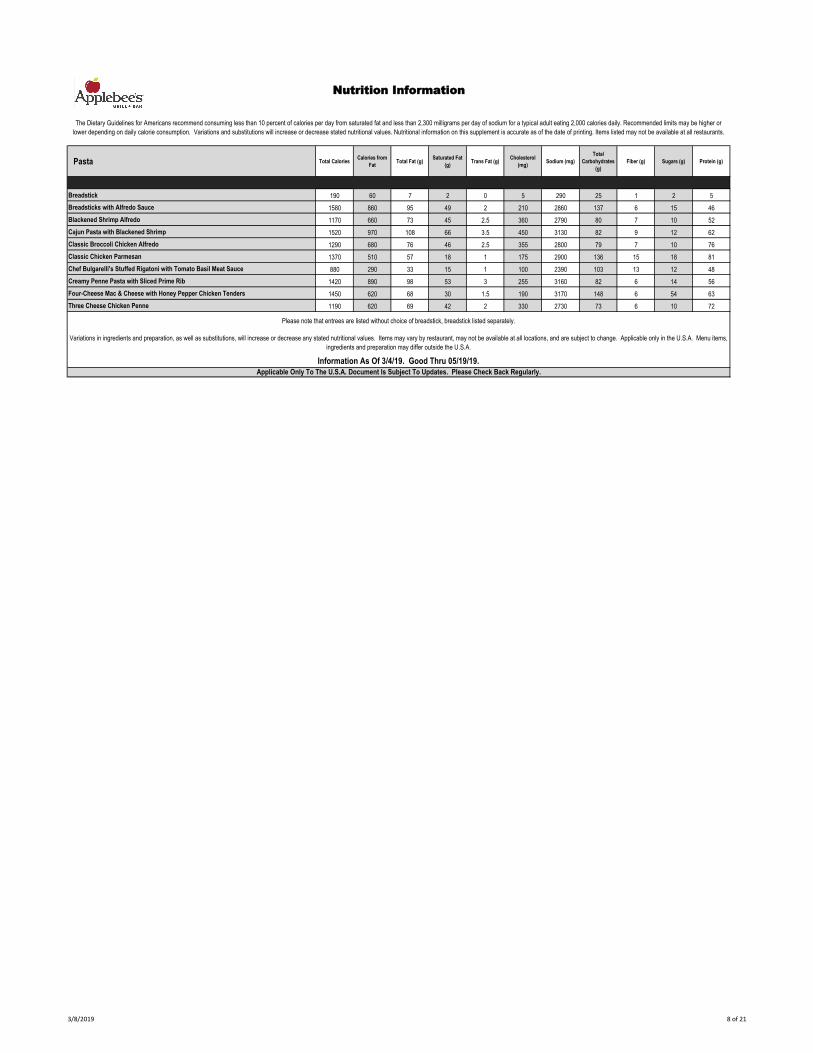
Nutrition Information
The Dietary Guidelines for Americans recommend consuming less than 10 percent of calories per day from saturated fat and less than 2,300 milligrams per day of sodium for a typical adult eating 2,000 calories daily. Recommended limits may be higher or
lower depending on daily calorie consumption. Variations and substitutions will increase or decrease stated nutritional values. Nutritional information on this supplement is accurate as of the date of printing. Items listed may not be available at all restaurants.
Pasta Total CaloriesCalories from
FatTotal Fat (g)
Saturated Fat
(g)Trans Fat (g)
Cholesterol
(mg)Sodium (mg)
Total
Carbohydrates
(g)
Fiber (g) Sugars (g) Protein (g)
Breadstick 190 60 7 2 0 5 290 25 1 2 5
Breadsticks with Alfredo Sauce 1580 860 95 49 2 210 2860 137 6 15 46
Blackened Shrimp Alfredo 1170 660 73 45 2.5 360 2790 80 7 10 52
Cajun Pasta with Blackened Shrimp 1520 970 108 66 3.5 450 3130 82 9 12 62
Classic Broccoli Chicken Alfredo 1290 680 76 46 2.5 355 2800 79 7 10 76
Classic Chicken Parmesan 1370 510 57 18 1 175 2900 136 15 18 81
Chef Bulgarelli's Stuffed Rigatoni with Tomato Basil Meat Sauce 880 290 33 15 1 100 2390 103 13 12 48
Creamy Penne Pasta with Sliced Prime Rib 1420 890 98 53 3 255 3160 82 6 14 56
Four-Cheese Mac & Cheese with Honey Pepper Chicken Tenders 1450 620 68 30 1.5 190 3170 148 6 54 63
Three Cheese Chicken Penne 1190 620 69 42 2 330 2730 73 6 10 72
Variations in ingredients and preparation, as well as substitutions, will increase or decrease any stated nutritional values. Items may vary by restaurant, may not be available at all locations, and are subject to change. Applicable only in the U.S.A. Menu items,
ingredients and preparation may differ outside the U.S.A.
Information As Of 3/4/19. Good Thru 05/19/19.
Applicable Only To The U.S.A. Document Is Subject To Updates. Please Check Back Regularly.
Please note that entrees are listed without choice of breadstick, breadstick listed separately.
3/8/2019 8 of 21

Nutrition Information
The Dietary Guidelines for Americans recommend consuming less than 10 percent of calories per day from saturated fat and less than 2,300 milligrams per day of sodium for a typical adult eating 2,000 calories daily. Recommended limits may be higher or
lower depending on daily calorie consumption. Variations and substitutions will increase or decrease stated nutritional values. Nutritional information on this supplement is accurate as of the date of printing. Items listed may not be available at all restaurants.
Handcrafted Burgers Total CaloriesCalories from
FatTotal Fat (g)
Saturated Fat
(g)Trans Fat (g)
Cholesterol
(mg)Sodium (mg)
Total
Carbohydrates
(g)
Fiber (g) Sugars (g) Protein (g)
Brunch Burger 1240 730 81 29 2.5 350 2360 64 5 12 63
Classic Bacon Cheeseburger (without cheese) 880 500 56 18 2 155 1210 46 3 7 49
American Cheese 140 100 12 7 0 35 680 1 0 1 7
Cheddar Cheese 170 130 14 9 0 45 260 1 0 0 10
Swiss Cheese 170 120 13 8 0 40 80 1 0 0 11
Pepper Jack Cheese 160 110 13 8 0 35 270 1 0 0 10
Classic Cheeseburger (without cheese) 780 440 49 16 2 135 900 45 3 6 42
American Cheese 140 100 12 7 0 35 680 1 0 1 7
Cheddar Cheese 170 130 14 9 0 45 260 1 0 0 10
Swiss Cheese 170 120 13 8 0 40 80 1 0 0 11
Pepper Jack Cheese 160 110 13 8 0 35 270 1 0 0 10
Classic Burger 780 440 49 16 2 135 900 45 3 6 42
Quesadilla Burger 1330 850 95 39 2 235 3050 49 5 8 73
Triple Bacon Burger 1170 710 79 30 2 215 1770 51 3 10 63
Whisky Bacon Burger 1290 760 84 30 2 195 1850 72 4 17 60
Burger Add Ons
Extra Bacon 100 70 7 2.5 0 20 310 1 0 1 7
American Cheese 140 100 12 7 0 35 680 1 0 1 7
Cheddar Cheese 170 130 14 9 0 45 260 1 0 0 10
Swiss Cheese 170 120 13 8 0 40 80 1 0 0 11
Pepper Jack Cheese 160 110 13 8 0 35 270 1 0 0 10
Extra Patty 420 280 31 13 1.5 110 290 2 1 0 34
Fried Egg 70 40 4.5 1.5 0 160 170 1 0 0 6
Substitute Black Bean Burger on any Burger (patty only) 190 60 7 1 0 0 540 22 8 2 17
Substitute Turkey Burger on any Burger (patty only) 300 250 27 8 0 90 740 0 0 0 24
Substitute Veggie Burger on any Burger (patty only) 170 50 6 0 0 0 310 21 5 2 7
Sides
Classic Fries 430 180 20 3.5 0 0 960 57 4 0 5
Onion Rings 510 250 28 5 0 0 1070 60 3 6 7
Caesar Salad 220 160 18 3.5 0 15 380 11 2 2 4
Small Caesar Salad 220 160 18 3.5 0 15 370 10 2 2 4
House Salad (without dressing) 120 60 6 2.5 0 15 190 12 2 3 6
Bleu Cheese Dressing 220 200 22 4 0 20 240 3 0 1 1
Buttermilk Ranch Dressing 200 180 20 3 0 15 320 3 0 1 1
Chili Lime Vinaigrette 120 60 7 1 0 0 470 14 1 10 0
Dijon Honey Mustard Dressing 220 160 17 2.5 0 10 480 15 1 12 1
Garlic Caesar Dressing 210 200 22 3.5 0 15 320 3 0 1 1
Green Goddess Dressing 190 180 20 3.5 0 15 440 2 0 1 1
Honey Balsamic Dressing 150 100 12 2 0 0 200 12 0 9 0
Honey French Dressing 210 150 17 2.5 0 0 300 16 0 14 0
Italian Dressing, Fat Free 20 0 0 0 0 0 360 5 0 3 0
Lemon Olive Oil Vinaigrette 130 130 14 2.5 0 0 350 0 0 0 0
Mexi Ranch Dressing 150 130 14 2.5 0 10 530 4 1 2 1
Oriental Dressing 250 190 21 3 0 0 90 16 0 11 0
Mixed Green Salad (without dressing) 70 15 2 0 0 0 100 11 2 3 2
Bleu Cheese Dressing 220 200 22 4 0 20 240 3 0 1 1
Buttermilk Ranch Dressing 200 180 20 3 0 15 320 3 0 1 1
Chili Lime Vinaigrette 120 60 7 1 0 0 470 14 1 10 0
Dijon Honey Mustard Dressing 220 160 17 2.5 0 10 480 15 1 12 1
Garlic Caesar Dressing 210 200 22 3.5 0 15 320 3 0 1 1
Green Goddess Dressing 190 180 20 3.5 0 15 440 2 0 1 1
Honey Balsamic Dressing 150 100 12 2 0 0 200 12 0 9 0
Honey French Dressing 210 150 17 2.5 0 0 300 16 0 14 0
Italian Dressing, Fat Free 20 0 0 0 0 0 360 5 0 3 0
Lemon Olive Oil Vinaigrette 130 130 14 2.5 0 0 350 0 0 0 0
Mexi Ranch Dressing 150 130 14 2.5 0 10 530 4 1 2 1
Oriental Dressing 250 190 21 3 0 0 90 16 0 11 0
Variations in ingredients and preparation, as well as substitutions, will increase or decrease any stated nutritional values. Items may vary by restaurant, may not be available at all locations, and are subject to change. Applicable only in the U.S.A. Menu items,
ingredients and preparation may differ outside the U.S.A.
Information As Of 3/4/19. Good Thru 05/19/19.Applicable Only To The U.S.A. Document Is Subject To Updates. Please Check Back Regularly.
Please note that burgers are listed without choice of side, sides listed separately.
3/8/2019 9 of 21
Nutrition Information
The Dietary Guidelines for Americans recommend consuming less than 10 percent of calories per day from saturated fat and less than 2,300 milligrams per day of sodium for a typical adult eating 2,000 calories daily. Recommended limits may be higher or
lower depending on daily calorie consumption. Variations and substitutions will increase or decrease stated nutritional values. Nutritional information on this supplement is accurate as of the date of printing. Items listed may not be available at all restaurants.
Sandwiches, Wraps & Tacos Total CaloriesCalories from
FatTotal Fat (g)
Saturated Fat
(g)Trans Fat (g)
Cholesterol
(mg)Sodium (mg)
Total
Carbohydrates
(g)
Fiber (g) Sugars (g) Protein (g)
Sandwiches
Bacon Cheddar Grilled Chicken Sandwich 890 430 48 17 0 225 2300 49 3 10 65
Clubhouse Grille 1040 540 60 18 0.5 120 2690 77 4 24 50
Zesty Chicken Sandwich 880 470 52 11 0 90 2460 68 4 7 33
Wraps & Tacos
BBQ Brisket Tacos 1180 610 68 19 1.5 100 2900 106 6 30 36
Chicken Fajita Rollup 1070 590 65 27 1 205 3450 65 5 8 58
Grilled Chicken Bacon Wrap 770 240 27 10 0 180 3320 73 3 21 60
Sides
Classic Fries 430 180 20 3.5 0 0 960 57 4 0 5
Onion Rings 510 250 28 5 0 0 1070 60 3 6 7
Caesar Salad 220 160 18 3.5 0 15 380 11 2 2 4
Small Caesar Salad 220 160 18 3.5 0 15 370 10 2 2 4
House Salad (without dressing) 120 60 6 2.5 0 15 190 12 2 3 6
Bleu Cheese Dressing 220 200 22 4 0 20 240 3 0 1 1
Buttermilk Ranch Dressing 200 180 20 3 0 15 320 3 0 1 1
Chili Lime Vinaigrette 120 60 7 1 0 0 470 14 1 10 0
Dijon Honey Mustard Dressing 220 160 17 2.5 0 10 480 15 1 12 1
Garlic Caesar Dressing 210 200 22 3.5 0 15 320 3 0 1 1
Green Goddess Dressing 190 180 20 3.5 0 15 440 2 0 1 1
Honey Balsamic Dressing 150 100 12 2 0 0 200 12 0 9 0
Honey French Dressing 210 150 17 2.5 0 0 300 16 0 14 0
Italian Dressing, Fat Free 20 0 0 0 0 0 360 5 0 3 0
Lemon Olive Oil Vinaigrette 130 130 14 2.5 0 0 350 0 0 0 0
Mexi Ranch Dressing 150 130 14 2.5 0 10 530 4 1 2 1
Oriental Dressing 250 190 21 3 0 0 90 16 0 11 0
Mixed Green Salad (without dressing) 70 15 2 0 0 0 100 11 2 3 2
Bleu Cheese Dressing 220 200 22 4 0 20 240 3 0 1 1
Buttermilk Ranch Dressing 200 180 20 3 0 15 320 3 0 1 1
Chili Lime Vinaigrette 120 60 7 1 0 0 470 14 1 10 0
Dijon Honey Mustard Dressing 220 160 17 2.5 0 10 480 15 1 12 1
Garlic Caesar Dressing 210 200 22 3.5 0 15 320 3 0 1 1
Green Goddess Dressing 190 180 20 3.5 0 15 440 2 0 1 1
Honey Balsamic Dressing 150 100 12 2 0 0 200 12 0 9 0
Honey French Dressing 210 150 17 2.5 0 0 300 16 0 14 0
Italian Dressing, Fat Free 20 0 0 0 0 0 360 5 0 3 0
Lemon Olive Oil Vinaigrette 130 130 14 2.5 0 0 350 0 0 0 0
Mexi Ranch Dressing 150 130 14 2.5 0 10 530 4 1 2 1
Oriental Dressing 250 190 21 3 0 0 90 16 0 11 0
Variations in ingredients and preparation, as well as substitutions, will increase or decrease any stated nutritional values. Items may vary by restaurant, may not be available at all locations, and are subject to change. Applicable only in the U.S.A. Menu items,
ingredients and preparation may differ outside the U.S.A.
Information As Of 3/4/19. Good Thru 05/19/19.Applicable Only To The U.S.A. Document Is Subject To Updates. Please Check Back Regularly.
Please note that sandwiches, wraps & tacos are listed without choice of side, sides listed separately.
3/8/2019 10 of 21
Nutrition Information
The Dietary Guidelines for Americans recommend consuming less than 10 percent of calories per day from saturated fat and less than 2,300 milligrams per day of sodium for a typical adult eating 2,000 calories daily. Recommended limits may be higher or
lower depending on daily calorie consumption. Variations and substitutions will increase or decrease stated nutritional values. Nutritional information on this supplement is accurate as of the date of printing. Items listed may not be available at all restaurants.
Lunch Combos Total CaloriesCalories from
FatTotal Fat (g)
Saturated Fat
(g)Trans Fat (g)
Cholesterol
(mg)Sodium (mg)
Total
Carbohydrates
(g)
Fiber (g) Sugars (g) Protein (g)
Classic
Caesar Salad 220 160 18 3.5 0 15 380 11 2 2 4
Chicken Fajita Rollup 770 400 45 16 0 110 2540 60 4 7 34
Fiesta Chopped Salad 330 150 17 4 0 75 740 21 4 7 25
Honey Pepper Chicken Tenders 960 320 36 7 0 45 1810 136 6 48 24
House Salad (without dressing) 120 60 6 2.5 0 15 190 12 2 3 6
Bleu Cheese Dressing 220 200 22 4 0 20 240 3 0 1 1
Buttermilk Ranch Dressing 200 180 20 3 0 15 320 3 0 1 1
Chili Lime Vinaigrette 120 60 7 1 0 0 470 14 1 10 0
Dijon Honey Mustard Dressing 220 160 17 2.5 0 10 480 15 1 12 1
Garlic Caesar Dressing 210 200 22 3.5 0 15 320 3 0 1 1
Green Goddess Dressing 190 180 20 3.5 0 15 440 2 0 1 1
Honey Balsamic Dressing 150 100 12 2 0 0 200 12 0 9 0
Honey French Dressing 210 150 17 2.5 0 0 300 16 0 14 0
Italian Dressing, Fat Free 20 0 0 0 0 0 360 5 0 3 0
Lemon Olive Oil Vinaigrette 130 130 14 2.5 0 0 350 0 0 0 0
Mexi Ranch Dressing 150 130 14 2.5 0 10 530 4 1 2 1
Oriental Dressing 250 190 21 3 0 0 90 16 0 11 0
Loaded Potato Soup 390 300 33 21 0.5 50 800 13 2 3 9
Three Cheese Chicken Penne 500 230 25 15 1 135 1160 35 3 4 34
Tomato Basil Soup 180 100 11 5 0 25 930 16 1 5 5
Signature
Chicken Tortilla Soup 160 70 8 2 0 15 830 15 1 2 7
Clubhouse Grille 520 270 30 9 0 60 1340 38 2 12 25
Crispy Chicken Tender Salad 630 380 42 11 0 250 1210 36 4 16 27
Four-Cheese Mac & Cheese with Honey Pepper Chicken Tenders 680 280 32 14 1 85 1470 70 3 27 29
French Onion Soup 340 180 20 11 0 50 1420 22 2 5 17
Grilled Chicken Bacon Wrap 620 190 21 8 0 100 2260 72 3 21 37
Grilled Chicken Caesar Salad 320 180 20 4 0 85 870 11 3 2 24
Oriental Chicken Salad (with Crispy Chicken) 460 260 29 4.5 0 30 620 34 3 9 15
Oriental Chicken Salad (with Grilled Chicken) 440 220 25 4 0 70 1240 33 3 19 23
Southwestern Chicken Salad 510 290 32 8 0 90 1230 29 5 4 28
Thai Shrimp Salad 190 90 10 1.5 0 70 780 15 4 7 13
Breadstick 190 60 7 2 0 5 290 25 1 2 5
Variations in ingredients and preparation, as well as substitutions, will increase or decrease any stated nutritional values. Items may vary by restaurant, may not be available at all locations, and are subject to change. Applicable only in the U.S.A. Menu items,
ingredients and preparation may differ outside the U.S.A.
Information As Of 3/4/19. Good Thru 05/19/19.Applicable Only To The U.S.A. Document Is Subject To Updates. Please Check Back Regularly.
3/8/2019 11 of 21

Nutrition Information
The Dietary Guidelines for Americans recommend consuming less than 10 percent of calories per day from saturated fat and less than 2,300 milligrams per day of sodium for a typical adult eating 2,000 calories daily. Recommended limits may be higher or
lower depending on daily calorie consumption. Variations and substitutions will increase or decrease stated nutritional values. Nutritional information on this supplement is accurate as of the date of printing. Items listed may not be available at all restaurants.
Desserts Total CaloriesCalories from
FatTotal Fat (g)
Saturated Fat
(g)Trans Fat (g)
Cholesterol
(mg)Sodium (mg)
Total
Carbohydrates
(g)
Fiber (g) Sugars (g) Protein (g)
Southern Apple Fritter 1290 630 70 22 0.5 45 610 154 4 91 13
Blue Ribbon Brownie 1460 570 64 37 1 210 540 203 3 135 20
Brownie Bite 340 130 14 9 0 40 130 50 1 33 4
Butter Pecan Blondie 1070 550 61 33 0.5 160 650 119 4 64 14
Chocolate Chip Cookie Sundae 1340 570 64 40 1.5 140 680 180 5 113 15
Hot Fudge Sundae Shooter 370 160 18 13 0 55 120 47 0 33 4
Triple Chocolate Meltdown® 1030 500 55 29 0.5 115 400 122 8 64 12
Variations in ingredients and preparation, as well as substitutions, will increase or decrease any stated nutritional values. Items may vary by restaurant, may not be available at all locations, and are subject to change. Applicable only in the U.S.A. Menu items,
ingredients and preparation may differ outside the U.S.A.
Information As Of 3/4/19. Good Thru 05/19/19.
Applicable Only To The U.S.A. Document Is Subject To Updates. Please Check Back Regularly.
3/8/2019 12 of 21

Nutrition Information
The Dietary Guidelines for Americans recommend consuming less than 10 percent of calories per day from saturated fat and less than 2,300 milligrams per day of sodium for a typical adult eating 2,000 calories daily. Recommended limits may be higher or
lower depending on daily calorie consumption. Variations and substitutions will increase or decrease stated nutritional values. Nutritional information on this supplement is accurate as of the date of printing. Items listed may not be available at all restaurants.
Kids Menu Total CaloriesCalories from
FatTotal Fat (g)
Saturated Fat
(g)Trans Fat (g)
Cholesterol
(mg)Sodium (mg)
Total
Carbohydrates
(g)
Fiber (g) Sugars (g) Protein (g)
Kids Main Meal
Cheeseburger 620 340 37 13 1 105 1210 43 2 6 29
Cheesy Pizza 680 260 29 13 0 40 1160 83 4 12 25
Chicken Quesadilla 370 160 18 8 0 45 750 33 2 2 17
Chicken Taco 230 70 8 3 0 65 580 18 1 2 20
Chicken Tenders 300 140 16 3 0 45 720 21 1 0 19
Corn Dog 210 100 11 2.5 0 35 500 20 1 6 7
Crispy Shrimp 170 70 8 1.5 0 60 560 16 1 1 9
Grilled Chicken Alfredo 720 420 46 28 1.5 190 1380 40 2 5 36
Kraft Macaroni & Cheese 300 80 9 2.5 0 10 650 44 2 8 10
Kids Side
Broccoli Trees 30 5 0 0 0 0 30 6 3 2 3
French Fries 430 180 20 3.5 0 0 960 57 4 0 5
Garlic Mashed Potatoes 130 50 6 1 0 5 320 17 2 2 2
Mott's Applesauce Cup 60 0 0 0 0 0 0 14 1 12 0
Mozzarella Sticks 330 150 16 7 0 30 1060 31 3 6 14
Sliced Strawberries with Vanilla Yogurt 100 15 1.5 1 0 5 55 17 1 16 4
Kids Drinks
1% Chocolate Milk 170 25 2.5 1.5 0 15 200 28 0 27 9
1% Milk 120 25 2.5 1.5 0 10 135 14 0 13 9
Apple Juice 100 0 0 0 0 0 15 25 0 23 0
Grape Juice 100 0 0 0 0 0 15 25 0 23 0
Lemonade 90 0 0 0 0 0 0 23 0 21 0
Orange Tangerine Juice 110 0 0 0 0 0 15 27 0 25 0
Kids Shakes
Chocolate Shake 740 270 30 19 1 110 240 110 2 85 13
Oreo Cookie Shake 710 320 35 20 1 110 340 88 1 60 13
Strawberry Shake 730 260 29 18 1 110 210 108 0 88 12
Vanilla Shake 550 260 29 18 1 110 210 63 0 46 12
Kids Sundaes
Hot Fudge Sundae 370 160 18 13 0 55 120 47 0 33 4
Oreo Sundae 370 170 19 12 0.5 50 150 46 1 30 5
Strawberry Sundae 330 120 14 9 0 50 65 48 0 40 4
Variations in ingredients and preparation, as well as substitutions, will increase or decrease any stated nutritional values. Items may vary by restaurant, may not be available at all locations, and are subject to change. Applicable only in the U.S.A. Menu items,
ingredients and preparation may differ outside the U.S.A.
Information As Of 3/4/19. Good Thru 05/19/19.
Applicable Only To The U.S.A. Document Is Subject To Updates. Please Check Back Regularly.
3/8/2019 13 of 21
Nutrition Information
The Dietary Guidelines for Americans recommend consuming less than 10 percent of calories per day from saturated fat and less than 2,300 milligrams per day of sodium for a typical adult eating 2,000 calories daily. Recommended limits may be higher or
lower depending on daily calorie consumption. Variations and substitutions will increase or decrease stated nutritional values. Nutritional information on this supplement is accurate as of the date of printing. Items listed may not be available at all restaurants.
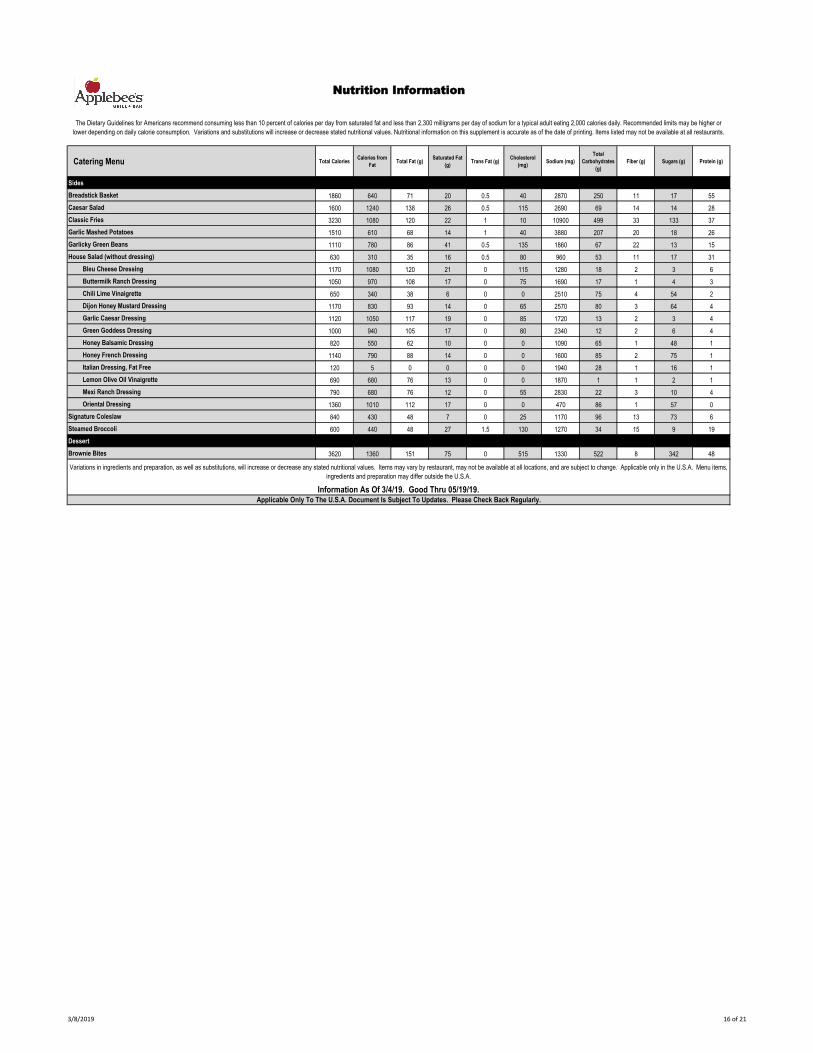
Catering Menu Total CaloriesCalories from
FatTotal Fat (g)
Saturated Fat
(g)Trans Fat (g)
Cholesterol
(mg)Sodium (mg)
Total
Carbohydrates
(g)
Fiber (g) Sugars (g) Protein (g)
Appetizers
Boneless Wings (without sauce or dressing) 3930 1800 200 38 1.5 605 9300 294 23 10 240
Classic Buffalo Sauce 990 890 99 35 0 5 12280 22 6 3 2
Honey BBQ Sauce 1180 20 2 0.5 0.5 5 4890 286 16 223 7
Sweet Asian Chile Sauce 1340 100 11 2 0.5 5 8090 294 10 114 16
Bleu Cheese Dressing 1170 1080 120 21 0 115 1280 18 2 3 6
Ranch Dressing 1050 970 108 17 0 75 1690 17 1 4 3
Chicken Tenders 4160 2240 249 43 1 490 9780 288 16 69 191
Chips & Salsa 3680 1470 163 29 2 10 12720 503 47 34 55
Double Crunch Bone In Wings (without sauce or dressing) 2230 1200 133 31 1 980 4990 45 9 6 215
Classic Buffalo Sauce 490 440 49 18 0 0 6140 11 3 1 1
Honey BBQ Sauce 590 10 1 0 0 5 2440 143 8 112 4
Sweet Asian Chile Sauce 670 50 6 1 0 5 4040 147 5 57 8
Bleu Cheese Dressing 1170 1080 120 21 0 115 1280 18 2 3 6
Ranch Dressing 1050 970 108 17 0 75 1690 17 1 4 3
Mozzarella Sticks 5120 2370 263 110 6 460 15740 462 36 87 228
Spinach & Artichoke Dip 5140 2740 305 80 3 125 13480 504 36 25 96
The Classic Combo (without sauce or dressing) 12860 6560 729 236 9 1110 34390 1103 81 90 476
Classic Buffalo Sauce 490 440 49 18 0 0 6140 11 3 1 1
Honey BBQ Sauce 590 10 1 0 0 5 2440 143 8 112 4
Sweet Asian Chile Sauce 670 50 6 1 0 5 4040 147 5 57 8
Bleu Cheese Dressing 1170 1080 120 21 0 115 1280 18 2 3 6
Ranch Dressing 1050 970 108 17 0 75 1690 17 1 4 3
Entrees
Applebee's Riblets (without sauce) 6930 3660 407 125 2.5 1715 9510 339 42 120 485
Texas Style BBQ Sauce 2960 230 25 14 1.5 15 7240 670 16 387 11
Honey BBQ Sauce 2800 45 5 1.5 1.5 15 11610 680 39 530 17
Chef Bulgarelli's Stuffed Rigatoni & Meat Sauce 5290 1770 196 91 6 610 14310 617 79 71 285
Classic Blackened Shrimp Alfredo 7940 4840 538 337 17 2200 17120 489 38 69 307
Classic Broccoli Chicken Alfredo 8400 4930 548 341 17 2175 17170 485 38 69 403
Chicken Wonton Stir Fry 4060 830 92 18 2 555 13420 592 31 135 222
Double-Glazed Baby Back Ribs (without sauce) 7090 4230 470 163 2.5 1755 7550 306 39 95 421
Texas Style BBQ Sauce 1400 110 12 7 0.5 5 3430 318 7 183 5
Honey BBQ Sauce 1320 20 2.5 1 1 10 5500 322 18 251 8
Fiesta Lime Chicken 6710 3280 365 85 3.5 1110 22950 532 40 53 337
Four-Cheese Mac & Cheese with Honey Pepper Chicken Tenders 8330 3600 400 174 10 1100 18450 827 37 278 368
Shrimp Wonton Stir Fry 3590 730 81 15 2 585 12920 595 31 134 126
Three-Cheese Chicken Penne 6670 3600 400 246 13 1710 14060 429 30 55 350
Applicable Only To The U.S.A. Document Is Subject To Updates. Please Check Back Regularly.
Variations in ingredients and preparation, as well as substitutions, will increase or decrease any stated nutritional values. Items may vary by restaurant, may not be available at all locations, and are subject to change. Applicable only in the U.S.A. Menu items,
ingredients and preparation may differ outside the U.S.A.
Information As Of 3/4/19. Good Thru 05/19/19.
3/8/2019 14 of 21
Nutrition Information
The Dietary Guidelines for Americans recommend consuming less than 10 percent of calories per day from saturated fat and less than 2,300 milligrams per day of sodium for a typical adult eating 2,000 calories daily. Recommended limits may be higher or
lower depending on daily calorie consumption. Variations and substitutions will increase or decrease stated nutritional values. Nutritional information on this supplement is accurate as of the date of printing. Items listed may not be available at all restaurants.
Catering Menu Total CaloriesCalories from
FatTotal Fat (g)
Saturated Fat
(g)Trans Fat (g)
Cholesterol
(mg)Sodium (mg)
Total
Carbohydrates
(g)
Fiber (g) Sugars (g) Protein (g)
Salads
Grilled Chicken Caesar Salad 4220 2560 285 51 1.5 995 10770 151 40 35 280
Oriental Chicken Salad (with Crispy Chicken) 7990 4870 541 84 1 345 8540 602 57 220 202
Oriental Chicken Salad (with Grilled Chicken) 7000 4040 448 70 1 815 10480 478 52 248 290
Southwestern Grilled Chicken Salad 5290 3270 363 89 3 1090 13630 204 47 41 315
Southwestern Steak Salad 4960 3350 372 95 3.5 650 10430 201 45 39 215
Sandwiches
Chicken Fajita Rollup 6340 3440 383 158 5 1215 20350 385 29 49 348
Clubhouse Grilled 6250 3240 360 106 4 720 16120 460 23 143 301
Double Bacon Chicken Sandwich 5340 2610 290 101 2 1355 13830 295 19 61 389
Beverages (1 Gallon)
Brewed Iced Tea 60 0 0 0 0 0 75 18 3 3 0
Sweet Tea 4800 0 0 0 0 0 75 1241 0 1230 0
Kiwi Iced Tea 730 0 0 0 0 0 70 179 3 159 0
Mango Iced Tea 870 0 0 0 0 0 70 219 3 195 0
Pomegranate Iced Tea 770 15 1.5 0 0 0 105 193 3 166 0
Raspberry Iced Tea 830 0 0 0 0 0 70 198 3 181 0
Classic Lemonade 1600 0 0 0 0 0 1680 432 0 432 0
Kiwi Lemonade 2170 0 0 0 0 0 1580 566 0 562 0
Mango Lemonade 2320 0 0 0 0 0 1580 607 0 598 0
Pomegranate Lemonade 2220 15 1.5 0 0 0 1610 581 0 569 0
Raspberry Lemonade 2280 0 0 0 0 0 1580 586 0 584 0
Coca Cola 1580 0 0 0 0 0 40 433 0 433 0
Coke Zero 10 0 0 0 0 0 60 1 0 1 1
Diet Coke 10 0 0 0 0 0 150 0 0 0 0
Diet Mountain Dew 0 0 0 0 0 0 640 0 0 0 0
Diet Pepsi 0 0 0 0 0 0 640 0 0 0 0
Dr. Pepper 1560 0 0 0 0 0 520 424 0 410 0
Fruit Punch 1760 0 0 0 0 0 400 480 0 480 0
Lipton Green Tea with Citrus 1120 0 0 0 0 0 1040 304 0 304 0
Mellow Yellow 1700 0 0 0 0 0 120 435 0 435 0
Minute Maid Lemonade 1530 0 0 0 0 0 710 432 0 393 0
Mountain Dew 1760 0 0 0 0 0 640 496 0 496 0
Mug Root Beer 1600 0 0 0 0 0 240 416 0 416 0
Pepsi 1600 0 0 0 0 0 320 448 0 448 0
Sierra Mist 1600 0 0 0 0 0 320 432 0 432 0
Sprite 1540 0 0 0 0 0 350 394 0 394 0
Wild Cherry Pepsi 1600 0 0 0 0 0 320 448 0 448 0
Applicable Only To The U.S.A. Document Is Subject To Updates. Please Check Back Regularly.
Variations in ingredients and preparation, as well as substitutions, will increase or decrease any stated nutritional values. Items may vary by restaurant, may not be available at all locations, and are subject to change. Applicable only in the U.S.A. Menu items,
ingredients and preparation may differ outside the U.S.A.
Information As Of 3/4/19. Good Thru 05/19/19.
3/8/2019 15 of 21
Nutrition Information
The Dietary Guidelines for Americans recommend consuming less than 10 percent of calories per day from saturated fat and less than 2,300 milligrams per day of sodium for a typical adult eating 2,000 calories daily. Recommended limits may be higher or
lower depending on daily calorie consumption. Variations and substitutions will increase or decrease stated nutritional values. Nutritional information on this supplement is accurate as of the date of printing. Items listed may not be available at all restaurants.
Catering Menu Total CaloriesCalories from
FatTotal Fat (g)
Saturated Fat
(g)Trans Fat (g)
Cholesterol
(mg)Sodium (mg)
Total
Carbohydrates
(g)
Fiber (g) Sugars (g) Protein (g)
Sides
Breadstick Basket 1860 640 71 20 0.5 40 2870 250 11 17 55
Caesar Salad 1600 1240 138 26 0.5 115 2690 69 14 14 28
Classic Fries 3230 1080 120 22 1 10 10900 499 33 133 37
Garlic Mashed Potatoes 1510 610 68 14 1 40 3880 207 20 18 26
Garlicky Green Beans 1110 780 86 41 0.5 135 1860 67 22 13 15
House Salad (without dressing) 630 310 35 16 0.5 80 960 53 11 17 31
Bleu Cheese Dressing 1170 1080 120 21 0 115 1280 18 2 3 6
Buttermilk Ranch Dressing 1050 970 108 17 0 75 1690 17 1 4 3
Chili Lime Vinaigrette 650 340 38 6 0 0 2510 75 4 54 2
Dijon Honey Mustard Dressing 1170 830 93 14 0 65 2570 80 3 64 4
Garlic Caesar Dressing 1120 1050 117 19 0 85 1720 13 2 3 4
Green Goddess Dressing 1000 940 105 17 0 80 2340 12 2 6 4
Honey Balsamic Dressing 820 550 62 10 0 0 1090 65 1 48 1
Honey French Dressing 1140 790 88 14 0 0 1600 85 2 75 1
Italian Dressing, Fat Free 120 5 0 0 0 0 1940 28 1 16 1
Lemon Olive Oil Vinaigrette 690 680 76 13 0 0 1870 1 1 2 1
Mexi Ranch Dressing 790 680 76 12 0 55 2830 22 3 10 4
Oriental Dressing 1360 1010 112 17 0 0 470 86 1 57 0
Signature Coleslaw 840 430 48 7 0 25 1170 96 13 73 6
Steamed Broccoli 600 440 48 27 1.5 130 1270 34 15 9 19
Dessert
Brownie Bites 3620 1360 151 75 0 515 1330 522 8 342 48
Applicable Only To The U.S.A. Document Is Subject To Updates. Please Check Back Regularly.
Variations in ingredients and preparation, as well as substitutions, will increase or decrease any stated nutritional values. Items may vary by restaurant, may not be available at all locations, and are subject to change. Applicable only in the U.S.A. Menu items,
ingredients and preparation may differ outside the U.S.A.
Information As Of 3/4/19. Good Thru 05/19/19.
3/8/2019 16 of 21

Nutrition Information
The Dietary Guidelines for Americans recommend consuming less than 10 percent of calories per day from saturated fat and less than 2,300 milligrams per day of sodium for a typical adult eating 2,000 calories daily. Recommended limits may be higher or
lower depending on daily calorie consumption. Variations and substitutions will increase or decrease stated nutritional values. Nutritional information on this supplement is accurate as of the date of printing. Items listed may not be available at all restaurants.
Beverages Total CaloriesCalories from
FatTotal Fat (g)
Saturated Fat
(g)Trans Fat (g)
Cholesterol
(mg)Sodium (mg)
Total
Carbohydrates
(g)
Fiber (g) Sugars (g) Protein (g)
Lemonade/Iced Tea Quenchers
Blackberry Lemonade Quencher 190 0 0 0 0 0 0 51 1 46 0
Strawberry Lemonade Quencher 190 0 0 0 0 0 0 50 1 46 0
Blackberry Iced Tea Quencher 160 0 0 0 0 0 10 37 1 37 0
Peach Iced Tea Quencher 230 0 0 0 0 0 20 57 1 55 0
Flavored Lemonades
Kiwi Lemonade 180 0 0 0 0 0 0 47 0 43 0
Mango Lemonade 190 0 0 0 0 0 0 49 0 45 0
Pomegranate Lemonade 180 0 0 0 0 0 0 48 0 43 0
Raspberry Lemonade 190 0 0 0 0 0 0 48 0 44 0
Frozen Lemonades
Classic Frozen Lemonade 250 0 0 0 0 0 10 62 6 49 1
Mango Frozen Lemonade 290 0 0 0 0 0 10 73 6 59 1
Strawberry Frozen Lemonade 340 0 0 0 0 0 10 84 6 70 1
Wildberry Frozen Lemonade 300 0 0 0 0 0 10 75 6 59 1
Flavored Iced Teas
Kiwi Iced Tea 45 0 0 0 0 0 5 11 0 11 0
Mango Iced Tea 60 0 0 0 0 0 5 13 0 13 0
Pomegranate Iced Tea 50 0 0 0 0 0 10 12 0 11 0
Raspberry Iced Tea 50 0 0 0 0 0 5 12 0 12 0
Peach Iced Tea 50 0 0 0 0 0 5 13 0 13 0
Strawberry Iced Tea 50 0 0 0 0 0 10 12 0 11 0
Signature Sodas
Pomegranate Sparkler 180 0 0 0 0 0 45 48 0 46 0
Winter Dew 170 0 0 0 0 0 25 44 0 42 0
Decadent Shakes
Chocolate Shake 910 340 38 24 1.5 140 300 130 2 100 17
Oreo Cookie Shake 930 410 46 26 1.5 140 450 116 1 79 18
Vanilla Shake 730 330 37 23 1.5 140 280 83 0 61 16
Strawberry Shake 890 330 37 23 1.5 140 280 128 0 102 16
Tea & Coffee
Brewed Iced Tea 0 0 0 0 0 0 5 1 0 1 0
Sweet Tea 300 0 0 0 0 0 0 78 0.33 77 0
Hot Tea 0 0 0 0 0 0 5 1 0 0 0
Fresh Brewed Decaf Coffee 0 0 0 0 0 0 0 0 0 0 0
Fresh Brewed Coffee 0 0 0 0 0 0 0 0 0 0 0
Energy Drinks
Red Bull 110 0 0 0 0 0 105 28 0 27 0
Red Bull, Blue Edition 110 0 0 0 0 0 105 28 0 27 0
Red Bull, Orange Edition 160 0 0 0 0 0 100 40 0 38 1
Red Bull, Green Edition 160 0 0 0 0 0 100 40 0 38 0
Red Bull, Red Edition 110 0 0 0 0 0 105 28 0 27 0
Red Bull, Sugar Free 5 0 0 0 0 0 105 3 0 0 0
Red Bull, Yellow Edition 120 0 0 0 0 0 140 29 0 28 0
Variations in ingredients and preparation, as well as substitutions, will increase or decrease any stated nutritional values. Items may vary by restaurant, may not be available at all locations, and are subject to change. Applicable only in the U.S.A. Menu items,
ingredients and preparation may differ outside the U.S.A.
Information As Of 3/4/19. Good Thru 05/19/19.Applicable Only To The U.S.A. Document Is Subject To Updates. Please Check Back Regularly.
3/8/2019 17 of 21
Nutrition Information
The Dietary Guidelines for Americans recommend consuming less than 10 percent of calories per day from saturated fat and less than 2,300 milligrams per day of sodium for a typical adult eating 2,000 calories daily. Recommended limits may be higher or
lower depending on daily calorie consumption. Variations and substitutions will increase or decrease stated nutritional values. Nutritional information on this supplement is accurate as of the date of printing. Items listed may not be available at all restaurants.
Beverages Total CaloriesCalories from
FatTotal Fat (g)
Saturated Fat
(g)Trans Fat (g)
Cholesterol
(mg)Sodium (mg)
Total
Carbohydrates
(g)
Fiber (g) Sugars (g) Protein (g)
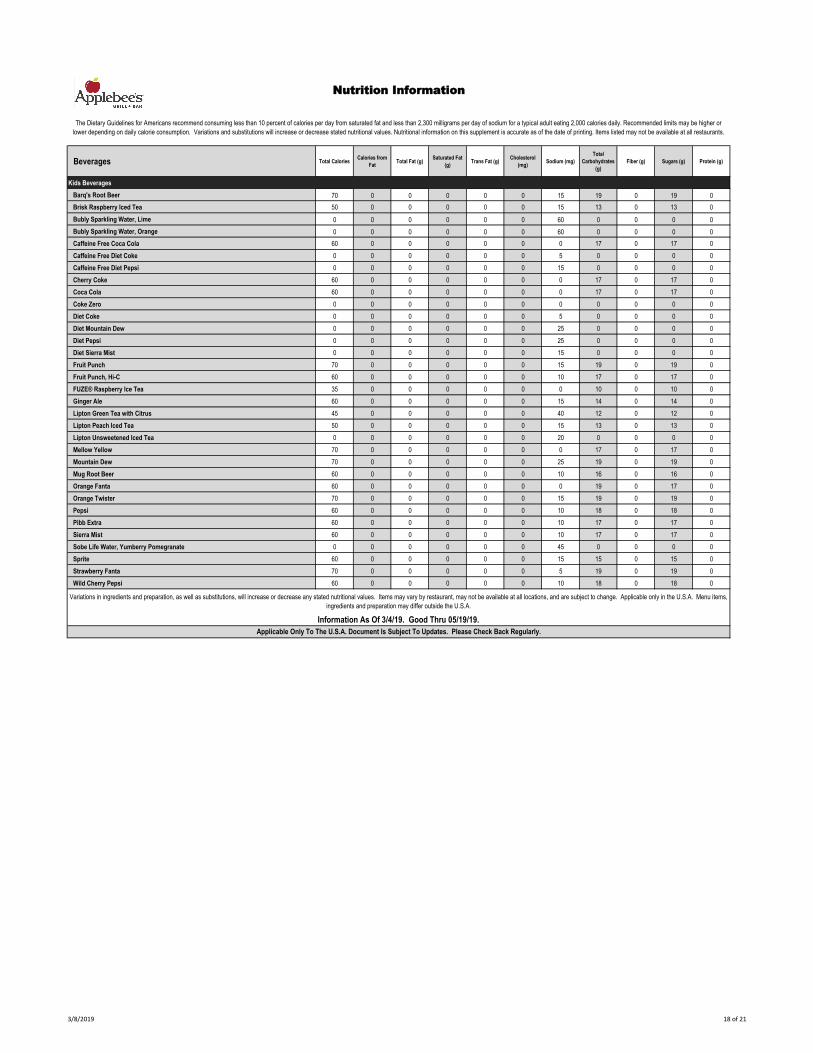
Kids Beverages
Barq's Root Beer 70 0 0 0 0 0 15 19 0 19 0
Brisk Raspberry Iced Tea 50 0 0 0 0 0 15 13 0 13 0
Bubly Sparkling Water, Lime 0 0 0 0 0 0 60 0 0 0 0
Bubly Sparkling Water, Orange 0 0 0 0 0 0 60 0 0 0 0
Caffeine Free Coca Cola 60 0 0 0 0 0 0 17 0 17 0
Caffeine Free Diet Coke 0 0 0 0 0 0 5 0 0 0 0
Caffeine Free Diet Pepsi 0 0 0 0 0 0 15 0 0 0 0
Cherry Coke 60 0 0 0 0 0 0 17 0 17 0
Coca Cola 60 0 0 0 0 0 0 17 0 17 0
Coke Zero 0 0 0 0 0 0 0 0 0 0 0
Diet Coke 0 0 0 0 0 0 5 0 0 0 0
Diet Mountain Dew 0 0 0 0 0 0 25 0 0 0 0
Diet Pepsi 0 0 0 0 0 0 25 0 0 0 0
Diet Sierra Mist 0 0 0 0 0 0 15 0 0 0 0
Fruit Punch 70 0 0 0 0 0 15 19 0 19 0
Fruit Punch, Hi-C 60 0 0 0 0 0 10 17 0 17 0
FUZE® Raspberry Ice Tea 35 0 0 0 0 0 0 10 0 10 0
Ginger Ale 60 0 0 0 0 0 15 14 0 14 0
Lipton Green Tea with Citrus 45 0 0 0 0 0 40 12 0 12 0
Lipton Peach Iced Tea 50 0 0 0 0 0 15 13 0 13 0
Lipton Unsweetened Iced Tea 0 0 0 0 0 0 20 0 0 0 0
Mellow Yellow 70 0 0 0 0 0 0 17 0 17 0
Mountain Dew 70 0 0 0 0 0 25 19 0 19 0
Mug Root Beer 60 0 0 0 0 0 10 16 0 16 0
Orange Fanta 60 0 0 0 0 0 0 19 0 17 0
Orange Twister 70 0 0 0 0 0 15 19 0 19 0
Pepsi 60 0 0 0 0 0 10 18 0 18 0
Pibb Extra 60 0 0 0 0 0 10 17 0 17 0
Sierra Mist 60 0 0 0 0 0 10 17 0 17 0
Sobe Life Water, Yumberry Pomegranate 0 0 0 0 0 0 45 0 0 0 0
Sprite 60 0 0 0 0 0 15 15 0 15 0
Strawberry Fanta 70 0 0 0 0 0 5 19 0 19 0
Wild Cherry Pepsi 60 0 0 0 0 0 10 18 0 18 0
Variations in ingredients and preparation, as well as substitutions, will increase or decrease any stated nutritional values. Items may vary by restaurant, may not be available at all locations, and are subject to change. Applicable only in the U.S.A. Menu items,
ingredients and preparation may differ outside the U.S.A.
Information As Of 3/4/19. Good Thru 05/19/19.
Applicable Only To The U.S.A. Document Is Subject To Updates. Please Check Back Regularly.
3/8/2019 18 of 21

Nutrition Information
The Dietary Guidelines for Americans recommend consuming less than 10 percent of calories per day from saturated fat and less than 2,300 milligrams per day of sodium for a typical adult eating 2,000 calories daily. Recommended limits may be higher or
lower depending on daily calorie consumption. Variations and substitutions will increase or decrease stated nutritional values. Nutritional information on this supplement is accurate as of the date of printing. Items listed may not be available at all restaurants.
Beverages Total CaloriesCalories from
FatTotal Fat (g)
Saturated Fat
(g)Trans Fat (g)
Cholesterol
(mg)Sodium (mg)
Total
Carbohydrates
(g)
Fiber (g) Sugars (g) Protein (g)
16 fl oz Beverages
Barq's Root Beer 110 0 0 0 0 0 20 30 0 30 0
Brisk Raspberry Iced Tea 80 0 0 0 0 0 25 21 0 21 0
Bubly Sparkling Water, Lime 0 0 0 0 0 0 95 0 0 0 0
Bubly Sparkling Water, Orange 0 0 0 0 0 0 95 0 0 0 0
Caffeine Free Coca Cola 100 0 0 0 0 0 0 27 0 27 0
Caffeine Free Diet Coke 0 0 0 0 0 0 10 0 0 0 0
Caffeine Free Diet Pepsi 0 0 0 0 0 0 25 0 0 0 0
Cherry Coke 100 0 0 0 0 0 0 27 0 27 0
Coca Cola 100 0 0 0 0 0 0 27 0 27 0
Coke Zero 0 0 0 0 0 0 0 0 0 0 0
Diet Coke 0 0 0 0 0 0 10 0 0 0 0
Diet Mountain Dew 0 0 0 0 0 0 40 0 0 0 0
Diet Pepsi 0 0 0 0 0 0 40 0 0 0 0
Diet Sierra Mist 0 0 0 0 0 0 25 0 0 0 0
Dr. Pepper 100 0 0 0 0 0 30 27 0 26 0
Fruit Punch 110 0 0 0 0 0 25 30 0 30 0
Fruit Punch, Hi-C 100 0 0 0 0 0 10 27 0 27 0
FUZE® Raspberry Ice Tea 60 0 0 0 0 0 5 15 0 15 0
Ginger Ale 90 0 0 0 0 0 20 23 0 23 0
Half & Half Iced Tea & Lemonade 40 0 0 0 0 0 25 11 0 11 0
IBC Diet Root Beer 0 0 0 0 0 0 0 0 0 0 0
IBC Root Beer 110 0 0 0 0 0 40 27 0 26 0
Lipton Green Tea with Citrus 70 0 0 0 0 0 65 19 0 19 0
Lipton Peach Iced Tea 80 0 0 0 0 0 25 21 0 21 0
Lipton Unsweetened Iced Tea 0 0 0 0 0 0 30 0 0 0 0
Mellow Yellow 110 0 0 0 0 0 5 27 0 27 0
Mountain Dew 110 0 0 0 0 0 40 31 0 31 0
Mug Root Beer 100 0 0 0 0 0 15 26 0 26 0
Orange Fanta 100 0 0 0 0 0 0 30 0 27 0
Orange Twister 110 0 0 0 0 0 25 31 0 30 0
Pepsi 100 0 0 0 0 0 20 28 0 28 0
Pibb Extra 100 0 0 0 0 0 15 27 0 27 0
Sierra Mist 100 0 0 0 0 0 20 27 0 27 0
Sobe Life Water, Yumberry Pomegranate 0 0 0 0 0 0 70 0 0 0 0
Sprite 100 0 0 0 0 0 20 25 0 25 0
Strawberry Fanta 110 0 0 0 0 0 10 31 0 31 0
Sugar Free Lemonade 5 0 0 0 0 0 95 0 0 0 0
Sun Orchard Lemonade 140 0 0 0 0 0 0 37 0 33 0
Tropicana Lemonade 100 0 0 0 0 0 105 27 0 27 0
Tropicana Pink Lemonade 100 0 0 0 0 0 105 27 0 27 0
Wild Cherry Pepsi 100 0 0 0 0 0 20 28 0 28 0
Variations in ingredients and preparation, as well as substitutions, will increase or decrease any stated nutritional values. Items may vary by restaurant, may not be available at all locations, and are subject to change. Applicable only in the U.S.A. Menu items,
ingredients and preparation may differ outside the U.S.A.
Information As Of 3/4/19. Good Thru 05/19/19.
Applicable Only To The U.S.A. Document Is Subject To Updates. Please Check Back Regularly.
3/8/2019 19 of 21

Nutrition Information
The Dietary Guidelines for Americans recommend consuming less than 10 percent of calories per day from saturated fat and less than 2,300 milligrams per day of sodium for a typical adult eating 2,000 calories daily. Recommended limits may be higher or
lower depending on daily calorie consumption. Variations and substitutions will increase or decrease stated nutritional values. Nutritional information on this supplement is accurate as of the date of printing. Items listed may not be available at all restaurants.
Beverages Total CaloriesCalories from
FatTotal Fat (g)
Saturated Fat
(g)Trans Fat (g)
Cholesterol
(mg)Sodium (mg)
Total
Carbohydrates
(g)
Fiber (g) Sugars (g) Protein (g)
30 fl oz Lemonade/Iced Tea Quenchers
Blackberry Lemonade Quencher 290 0 0 0 0 0 0 75 1 69 0
Strawberry Lemonade Quencher 280 0 0 0 0 0 0 74 1 68 1
Blackberry Iced Tea Quencher 200 0 0 0 0 0 10 49 1 48 0
Peach Iced Tea Quencher 290 0 0 0 0 0 20 69 1 67 0
30 fl oz Flavored Lemonades
Kiwi Lemonade 270 0 0 0 0 0 0 70 0 65 0
Mango Lemonade 280 0 0 0 0 0 0 74 0 68 0
Pomegranate Lemonade 270 0 0 0 0 0 0 72 0 65 0
Raspberry Lemonade 280 0 0 0 0 0 0 72 0 67 0
30 fl oz Iced Teas
Brewed Iced Tea 5 0 0 0 0 0 10 1 0 1 0
Sweet Tea 450 0 0 0 0 0 10 116 0 116 0
Kiwi Iced Tea 70 0 0 0 0 0 10 16 0 16 0
Mango Iced Tea 80 0 0 0 0 0 10 20 0 19 0
Pomegranate Iced Tea 70 0 0 0 0 0 15 17 0 17 0
Raspberry Iced Tea 80 0 0 0 0 0 10 18 0 18 0
Peach Iced Tea 80 0 0 0 0 0 10 19 0 20 0
Strawberry Iced Tea 70 0 0 0 0 0 10 18 0 17 0
30 fl oz Signature Sodas
Pomegranate Sparkler 240 0 0 0 0 0 60 65 0 63 0
Winter Dew 230 0 0 0 0 0 30 59 0 58 0
30 fl oz Fountain Drinks
Barq's Root Beer 160 0 0 0 0 0 35 45 0 45 0
Brisk Raspberry Iced Tea 120 0 0 0 0 0 40 32 0 32 0
Bubly Sparkling Water, Lime 0 0 0 0 0 0 140 0 0 0 0
Bubly Sparkling Water, Orange 0 0 0 0 0 0 140 0 0 0 0
Caffeine Free Coca Cola 150 0 0 0 0 0 0 41 0 41 0
Caffeine Free Diet Coke 0 0 0 0 0 0 15 0 0 0 0
Caffeine Free Diet Pepsi 0 0 0 0 0 0 40 0 0 0 0
Cherry Coke 160 0 0 0 0 0 5 41 0 41 0
Coca Cola 150 0 0 0 0 0 0 41 0 41 0
Coke Zero 0 0 0 0 0 0 5 0 0 0 0
Diet Coke 0 0 0 0 0 0 15 0 0 0 0
Diet Mountain Dew 0 0 0 0 0 0 60 0 0 0 0
Diet Pepsi 0 0 0 0 0 0 60 0 0 0 0
Diet Sierra Mist 0 0 0 0 0 0 35 0 0 0 0
Fruit Punch 160 0 0 0 0 0 40 45 0 45 0
Fruit Punch, Hi-C 160 0 0 0 0 0 20 41 0 41 0
FUZE® Raspberry Ice Tea 90 0 0 0 0 0 10 23 0 23 0
Ginger Ale 140 0 0 0 0 0 30 35 0 35 0
Half & Half Iced Tea & Lemonade 60 0 0 0 0 0 40 17 0 17 0
Lipton Green Tea with Citrus 110 0 0 0 0 0 100 29 0 29 0
Lipton Peach Iced Tea 120 0 0 0 0 0 40 32 0 32 0
Lipton Unsweetened Iced Tea 0 0 0 0 0 0 45 0 0 0 0
Mellow Yellow 160 0 0 0 0 0 10 41 0 41 0
Mountain Dew 160 0 0 0 0 0 60 47 0 47 0
Mug Root Beer 150 0 0 0 0 0 25 39 0 39 0
Orange Fanta 160 0 0 0 0 0 5 45 0 41 0
Orange Twister 160 0 0 0 0 0 40 47 0 45 0
Pepsi 150 0 0 0 0 0 30 42 0 42 0
Pibb Extra 140 0 0 0 0 0 20 41 0 41 0
Sierra Mist 150 0 0 0 0 0 30 41 0 41 0
Sobe Life Water, Yumberry Pomegranate 0 0 0 0 0 0 110 0 0 0 0
Sprite 140 0 0 0 0 0 35 37 0 37 0
Strawberry Fanta 170 0 0 0 0 0 15 47 0 47 0
Sugar Free Lemonade 10 0 0 0 0 0 140 0 0 0 0
Sun Orchard Lemonade 210 0 0 0 0 0 0 55 0 50 0
Tropicana Lemonade 150 0 0 0 0 0 160 41 0 41 0
Tropicana Pink Lemonade 150 0 0 0 0 0 160 41 0 41 0
Wild Cherry Pepsi 150 0 0 0 0 0 30 42 0 42 0
Applicable Only To The U.S.A. Document Is Subject To Updates. Please Check Back Regularly.
Variations in ingredients and preparation, as well as substitutions, will increase or decrease any stated nutritional values. Items may vary by restaurant, may not be available at all locations, and are subject to change. Applicable only in the U.S.A. Menu items,
ingredients and preparation may differ outside the U.S.A.
Information As Of 3/4/19. Good Thru 05/19/19.
3/8/2019 20 of 21

Nutrition Information
The Dietary Guidelines for Americans recommend consuming less than 10 percent of calories per day from saturated fat and less than 2,300 milligrams per day of sodium for a typical adult eating 2,000 calories daily. Recommended limits may be higher or
lower depending on daily calorie consumption. Variations and substitutions will increase or decrease stated nutritional values. Nutritional information on this supplement is accurate as of the date of printing. Items listed may not be available at all restaurants.
Cocktails Total CaloriesCalories from
FatTotal Fat (g)
Saturated Fat
(g)Trans Fat (g)
Cholesterol
(mg)Sodium (mg)
Total
Carbohydrates
(g)
Fiber (g) Sugars (g) Protein (g)
Margaritas
Blue Agave 'Rita, Rocks 190 0 0 0 0 0 350 27 0 24 0
Blue Agave ' Rita, Rocks, Mucho 270 0 0 0 0 0 360 34 0 30 0
MangoBerry SwirlaRita, Mucho 360 0 0 0 0 0 35 56 1 50 0
Perfect Cosmo 300 0 0 0 0 0 20 38 1 35 0
Perfect Margarita 310 0 0 0 0 0 310 41 1 32 0
Perfect Patron Margarita 310 0 0 0 0 0 310 44 1 39 0
Sangrias
Apple Sangria 220 0 0 0 0 0 10 37 1 25 0
White Peach Sangria, Mucho (Barefoot) 280 0 0 0 0 0 15 48 1 42 1
White Peach Sangria, Mucho (Bella Sera) 290 0 0 0 0 0 15 42 1 34 1
Rum
Captain Morgan Bahama Mama 240 0 0 0 0 0 5 34 0 33 0
Captain Morgan Bahama Mama, Mucho 280 0 0 0 0 0 10 41 0 40 0
Whiskey
Pair of Jacks 220 0 0 0 0 0 10 26 0 24 0
Long Island Iced Teas
Blue Hawaiian Long Island Iced Tea 210 0 0 0 0 0 10 26 0 22 0
Blue Hawaiian Long Island Iced Tea, Mucho 240 0 0 0 0 0 15 31 0 26 0
Top Shelf LIT 170 0 0 0 0 0 10 15 0 12 0
Top Shelf LIT, Mucho 220 0 0 0 0 0 15 23 0 19 0
Beverage Menu
Bourbon & Berries 160 0 0 0 0 0 5 17 0 16 0
Irish Peach Sour 230 0 0 0 0 0 0 26 0 24 0
Margarita/Blue Agave ' Rita, Rocks - Mango 200 0 0 0 0 0 40 30 0 26 0
Margarita/Blue Agave ' Rita, Rocks, Mucho - Mango 280 0 0 0 0 0 50 36 1 33 0
Margarita/Blue Agave ' Rita, Rocks, - Strawberry 220 0 0 0 0 0 40 35 0 32 0
Margarita/Blue Agave ' Rita, Rocks, Mucho - Strawberry 310 0 0 0 0 0 50 45 0 40 0
Perfect Pomegranate Margarita 360 0 0 0 0 0 15 54 1 44 0
Raspberry Cosmo 230 0 0 0 0 0 10 31 1 30 0
Variations in ingredients and preparation, as well as substitutions, will increase or decrease any stated nutritional values. Items may vary by restaurant, may not be available at all locations, and are subject to change. Applicable only in the U.S.A. Menu items,
ingredients and preparation may differ outside the U.S.A.
Information As Of 3/4/19. Good Thru 05/19/19.
Applicable Only To The U.S.A. Document Is Subject To Updates. Please Check Back Regularly.
3/8/2019 21 of 21