Apple Computer, Inc. Annual Profit Plan MNGT 3280 Alex Milovic.
34
Apple Computer, Inc. Annual Profit Plan MNGT 3280 Alex Milovic
-
Upload
naomi-stephens -
Category
Documents
-
view
218 -
download
0
Transcript of Apple Computer, Inc. Annual Profit Plan MNGT 3280 Alex Milovic.
Apple Computer, Inc. Annual Profit Plan
MNGT 3280Alex Milovic

Introduction History of Innovation Many changes over the last 20
years New Direction
iPod iTunes OS X Operating System

Situation Analysis Strengths
Brand Name: Known for Innovation Steve Jobs: “Forward Thinking” Market leader in MP3 Sales (59% market share) Market leader in legal music downloads (62% market
share) Cupertino, CA plant: in-house production Large amount of cash reserves ($6.5 billion) Apple on-line store, retail stores
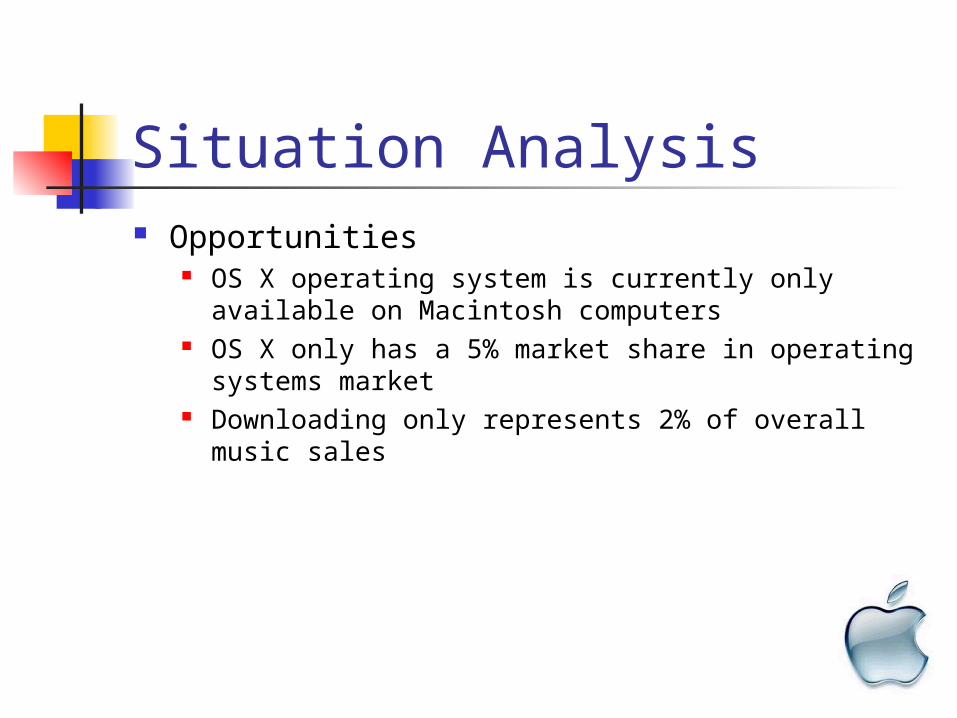
Situation Analysis Opportunities
OS X operating system is currently only available on Macintosh computers
OS X only has a 5% market share in operating systems market
Downloading only represents 2% of overall music sales
Situation Analysis Weaknesses
Many bad strategies over the last 20 years Only a 3% market share in computer sales Do not have the resources to compete head-to-head
with Microsoft
Situation Analysis Threats
OS X vs. Microsoft Napster Paying for downloads vs. piracy Licensing arrangements with music companies

MissionOur goal is to provide innovative computer
products(both hardware and software) to consumers of all ages through retail stores, online stores and through our Apple retail locations.

Objective Continue success of iPod line iTunes vs. Napster Launch OS X on all computer platforms

Operating SystemsMarket Size 2004 $55 billion
Projected 2005 $63.525 billionOperating Systems (2004 Market Share)
85%
5%
10%
Windows
OS X
Other
Operating Systems (Projected 2005 Market Share)
81%
10%
9%
Windows
OS X
Other

MP3 PlayersMarket Size 2004 $2.37 billion
Projected 2005 $5.7 billion
MP3 Players (2004 Market Share)
59%
41% iPOD
Other (Dell,Gateway, etc)
MP3 Players (2005 Projected Market Share)
70%
30%
iPOD
Other

Downloaded MusicMarket Size 2004 $1.61 billionProjected 2005 $3.765 billion
Downloaded Music (2004 Market Share)
62%
38%iTunes
Other
Downloaded Music (2005 Projected Market Share)
iTunes
Other

Competitive Analysis OS X Operating System Microsoft
Windows Apple iPod Dell Pocket DJ, Samsung,
Gateway Apple iTunes Napster, Walmart

Potential Variable Margin (per unit)
Cost Price VM OS X (Panther) $287.99 $399.99
$112.00 iPod 143.99 199.99 56.00 iTunes 0.10 0.99
0.89
Competitive/Pricing/Promotions Strategies:
OS X Offensive Strategy Windows security has been an issue Failure to come out with updated Windows Develop separate application of software
compatible with non-Macs
iPod/iTunes Defensive Strategy Block Napster’s attempt to gain market share
through subscription service Promote the iPod and iTunes as package Develop subscription service for iTunes
Product Features OS X
Increased security iLife program
bundle iWork program
bundle Frequent update
availability
iPod Several available
versions iPod iPod photo iPod mini iPod shuffle iPod U2 special
edition
Promotions/Distribution Strategies and Supporting Action Plans:
Partner with PC leader (Dell, IBM, eMachines, etc.) to offer OS X as primary operating system
Sold through major retail chains (Best Buy), Apple retail stores, online store
Targeted to consumers with focus toward age 15-50
Promotion of iLife and iWork Heavy promotion of new subscription service
for iPod and iTunes to counter Napster
Product Promotions Timeline Q1 2005:
Continue to focus on iPod advertising Print advertising: Sports Illustrated, Maxim, People,
Popular Science, Us Weekly, Runner’s World, Men’s Health
Product review in Consumer Reports Television Advertising: CBS, NBC, ABC, FOX, UPN,
WB, MTV, VH1, ESPN, TechTV, CNN, Lifetime, Oxygen, E! Entertainment
Sales force begins to sell iPods to more retail outlets

Promotions Timeline (cont.) Q2 2005
Begin advertising new iTunes subscription plan through above media
Begin advertising OS X operating system Print Advertising: PC Magazine, PC World, Computer
Edge, Computer Weekly, Computer World Product review in Consumer Reports Television Advertising: CBS, NBC, ABC, FOX, TechTV,
CNN, Bloomberg, Lifetime, E! Entertainment, Headline News, TBS
Sales force meets with retailers to propose iPod/OS X plan (reduced cost of OS X when iPods are purchased)

Promotions Timeline cont. Q3 2005
Increase advertising of iPod and OS X Q4 2005
Continue to advertise during Christmas season
Meeting between Senior Marketing and International Business interests concerning international promotion/distribution of OS X and iPod in 2006
Distribution Timeline Q1 2005:
Sales reps continue to sell iPod line to retailers Senior marketing secures shelf space for
newest lines of iPods Q2 2005
Sales reps begin to discuss OS X/iPod package Senior marketing meets with Dell management
to discuss adding OS X to online store

Distribution Timeline (cont.) Q3 2005
Sales force makes preliminary Christmas orders; communicates with Operations to ensure demand will be met
Q4 2005 Sales force makes additional
Christmas orders as necessary
Operations New Product:
OS X Operating System
Innovated Existing Product: iPod
Manufacturing/Suppliers We will add extra equipment in our
Cupertino, CA plant, as well as increase labor
Since our supply demands will increase, we must make sure our materials are available for production
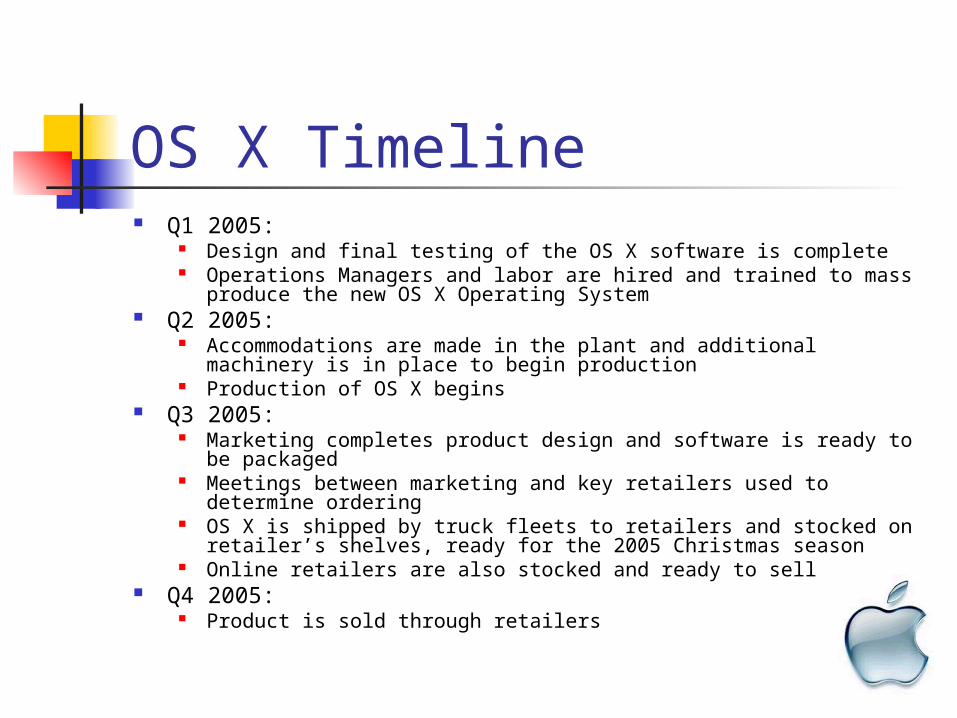
OS X Timeline Q1 2005:
Design and final testing of the OS X software is complete Operations Managers and labor are hired and trained to mass
produce the new OS X Operating System Q2 2005:
Accommodations are made in the plant and additional machinery is in place to begin production
Production of OS X begins Q3 2005:
Marketing completes product design and software is ready to be packaged
Meetings between marketing and key retailers used to determine ordering
OS X is shipped by truck fleets to retailers and stocked on retailer’s shelves, ready for the 2005 Christmas season
Online retailers are also stocked and ready to sell Q4 2005:
Product is sold through retailers
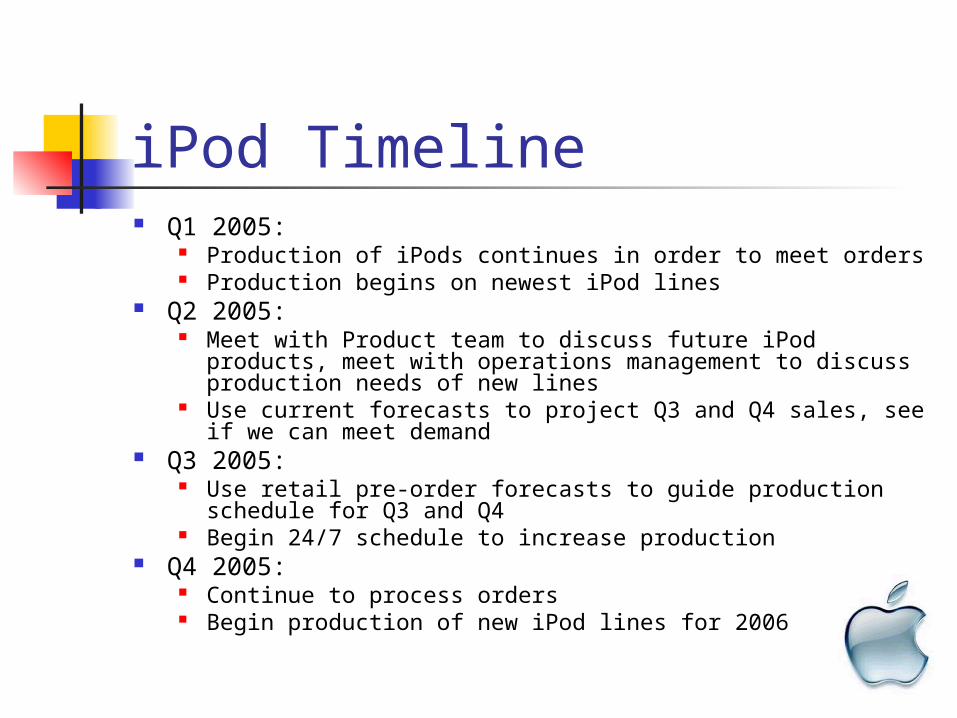
iPod Timeline Q1 2005:
Production of iPods continues in order to meet orders Production begins on newest iPod lines
Q2 2005: Meet with Product team to discuss future iPod products,
meet with operations management to discuss production needs of new lines
Use current forecasts to project Q3 and Q4 sales, see if we can meet demand
Q3 2005: Use retail pre-order forecasts to guide production schedule
for Q3 and Q4 Begin 24/7 schedule to increase production
Q4 2005: Continue to process orders Begin production of new iPod lines for 2006
Quality Control ISO 9002- quality in procurement,
production, and installation
Six-Sigma - reduces our overall defect rate
Repair/Technical Support We outsource our repair and
technical support programs Mac Service - repair work and
training. Technical support is available online
and at our Apple retail locations

Shipping/Retailers Shipping
Online customers - United Parcel Service Retailers - outsourced trucking fleet
Retailers OS X - sold everywhere computers are sold
Packaged with Dell iPod
Department stores, Discount stores, Music stores, our website

Income Statement September 2004 September 2005 % of sales % of sales Sales $8,279 100% $13,000 100% CGS 6,020 73 9,300 71.5 Gross Margin 2,259 27% 3,700 28.5% Fixed costs: SGA $1,421 17% $1,700 13.1% R/D 489 5.9 750 5.7 Other 23 .2 36 2.7 Subtotal Fixed $ 1,933 23% $ 2,486 19% EBIT $ 326 3.6% $ 1,214 9.3% Interest/Other 57 .6 77 .5 EBT $ 383 3.9% $ 1,291 .09% Tax Expense 107 1.2 361 2.7 Earnings after tax $ 276 3.3% $929 7.1%
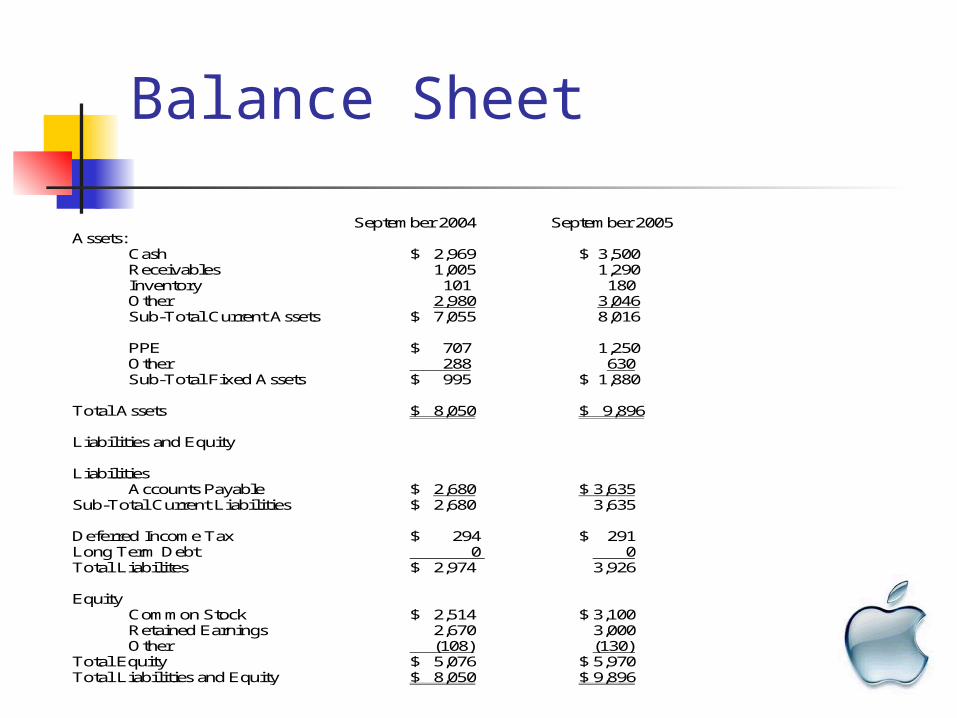
Balance Sheet
September 2004 September 2005 Assets: Cash $ 2,969 $ 3,500 Receivables 1,005 1,290 Inventory 101 180 Other 2,980 3,046
Sub-Total Current Assets $ 7,055 8,016 PPE $ 707 1,250 Other 288 630 Sub-Total Fixed Assets $ 995 $ 1,880 Total Assets $ 8,050 $ 9,896 Liabilities and Equity Liabilities Accounts Payable $ 2,680 $ 3,635 Sub-Total Current Liabilities $ 2,680 3,635 Deferred Income Tax $ 294 $ 291 Long Term Debt 0 0 Total Liabilites $ 2,974 3,926 Equity Common Stock $ 2,514 $ 3,100 Retained Earnings 2,670 3,000 Other (108) (130) Total Equity $ 5,076 $ 5,970 Total Liabilities and Equity $ 8,050 $ 9,896

Key Ratios
2004 2005
Current Ratio 2.63 2.21
Operating Income ROI 4% 12%
Total Asset turnover 1.03 1.31
Debt Ratio 0% 0%
ROE 5% 16%
ROA 3% 9%
Return on Invested Capital 6% 19%

Revenue and Gross Margin iPod/iTunes: 4.38 Billion OS X: 6.05 Billion Other: 2.57 Billion Total Sales: 13 Billion Gross Margin: 28.5%
1.5% increase from 2004Factors: more favorable pricing on certain
commodity components, higher revenue which provided for strong leveraging of fixed production costs and a more favorable mix of direct sales.
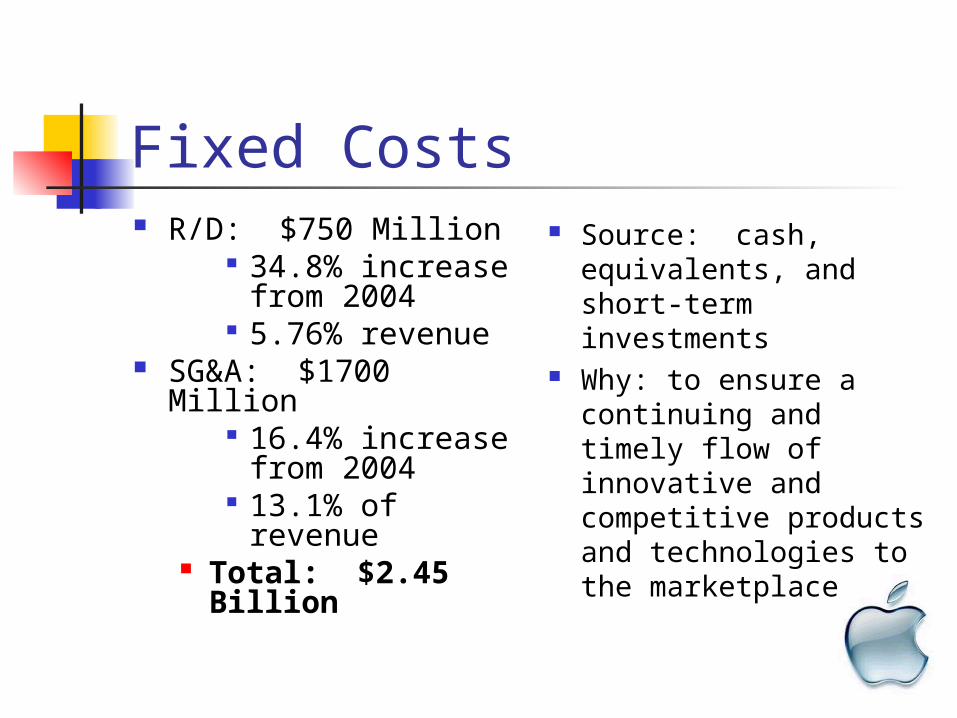
Fixed Costs R/D: $750 Million
34.8% increase from 2004
5.76% revenue SG&A: $1700 Million
16.4% increase from 2004
13.1% of revenue
Total: $2.45 Billion
Source: cash, equivalents, and short-term investments
Why: to ensure a continuing and timely flow of innovative and competitive products and technologies to the marketplace
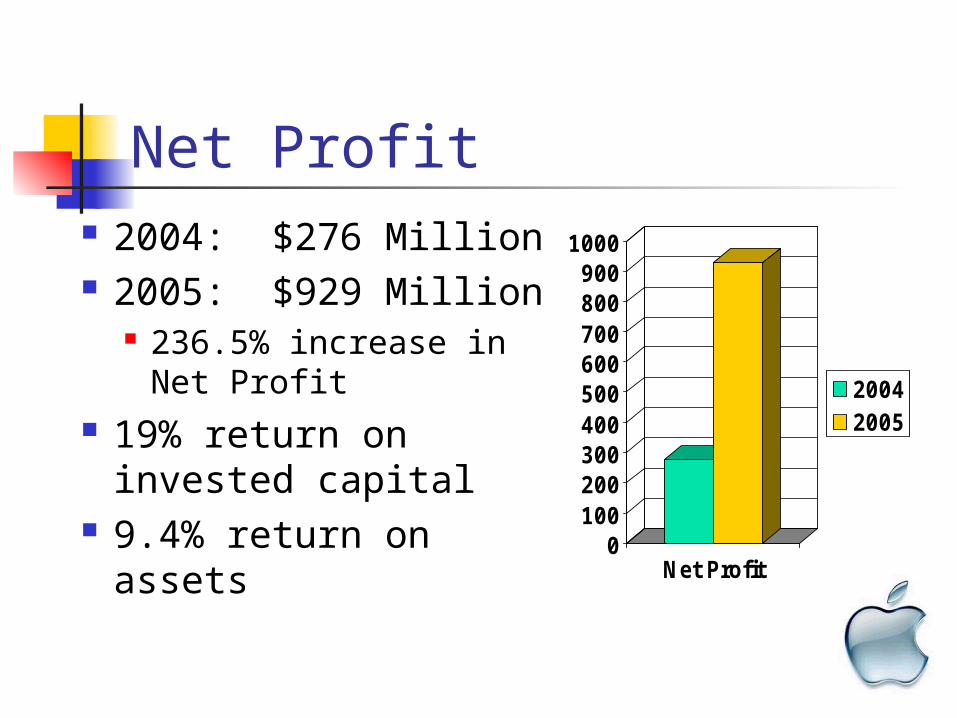
Net Profit 2004: $276 Million 2005: $929 Million
236.5% increase in Net Profit
19% return on invested capital
9.4% return on assets
0100200300400500600700800900
1000
Net Profit
20042005