Appendix Q - Energy
38
Draft Environmental Impact Statement for the Port Delfin LNG Project Deepwater Port Application Appendix Q Risknology Spill Consequence Analysis
Transcript of Appendix Q - Energy

Draft Environmental Impact Statement for the Port Delfin LNG Project Deepwater Port Application
Appendix Q
Risknology Spill Consequence Analysis

Risknology, Inc. www.risknology.com
Delfin LNG Project
Spill Consequence Analysis
A Report Prepared By
Risknology, Inc.
On Behalf Of
Delfin LNG

Delfin LNG Spill Consequence Analysis Risknology, Inc.
015-919.1-DELF-QRA-RPT-005 ii May 2016
DOCUMENT CONTROL SHEET
Title Document No.
Delfin LNG Spill Consequence Analysis 015-919.1-DELF-QRA-RPT-005
Rev Date Purpose
Prepared Checked Approved
A 1-May-15 Revision A
A Nahhas SF Conkright A Wolford
B 5-May-15 Revision B
SF Conkright A Wolford A Wolford
1 22-Oct-15 Update reflecting change in LNG Storage tank design and refined weather data
A Kiyama A Wolford A Wolford
2 30-Oct-15 Update to FLNGV liquefaction capacity
A Kiyama A Wolford A Wolford
3 29-Mar-16 Public Release Version
A Kiyama A Wolford A Wolford
4 2-May-16 Address Delfin/ USCG/ SNL Comments for Delfin Review
SF Conkright A Wolford A Wolford
5 9-May-16 Further address Delfin/ USCG/ SNL Comments
SF Conkright A Wolford A Wolford

Delfin LNG Spill Consequence Analysis Risknology, Inc.
015-919.1-DELF-QRA-RPT-005 iii May 2016
DISCLAIMER RELATING TO THIS REPORT
Neither Risknology, Inc., its employees, nor any person acting on its behalf or otherwise in furtherance of its activities in performing this contract:
1. Makes any warranty or representation, expressed or implied, with respect to the accuracy, completeness, or usefulness of the information contained herein, or that the use of any information, method, or process contained herein, may not infringe on privately owned rights; or
2. Assumes any liability with respect to the use of, or for special, incidental, or consequential damages related to or arising directly or indirectly out of the use of any information, apparatus, or process disclosed herein.
Risknology, Inc. has made every reasonable effort to perform the work contained herein in a manner consistent with high professional standards. However, the work is dependent on the accuracy of information provided by Delfin LNG. In addition, Risknology regards the work that it has done as being advisory in nature. The responsibility for use and implementation of the recommendations contained herein rests entirely with Delfin LNG.

Delfin LNG Spill Consequence Analysis Risknology, Inc.
015-919.1-DELF-QRA-RPT-005 iv May 2016
Table of Contents
Executive Summary ............................................................................................................................1
1 Introduction ...............................................................................................................................3
1.1 Guidance for Evaluating LNG Spills Over Water ........................................................................ 3
1.2 Project Background ................................................................................................................... 4
1.3 Methodology for Consequence Analysis ................................................................................... 6
2 Project Description .....................................................................................................................7
2.1 Site Description ......................................................................................................................... 7
2.2 FLNGV Description ..................................................................................................................... 9
2.3 Weather Conditions at Site ..................................................................................................... 10
3 Scenario Development .............................................................................................................. 12
3.1 Study Assumptions .................................................................................................................. 12
3.2 Dimensioning Spills .................................................................................................................. 12
3.3 LNG Spill Calculations .............................................................................................................. 13
3.4 Vapor Cloud Dispersion Modeling ........................................................................................... 13
3.5 Pool Fire Modeling .................................................................................................................. 13
4 Modeling Results ...................................................................................................................... 14
4.1 Vapor Dispersion Zone ............................................................................................................ 15
Accidental Scenarios Results ................................................................................................... 15
Intentional Scenario Results .................................................................................................... 17
Cascading Scenario Results ..................................................................................................... 19
4.2 Thermal Exclusion Zone ........................................................................................................... 21
Accidental Scenarios Results ................................................................................................... 21
Intentional Scenario Results .................................................................................................... 22
Cascading Scenario Results ..................................................................................................... 24
5 Validation and Sensitivity Analysis ............................................................................................ 26
Comparison to Sandia Results ................................................................................................. 26
Sensitivity Analysis to Weather Conditions ............................................................................. 26
6 Conclusions .............................................................................................................................. 28
Appendix A : LNG Spill Calculations............................................................................................................. 31

Delfin LNG Spill Consequence Analysis Risknology, Inc.
015-919.1-DELF-QRA-RPT-005 v May 2016
List of Tables
Table 1: Consequence Analysis for Dimensioning Scenarios ........................................................................ 2 Table 2: Distances to Platforms within 10 miles of FLNGVs ......................................................................... 8 Table 3: LNG Cargo tank capacity ............................................................................................................... 10 Table 4: Percentage of time for each wind speed and wind direction ....................................................... 11 Table 5: Flow rates and times to drain....................................................................................................... 13 Table 6: Flammability Limits for Methane at 25°C ..................................................................................... 14 Table 7: Type of damage based on heat flux .............................................................................................. 14 Table 8: LFL distances for 1 and 2 m2 single tank accidental breach .......................................................... 15 Table 9: LFL distances for intentional breach events .................................................................................. 17 Table 10: LFL distances for cascading breach events.................................................................................. 19 Table 11: Distances to flux radiation levels for accidental scenarios ......................................................... 21 Table 12: Distances to flux radiation levels for intentional scenarios ........................................................ 22 Table 13: Distances to flux radiation levels for cascading breach events .................................................. 24 Table 14: Consequence Analysis for Dimensioning Scenarios .................................................................... 29
List of Figures
Figure 1: Notional figure showing the LNG dispersion process .................................................................... 3 Figure 2: Project Location ............................................................................................................................. 5 Figure 3: Artist’s Rendering of Delfin Deepwater Port Layout ..................................................................... 5 Figure 4: Locations of platforms within 10 miles of FLNGVs ........................................................................ 8 Figure 5: Vessel Capacity Plan ....................................................................................................................... 9 Figure 6: Cross sectional view of LNG tank hold section (looking aft) ........................................................ 10 Figure 7: LFL effect zone (in blue) for accidental 2m2 single-tank breach from the FLNGVs ..................... 16 Figure 8: LFL effect zones (in blue) for intentional 16m2 single-tank breach from the FLNGVs ................. 18 Figure 9: LFL effect zones (in blue) for cascading 12m2 three-tank breach from the FLNGVs ................... 20 Figure 10: Effect zone (in blue) for 5 kW/m2 radiation contour from a pool fire caused by accidental 2m2
single-tank breach from the FLNGVs ........................................................................................... 21 Figure 11: Effect zone (in blue) for 5 kW/m2 radiation contour from a pool fire caused by intentional
16m2 single-tank breach from the FLNGVs ................................................................................. 23 Figure 12: Effect zone (in blue) for 5 kW/m2 radiation contour from a pool fire caused by cascading event
leading to a 12-m2 breach in three tanks of the FLNGVs ............................................................ 25
Delfin LNG Spill Consequence Analysis Risknology, Inc.
015-919.1-DELF-QRA-RPT-005 1 May 2016
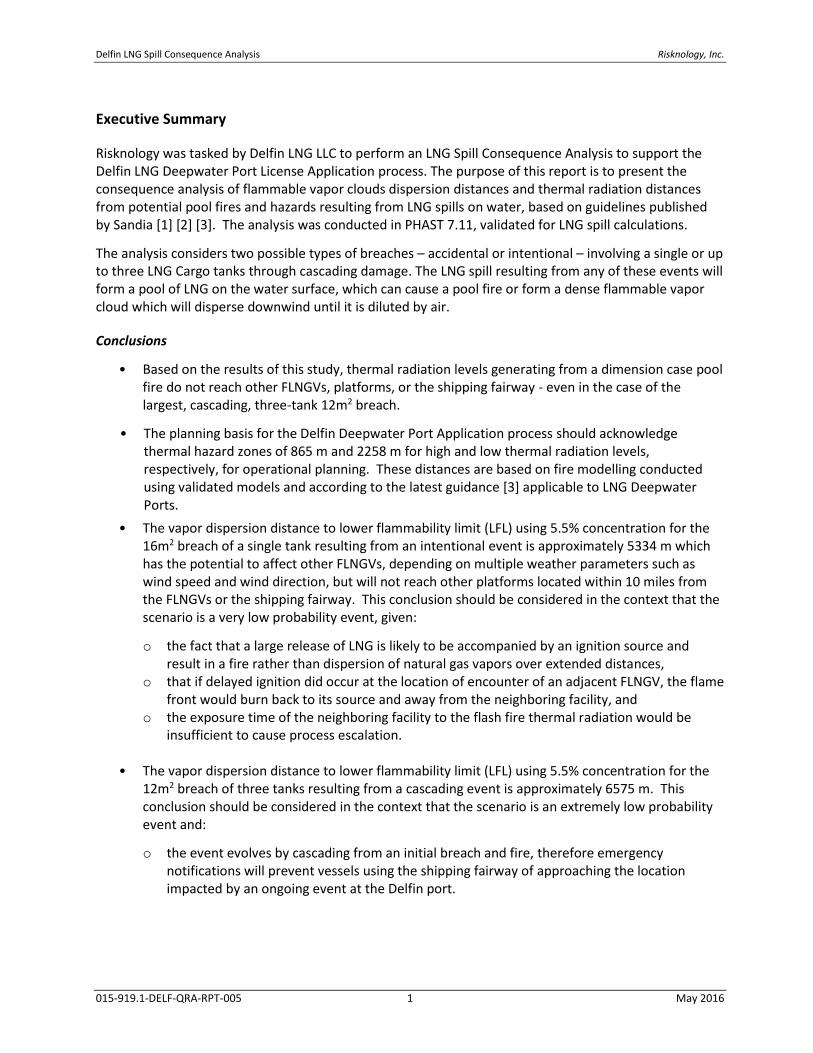
Executive Summary
Risknology was tasked by Delfin LNG LLC to perform an LNG Spill Consequence Analysis to support the Delfin LNG Deepwater Port License Application process. The purpose of this report is to present the consequence analysis of flammable vapor clouds dispersion distances and thermal radiation distances from potential pool fires and hazards resulting from LNG spills on water, based on guidelines published by Sandia [1] [2] [3]. The analysis was conducted in PHAST 7.11, validated for LNG spill calculations.
The analysis considers two possible types of breaches – accidental or intentional – involving a single or up to three LNG Cargo tanks through cascading damage. The LNG spill resulting from any of these events will form a pool of LNG on the water surface, which can cause a pool fire or form a dense flammable vapor cloud which will disperse downwind until it is diluted by air.
Conclusions
• Based on the results of this study, thermal radiation levels generating from a dimension case pool fire do not reach other FLNGVs, platforms, or the shipping fairway - even in the case of the largest, cascading, three-tank 12m2 breach.
• The planning basis for the Delfin Deepwater Port Application process should acknowledge thermal hazard zones of 865 m and 2258 m for high and low thermal radiation levels, respectively, for operational planning. These distances are based on fire modelling conducted using validated models and according to the latest guidance [3] applicable to LNG Deepwater Ports.
• The vapor dispersion distance to lower flammability limit (LFL) using 5.5% concentration for the 16m2 breach of a single tank resulting from an intentional event is approximately 5334 m which has the potential to affect other FLNGVs, depending on multiple weather parameters such as wind speed and wind direction, but will not reach other platforms located within 10 miles from the FLNGVs or the shipping fairway. This conclusion should be considered in the context that the scenario is a very low probability event, given:
o the fact that a large release of LNG is likely to be accompanied by an ignition source and result in a fire rather than dispersion of natural gas vapors over extended distances,
o that if delayed ignition did occur at the location of encounter of an adjacent FLNGV, the flame front would burn back to its source and away from the neighboring facility, and
o the exposure time of the neighboring facility to the flash fire thermal radiation would be insufficient to cause process escalation.
• The vapor dispersion distance to lower flammability limit (LFL) using 5.5% concentration for the 12m2 breach of three tanks resulting from a cascading event is approximately 6575 m. This conclusion should be considered in the context that the scenario is an extremely low probability event and:
o the event evolves by cascading from an initial breach and fire, therefore emergency notifications will prevent vessels using the shipping fairway of approaching the location impacted by an ongoing event at the Delfin port.

Delfin LNG Spill Consequence Analysis Risknology, Inc.
015-919.1-DELF-QRA-RPT-005 2 May 2016
Table 1: Consequence Analysis for Dimensioning Scenarios
Result Scenario 1
Cascading
Scenario 3
Intentional
Scenario 1
Accidental
Breach Size (m2) 12 16 2
Number of Tanks 3 1 1
Total Capacity (m3) 79,299 26,433 26,433
Release Quantity (m3) 61,275 24,967 24,967
Flammable Vapor Cloud Dispersion (meters) (No ignition)
Distance to LFL – 5.5% (m) 6575 5334 2297
Pool Fire Maximum Distance to Endpoint (meters) (using SNL 2012 guidance)
Distance to “Low” Radiative Flux – 5 kW/m2 (m) 3078 2258 1136
Distance to “High” Radiative Flux – 37.5 kW/m2 (m) 1188 865 434
Maximum Pool Diameter (m) 1101 728 336

Delfin LNG Spill Consequence Analysis Risknology, Inc.
015-919.1-DELF-QRA-RPT-005 3 May 2016
1 Introduction
Delfin is required to carry out an evaluation of public safety associated with the project, where the public is defined as non-project-related people. The safety of Delfin personnel will be addressed by complying with the regulations applicable under the DWPA and other applicable laws and regulations.
The hazards of interest to public safety for the Delfin project are outlined in various guidance documents generated by Sandia National Laboratories [1] [2] [3] for the evaluation of releases of LNG from LNG carriers and Deepwater Port Units. These are the potential for exposure to flammable vapor clouds and exposure to thermal radiation from pool fires on the sea surface.
The theoretical physical and thermal processes involved in an LNG spill are shown in Figure 1. Modeling of potential LNG spills and resulting fires or explosions were analyzed. The modeling techniques employed, the assumptions made, and the results are presented below.
Figure 1: Notional figure showing the LNG dispersion process
1.1 Guidance for Evaluating LNG Spills Over Water
In 2004, the DOE requested that Sandia develop guidance for risk-based analysis that would assess and quantify threats to public safety associated with increased marine LNG imports. The analysis included potential threats to an LNG facility and the potential hazards and consequences of a large spill from an LNG trading carrier. Sandia worked with the DOE, USCG, and other public and private groups and, in December 2004, released the report “SAND2004-6258” Guidance on Risk Analysis and Safety Implications of a Large Liquefied Natural Gas (LNG) Spill Over Water [1].
Sandia carried out another study in 2008 [2] evaluating LNG spills from larger LNG carriers (greater than 145,000 m3). Sandia concluded that there may be less control and surveillance of ship operations in offshore operations. As such, Sandia observed that credible intentional scenarios can be larger than for near shore facilities. Consistent with Sandia’s analysis in 2004, a pool fire was considered the most likely outcome from the breach of an LNG tanker due to the high probability of immediate ignition of the LNG during the event.
W ind Profile
Slum ping
and
Spreading
even upwind
Slum ping
and
Spreading
Evaporation leading to Vertical Flows
under Buoyant Conditions
M ixing with air
reduces concentration
and warm s M ethane
A ir at atm ospheric conditions
(density, tem perature)
O cean W ater Transfering H eat to the M ethane on the Surface
Lower F lam m ability
Lim it Boundary
Upper F lam m ability
Lim it Boundary - Rich M ethane Inside

Delfin LNG Spill Consequence Analysis Risknology, Inc.
015-919.1-DELF-QRA-RPT-005 4 May 2016
An expanded LNG safety research program was initiated by Congress with Sandia in 2008. The purpose of this effort was to provide the most comprehensive and accurate information for assessing the public safety risks posed by LNG tankers transiting to LNG facilities, specifically those issues identified by Congress in the February 2007 Government Accountability Office Report (GAO Report 07-316), Public Safety Consequences of a Terrorist Attack on a Tanker Carrying Liquefied Natural Gas Need Clarification. Sandia National Laboratories (SNL) supported the DOE in this effort starting May 2008 through May 2011 by conducting a series of large-scale LNG fire and cryogenic damage tests, as well as detailed, high performance computer model simulations of LNG vessel damage resulting from large LNG spills and fires on water.
In their most recent report [3], Sandia reassessed threats and potential credible event scenarios for LNG marine transportation with marine safety, law enforcement, and intelligence agencies. The evaluations considered a wide range of possible threats. These included accidents, as well as intentional events such as attacks with shoulder-fired weapons, explosives, and attacks by small to medium size boats and aircraft. Potential threats and possible breach events are always site-specific and will vary depending on the location of the LNG vessel, such as inner harbor, outer harbor, or offshore Deep Water port.
1.2 Project Background
Risknology was tasked by Delfin LNG LLC to perform an LNG Spill Consequence Analysis for the Delfin LNG Deepwater Port (DWP) License Application. The proposed DWP would be located in the federal water within the Outer Continental Shelf (OCS) West Cameron Area, 66 to 77 km off the coast of Cameron Parish, Louisiana, in water depths ranging from approximately 19 to 22 meters. The DWP would consist of four permanently moored floating liquefied natural gas vessels (FLNGVs). Each vessel would have a capacity of 211,460 m3. A rendering of the project is shown in Figure 3.

Delfin LNG Spill Consequence Analysis Risknology, Inc.
015-919.1-DELF-QRA-RPT-005 5 May 2016
Figure 2: Project Location
Figure 3: Artist’s Rendering of Delfin Deepwater Port Layout

Delfin LNG Spill Consequence Analysis Risknology, Inc.
015-919.1-DELF-QRA-RPT-005 6 May 2016
1.3 Methodology for Consequence Analysis
The methodology followed for this report is as follows:
Project Description: In Section 2 the site specific information is presented, including weather information, location of neighboring platforms and shipping fairways. In addition, a general description of the FLNGV is included, with emphasis on the LNG storage system.
Scenario Development: Section 3 provides an overview of the scenarios that were evaluated for the consequence analysis, the assumptions that were considered for the modeling of each scenario, as well as the sequence of events derived from the loss of containment from the FLNGV.
Modeling Results: Section 4 includes the results calculated from the different spill scenarios, considering two possible types of breaches (accidental or intentional).
Validation: Section 5 documents the results of comparison of PHAST results to those documented in Sandia’s reports and also presents a range of results dependent upon extreme weather conditions.

Delfin LNG Spill Consequence Analysis Risknology, Inc.
015-919.1-DELF-QRA-RPT-005 7 May 2016
2 Project Description
The proposed DWP would consist of four moored floating liquefied natural gas vessels (FLNGVs), two existing offshore natural gas pipelines of the former U-T Operating System (UTOS) and the High Island Operating System (HIOS), and four new pipeline laterals connecting the HIOS pipeline to each of the FLNGVs. The feed gas would be supplied through these new pipeline laterals to each of the FLNGVs where it would be cooled sufficiently to totally condense the gas to produce liquefied natural gas (LNG), and then would be stored in Gaztransport & Technigaz (GTT) Mark III membrane-type LNG storage tanks aboard each of the FLNGVs.
The FLNGV would accommodate standard LNG trading carriers with nominal cargo capacity of up to 170,000 m3 for side-by-side offloading of the LNG. The FLNGVs would be self-propelled and would be able to disconnect from the DWP and navigate using their own propulsion in the event of a forecasted hurricane or other unique circumstances.
2.1 Site Description
The proposed DWP would be located in federal waters within the Outer Continental Shelf (OCS) West Cameron Area, West Addition Protraction Area (Gulf of Mexico), approximately 37.4 to 40.8 nautical miles (or 43 to 47 statute miles) off the coast of Cameron Parish, Louisiana, in water depths ranging from approximately 64 to 72 feet (19.5 to 21.9 meters) (see Figure 2).
Figure 4 and Table 2 provide a graphic and list of platforms within ten miles of the proposed Delfin facilities. The nearest of these is 4.11 miles away. All of these platforms are unmanned. The shipping fairway, represented as a green stripe in Figure 4, is a shipping fairway located approximately 5,720 m from FLNGV 2 at its closest point.

Delfin LNG Spill Consequence Analysis Risknology, Inc.
015-919.1-DELF-QRA-RPT-005 8 May 2016
Figure 4: Locations of platforms within 10 miles of FLNGVs
Table 2: Distances to Platforms within 10 miles of FLNGVs
Platform Company Manned or Unmanned
Distance To FLNGV1 (mile)
Distance to FLNGV2 (mile)
Distance to FLNGV3 (mile)
Distance to FLNGV4 (mile)
Fieldwood Energy Offshore Unmanned 8.90 >10 >10 >10
NA Unmanned 7.22 7.81 9.72 >10
NA Unmanned 7.22 7.81 9.72 >10
EPL Oil & Gas, Inc. Unmanned 4.19 5.23 6.77 7.73
Forest Oil Cooperation Unmanned 4.11 6.09 4.13 6.44
Century Exploration New Orleans, LLC
Unmanned >10 >10 9.73 8.29

Delfin LNG Spill Consequence Analysis Risknology, Inc.
015-919.1-DELF-QRA-RPT-005 9 May 2016
2.2 FLNGV Description
Each FLNGV would be fitted with Mark III membrane type LNG storage tanks in a double-row configuration as a cargo containment system. In the nominal design case, each of the four FLNGVs would process approximately 500 million standard cubic feet per day (MMscfd), which would total 2.0 billion standard cubic feet per day (Bscf/d) of input feed gas for all four of the FLNGV. Based on an estimated availability of 92 percent and allowance for consumption of feed gas during the liquefaction process, each FLNGV would normally produce approximately 3.0 million metric tonnes per annum [MMtpa]) for export in the form of LNG. Together, in the nominal design case, the four FLNGV are designed to have the capability to export approximately 12.0 MMtpa in the form of LNG. The natural gas would be liquefied and stored on the FLNGV until delivered to LNG trading carriers via ship-to-ship transfer through cryogenic hoses or loading arms.
The LNG storage capacity of each FLNGV is approximately 211,000 m3. Each vessel shall have eight LNG tanks. The capacity of the eight LNG tanks is as described in Table 3 and depicted in Figure 5.
Figure 5: Vessel Capacity Plan

Delfin LNG Spill Consequence Analysis Risknology, Inc.
015-919.1-DELF-QRA-RPT-005 10 May 2016
A cross sectional view of one of the LNG tanks is illustrated in Figure 6.
Figure 6: Cross sectional view of LNG tank hold section (looking aft)
Table 3: LNG Cargo tank capacity
Compartment Capacity (m3)
No. 1 LNG Cargo Tank (P) 26,432.5
No. 1 LNG Cargo Tank (S) 26,432.5
No. 2 LNG Cargo Tank (P) 26,432.5
No. 2 LNG Cargo Tank (S) 26,432.5
No. 3 LNG Cargo Tank (P) 26,432.5
No. 3 LNG Cargo Tank (S) 26,432.5
No. 4 LNG Cargo Tank (P) 26,432.5
No. 4 LNG Cargo Tank (S) 26,432.5
Total 211,460
2.3 Weather Conditions at Site
The wind data for Delfin was taken from NOAA buoy 42035 which is located at 29.232 N 94.413 W (29°13'54" N 94°24'46" W). Risknology used the data for years 2009 to 2013.
Table 4 illustrates the percentage of time for each specific wind speed and wind direction.

Delfin LNG Spill Consequence Analysis Risknology, Inc.
015-919.1-DELF-QRA-RPT-005 11 May 2016
Table 4: Percentage of time for each wind speed and wind direction
Wind Speed m/s
Totals 0-2 2-4 4-6 6-8 8-10 10-12 12-14 14-16 16-18
Win
d D
irec
tio
n D
egre
es
0-45 5.77E-03 1.36E-02 1.99E-02 2.42E-02 2.22E-02 1.41E-02 3.63E-03 4.79E-04 4.56E-05 1.04E-01
45-90 8.90E-03 2.36E-02 3.43E-02 3.03E-02 1.78E-02 6.59E-03 1.73E-03 3.42E-04 6.85E-05 1.24E-01
90-135 1.26E-02 4.97E-02 7.27E-02 5.37E-02 2.30E-02 5.61E-03 7.07E-04 9.13E-05 0.00E+00 2.18E-01
135-180 1.32E-02 5.53E-02 9.45E-02 6.56E-02 2.76E-02 5.23E-03 3.88E-04 2.28E-05 0.00E+00 2.62E-01
180-225 1.04E-02 3.06E-02 4.61E-02 3.43E-02 7.85E-03 1.21E-03 1.37E-04 2.28E-05 0.00E+00 1.31E-01
225-270 7.30E-03 1.24E-02 1.29E-02 5.91E-03 1.37E-03 2.74E-04 1.14E-04 4.56E-05 0.00E+00 4.04E-02
270-315 4.86E-03 9.08E-03 9.63E-03 7.05E-03 3.70E-03 1.99E-03 1.48E-03 4.79E-04 1.60E-04 3.84E-02
315-360 5.27E-03 7.58E-03 1.22E-02 1.48E-02 1.68E-02 1.49E-02 9.17E-03 2.21E-03 1.14E-04 8.30E-02
Totals 6.83E-02 2.02E-01 3.02E-01 2.36E-01 1.20E-01 4.99E-02 1.74E-02 3.70E-03 3.88E-04 1.00E+00
Analysis of this wind data results in an average wind speed of 5.25 m/sec.
Temperature and relative humidity data were obtained from the same weather buoy for the same period
of time. The average values for temperature was 21.5 C and relative humidity 78.2%.

Delfin LNG Spill Consequence Analysis Risknology, Inc.
015-919.1-DELF-QRA-RPT-005 12 May 2016
3 Scenario Development
The purpose of this report is to present the consequence analysis resulting from potential LNG spills on water, based on guidelines published by Sandia.
The analysis considers two possible types of breaches – accidental or intentional - for a single or up to three LNG Cargo tank(s) spilling at a time in order to account for any cascading damages of adjacent tanks. Each one of the accidental and intentional events has been assigned a credible breach size, which will be discussed later in this report. The LNG spill resulting from any of these events will form a pool of LNG on the water surface, which can cause a pool fire or form a dense flammable vapor cloud which will disperse downwind until it is diluted by air.
This section includes a discussion of the modeling approach to the consequence analysis, as well as a discussion of the modeling parameters and boundary conditions used in the models. Consequence analysis is defined as the determination of physical effects that can negatively impact either persons or property.
3.1 Study Assumptions
For the purpose of this study the composition of the LNG was assumed to be 100% methane.
Atmospheric conditions can affect the formation of LNG pool, the dispersion of methane vapor clouds, and the intensity of pool fires resulting from LNG spills. According to Sandia guidelines experiments show that low wind speed and high stability class produce largest distances to LFL. For the purpose of this study, the ambient air temperature and water temperature used were 21.5 °C. The wind speed was considered to be 5.25 m/s with a stability class F. The relative humidity used was 78.2%.
3.2 Dimensioning Spills
The breach analysis for this study follows the guidelines from Sandia, taking into consideration the specific sizes of the LNG tanks and the height of LNG above the water line in the tanks.
Sandia estimated the accidental breach scenario to be less than 2m2. The intentional breach size was estimated to range between 2m2 and 12m2. The release resulting from an intentional breach is most likely to be ignited due to the high probability of encountering an ignition source; however, the study does consider dispersion of vapor clouds in cases where they may not ignite immediately.
In 2008, Sandia produced updated guidance considering LNG vessels with capacities of up to 265,000m3. In this updated guidance, offshore operations’ intentional breach sizes were increased to be between 5-16m2.
Both the total volume of LNG spilled and the flow rate of LNG through a breach in the tank depend on the location of the breach in the vessel. Flow rate and spill volume are maximized if the breach is near the waterline of the vessel. If the breach is below the waterline, the flow of LNG out of the tank is decreased due to the backpressure caused by the water above the breach, as well as by the flow of water into the tank. If the breach is above the waterline then there is volume that is trapped, below the breach, that cannot be spilled from the tank and the head pressure on the LNG above the breach is decreased from loss of height which in turn reduces the flow rate. Other phenomena, such as ice formation around the breach and increased LNG vaporization as the spill flows toward the water surface, are also likely to result in overall smaller LNG pools than a waterline release and consequently smaller hazards zones. Therefore, in all scenarios considered in this study, the tank breach is assumed to occur at the waterline.

Delfin LNG Spill Consequence Analysis Risknology, Inc.
015-919.1-DELF-QRA-RPT-005 13 May 2016
The Delfin FLNG vessels are semi-permanently moored using a yoke system coupled to a specialized platform structure. Disconnection requires advance preparation, specialized knowledge and training and sufficient crew following an engineered procedure. As such, disconnection by unauthorized persons would be unlikely and attempts would be detected, therefore high jacking scenarios are not considered credible for the Delfin facility.
3.3 LNG Spill Calculations
Sandia provides a methodology to determine the LNG spill rate from the storage tank. The level of fill above the water line constitutes a main parameter in the calculations of flow rate out of the tank and the time it takes to drain the tank. The resulting times to empty the LNG storage tanks under various assumed breach scenarios is as shown in Table 5. More detail is provided in Appendix A.
Table 5: Flow rates and times to drain
Breach size (m2)
Tanks Breached
Average flow rate (kg/s)
Tank Cross Sectional Area (m2)
Time to drain (sec)
1 1 2589.31 1016.7 3316
2 1 5178.62 1016.7 1657
5 1 12946.55 1016.7 663
12 1 31071.71 1016.7 276
16 1 41428.95 1016.7 207
5 3 38839.64 1016.7 663
12 3 93215.13 1016.7 276
3.4 Vapor Cloud Dispersion Modeling
The flammable vapor clouds were modeled using PHAST 7.11. PHAST uses a Unified Dispersion Model (UDM) model, which has been validated against field test results including gas dispersion from LNG spills onto water [4] [5].
LNG is less dense than water. If spilled and exposed to the atmosphere, it will absorb heat from the seawater and ambient air, initially forming a cold, heavier than air cloud that will be visible due to condensed moisture within the air. Because of the material’s density and the turbulence created by the rapid boiling, an LNG spill will spread and vaporize rapidly.
3.5 Pool Fire Modeling
Any rapid release of LNG onto water could result in a pool fire. In the event of a release, the LNG will float on top of the water and a pool will form. Heat from the seawater will warm the LNG pool and release vapors of natural gas to the atmosphere. A pool fire could occur in cases where methane, rising from the surface of the pool, combines with the proper mixture of oxygen and comes in contact with an ignition source. A large pool fire scenario is likely to be the highest risk in terms of the size of the thermal radiation hazard zone. Predictions regarding LNG pool fires are based on mathematical modeling and limited experiments, as there is no recorded instance of a large release of LNG on water or a resulting pool fire.
Pool fire modeling was done using PHAST 7.11 using the latest pool fire model which assumes a delayed ignition where the pool has reached its maximum radius [10].

Delfin LNG Spill Consequence Analysis Risknology, Inc.
015-919.1-DELF-QRA-RPT-005 14 May 2016
4 Modeling Results
In this section Risknology provides the results from the different spill scenarios. The results are presented in two subsections - for accidental and intentional breach scenarios.
For vapor dispersion, a flammable vapor cloud will ignite between the flammability limits, if an ignition source is present within the flammable range.
According to Sandia [1] the lower and upper flammability limits of methane are 5.5% and 14% by volume at a temperature of 25°C. Table 6 is taken from Sandia’s 2004 report.
Table 6: Flammability Limits for Methane at 25°C
FUEL Lower Flammability Limit (LFL)
% by volume in air Upper Flammability Limit (UFL)
% by volume in air
Methane 5.5 14
For pool fire scenarios, the radiation heat flux levels used in this study are 5 to 12.5 and 37.5 kW/m2.
Table 7 provides a description of the type of damage resulting from exposure to each heat flux level.
Table 7: Type of damage based on heat flux
Incident heat flux kW/m2 Type of Damage
35-37.5 Damage to process equipment including steel tanks, chemical process
equipment, or machinery
25 Minimum energy to ignite wood at indefinitely long exposure without a flame
18-20 Exposed plastic cable insulation degrades
12.5-15 Minimum energy to ignite wood with a flame; melts plastic tubing
5 Permissible level for emergency operations lasting several minutes
with appropriate clothing

Delfin LNG Spill Consequence Analysis Risknology, Inc.
015-919.1-DELF-QRA-RPT-005 15 May 2016
4.1 Vapor Dispersion Zone
Accidental Scenarios Results
The vapor dispersion zones from an accidental breach of LNG tanks were calculated using PHAST for the following scenarios:
Accidental event leading to a 1-m2 hole size in a single tank of FLNGV
Accidental event leading to a 2-m2 hole size in a single tank of FLNGV
The results from these events are summarized in Table 8 for lower flammability level (LFL) maximum distances. Figure 7 portrays the distance surrounding each of the FLNGV locations for the larger accidental breach size.
Table 8: LFL distances for 1 and 2 m2 single tank accidental breach
Hole Size (m2)
Tanks Breached
Discharge Coefficient
Distance to LFL 55000 ppm (m)
1 1 0.6 1792
2 1 0.6 2297
In the absence of a site-specific ship collision analysis, Delfin selected the larger of the guidance cases as the dimensioning accidental release case. The Sandia guidance recognizes that ship collision risks are manageable with current policies and practices.

Delfin LNG Spill Consequence Analysis Risknology, Inc.
015-919.1-DELF-QRA-RPT-005 16 May 2016
Figure 7: LFL effect zone (in blue) for accidental 2m2 single-tank breach from the FLNGVs

Delfin LNG Spill Consequence Analysis Risknology, Inc.
015-919.1-DELF-QRA-RPT-005 17 May 2016
Intentional Scenario Results
The vapor dispersion zones from an intentional breach of LNG tanks were calculated using PHAST for the following scenarios:
Intentional event leading to a 5-m2 breach in a single tank of FLNGV
Intentional event leading to a 12-m2 breach in a single tank of FLNGV
Intentional event leading to a 16-m2 breach in a single tank of FLNGV
The results from these calculations are summarized in Figure 8 for distances to the lower flammability limit (LFL).
Table 9: LFL distances for intentional breach events
Hole Size (m2)
Tanks Breached
Discharge Coefficient
Distance to LFL 55000 ppm (m)
5 1 0.6 3917
12 1 0.6 5368
16 1 0.6 5334
Without an evaluation of site-specific intentional threats by security specialists, as is conducted in the first phase of a the US Coast Guard Independent Risk Assessment process following permitting, the proposed Delfin project elected to utilize definitions of the worst credible intentional releases congruent to those used in the proposed Port Ambrose LNG Deepwater Port project [13].
Figure 8 presents the vapor dispersion distance from the largest single tank breach surrounding each of the FLNGV locations. It can be seen from Figure 8 that the LFL contours caused by an intentional event could potentially reach other Delfin FLNGVs, however other oil and gas production platforms and public use areas (e.g. Shipping Fairway) are not affected. Therefore, the Risk Management Process would ensure that the other Delfin facilities are notified to take appropriate action in the event of a major loss of containment.

Delfin LNG Spill Consequence Analysis Risknology, Inc.
015-919.1-DELF-QRA-RPT-005 18 May 2016
Figure 8: LFL effect zones (in blue) for intentional 16m2 single-tank breach from the FLNGVs

Delfin LNG Spill Consequence Analysis Risknology, Inc.
015-919.1-DELF-QRA-RPT-005 19 May 2016
Cascading Scenario Results
According to the 2008 Sandia report, a multiple tank breach (considering up to three tanks spilling at the same time) is not considered a likely LNG spill, even for intentional threat scenarios. However such scenario is evaluated to provide a conservative estimation of possible cascading damage concerns. The threat scenarios provided in the Sandia guidance were developed in collaboration in intelligence agencies and included threats such as “attacks with explosives, attacks by boats and airplanes with and without explosives, underwater mines and explosives, as well as more sophisticated techniques”.
The breach analysis performed by Sandia also takes into account that there is less waterway control and surveillance of ship operations on offshore locations. It should be noted that for offshore operations, Sandia recognizes that the remote location of the LNG facilities would represent a minimal impact to public safety or property from even the largest spill.
The vapor dispersion zones from a cascading breach of LNG tanks were calculated using PHAST for the following scenarios:
Cascading event leading to a 5-m2 breach in three tanks of FLNGV
Cascading event leading to a 12-m2 breach in three tanks of FLNGV
The results from these calculations are summarized in Table 10 for distances to the lower flammability limit (LFL).
Table 10: LFL distances for cascading breach events
Hole Size (m2)
Tanks Breached
Discharge Coefficient
Distance to LFL 55000 ppm (m)
5 3 0.6 5615
12 3 0.6 6575
Without an evaluation of site-specific intentional threats by security specialists, as is conducted in the first phase of the US Coast Guard Independent Risk Assessment process following permitting, the proposed Delfin project elected to utilize a worst credible cascading event of a 12 m2 three-tank breach.
Figure 9 shows the vapor dispersion distances to LFL for the three tank 12m2 breach spilling simultaneously from an FLNGV. Figure 9 includes the LFL contours originating from each FLNGV. This distance reaches the shipping fairway, but does not reach any other oil and gas production platforms. As the event evolves by cascading from an initial breach and fire, emergency notifications will prevent vessels using the shipping fairway of approaching the location impacted by an ongoing event at the Delfin port.

Delfin LNG Spill Consequence Analysis Risknology, Inc.
015-919.1-DELF-QRA-RPT-005 20 May 2016
Figure 9: LFL effect zones (in blue) for cascading 12m2 three-tank breach from the FLNGVs

Delfin LNG Spill Consequence Analysis Risknology, Inc.
015-919.1-DELF-QRA-RPT-005 21 May 2016
4.2 Thermal Exclusion Zone
Accidental Scenarios Results
Similar to the vapor dispersion analysis, the hazard distances for pool fires from an accidental breach of LNG tanks were calculated using PHAST for the following scenarios:
Accidental event leading to a 1-m2 hole size in a single tank of FLNGV
Accidental event leading to a 2-m2 hole size in a single tank of FLNGV
The results from these events are summarized in Table 11 for heat radiation levels. Figure 10 portrays the distance surrounding each of the FLNGV locations for the larger accidental breach size.
Table 11: Distances to flux radiation levels for accidental scenarios
Hole Size (m2)
Tanks Breached
Discharge Coefficient
Surface Emissive Power
(kW/m2)
Distance in (m)
to 5 kW/m2
to 12.5 kW/m2
to 37.5 kW/m2
1 1 0.6 220 870 604 331
2 1 0.6 220 1136 789 434
Figure 10: Effect zone (in blue) for 5 kW/m2 radiation contour from a pool fire caused by accidental 2m2 single-tank breach from the FLNGVs

Delfin LNG Spill Consequence Analysis Risknology, Inc.
015-919.1-DELF-QRA-RPT-005 22 May 2016
Intentional Scenario Results
The hazard distances for pool fires from an intentional breach of LNG tanks were calculated using PHAST for the following scenarios:
Intentional event leading to a 5- m2 breach in a single tank of FLNGV
Intentional event leading to a 12- m2 breach in a single tank of FLNGV
Intentional event leading to a 16- m2 breach in a single tank of FLNGV
The results from these events are summarized in Table 12 for heat radiation levels.
Table 12: Distances to flux radiation levels for intentional scenarios
Hole Size (m2)
Tanks Breached
Discharge Coefficient
Surface Emissive Power
(kW/m2)
Distance in (m)
to 5 kW/m2
to 12.5 kW/m2
to 37.5 kW/m2
5 1 0.6 220 1576 1034 529
12 1 0.6 220 2200 1451 753
16 1 0.6 220 2194 1447 751
The 5 kW/m2 is a maximum heat flux value commonly used for establishing fire protection distances for people in open areas.
Distances to thermal radiation endpoints for the largest intentional single tank breach of 16 m2 is shown in Figure 11.
None of the pool fire hazard scenarios evaluated reached another FLNGV, neighboring platform or the shipping fairway, therefore the analysis suggests that there would be a minimal impact to public safety from even a large spill from the FLNGVs.

Delfin LNG Spill Consequence Analysis Risknology, Inc.
015-919.1-DELF-QRA-RPT-005 23 May 2016
Figure 11: Effect zone (in blue) for 5 kW/m2 radiation contour from a pool fire caused by intentional 16m2 single-tank breach from the FLNGVs

Delfin LNG Spill Consequence Analysis Risknology, Inc.
015-919.1-DELF-QRA-RPT-005 24 May 2016
Cascading Scenario Results
The hazard distances for pool fires from an intentional breach of LNG tanks were calculated using PHAST for the following scenarios:
Cascading event leading to a 5-m2 breach in three tanks of FLNGV
Cascading event leading to a 12-m2 breach in three tanks of FLNGV
The results from these events are summarized in Table 13 for heat radiation levels.
Table 13: Distances to flux radiation levels for cascading breach events
Hole Size (m2)
Tanks Breached
Discharge Coefficient
Surface Emissive Power
(kW/m2)
Distance in (m)
to 5 kW/m2
to 12.5 kW/m2
to 37.5 kW/m2
5 3 0.6 220 2394 1581 825
12 3 0.6 220 2991 1985 1048
The 5 kW/m2 is a maximum heat flux value commonly used for establishing fire protection distances for people in open areas.
Distances to thermal radiation endpoints for the largest cascading three-tank breach of 12 m2 is shown in Figure 12.
None of the pool fire hazard scenarios evaluated reached another FLNGV, neighboring platform or the shipping fairway, therefore the analysis suggests that there would be a minimal impact to public safety from even a large spill from the FLNGVs.

Delfin LNG Spill Consequence Analysis Risknology, Inc.
015-919.1-DELF-QRA-RPT-005 25 May 2016
Figure 12: Effect zone (in blue) for 5 kW/m2 radiation contour from a pool fire caused by cascading event leading to a 12-m2 breach in three tanks of the FLNGVs

Delfin LNG Spill Consequence Analysis Risknology, Inc.
015-919.1-DELF-QRA-RPT-005 26 May 2016
5 Validation and Sensitivity Analysis
Comparison to Sandia Results
A comparison was made between the results generated by PHAST with the same weather conditions as used in the Sandia guidance for the Delfin analysis and those of the Sandia 2008 report and the updated modeling guidance given in Sandia’s 2012 guidance. The PHAST calculations are in very good agreement with the results given in the Sandia guidance. The dispersion distances range from being within range to being over predicted by 4%. The thermal radiation impact distances ranged from 0.3 – 11% over prediction and 5.6% under prediction for the lower radiation level, and from 1.3 – 9% over prediction and 3.9% under prediction for the higher radiation level. Using the updated Sandia guidance results in a reduction of 12-15% of the hazard distance calculated using PHAST for similar LNG pool sizes.
Sensitivity Analysis to Weather Conditions
Air temperatures over the open Gulf of Mexico exhibit narrow limits of variability. The average temperature over the center of the Gulf is about 29°C in the summer; winter temperatures range between 17°-23°C. The relative humidity over the Gulf is high throughout the year, minimum humidity’s occur during the late fall and winter when cold, continental air masses bring dry air into the northern Gulf. The recording stations from Brownsville, Texas, to Key West, Florida, show the relative humidity varies annually from a high of 87% at 6:00 a.m. to a low of 44% at 12 noon. A 10 m/sec. wind speed corresponds to the 95th percentile at the site.
A sensitivity analysis examining the effect of historical
minimum temperature of 17°C,
minimum relative humidity of 44%, and
maximum wind speed of 10 m/s
individually and in combination, was performed.
For dispersion distance, relative humidity was the most significant parameter, resulting in a change in downwind dispersion distance increase over the baseline from 20-157% depending on release size. This is because the moisture content in the air provides a massive heat sink to transfer heat to the natural gas vapor, and at lower levels of moisture content, the gas remains colder – and therefore heavier – longer and can travel downwind further before buoyant forces lift the plume.
The next most significant parameter influencing dispersion distance was wind speed, with the potential effect of increasing the distance from 8-97%. Base wind speed provides the driving force for transport of the vapor cloud downwind, as long as other competing mechanisms do not reduce the cloud concentration through mixing or diffusion.
The least influential parameter influencing dispersion was the air temperature. Reduction of the temperature from the average of 21.5 C to the minimum of 17 C resulted in no calculated increase in dispersion distance.
The combined effects of both relative humidity and wind speed resulted in a slightly greater increase on dispersion distance than relative humidity alone, from 14-164% over 20-157%.

Delfin LNG Spill Consequence Analysis Risknology, Inc.
015-919.1-DELF-QRA-RPT-005 27 May 2016
For thermal radiation at the lowest flux level of 5 kW/m2, the effect of each of the three parameters, individually and in combination resulted in an increase in the thermal flux endpoint of from 3-8%, which is well within the error of prediction of the model.

Delfin LNG Spill Consequence Analysis Risknology, Inc.
015-919.1-DELF-QRA-RPT-005 28 May 2016
6 Conclusions
• Based on the results of this study, thermal radiation levels generating from a dimension case pool fire do not reach other FLNGVs, platforms, or the shipping fairway - even in the case of the largest, cascading, three-tank 12m2 breach.
• The planning basis for the Delfin Deepwater Port Application process should acknowledge thermal hazard zones of 865 m and 2258 m for high and low thermal radiation levels, respectively, for operational planning. These distances are based on fire modelling conducted using validated models and according to the latest guidance [3] applicable to LNG Deepwater Ports.
• Intentional and cascading scenarios resulted in greater distances to lower flammability limits of vapor clouds as well as all flux radiation levels. This is due to the greater breach sizes assumed for the intentional events.
• The vapor dispersion distance to lower flammability limit (LFL) using 5.5% concentration for the 16m2 breach of a single tank resulting from an intentional event is approximately 5334 m which has the potential to affect other FLNGVs, depending on multiple weather parameters such as wind speed and wind direction, but will not reach other platforms located within 10 miles from the FLNGVs or the shipping fairway. This conclusion should be considered in the context that the scenario is a very low probability event given:
o the fact that a large release of LNG is likely to be accompanied by an ignition source and result in a fire rather than dispersion of natural gas vapors over extended distances,
o that if delayed ignition did occur at the location of encounter of an adjacent FLNGV, the flame front would burn back to its source and away from the neighboring facility, and
o the exposure time of the neighboring facility to the flash fire thermal radiation would be insufficient to cause process escalation.
• The vapor dispersion distance to lower flammability limit (LFL) using 5.5% concentration for the 12m2 breach of three tanks resulting from a cascading event is approximately 6575 m. This conclusion should be considered in the context that the scenario is an extremely low probability event and:
o the event evolves by cascading from an initial breach and fire, therefore emergency notifications will prevent vessels using the shipping fairway of approaching the location impacted by an ongoing event at the Delfin port.
• Sensitivity analysis has been performed, at the request of USCG, using the historically low values for temperature and relative humidity and a high value for wind speed. The combined effects resulted in an increase on dispersion distance from 14-164% and in an increase in the 5 kW/m2
thermal flux endpoint of from 3-8%.

Delfin LNG Spill Consequence Analysis Risknology, Inc.
015-919.1-DELF-QRA-RPT-005 29 May 2016
Table 14: Consequence Analysis for Dimensioning Scenarios
Result Scenario 1
Cascading
Scenario 3
Intentional
Scenario 1
Accidental
Breach Size (m2) 12 16 2
Number of Tanks 3 1 1
Total Capacity (m3) 79,299 26,433 26,433
Release Quantity (m3) 61,275 24,967 24,967
Flammable Vapor Cloud Dispersion (meters) (No ignition)
Distance to LFL – 5.5% (m) 6575 5334 2297
Pool Fire Maximum Distance to Endpoint (meters) (using SNL 2012 guidance)
Distance to “Low” Radiative Flux – 5 kW/m2 (m) 3078 2258 1136
Distance to “High” Radiative Flux – 37.5 kW/m2 (m) 1188 865 434
Maximum Pool Diameter (m) 1101 728 336

Delfin LNG Spill Consequence Analysis Risknology, Inc.
015-919.1-DELF-QRA-RPT-005 30 May 2016
References
[1] Sandia National Laboratories, "Guidance on Risk Analysis and Safety Implications of a Large Liquefied Natural Gas (LNG) Spill Over Water," Albuquerque, New Mexico 87185 and Livermore, California 94550, December 2004.
[2] Sandia National Laboratories, "Breach and Safety Analysis of Spills Over Water from Large Liquefied Natural Gas Carriers," Albuquerque, New Mexico 87185 and Livermore, California 94550, May 2008.
[3] United States Department of Energy, "Liquefied Natural Gas Safety Research, Report to Congress," May, 2012.
[4] R. M. Pitblado, J. Baik, G. J. Hughes, C. Ferro and S. J. Shaw, "Consequences of LNG Marine Incidents," in CCPS Conference Orlando, June 29-July 1 2004.
[5] H. Witlox, M. Harper and R. Potblado, "Validation of PHAST Dispersion Model as Required for USA LNG Siting Applications," 2013.
[6] A. Luketa, "Recommendations on the Prediction of Thermal Hazard Distances from Large Liquefied Natural Gas Pool Fires on Water for Solid Flame Models - Report SAND2011-9415," Sandia National Laboratories, December 2011.
[7] National Fire Protection Association (NFPA), The SFPE Handbook of Fire Protection Engineering, 4th edition, 2008.
[8] United States. Minerals Management Service. Gulf of Mexico OCS Region, Proposed oil and gas lease sales 110 and 112, Gulf of Mexico OCS Region: draft environmental impact statement, 1986, p. 70.
[9] HÖEGH AVOCET FLNG, "Cargo System Conversion Design Basis," Bechtel Oil, Gas and Chemicals, Inc., 2015.
[10] HÖEGH AVOCET FLNG,, "Process Design Basis," Bechtel Oil, Gas and Chemicals, Inc., 2015.
[11] DNV, "POLF (Pool Fire) Theory Document," DNV Software, October 2005.
[12]
[13]
Ecology and Enviornment, Inc., "Deepwater Port License Application," Delfin LNG, LLC, 2015.
AcuTech 2014 Independent Risk Assessment for Port Ambrose LNG Deepwater Port Phase I, August.

Delfin LNG Spill Consequence Analysis Risknology, Inc.
015-919.1-DELF-QRA-RPT-005 31 May 2016
Appendix A: LNG Spill Calculations
Table A- 1 includes the definition of the different variables in the equations used.
Table A- 1: Definition of variables used to calculate spill parameters
Variable Definition
At Cross sectional area of tank
Ah Cross sectional area of hole
m Mass of liquid in tank
u velocity
uo Effective velocity out of hole
ht Height of the top surface of the liquid
hi Initial height of liquid
Cd Discharge coefficient
V Volume of liquid
The flow into the pool will change with time as the level in the tank changes since it is the hydrostatic pressure in the tank that drives the flow through the hole. Therefore the flow into the pool is equal to the flow from the tank which can be determined by calculating the change in liquid mass in the tank with time. Applying the continuity equation to the tank, the time rate of change of mass in the tank is
𝑑𝑚
𝑑𝑡= (𝜌𝐴𝑢)𝑖𝑛 − (𝜌𝐴𝑢)𝑜𝑢𝑡 (1)
The variables are defined in Table A- 1, subscript (t) denotes conditions at the liquid surface in the tank and subscript (o) denotes the conditions at the hole. Since there is no addition of liquid into the tank the equation becomes
𝑑𝑚
𝑑𝑡= −(𝜌𝐴𝑢)𝑜𝑢𝑡 (2)
and relating the mass of liquid in the tank at any time to its volume (which is area x height) and density, the equation becomes
𝑑𝜌𝐴𝑡ℎ
𝑑𝑡= −(𝜌𝐴𝑢)𝑜𝑢𝑡 . (3)
The discharge velocity at any time can be related to the height of the liquid in the tank at that time using Bernoulli’s equation,
1
2𝜌𝑢𝑡
2 + 𝑃𝑡 + 𝜌𝑔ℎ𝑡 =1
2𝜌𝑢𝑜
2 + 𝑃𝑜 + 𝜌𝑔ℎ𝑜. (4)
The boundary conditions are that the pressure at the surface of the liquid and the hole is atmospheric, the velocity of the surface is approximately zero and there is no depth in the liquid at the discharge point, the equation becomes
𝜌𝑔ℎ𝑡 =1
2𝜌𝑢𝑜
2 (5)

Delfin LNG Spill Consequence Analysis Risknology, Inc.
015-919.1-DELF-QRA-RPT-005 32 May 2016
and the discharge velocity is a function of the liquid height through
𝑢𝑜 = 𝐶𝑑√2𝑔ℎ𝑡 (6)
where a discharge coefficient has been added to account for losses at the hole.
The height of the fluid at any time can be determined by using Equation (6) in (3) and integrating with initial conditions h=hi at t=0, to be
𝑡 = √2
𝑔
𝐴𝑡
𝐶𝑑𝐴ℎ(√ℎ𝑖 − √ℎ) (7)
so the time to drain will be
𝑡 = √2
𝑔
𝐴𝑡
𝐶𝑑𝐴ℎ(√ℎ𝑖) . (8)
As is clear in Equation (6) there is a linear relationship between the discharge velocity and the depth of the liquid. Therefore the average flow rate into the pool will be half of the initial rate so the average change of liquid volume with time is
(𝑑𝑉
𝑑𝑡)𝑎𝑣𝑔
= 1
2𝐶𝑑𝐴ℎ√2𝑔ℎ𝑖 . (9)
For this analysis, it is assumed that the complete hole size area is available for the release of LNG which is stored in LNG cargo tanks at a temperature of -163 °C at a pressure of 1 bar. Based on the Sandia Report, the hole sizes calculated from accidental breaches are less than 2 m2 and intentional scenarios range from 5 to 16 m2; therefore Risknology calculated the release consequences from the hole sizes shown in Table A- 2. The total time for discharge and average discharge flow rate were calculated based on guidance from Sandia as in the pool formation section. Based on a schematic drawing of the LNG vessel shown in Figure 6, Risknology considered a 18.78 m hydrostatic head of LNG above waterline and a discharge coefficient of 0.6 for all breaches analyzed. The parameters provided in Table A- 2 were used in PHAST dispersion modeling software in order to calculate the vapor dispersion along with heat radiations distances from potential pool fires.
Table A- 2: Flow rates and times to drain
Breach size (m2)
Tanks Breached
Average flow rate (kg/s)
Tank Cross Sectional Area
(m2)
Time to drain (sec)
1 1 2589.31 1016.7 3313
2 1 5178.62 1016.7 1657
5 1 12946.55 1016.7 663
12 1 31071.71 1016.7 276
16 1 41428.95 1016.7 207
5 3 38839.64 1016.7 663
12 3 93215.13 1016.7 276