Appendix: Process Modeling Data Assumptions … Library/Research/Energy Analysis/Life...Appendix:...
73
Appendix: NGCC-LCA i Life Cycle Analysis: Natural Gas Combined Cycle (NGCC) Power Plant Appendix: Process Modeling Data Assumptions and GaBi Modeling Inputs DOE/NETL-403/110509
-
Upload
vuongthien -
Category
Documents
-
view
218 -
download
3
Transcript of Appendix: Process Modeling Data Assumptions … Library/Research/Energy Analysis/Life...Appendix:...

Appendix: NGCC-LCA
i
Life Cycle Analysis: Natural Gas Combined
Cycle (NGCC) Power Plant
Appendix: Process Modeling Data Assumptions
and GaBi Modeling Inputs
DOE/NETL-403/110509
Appendix: NGCC-LCA
ii
Table of Contents
List of Tables ................................................................................................................................ iii List of Figures ............................................................................................................................... iv
Acronyms and Abbreviations ...................................................................................................... v
A.1 Life Cycle Stage Process Modeling Data Assumptions and GaBi Modeling Inputs ...... 1
A.1.1 Life Cycle Stage #1: Raw Material Acquisition – Natural Gas Extraction and LNG Production ........................................................................................................... 2
A.1.1.1 GaBi Plan ................................................................................................................ 2
A.1.1.2 Installation and Deinstallation Assumptions .......................................................... 3
A.1.2 Life Cycle Stage #2: Raw Material Transport ......................................................... 26
A.1.2.1 GaBi Plan .............................................................................................................. 26
A.1.2.2 Commissioning/Decommissioning Assumptions ................................................. 26
A.1.2.3 Construction Assumptions .................................................................................... 29
A.1.2.4 Operation Assumptions ......................................................................................... 32
A.1.3 Life Cycle Stage #3: NGCC Energy Conversion Facility without CCS ................. 37
A.1.3.1 GaBi Plan .............................................................................................................. 37
A.1.3.2 Commissioning, Installation, and Decommissioning Assumptions ..................... 38
A.1.3.3 Construction Assumptions .................................................................................... 41
A.1.3.4 Operation Assumptions ......................................................................................... 45
A.1.4 Life Cycle Stage #3, Case 2: NGCC Energy Conversion Facility with CCS ......... 48
A.1.4.1 GaBi Plan .............................................................................................................. 48
A.1.4.2 Commissioning, Installation, and Decommissioning Assumptions ..................... 49
A.1.4.3 Construction Assumptions .................................................................................... 49
A.1.4.4 Operation Assumptions ......................................................................................... 52
A.1.5 Life Cycle Stage #4: Product Transportation – Electrical Grid ............................. 55
A.1.6 Life Cycle Stage #5: End User – Electricity Consumption ..................................... 56
References .................................................................................................................................... 57

Appendix: NGCC-LCA
iii
List of Tables
Table A-1: Air Emissions (kg/kg Natural Gas Output) during Platform Installation/Deinstallation ......................................................................................................................................................... 5
Table A-2: Air Emissions (kg/kg Natural Gas Output) for Offshore Pipeline Installation ............ 6
Table A-3: Air Emissions (kg/mile) during Onshore Pipeline Installation/Deinstallation ............. 8
Table A-4: Air Emissions (kg/kg LNG) for the Installation/Deinstallation of a Liquefaction Facility .......................................................................................................................................... 10
Table A-5: Air Emissions (kg/kg Natural Gas Output) during Drilling Platform Construction .. 11
Table A-6: Air Emissions (kg/kg Natural Gas Transported) for Pipeline Construction ............... 13
Table A-7: Material Quantities for Liquefaction Facility Construction (Hydrocarbons Technology, 2009b) ...................................................................................................................... 14
Table A-8: Air Emissions (kg/kg LNG) for Construction of a Liquefaction Facility .................. 15Table A-9: Air Emissions (kg/kg Natural Gas Output) for Drilling Platform Operations ........... 20
Table A-10: Air Emissions (kg/kg NG) due to Natural Gas Pipeline Operations ........................ 24
Table A-11: Air Emissions (kg/kg LNG produced) for Operation of the Liquefaction Facility .. 25
Table A-12: Air Emissions (kg/kg LNG) due to Installation/Deinstallation of the Regasification Facility .......................................................................................................................................... 28
Table A-13: Air Emissions due to the Construction of a LNG Tanker, kg/kg delivered LNG .... 29
Table A-14: LNG Regasification Facility Construction Materials ............................................... 30
Table A-15: Air Emissions (kg/kg NG) for the Construction of the LNG Regasification Facility. ....................................................................................................................................................... 31
Table A-16: Air Emissions (kg/kg LNG) during LNG Tanker Operations .................................. 32
Table A-17: Air Emissions (kg/kg LNG) emitted during LNG Tanker Berthing Operations ...... 34
Table A-18: Air Emissions (kg/kg NG) for LNG Regasification Operations .............................. 36
Table A-19: GaBi Air Emission Outputs and Profiles for Power Plant Installation/Deinstallation, kg/MWh Plant Output ................................................................................................................... 40
Table A-20: GaBi Air Emission Outputs and Profiles used for NGCC Plant Construction without CCS, kg/MWh Plant Output ......................................................................................................... 44
Table A-21: Air Releases from Auxiliary Boiler .......................................................................... 46
Table A-22: Air Emissions (kg/MWh) due to Power Plant Operations, NGCC without CCS .... 47
Table A-23: Air Emissions (kg/MWh) for NGCC with CCS Plant Construction ........................ 50
Table A-24: Air Emissions (kg/MWh) associated with NGCC plant Operations with CCS ....... 54
Table A-25: GaBi Modeling Framework Inputs for Transmission Line Loss .............................. 55

Appendix: NGCC-LCA
iv
List of Figures
Figure A-1: Main GaBi Plan for the NGCC Case with CCS .......................................................... 2
Figure A-2: GaBi Plan for LC Stage #1: Natural Gas Extraction ................................................... 3
Figure A-3: Fuel Inputs into the Drill Rig Commissioning/Decommissioning Third Level GaBi Plan ................................................................................................................................................. 5
Figure A-4: Offshore Pipeline Installation/Deinstallation GaBi Plan ............................................ 7
Figure A-5: GaBi Plan for Onshore Pipeline Installation, /Mile of Pipeline Installed ................... 8
Figure A-6: GaBi Plan for Installation/Deinstallation of a Liquefaction Facility /kg LNG Output ....................................................................................................................................................... 10
Figure A-7: GaBi Plan and Material Inputs for Construction of a Drilling Platform ................... 12
Figure A-8: Representative Illustration of Oil Fields and Pipelines in and Around Trinidad (Offshore Technology, 2009) ........................................................................................................ 12Figure A-9: GaBi Plan and Material Inputs for Construction of a Natural Gas Pipeline ............. 13
Figure A-10: GaBi Plan and Material Inputs for Construction of a Liquefaction Facility ........... 16
Figure A-11: GaBi Plan and Energy Inputs for Drilling Platform Operations ............................. 21
Figure A-12: Second Level GaBi Plan: Stage #2 Natural Gas Transport ..................................... 26
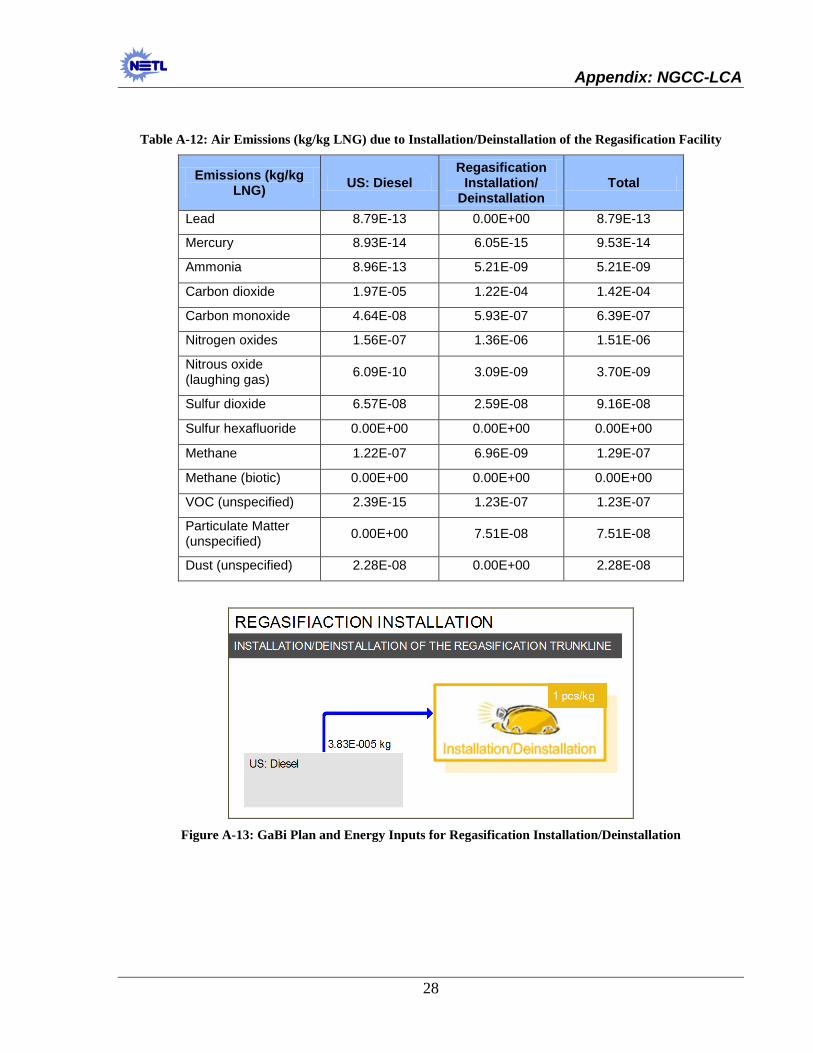
Figure A-13: GaBi Plan and Energy Inputs for Regasification Installation/Deinstallation .......... 28
Figure A-14: GaBi Plan and Material Inputs for LNG Tanker Construction ............................... 30
Figure A-15: GaBi Plan and Inputs for the Construction of the LNG Regasification Facility .... 31
Figure A-16: GaBi Plan and Energy Input for LNG Tanker Operation ....................................... 33
Figure A-17: GaBi Plan and Energy Inputs for LNG Tanker Berthing Operations ..................... 34
Figure A-18: GaBi Plan and Energy Inputs for the Operation of the Regasification Facility ...... 36
Figure A-19: GaBi Plan for NGCC Case without CCS ................................................................ 37
Figure A-20: GaBi Plan for Power Plant Installation/Deinstallation ............................................ 40
Figure A-21: GaBi Plan for NGCC Plant Construction without CCS .......................................... 43
Figure A-22: GaBi Plan for Stage #3, Case 2: NGCC with CCS ................................................. 48
Figure A-23: GaBi Plan and Inputs for NGCC Plant with CCS Construction ............................. 52

Appendix: NGCC-LCA
v
Acronyms and Abbreviations $/MW-hour Dollar per Megawatt Hour
°C Degree Celsius
°F Degree Fahrenheit
ACSR/AW Aluminum Conductors, Aluminum-Clad Steel Reinforced
AEO Annual Energy Outlook
ALNG Atlantic LNG Company of Trinidad and Tobago
As Arsenic
ASTM American Society for Testing and Material Standards
AWG American Wire Gage
bcfd Billion Cubic Feet per Day
Btu British thermal unit
Btu/kWh British thermal unit per Kilowatt-Hour
CAP Criteria Air Pollutants
CCS Carbon Capture and Sequestration
CH4 Methane
cm Centimeter
CPM Center for Environmental Assessment of Product and Material Systems
CTG Combustion Turbine Generator
CO Carbon Monoxide
CO2 Carbon Dioxide
CO2e Carbon Dioxide Equivalent
COE Cost of Electricity
DOE Department of Energy
EERE Energy Efficiency and Renewable Energy
EIA Energy Information Administration
EIS Environmental Impact Statements
EPA Environmental Protection Agency
EPC Engineer/Procure/Construct
FG Flue Gas
FERC Federal Energy Regulatory Commission
Appendix: NGCC-LCA
vi
Fi Consumption of Fuel per Unit of Product
ft3/day Cubic Feet per Day
g Gram
G&A General and Administrative
Gal/day Gallons per Day
GE General Electric
GHG Greenhouse Gases
GJ Gigajoule
gpm Gallons per Minute
GtC Gigatonnes of Carbon
GtCO2 Gigatonnes of Carbon Dioxide
GWP Global Warming Potential
H2S Hydrogen Sulfide
ha Hectare
HC Hydrocarbons
HDSAM Argonne National Laboratory Hydrogen Delivery Scenario Analysis Model
Hg Mercury
HHV Higher Heating Value
hrs Hours
HRSG Heat Recovery Steam Generators
HVAC High-Voltage Alternating Current
IKP University of Stuttgart
IPCC Intergovernmental Panel on Climate Change
ISO International Organization of Standardization
kg Kilogram
kg/GJ Kilogram per Gigajoule
kg/h Kilogram per Hour
kg/MWh Kilogram per Megawatt hour
kJ Kilojoule
km Kilometer
kV Kilovolt
kW Killowatt

Appendix: NGCC-LCA
vii
kWe Kilowatt of Electricity
kWh Kilowatt-Hour
kWh/tonne Kilowatt Hour per Tonne
kWt Kilowatt-Tonnage
L Liter
lb Pound
lb/h Pound per Hour
lb/MWh Pound per Megawatt Hour
lbs/day Pounds per Day
LC Life Cycle
LCA Life Cycle Analysis
LCC Life Cycle Cost
LCI Life Cycle Inventory
LCIA Life Cycle Impact Assessment
LCOE Levelized Cost of Electricity
LHV Lower Heating Value
LNB Low-Nitrogen Oxides Burner
LNG Liquefied Natural Gas
m3/min Cubic Meter per Minute
MACRS Modified Accelerated Cost Recovery System
MEA Monoethanolamine
mills/kWh Mills per Kilowatt-Hour
MJ Mega-Joule
mL Milliliter
mm Millimeter
MMBtu Million British thermal units
MMV Measurement, Monitoring, and Verification
MPa Megapascals
MTPA Metric Tonnes per Annum
MVA Megavolt-Ampere
MW Megawatt
MWh Megawatt-Hour

Appendix: NGCC-LCA
viii
MWe Megawatts (Electric)
N2O Nitrous Oxide
NETL National Energy Technology Laboratory
NGCC Natural Gas Combined Cycle
NH3 Ammonia
NO2 Nitrogen Dioxide
NOX Oxides of Nitrogen
O&M Operations and Maintenance
oz/ft2 Fluid Ounces per Square Foot
Pb Lead
pH Potential Hydrogen
PM Particulate Matter
PM10 Particulate Matter (diameter 10 micrometer)
PM2.5 Particulate Matter (diameter 2.5 micrometer)
PO4 Phosphate
ppm Parts per Million
ppmv Parts per Million Volume
psi Pounds per Square Inch
psia Pounds per Square Inch Absolute
psig Pounds per Square Inch Gauge
PV Present Value
RDS Research and Development Solutions
scf Standard Cubic Feet
SCR Selective Catalytic Reduction
Se Selenium
SF6 Sulfur Hexafluoride
SO2 Sulfur Dioxide
SOX Sulfur Oxide
SOW Statement of Work
ST Steam Turbine
TBD To Be Determined
TOC Total Organic Compounds

Appendix: NGCC-LCA
ix
U.S. United States
VOC Volatile Organic Chemical
wt% Weight Percentage

Appendix: NGCC-LCA
1
A.1 Life Cycle Stage Process Modeling Data Assumptions and GaBi Modeling Inputs
Appendix A details the process modeling data assumptions and GaBi modeling inputs for each of the life cycle (LC) stages considered in this study. For more details on the system boundary and other aspects of this study, please see the main final report. GaBi output data will be shown for air emissions. Results associated with land and all economic modeling assumptions and results are included in the main text.
All stages will be the same for both cases except for Stage #3, which has different assumptions and therefore will be described separately for each case. For each stage, the construction assumptions will be discussed separately from the operations as they often come from different reference sources. When applicable, the commissioning, installation, and decommissioning will also be discussed. For clarity, the following are general descriptions of each term as they are used in this study:
• Construction: Emissions associated with the production of materials used during the construction of a process (e.g., steel used to build a power plant). Energy use and associated emissions due to the operation of a process.
• Installation/Deinstallation or Commissioning/Decommissioning: Installation/commissioning is the energy and emissions associated with the site preparation and erection of a facility. Deinstallation/decommissioning includes the energy use and emissions associated with removing a facility and, if necessary, returning the land to its original state.
• Operations: Energy and emissions due to the operation of a process. All assumptions and data limitations will be noted. All references are listed at the conclusion of the appendix.
Figure A-1 is the main GaBi plan for this study; this specific plan is for the Natural Gas Combined Cycle (NGCC) case with carbon capture and sequestration (CCS), but both are similar. Plans are used in GaBi to assemble unit processes or sub-plans (nested plans) within an LC study. Essentially, plans are the process maps which visually depict a stage or sub-stage in a system. There are several levels of plans: main, second level, third level, etc. The main plan represents the highest level LC in which all other plans are embedded; from the main plan one could click onto a secondary plan (i.e., LC Stage #1 natural gas extraction), and from there onto a third level plan (i.e., drill rig construction). The input and output values shown on this plan are based on the reference flow of 1 MWh (3,600 MJ = 1 MWh). Also included in Figure A-1 are the adjustable parameters considered during the life cycle inventory (LCI) sensitivity analysis for this study (see main report text for results). Specific details on why these parameters are adjustable are included within the following data assumption text.

Appendix: NGCC-LCA
2
Figure A-1: Main GaBi Plan for the NGCC Case with CCS
A.1.1 Life Cycle Stage #1: Raw Material Acquisition – Natural Gas Extraction and LNG Production
A.1.1.1 GaBi Plan Figure A-2 is the second level GaBi plan for Stage #1. The reference flow of this stage is 1 kg of natural gas (LNG). Data assumptions for each input are discussed in the following sections. Water withdrawals and emissions are not captured in the GaBi plans; they only show input data that is tracked within the GaBi modeling system. Emissions are considered outputs and therefore are not included. Water withdrawal and consumption, although an input, is not tracked in the model as no GaBi profiles exist for water use in the model to date. For now, water is inventoried for each stage, when applicable.

Appendix: NGCC-LCA
3
Figure A-2: GaBi Plan for LC Stage #1: Natural Gas Extraction
A.1.1.2 Installation and Deinstallation Assumptions
Natural Gas Well Installation The installation of natural gas wells includes the drilling of the well, followed by the installation of a well casing that provides strength to the well bore and prevents contamination of the geological formations that surround the gas reservoir. In the case of offshore extraction, a large platform is also required.
Vertical drilling is used for conventional wells, which recover natural gas from reservoirs with large pockets of oil or natural gas. Horizontal drilling is used for unconventional natural gas reserves where the distribution of hydrocarbon is dispersed throughout a matrix of shale or coal. Horizontal drilling is often accompanied by hydrofracing operations.
An advanced drilling rig has a drilling speed of 17.8 meters per hour, which translates to the drilling of a 7,000 foot well in approximately 10 days (Natural Gas.org, 2004). A typical diesel engine used for oil and gas exploration has a power of 700 horsepower and a heat rate of 7,000 Btu/hp-hr (EPA, 1995). The diesel consumption per hour of drilling was calculated from the above horsepower and heat rate and was applied to AP-42 emission factors for diesel combustion in stationary industrial engines (EPA, 1995) in order to determine the emissions from the installation of a well.
This analysis assumes that the deinstallation of a natural gas well incurs 10 percent of the energy requirements and emissions as the original installation of the well.

Appendix: NGCC-LCA
4
Table A-1 summarizes the air emissions during platform installation/deinstallation.

Appendix: NGCC-LCA
5
Table A-1: Air Emissions (kg/kg Natural Gas Output) during Platform Installation/Deinstallation
Emissions (kg/kg NG)
Natural Gas Well Installation / Deinstallation Coal Bed Methane
Barnett Shale Offshore
Associated Gas Onshore
Lead 4.18E-15 4.18E-15 4.18E-15 4.18E-15 4.18E-15
Mercury 2.96E-16 2.96E-16 2.96E-16 2.96E-16 2.96E-16
Ammonia 3.31E-11 3.31E-11 3.31E-11 3.31E-11 3.31E-11
Carbon dioxide 8.53E-07 8.53E-07 8.53E-07 8.53E-07 8.53E-07
Carbon monoxide 1.02E-09 1.02E-09 1.02E-09 1.02E-09 1.02E-09
Nitrogen oxides 1.14E-08 1.14E-08 1.14E-08 1.14E-08 1.14E-08
Nitrous oxide 2.08E-11 2.08E-11 2.08E-11 2.08E-11 2.08E-11
Sulfur dioxide 2.45E-09 2.45E-09 2.45E-09 2.45E-09 2.45E-09
Sulfur hexafluoride 2.38E-19 2.38E-19 2.38E-19 2.38E-19 2.38E-19
Methane 9.09E-10 9.09E-10 9.09E-10 9.09E-10 9.09E-10
VOC (unspecified) 3.25E-10 3.25E-10 3.25E-10 3.25E-10 3.25E-10
Particulate Matter 8.46E-11 8.46E-11 8.46E-11 8.46E-11 8.46E-11
Based on the given data assumptions, Figure A-3 represents the fuel inputs to commission and decommission a natural gas well; values are shown on the basis of 1 kg of natural gas production.
Figure A-3: Fuel Inputs into the Drill Rig Commissioning/Decommissioning Third Level GaBi Plan
Pipeline The installation of an offshore (underwater) pipeline carrying processed natural gas from the drilling platform to the onshore transfer point is characterized by the energy and environmental burdens associated with the installation of a 101-km (63 miles) underwater natural gas pipeline (Offshore Technology, 2009). This process assumes that the pipeline will have a service life of 30 years and will be decommissioned by being left in place (therefore no decommissioning energy or emissions assumed). Emissions during installation are attributed to the operation of surface ships supporting the underwater pipeline installation. Diesel use and subsequent

Appendix: NGCC-LCA
6
emissions are either from the primary engines used for vessel propulsion or secondary engines driving support equipment such as air compressors. Data from an emissions study for underwater pipeline installation activity suggests that 0.4 hours of a surface ship’s time is required for every foot of underwater pipeline installed (Billings and Wilson, 2004). On the basis of a 101-km (63 miles) underwater natural gas pipeline, the total time required for installation would be 132,546 vessel-hours.
Fuel consumption in terms of g/kWh power output is a function of a fractional load of 75 percent for the support ship diesel engines (Billings and Wilson, 2004). The total diesel fuel consumption was calculated based on a given average diesel rating of 895 kW and the total vessel hours previously calculated. Emissions factors for criteria pollutants, GHGs, Hg, and NH3 were applied to diesel fuel consumption (Battye, Battye et al., 1994; Conaway, Mason et al., 2005; EIA, 2008; EPA, 2002). The emissions for the fuel consumption were divided by the total natural gas flow through the pipeline over its anticipated 30-year life. Table A-2 and Figure A-4 summarize the inputs and output air emissions for offshore pipeline installation.
Table A-2: Air Emissions (kg/kg Natural Gas Output) for Offshore Pipeline Installation
Emissions (kg/kg NG) US: Diesel Offshore Pipeline
Installation Total
Lead 2.27E-12 0.00E+00 2.27E-12 Mercury 2.31E-13 1.57E-14 2.47E-13 Ammonia 2.32E-12 1.31E-08 1.31E-08 Carbon dioxide 5.08E-05 3.18E-04 3.69E-04 Carbon monoxide 1.20E-07 2.23E-06 2.35E-06 Nitrogen oxides 4.04E-07 4.75E-06 5.15E-06 Nitrous oxide (laughing gas) 1.58E-09 8.01E-09 9.58E-09
Sulfur dioxide 1.70E-07 7.96E-07 9.66E-07 Sulfur hexafluoride 0.00E+00 0.00E+00 0.00E+00 Methane 3.16E-07 2.30E-08 3.39E-07 Methane (biotic) 0.00E+00 0.00E+00 0.00E+00 VOC (unspecified) 6.18E-15 0.00E+00 6.18E-15 Particulate Matter (unspecified) 0.00E+00 7.96E-07 7.96E-07
Dust (unspecified) 5.89E-08 0.00E+00 5.89E-08

Appendix: NGCC-LCA
7
Figure A-4: Offshore Pipeline Installation/Deinstallation GaBi Plan
Emissions consistent with underground (onshore) pipeline installation include heavy construction equipment exhaust emissions, emissions from transport of pipes and associated materials (200 miles round-trip), and fugitive dust. Particulate matter (PM), nitrogen oxide (NOX), sulfur oxide (SOX), carbon monoxide (CO), and volatile organic chemical (VOC) emissions were estimated for pipeline installation based on the installation of a natural gas pipeline (SMUD, 2001). Emissions were placed on a per mile-installed basis. Diesel consumption was also estimated from the aforementioned report.
The emissions of four other pollutants (methane [CH4], nitrous oxide [N2O], NH3, and Hg) were calculated using different sources in conjunction with the estimated diesel consumption (SMUD 2001). The emissions factors for CH4 and N2O were pulled from Appendix H of a report from the U.S. Department of Energy (DOE) (2006). It was assumed that the construction equipment would be diesel powered. These emission factors were 0.58 g/gallon of diesel for CH4 and 0.26 g/gallon for N2O (DOE, 2006). The NH3 emission factor was obtained from a report published by the Environmental Protection Agency (EPA) documenting the development and selection of emission factors for NH3. The emission factor for the combustion of diesel from mobile sources was given as 0.11 kg/1,000 liters (L) of diesel (Battye, Battye et al., 1994). The emission factor of the final pollutant, Hg, was determined by dividing the average concentration of Hg in diesel from various studies by the number of samples to get 0.1564 nanogram per gram diesel (Conaway, Mason et al., 2005). Water usage for hydrotesting pipeline is ignored because it is assumed that water is returned to its source after use. As with most other processes, deinstallation emissions are assumed to be 10 percent of installation emissions. Table A-3 and Figure A-5 summarize the inputs and output air emissions for onshore pipeline installation/deinstallation. It is important to note that the diesel input and air emissions are based on 1 mile of pipeline, not a kg natural gas basis as with offshore pipeline installation. This is done so that this unit process can be varied for different studies based on the length of pipeline required.

Appendix: NGCC-LCA
8
Table A-3: Air Emissions (kg/mile) during Onshore Pipeline Installation/Deinstallation
Emissions (kg/mile)
US: Diesel at refinery
PE
Pipeline Installation/
Deinstallation Total
Lead 1.37E-14 0 1.37E-14
Mercury 1.16E-15 1.15E-16 1.27E-15
Ammonia 2.02E-12 9.51E-11 9.71E-11
Carbon dioxide 3.02E-07 2.93E-06 3.24E-06
Carbon monoxide 4.42E-10 1.04E-08 1.08E-08
Nitrogen oxides 9.39E-10 3.00E-08 3.10E-08
Nitrous oxide (laughing gas) 5.18E-12 5.94E-11 6.45E-11
Sulfur dioxide 1.21E-09 0 1.21E-09
Sulfur hexafluoride 1.15E-18 0 1.15E-18
Methane 3.14E-09 1.32E-10 3.28E-09
Methane (biotic) 0 0 0
VOC (unspecified) 1.31E-12 2.20E-09 2.21E-09
Particulate Matter (unspecified) 0 5.94E-09 5.94E-09
Dust (unspecified) 1.79E-11 0 1.79E-11
Figure A-5: GaBi Plan for Onshore Pipeline Installation, /Mile of Pipeline Installed

Appendix: NGCC-LCA
9
Liquefaction Facility Data for installation/deinstallation of the liquefaction facility was based on environmental records provided by the AES Corporation on their Sparrows Point LNG import and regasification facility near Baltimore, Maryland (AES Corporation, 2009, 2007). Sparrows Point is a Federal Energy Regulatory Commission (FERC) approved 1.5 billion cubic feet per day (bcfd) regasification facility slated to be operational in 2010 (FERC, 2009). Although data was available for other processes, no energy use installation data was found that was specific to a liquefaction facility. The Sparrows Point data were determined to be the best available representation, and is therefore used as surrogate data to describe the installation/deinstallation of the Atlantic LNG (ALNG) facility. Energy use and emissions associated with the installation/deinstallation of the facility include preparation of the onshore and offshore areas. Onshore activities include those related to construction of the facility itself, pier rehabilitation, and pier dredging using land equipment (AES Corporation, 2007). Offshore activities include pier dredging using marine equipment (AES Corporation, 2007). It is assumed that diesel consumption accounts for the majority of energy use and emissions during the installation of the terminal.
The Sparrows Point records listed the equipment, operating hours, horsepower, and diesel consumption (lbs diesel per brake-specific horsepower-hour) for specific horsepower ranges for each installation activity as well as the following air emissions: PM, NOX, sulfur dioxide (SO2) based on a diesel sulfur content of 0.05 percent, CO, and unspecified hydrocarbons (HC) (AES Corporation, 2007). No data were provided for GHG, NH3, of Hg emissions. Emission factors were applied to the calculated diesel consumption in order to calculate the emission of carbon dioxide (CO2), N2O, CH4, NH3, and Hg (Battye, Battye et al., 1994; Conaway, Mason et al., 2005; EIA, 2008; EPA, 2002). The emissions were adjusted on the basis of the Darwin liquefaction facility land use and LNG processing quantities (Bechtel, 2004; Hydrocarbons Technology, 2009a), as Sparrows Point, as previously stated, is a regasification facility with different operations.
The Sparrows Point records express the installation activities on the basis of the installation of an entire facility (AES Corporation, 2007). Using an assumed lifetime of 30 years and a daily production rate of 1.5 bcfd of natural gas upon which the raw unadjusted emissions were based, it was calculated that Sparrows Point will have a lifetime throughput of 3.13E+11 kilograms of natural gas. Therefore, the diesel consumption and air emissions for the installation of the LNG terminal were divided by the lifetime throughput to determine the diesel and air emissions on the basis of 1 kilogram of natural gas throughput. Table A-4 and Figure A-6 summarize the inputs and output air emissions for liquefaction installation.

Appendix: NGCC-LCA
10
Table A-4: Air Emissions (kg/kg LNG) for the Installation/Deinstallation of a Liquefaction Facility
Emissions (kg/kg LNG)
Liquefaction Installation/
Deinstallation Diesel Total
Lead 0 4.34E-12 4.34E-12
Mercury 2.99E-14 4.41E-13 4.71E-13
Ammonia 2.57E-08 4.42E-12 2.57E-08
Carbon dioxide 6.04E-04 9.70E-05 7.01E-04
Carbon monoxide 3.79E-06 2.29E-07 4.02E-06
Nitrogen oxides 5.96E-06 7.71E-07 6.73E-06
Nitrous oxide (laughing gas) 1.53E-08 3.01E-09 1.83E-08
Sulfur dioxide 1.20E-07 3.24E-07 4.44E-07
Sulfur hexafluoride 0 0 0
Methane 3.44E-08 6.04E-07 6.38E-07
Methane (biotic) 0 0 0
VOC (unspecified) 7.82E-07 1.18E-14 7.82E-07
Particulate Matter (unspecified) 4.13E-07 0 4.13E-07
Dust (unspecified) 0 1.12E-07 1.12E-07
Figure A-6: GaBi Plan for Installation/Deinstallation of a Liquefaction Facility /kg LNG Output

Appendix: NGCC-LCA
11
A.1.1.3 Construction Assumptions
Natural Gas Well Construction
The construction of natural gas wells requires a well casing that provides strength to the well bore and prevents contamination of the geological formations that surround the gas reservoir. In the case of offshore extraction, a large platform is also required.
A well is lined with a carbon steel casing that is held in place with concrete. A typical casing has an inner diameter of 8.6 inches, is 0.75 inches thick, and weighs 24 pounds per foot (Natural Gas.org, 2004). The weight of concrete used by the well walls is assumed to be equal to the weight of the steel casing. The total weight of materials for the construction of a well bore is estimated by factoring the total well length by the above linear weight of carbon steel and concrete. Offshore extraction operations require a drilling platform that provides a stable surface for the wellhead and all associated equipment. Offshore drilling platforms can be secured to the ocean floor using flexible cables or rigid beams. The material requirements for the construction of an offshore platform as modeled in this analysis are based on the materials reported for an offshore platform in the Gulf of Mexico (Offshore-technology.com, 2010).
Table A-5 and Figure A-7 show the material input flows and air emissions for the drilling platform construction unit process.
Table A-5: Air Emissions (kg/kg Natural Gas Output) During Well Construction
Emissions (kg/kg NG)
Natural Gas Well Construction Coal Bed Methane
Barnett Shale Offshore
Associated Gas Onshore
Lead 1.30E-08 1.04E-08 6.78E-13 2.11E-09 1.24E-09
Mercury 3.50E-10 2.80E-10 5.58E-14 5.67E-11 3.35E-11
Ammonia 3.54E-08 2.83E-08 2.67E-10 5.75E-09 3.39E-09
Carbon dioxide 8.83E-03 7.06E-03 8.25E-02 1.43E-03 8.45E-04
Carbon monoxide 4.36E-05 3.49E-05 5.06E-05 7.07E-06 4.17E-06
Nitrogen oxides 5.50E-05 4.40E-05 1.97E-04 8.93E-06 5.27E-06
Nitrous oxide 2.73E-07 2.18E-07 2.02E-06 4.43E-08 2.61E-08
Sulfur dioxide 2.36E-05 1.89E-05 2.17E-06 3.83E-06 2.26E-06
Sulfur hexafluoride 3.94E-15 3.15E-15 3.68E-17 6.40E-16 3.77E-16
Methane 1.63E-05 1.30E-05 4.28E-04 2.64E-06 1.56E-06
VOC (unspecified) 5.22E-06 4.17E-06 1.34E-06 8.46E-07 4.99E-07
Particulate Matter 1.65E-05 1.32E-05 4.06E-06 2.67E-06 1.58E-06

Appendix: NGCC-LCA
12
Figure A-7: GaBi Plan and Material Inputs for Construction of a Drilling Platform
Pipeline This process models the materials used in the construction of an offshore (underwater) and onshore pipeline that transports natural gas from the drilling platform to the ALNG liquefaction facility. The pipelines in this study were modeled after BP's existing pipeline infrastructure in Trinidad, which is represented in Figure A-8; specifically, the pipeline from the Mahogany platform to Point Fortin (location of the ALNG facility) (ALNG, 2006; Offshore Technology, 2009). Therefore, it was assumed that the gas is transported from the production platform to the shore by a 40-inch diameter underwater 101-km (63 mile) pipeline. Once onshore, the gas is transported to the liquefaction plant by a 36-inch diameter 80-km (50 mile) pipeline.
Figure A-8: Representative Illustration of Oil Fields and Pipelines in and Around Trinidad (Offshore
Technology, 2009)

Appendix: NGCC-LCA
13
The unit length of the pipe was determined using an online calculator (Steel Pipes & Tools, 2009). The weight of valves and fittings were estimated at an additional 10 percent of the total pipeline weight. The pipeline was assumed to have a life of 30 years for this unit process. The weight of pipeline construction per kilogram of natural gas was determined by dividing the total pipeline weight by the total natural gas flow through the pipeline for a 30-year period. Table A-6 and Figure A-9 show the material inputs and air emissions for the natural gas pipeline construction unit process.
Table A-6: Air Emissions (kg/kg Natural Gas Transported) for Pipeline Construction
Emissions (kg/kg NG)
Steel Pipe, Welded, BF, Manufacture
Total
Lead 1.27E-09 1.27E-09
Mercury 3.36E-11 3.36E-11
Ammonia 0 0
Carbon dioxide 4.17E-04 4.17E-04
Carbon monoxide 3.09E-06 3.09E-06
Nitrogen oxides 6.81E-07 6.81E-07
Nitrous oxide (laughing gas) 2.33E-08 2.33E-08
Sulfur dioxide 1.18E-06 1.18E-06
Sulfur hexafluoride 0 0
Methane 4.42E-07 4.42E-07
Methane (biotic) 0 0
VOC (unspecified) 5.62E-08 5.62E-08
Particulate Matter (unspecified) 0 0
Dust (unspecified) 4.90E-07 4.90E-07
Figure A-9: GaBi Plan and Material Inputs for Construction of a Natural Gas Pipeline

Appendix: NGCC-LCA
14
Liquefaction Facility Data on construction material inputs for the liquefaction facility were based on data from the Qatar Gas I LNG Plant, located in Ras Laffan, Qatar (Hydrocarbons Technology, 2009b). This facility has an annual natural gas liquefaction capacity of 7.2 million metric tonnes. The LNG facility was assumed to have a life of 30 years for this unit process. Table A-7 lists the materials used in the construction of the LNG facility.
Table A-7: Material Quantities for Liquefaction Facility Construction (Hydrocarbons Technology, 2009b)
Materials Amount Units
Concrete 182,600 m3 Structural Steel 9300 tonnes Steel Pipe 28000 tonnes
Other Miscellaneous Equipment 32000 tonnes
The weight of LNG facility construction per kilogram of natural gas liquefied/shipped was determined by dividing the individual component weights by the total natural gas flow through the LNG facility for a 30-year period. Table A-8 and Figure A-9 show the material inputs and air emissions for the natural gas pipeline construction unit process. The LC profile of concrete manufacturing requires separate electricity input, which is reflected in the table and figure. This does not mean that other materials don’t require electricity it is just not reflected separately in their LC profile.

Appendix: NGCC-LCA
15
Table A-8: Air Emissions (kg/kg LNG) for Construction of a Liquefaction Facility
Emissions (kg/kg LNG)
Concrete, Ready Mixed, R-5-0 (100%
Portland Cement)
US: SERC Power Grid
Mix 2005
Steel Pipe, Welded, BF, Manufacture
Steel Plate, BF,
Manufacture Total
Lead 0 7.57E-12 4.34E-10 4.39E-10 8.80E-10
Mercury 0 2.13E-12 1.15E-11 2.76E-11 4.12E-11
Ammonia 0 7.30E-10 0 0 7.30E-10
Carbon dioxide 1.17E-04 1.52E-04 1.42E-04 2.22E-04 6.33E-04
Carbon monoxide 1.51E-07 6.28E-08 1.05E-06 1.87E-06 3.14E-06
Nitrogen oxides 3.58E-07 2.94E-07 2.32E-07 3.71E-07 1.26E-06
Nitrous oxide (laughing gas) 0 2.01E-09 7.95E-09 1.15E-08 2.15E-08
Sulfur dioxide 2.72E-07 8.62E-07 4.04E-07 5.04E-07 2.04E-06
Sulfur hexafluoride 0 1.04E-15 0 0 1.04E-15
Methane 0 1.67E-07 1.51E-07 1.68E-07 4.85E-07
Methane (biotic) 5.34E-09 0 0 0 5.34E-09
VOC (unspecified) 1.32E-08 2.12E-11 1.92E-08 3.29E-08 6.53E-08
Particulate Matter (unspecified)
0 0 0 0 0
Dust (unspecified) 3.49E-07 1.64E-08 1.67E-07 5.31E-08 5.86E-07

Appendix: NGCC-LCA
16
Figure A-10: GaBi Plan and Material Inputs for Construction of a Liquefaction Facility
A.1.1.4 Operation Assumptions Adequate primary data are not available for the energy and material flows of the five domestic natural gas extraction sources of this analysis. Thus, this analysis developed unit processes for natural gas extraction by characterizing the key sub-systems for natural gas extraction, and then combined these subsystems according to the practices and technology requirements of each extraction type.
The key sub-systems for natural gas extraction include compression, dehydration, sweetening, flaring, oil/gas separation, water use, and water quality. The data and assumptions for these sub-systems are described below.
Compression Compressors are used at the natural gas wellhead to increase the gas pressure for pipeline distribution. The use of a compressor depends on the natural pressure at the wellhead, which varies from reservoir to reservoir and decreases with increasing well life.
The energy required for compressor operations is based on manufacturer data that compares power requirements to compression ratios (the ratio of outlet to inlet pressures). A two-stage compressor with an inlet pressure of 50 psig and an outlet pressure of 800 psig has a power requirement of 187 horsepower per MMCF of natural gas; a three-stage compressor with an inlet pressure of zero psig and an outlet pressure of 800 psig has a power requirement of 282 horsepower per MMCF of natural gas (GE, 2005). Using a natural gas density of 0.042 lb/scf and converting to SI units gives a compression energy intensity of 1.76E-04 MWh per kg of natural gas and 2.65E-04 MWh per kg of natural gas, respectively. These energy intensities represent the required output of compressors per unit of natural gas that is compressed.
A centrifugal compressor uses rotary motion in which an inlet gas stream is received at the hub of a set of rotating blades and propelled outward to produce a compressed gas stream. Centrifugal compressors are preferred for large-scale extraction operations because they are more efficient than reciprocating compressors. Additionally, the smooth

Appendix: NGCC-LCA
17
operations of centrifugal compressors, in contrast to the vibrations of reciprocating compressors, make centrifugal compressors preferable for offshore extraction operations because it is important to minimize vibrations on offshore platforms. The natural gas fuel requirements for a gas-powered, centrifugal compressor are assumed to be comparable to those for a gas-powered turbine. The energy intensity of a gas-powered turbine is 10,833 Btu/kWh (API, 2009). Using a natural gas heating value of 1,027 Btu/scf, a natural gas density of 0.042 lb/scf, and converting to SI units translates to 201 kg of natural gas per MWh of centrifugal, gas-powered turbine output. This fuel factor represents the mass of natural gas that is combusted per compressor energy output. The air emissions from the combustion of natural gas in reciprocating compressors are based on EPA’s AP-42 emission factors for fuel combustion in stationary equipment. These emission factors include greenhouse gases, criteria pollutants, and other air emissions specific to centrifugal compressors (EPA, 1995).
An electric centrifugal compressor uses the same compression principles as a gas-powered centrifugal compressor, but its shaft energy is provided by an electric motor instead of a gas-fired turbine. If the natural gas extraction site is near a source of electricity, it is financially preferable to use electrically-powered equipment instead of gas-powered equipment. This is the case for extraction sites for Barnett Shale located near Dallas-Fort Worth. The use of electric equipment is also an effective way of reducing the noise of extraction operations, which is encouraged when an extraction site is near a city. The average power range of electrically-driven compressor in the U.S. natural gas transmission network is greater than 500 horsepower. This analysis assumes that compressors of this size have an efficiency of 95 percent (DOE, 1996). This efficiency is the ratio of mechanical power output to electrical power input. Thus, approximately 1.05 MWh of electricity is required per MWh of compressor energy output . The upstream emissions associated with the generation of electricity are modeled with the fuel mix of the ERCOT grid, which is representative of electricity generation in Texas (the location of Barnett Shale).
A reciprocating compressor uses pistons for gas compression. Reciprocating compressors used for industrial applications are driven by a crankshaft that can be powered by 2- or 4-stroke diesel engines. Reciprocating compressors are not as efficient as centrifugal compressors and are typically used for small scale extraction operations that do not justify the increased capital requirements of centrifugal compressors. The natural gas fuel requirements for a gas-powered, reciprocating compressor used for natural gas extraction are based on a compressor survey conducted for natural gas production facilities in Texas (Houston Advanced Research Center, 2006). The average energy intensity of a gas-powered turbine is 8.74 Btu/hp-hr (Houston Advanced Research Center, 2006). Using a natural gas heating value of 1,027 Btu/scf, a natural gas density of 0.042 lb/scf, and converting to SI units translates to 217 kg of natural gas per MWh of centrifugal, gas-powered turbine output. This fuel factor represents the mass of natural gas that is combusted per compressor energy output. The air emissions from the combustion of natural gas in reciprocating compressors are based on EPA’s AP-42 emission factors for fuel combustion in stationary equipment. These emission factors include greenhouse gases, criteria pollutants, and other air emissions specific to reciprocating compressors (EPA, 1995).

Appendix: NGCC-LCA
18
Flaring Flaring is an intermittent operation, necessary in situations where a natural gas (or other hydrocarbons) stream cannot be safely or economically recovered. Flaring may occur when a well is being prepared for operations and the wellhead has not yet been fitted with a valve manifold, when it is not financially preferable to recover the associated natural gas from an oil well, or during emergency operations when the usual systems for gas recovery are not available.
The combustion products of flaring include carbon dioxide, methane, and nitrous oxide. Based on a 98 percent flaring efficiency, the flaring of 1 kg of natural gas results in air emissions of 3.0 kg, 1.8E-02 kg, and 3.4E-05 kg of carbon dioxide, methane, and nitrous oxide, respectively, per kg of flared natural gas (API, 2009). This analysis assumes that, in comparison to the other activities of natural gas extraction, the flaring emission of criteria air pollutants and other air emissions of concern are insignificant.
The flaring rate of natural gas is necessary to apply the above emission factors to a unit of natural gas production. Flaring rates are highly variable and depend more on the production practices and condition of equipment at an extraction site that the type of natural gas reservoir. Thus, flaring rates have been parameterized in the model to allow uncertainty analysis. However, each natural gas extraction process of this analysis includes a default flaring rate that is based on a report by the U.S. Government Accountability Office (2004). The flaring rate is 0.43 percent for offshore conventional gas extraction, 0.48 percent for onshore conventional gas extraction, 0.21 percent for onshore conventional associated gas extraction, 0.30 percent for gas from Barnett Shale, and 0.30 percent for gas from coal bed methane.
Dehydration Dehydration is necessary to remove water from raw natural gas, which makes it suitable for pipeline transport and increases its heating value. The configuration of a typical dehydration process includes an absorber vessel in which glycol-based solution comes into contact with a raw natural gas stream, followed by a stripping column in which the rich glycol solution is heated in order to drive off the water and regenerate the glycol solution. The regenerated glycol solution (the lean solvent) is recirculated to the absorber vessel.
A reboiler is used to heat the fluid in the stripper column; due to the heat integration of the absorber and stripper streams, the reboiler, which is heated by natural gas combustion, is the only equipment in the dehydration system that consumes fuel. The reboiler duty (the heat requirements for the reboiler) is a function of the flow rate of glycol solution, which, in turn, is a function of the difference in water content between raw and dehydrated natural gas. The typical water content for untreated natural gas is 49 lbs/MMCF. In order to meet pipeline requirements, the water vapor must be reduced to 4 lbs/MMCF of natural gas (EPA, 2006). The flow rate of glycol solution is 3 gallons per pound of water removed (EPA, 2006), and the heat required to regenerate glycol is 1,124 Btu/gal (EPA, 2006). By factoring the change in water content, the glycol flow rate, and boiler heat requirements, the energy requirements for dehydration are 8.0 Btu/kg of dehydrated natural gas. Assuming that the reboiler is fueled by natural gas, this translates to 1.5E-04 kg of natural gas combusted per kg of dehydrated natural gas.

Appendix: NGCC-LCA
19
The air emissions from the combustion of natural gas used by a dehydrator reboiler are based on EPA emission factors for natural gas combustion in industrial equipment (API, 2009).
In addition to absorbing water, the glycol solution also absorbs methane from the natural gas stream. This methane is lost to evaporation during the regeneration of glycol in the stripper column. Flash separators can be used to capture methane emissions from glycol strippers; however, this analysis assumes that flash separators are not used, resulting in methane emissions. The emission of methane from glycol dehydration is based on emission factors developed by the Gas Research Institute (API, 2009). Based on this emission factor, 3.4E-04 kg of methane is released for every kilogram of natural gas that is dehydrated.
Sweetening Raw natural gas contains varying levels of hydrogen sulfide (H2S), a toxic gas that reduces the heat content of natural gas and causes fouling in when combusted in equipment. The removal of H2S from natural gas is known as “sweetening”. Amine-based processes are the predominant technologies for the sweetening of natural gas.
The H2S content of raw natural gas is highly variable, with typical concentrations ranging from 5.7E-05 kg of H2S per kg of natural gas to 0.16 kg of H2S per kg of natural gas. This analysis assumes an H2S concentration of 2.3E-05 kg of H2S per kg of natural gas (which is equivalent to 1 mole of H2S per kg of natural gas).
The energy consumed by the amine reboiler accounts for the majority of energy consumed by the sweetening process. Reboiler energy consumption is a function of the amine flow rate, which, in turn, is related to the amount of H2S removed from natural gas. Approximately 0.30 moles of H2S are removed per 1 mole of circulated amine solution (Polasek, 2006), and the reboiler duty is approximately 1,000 Btu per gallon of amine (Arnold, 1999).
The amine reboiler combusts natural gas to generate heat for amine regeneration. This analysis applies EPA emission factors for industrial boilers (EPA, 1996) to the energy consumption rate discussed in the above paragraph in order to estimate the combustion emissions from amine reboilers.
The sweetening of natural gas is also a source of vented methane emissions. In addition to absorbing H2S, the amine solution also absorbs a portion of methane from the natural gas. This methane is released to the atmosphere during the regeneration of the amine solvent. The venting of methane from natural gas sweetening is based on emission factors developed by the Gas Research Institute; natural gas sweetening releases 2.8E-05 per kg per natural gas sweetened (API, 2009).
The loss rate of amine solvent is 2.4E-05 kg per kg of natural gas sweetened (Stewart, 1994). The loss rate of water is 2.8E-03 kg per kg of natural gas sweetened (Lungsford, 2006).
Oil and Gas Separation Oil and gas separation is necessary when natural gas is co-extracted with crude oil and other liquids. It is accomplished with a series of separation vessels that reduce the pressure of the oil/gas mixture, causing the gas to come out of solution.
Appendix: NGCC-LCA
20
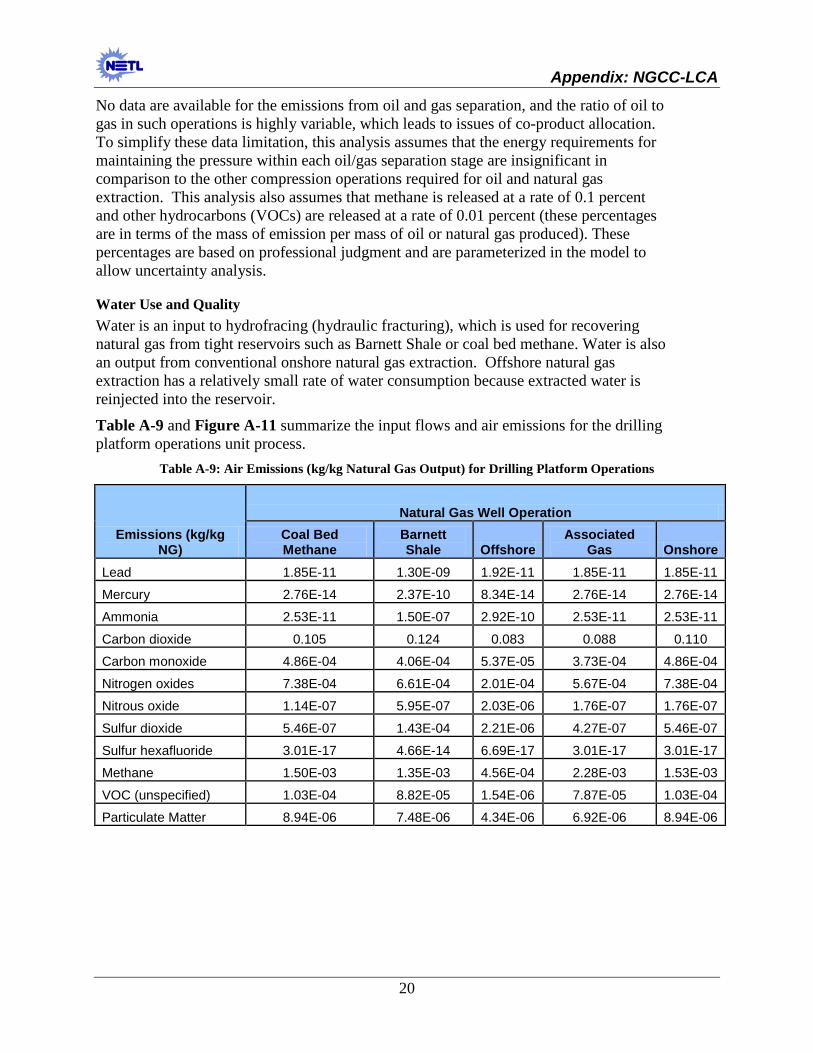
No data are available for the emissions from oil and gas separation, and the ratio of oil to gas in such operations is highly variable, which leads to issues of co-product allocation. To simplify these data limitation, this analysis assumes that the energy requirements for maintaining the pressure within each oil/gas separation stage are insignificant in comparison to the other compression operations required for oil and natural gas extraction. This analysis also assumes that methane is released at a rate of 0.1 percent and other hydrocarbons (VOCs) are released at a rate of 0.01 percent (these percentages are in terms of the mass of emission per mass of oil or natural gas produced). These percentages are based on professional judgment and are parameterized in the model to allow uncertainty analysis.
Water Use and Quality Water is an input to hydrofracing (hydraulic fracturing), which is used for recovering natural gas from tight reservoirs such as Barnett Shale or coal bed methane. Water is also an output from conventional onshore natural gas extraction. Offshore natural gas extraction has a relatively small rate of water consumption because extracted water is reinjected into the reservoir.
Table A-9 and Figure A-11 summarize the input flows and air emissions for the drilling platform operations unit process.
Table A-9: Air Emissions (kg/kg Natural Gas Output) for Drilling Platform Operations
Emissions (kg/kg NG)
Natural Gas Well Operation Coal Bed Methane
Barnett Shale Offshore
Associated Gas Onshore
Lead 1.85E-11 1.30E-09 1.92E-11 1.85E-11 1.85E-11
Mercury 2.76E-14 2.37E-10 8.34E-14 2.76E-14 2.76E-14
Ammonia 2.53E-11 1.50E-07 2.92E-10 2.53E-11 2.53E-11
Carbon dioxide 0.105 0.124 0.083 0.088 0.110
Carbon monoxide 4.86E-04 4.06E-04 5.37E-05 3.73E-04 4.86E-04
Nitrogen oxides 7.38E-04 6.61E-04 2.01E-04 5.67E-04 7.38E-04
Nitrous oxide 1.14E-07 5.95E-07 2.03E-06 1.76E-07 1.76E-07
Sulfur dioxide 5.46E-07 1.43E-04 2.21E-06 4.27E-07 5.46E-07
Sulfur hexafluoride 3.01E-17 4.66E-14 6.69E-17 3.01E-17 3.01E-17
Methane 1.50E-03 1.35E-03 4.56E-04 2.28E-03 1.53E-03
VOC (unspecified) 1.03E-04 8.82E-05 1.54E-06 7.87E-05 1.03E-04
Particulate Matter 8.94E-06 7.48E-06 4.34E-06 6.92E-06 8.94E-06

Appendix: NGCC-LCA
21
Figure A-11: GaBi Plan and Energy Inputs for Drilling Platform Operations
Pipelines The modeled process for pipeline operation can be used for any natural gas pipeline, as the same operating procedures are assumed regardless of whether it traverses water or land. The energy requirements of this process include the natural gas used as fuel in the reciprocating compressors and other equipment used by the pipeline. It is assumed that no other types of energy are used during pipeline operation. The environmental burdens of pipeline operation include the air emissions from the combustion of natural gas (used by the pipeline equipment) and the fugitive release of natural gas from the pipeline.
The modeling assumptions made for this process used publicly available data for calculating the energy and environmental burdens of natural gas pipeline operations. This includes annual statistics compiled by the Bureau of Transportation Statistics, as well as emission factors and pipeline loss rates provided by EPA. The calculations for translating such data to the reference flow of this unit process are described below.
Natural gas-fired reciprocating engines are used in the natural gas industry, including the engines used at pipeline compressor stations (EPA, 2000). EPA emission factors are expressed in terms of pounds of emission per million British thermal units (lb/MMBtu) of fuel input and include GHG emissions and criteria pollutants. An emission factor is not provided for N2O. EPA emission factors include data for three types of natural gas-fired reciprocating engines: 2-stroke, 4-stroke rich burn, and 4-stroke lean burn. All three types of these engines are used by industry; the background data for EPA’s emission factors show 120 samples of 2-stroke engines, 111 samples of 4-stroke rich burn engines, and 93 samples of 4-stroke lean burn engines. However, the use of 2-stroke engines is declining and emission factors for 4-stroke lean burn engines have relatively low data quality for CH4 and CO emissions (EPA, 2000). Thus, this process was modeled with emission factors for 4-stroke rich burn natural gas compressors. It should be noted that the emission factors for CO2, SO2, and CO are comparable among the three engine types. The key distinctions between the 4-stroke engine types are the emission factors for CH4 and NOX. The CH4 emission factors for 4-stroke lean burn and 4-stroke rich burn engines are 1.25 and 0.23 lb/MMBtu, respectively. The NOX emission factors for 4-stroke lean burn and 4-stroke rich burn engines are .85 and 2.27 lb/MMBtu, respectively.

Appendix: NGCC-LCA
22
The fuel requirements for pipeline operation were estimated by dividing annual energy used by natural gas pipelines by annual ton-miles of natural gas pipeline transport. The most recent year for which both pipeline energy use and ton-mile data are available is 2003. In 2003, a quantity of 591,492 million standard cubic feet (scf) of natural gas was used as fuel for natural gas pipelines (Davis, Diegel et al., 2008); in the same year there were 278 billion ton-miles of pipeline transport of natural gas (Dennis, 2005). After converting scf of natural gas to a basis of kg of natural gas and converting ton-miles of transport to kg-km of transport, this translates to approximately 3 × 10⁻⁵ kg of natural gas used as fuel for the transport of 1 kg of natural gas for a distance of 1 km.
To calculate GHG and criteria pollutants, the AP-42 emission factors for natural gas combustion in 4-stroke reciprocating engines were applied to the amount of natural gas used as pipeline fuel (EPA, 2000).
The fugitive emissions of natural gas from pipeline transport were estimated from EPA inventory of GHG emissions and sinks, which includes annual CH4 release from natural gas transmission pipelines (EPA, 2009). While natural gas is not 100 percent CH4, this unit process assumes that all natural gas loss is in the form of CH4. Similar to the calculation of energy requirements, the annual CH4 emissions from natural gas transmission pipelines were divided by the annual ton-miles for natural gas transmission pipelines (Dennis, 2005). EPA did not have data for CH4 emissions from pipelines for 2003, so the average of 2000 and 2005 data was assumed to represent 2003. The estimated CH4 emissions from natural gas transmission pipelines was 1.99 billion kg; the estimated transmission ton-miles of transport for natural gas pipelines in 2003 was 253 billion ton-miles. After converting ton-miles to kg-km, the CH4 emissions (or natural gas loss) was estimated as 5.39 × 10⁻⁶ kg of natural gas loss for the transport of 1 kilogram of natural gas for a distance of 1 km. Methane losses are assessed at the end of the transport stage.
The adjustable parameter of this unit process is the pipeline transport distance (in kilometers). In Life Cycle Stage #1, the extraction pipeline from the extraction well to the shoreline of Trinidad is assumed to be 90 km (56 miles) based on the approximate distance of Block 5c from Canadian Superior (CSE Inc 2006). The onshore pipeline that will transport the natural gas from the shoreline to ALNG is assumed to be 80 km (50 miles) in distance. So the total distance for natural gas transport in Life Cycle Stage #1 is 106 miles.
Ammonia emissions do not result from the combustion of natural gas, nor do NH3 emissions result from other activities within the scope of this unit process. Negligible Hg emissions result from the combustion of natural gas; while the EPA AP-42 factors show Hg emissions for the combustion of natural gas in large, external combustion boilers, no Hg emissions are shown for the combustion of natural gas in small, internal combustion engines used by this unit process. Thus, this unit process does not include atmospheric emissions of NH3 or Hg.

Appendix: NGCC-LCA
23
Table A-10 summarizes the air emissions during pipeline operations.

Appendix: NGCC-LCA
24
Table A-10: Air Emissions (kg/kg NG) due to Natural Gas Pipeline Operations
Emissions (kg/kg NG)
Pipeline Operations
Lead 0
Mercury 0
Ammonia 0
Carbon dioxide 6.76E-03
Carbon monoxide 2.16E-04
Nitrogen oxides 1.40E-04
Nitrous oxide (laughing gas) 0
Sulfur dioxide 3.61E-08
Sulfur hexafluoride 0
Methane 5.04E-04
Methane (biotic) 0
VOC (unspecified) 1.82E-06
Particulate Matter (unspecified) 5.84E-07
Dust (unspecified) 0
Liquefaction Facility
In general, the liquefaction facility receives natural gas from the pipeline, liquefies it into LNG, and stores it until it is ready to be loaded onto an LNG tanker. Trinidad and Tobago only have one LNG production facility, ALNG, which currently consists of four liquefaction trains (the largest, Train 4, has only recently come online). Train 1, Train 2, and Train 3 are designed to produce 3.3 metric tonnes per annum (MTPA) of LNG (ALNG, 2006). They all use the Phillips Optimized Cascade Liquefaction technology with slight modifications between the original Train 1 and the subsequently added Train 2, Train 3, and Train 4, which improve operability and reduce energy consumption as well as GHG emissions. Train 1, Train 2, and Train 3 were all designed to liquefy 3.3 MTPA (ALNG, 2006).
The process and technology used by the ALNG facility has most recently been licensed for the Darwin LNG plant in Australia (Hydrocarbons Technology, 2009a). The Darwin plant was designed to have a capacity of 3.24 MTPA. The Darwin LNG facility utilizes the same technology and processing scheme, but different equipment. For example, the Darwin facility uses six GE LM-2500 turbines rather than six GE Frame 5C/5D models. The process design is the same generation and approximate scale as ALNG Train 2 and Train 3.
The amount of natural gas input per production of 1 kg of LNG (the reference flow of this process) was calculated from a performance test for ALNG Train 1 (1.1303 kg raw natural gas/kg LNG) (Richardson, Hunter et al., 1999).

Appendix: NGCC-LCA
25
The CO2 emissions reported for the 3.24 MTPA Darwin LNG Plant are 0.418 kg of CO2 per kilogram of LNG (ConocoPhillips, 2005). Reported emissions also included criteria air pollutants (CAPs), PM, SO2, NOX, CO, VOC, N2O, and an aggregated category of emissions for total organic compounds (TOCs) and CH4 (labeled as “TOC/CH4”)(ConocoPhillips, 2005). No data are available to specify CH4 and TOC emissions separately, and thus this unit process specifies these emissions as VOCs, which is a generic emission category that includes TOC and CH4. Mercury and Pb emissions were not included in the data obtained and is noted as a data limitation. Ammonia emissions were estimated using emissions data available in the national emissions inventory for the Kenai, Alaska terminal (EPA, 2005b). Ammonia emissions were divided by terminal LNG production to arrive at a discharge rate of 0.00063 kg NH3/kg LNG (EIA, 2009b). Water intake and discharge data were obtained from an environmental management report for the Darwin plant (URS, 2005). Air emissions for the unit process are shown below in Table A-11.
Darwin LNG’s utility usage is also assumed to be similar to that experienced by ALNG. Electricity is generated onsite by the gas turbines and any emergency power generation is assumed to be provided by diesel generators also located onsite. It is assumed that no electricity is produced for external consumption; all electricity generation and consumption occurs within the boundaries of this unit process and thus does not need to be accounted for in any input or output flows of the unit process.
Table A-11: Air Emissions (kg/kg LNG produced) for Operation of the Liquefaction Facility
Emissions (kg/kg LNG)
NG Liquefaction, Storage & Ship
Loading, Operation
Lead 0
Mercury 0
Ammonia 6.33E-04
Carbon dioxide 4.19E-01
Carbon monoxide 6.71E-05
Nitrogen oxides 4.68E-04
Nitrous oxide (laughing gas) 5.02E-07
Sulfur dioxide 1.34E-05
Sulfur hexafluoride 0
Methane 0
Methane (biotic) 0
VOC (unspecified) 6.71E-04
Particulate Matter (unspecified) 1.35E-05
Dust (unspecified) 0

Appendix: NGCC-LCA
26
A.1.2 Life Cycle Stage #2: Raw Material Transport A.1.2.1 GaBi Plan Figure A-12 shows the second level plan for this stage. The boundary for the transport, storage, and delivery of natural gas begins once the LNG has been loaded into an LNG tanker. The LNG is shipped from Port Fortin, Trinidad, to the Trunkline LNG terminal in Lake Charles, Louisiana, where it is unloaded (berthed). The LNG is then regasified for shipment via pipeline to an NGCC power plant at the southern Mississippi location, a distance of 334.58 km (207.9 miles) from the LNG regasifier. The boundary ends when the natural gas in the pipeline enters the NGCC facility. The reference flow of this stage is 1 kg of natural gas arriving at the plant gate.
Figure A-12: Second Level GaBi Plan: Stage #2 Natural Gas Transport
For this stage, energy and emissions associated with LNG tanker commissioning/decommissioning were not inventoried due to lack of applicable data. Additionally, the pipeline construction, installation/deinstallation, and operation LCI data are calculated the same way as described for underground pipelines in Section A.1.1 and is therefore not repeated here. Tanker berthing is listed as a separate input in Figure A-2, but is only considered as an operation. Construction and installation of the berthing or docking area is considered part of the LNG regasification facility.
A.1.2.2 Commissioning/Decommissioning Assumptions
LNG Regasification Facility The activities for the installation of an LNG terminal include the preparation of onshore and offshore areas. Onshore activities include those related to construction of the facility, pier

Appendix: NGCC-LCA
27
rehabilitation, and pier dredging using land equipment (AES Corporation, 2007). Offshore activities include pier dredging using marine equipment. It is assumed that diesel consumption accounts for the majority of energy and emissions for the installation of the terminal.
The diesel consumption for the installation of the LNG terminal was calculated using an environmental impact statement (EIS) that listed the equipment, operating hours, horsepower, and diesel consumption for specific horsepower ranges for each installation activity (AES Corporation, 2007). The diesel consumption was shown on the basis of pounds of diesel per brake-specific horsepower-hour. The EIS also included the following air emissions: PM, NOX, SO2 based on a diesel sulfur content of 0.05 percent, CO, and unspecified HC (AES Corporation, 2007). The EIS did not include emissions of GHGs, NH3, or Hg. Emission factors were applied to the calculated diesel consumption in order to calculate the emission of CO2, N2O, CH4, NH3, and Hg (Battye, Battye et al., 1994; Conaway, Mason et al., 2005; EIA, 2009b).
The EIS expressed the installation activities on the basis of the installation of an entire facility (AES Corporation, 2007). Using an assumed lifetime of 30 years and a daily production rate of 1.5 billion cubic feet of natural gas, this translates to a lifetime throughput of 3.13E+11 kilograms of natural gas (FERC, 2009). The diesel consumption and air emissions for the installation of the LNG terminal were divided by the lifetime throughput to determine the diesel and air emissions on the basis of 1 kilogram of natural gas throughput. Table A-12 and Figure A-13 summarize the energy inputs and air emissions associated with installation/deinstallation of a regasification facility.
Appendix: NGCC-LCA
28
Table A-12: Air Emissions (kg/kg LNG) due to Installation/Deinstallation of the Regasification Facility
Emissions (kg/kg LNG) US: Diesel
Regasification Installation/
Deinstallation Total
Lead 8.79E-13 0.00E+00 8.79E-13
Mercury 8.93E-14 6.05E-15 9.53E-14
Ammonia 8.96E-13 5.21E-09 5.21E-09
Carbon dioxide 1.97E-05 1.22E-04 1.42E-04
Carbon monoxide 4.64E-08 5.93E-07 6.39E-07
Nitrogen oxides 1.56E-07 1.36E-06 1.51E-06
Nitrous oxide (laughing gas) 6.09E-10 3.09E-09 3.70E-09
Sulfur dioxide 6.57E-08 2.59E-08 9.16E-08
Sulfur hexafluoride 0.00E+00 0.00E+00 0.00E+00
Methane 1.22E-07 6.96E-09 1.29E-07
Methane (biotic) 0.00E+00 0.00E+00 0.00E+00
VOC (unspecified) 2.39E-15 1.23E-07 1.23E-07
Particulate Matter (unspecified) 0.00E+00 7.51E-08 7.51E-08
Dust (unspecified) 2.28E-08 0.00E+00 2.28E-08
Figure A-13: GaBi Plan and Energy Inputs for Regasification Installation/Deinstallation

Appendix: NGCC-LCA
29
A.1.2.3 Construction Assumptions
LNG Tanker This process models the materials used in the construction of a LNG ocean going tanker. The boundary of this unit process is the tanker itself. The reference flow of this unit process is the LNG Tanker construction per kilogram of natural gas delivered from Trinidad and Tobago; all material flows are expressed on this basis.
The data set obtained for this unit process is cited in a paper dated 1997 (Hashimoto 1997). While LNG tankers built around this time would be anticipated to be in service, the data is never the less old and is considered a data limitation. This LNG tanker has a capacity of 125,000 cubic meters of capacity and was assumed to have a life of 30 years for this unit process.
Data from the LNG tanker operations unit process was used in conjunction with this data set to estimate the total quantity of LNG that could be transported by the tanker over its anticipated lifetime assuming it was permanently assigned to the ALNG (Trinidad & Tobago)-Trunkline LNG (Louisiana) route. The weight of tanker construction per kilogram of LNG delivered was determined by dividing the individual construction material (carbon steel, 304 stainless steel, and aluminum) quantities listed in the construction data set by the total natural gas delivered over a 30-year period. Air emissions and material inputs are listed in Table A-13 and Figure A-14.
Table A-13: Air Emissions due to the Construction of a LNG Tanker, kg/kg delivered LNG
Emissions (kg/kg LNG)
Aluminum sheet mix PE
Steel Plate, BF, Manufacture
Steel, Stainless, 304 2B, 80%
Recycled Total
Lead 1.01E-10 9.00E-10 0.00E+00 1.00E-09
Mercury 8.16E-12 5.65E-11 0.00E+00 6.47E-11
Ammonia 2.34E-09 0.00E+00 0.00E+00 2.34E-09
Carbon dioxide 6.27E-04 4.54E-04 5.25E-05 1.13E-03
Carbon monoxide 5.41E-06 3.83E-06 9.07E-08 9.33E-06
Nitrogen oxides 1.10E-06 7.60E-07 1.09E-07 1.97E-06
Nitrous oxide (laughing gas) 1.09E-08 2.36E-08 0.00E+00 3.45E-08
Sulfur dioxide 3.47E-06 1.03E-06 2.08E-07 4.71E-06
Sulfur hexafluoride 6.36E-14 0.00E+00 0.00E+00 6.36E-14
Methane 1.03E-06 3.45E-07 0.00E+00 1.37E-06
Methane (biotic) 0.00E+00 0.00E+00 0.00E+00 0.00E+00
VOC (unspecified) 2.48E-08 6.75E-08 0.00E+00 9.24E-08
Particulate Matter (unspecified) 0.00E+00 0.00E+00 0.00E+00 0.00E+00
Dust (unspecified) 1.06E-06 1.09E-07 5.77E-08 1.23E-06

Appendix: NGCC-LCA
30
Figure A-14: GaBi Plan and Material Inputs for LNG Tanker Construction
LNG Regasification Facility This process models the materials used in the construction of an LNG regasification facility. The boundaries of this unit process start at the transport tanker boundary and end at the natural gas pipeline to the distribution network. The reference flow of this unit process is the regasification facility construction required for 1 kg of LNG regasified; all material flows are expressed on this basis.
The data set for the construction of a regasification facility were obtained for the Marmara Ereğlisi LNG Import Terminal located in Turkey (NACO, 2009). This facility has an annual LNG regasification capacity of 4.6 million tons (EIA, 2003). The tons units in the NACO data set are assumed to be metric tons given the context of other metric units in the data set; however; this is noted as a data limitation (NACO, 2009). Also, a value for carbon steel pipe is not given in the data set and is noted as a data limitation. The regasification facility was assumed to have a life of 30 years for this unit process. Table A-14 lists the materials used in the construction of the regasification facility.
Table A-14: LNG Regasification Facility Construction Materials
Materials Amount Units Concrete 66705 Cubic meters Structural Steel 12162 tons Reinforcement Steel 8562 tons
The weight of regasification facility construction per kilogram of LNG regasified was determined by dividing the individual material weights by the total natural gas flow through the facility for a 30-year period. Table A-15 and Figure A-15 show the air emissions and input flows for the LNG regasification construction unit process.

Appendix: NGCC-LCA
31
Table A-15: Air Emissions (kg/kg NG) for the Construction of the LNG Regasification Facility.
Emissions (kg/kg NG)
US: SERC Power Grid
Mix 2005
Concrete, Ready Mixed, R-5-0
(100% Portland Cement)
Steel Plate, BF, Manufacture Total
Lead 4.82E-12 0.00E+00 3.84E-10 3.89E-10
Mercury 1.36E-12 0.00E+00 2.41E-11 2.55E-11
Ammonia 4.65E-10 0.00E+00 0.00E+00 4.65E-10
Carbon dioxide 9.68E-05 7.46E-05 1.94E-04 3.65E-04
Carbon monoxide 4.00E-08 9.62E-08 1.63E-06 1.77E-06
Nitrogen oxides 1.87E-07 2.28E-07 3.24E-07 7.40E-07
Nitrous oxide (laughing gas) 1.28E-09 0.00E+00 1.01E-08 1.14E-08
Sulfur dioxide 5.49E-07 1.74E-07 4.41E-07 1.16E-06
Sulfur hexafluoride 6.60E-16 0.00E+00 0.00E+00 6.60E-16
Methane 1.06E-07 0.00E+00 1.47E-07 2.53E-07
Methane (biotic) 0.00E+00 3.40E-09 0.00E+00 3.40E-09
VOC (unspecified) 1.35E-11 8.39E-09 2.88E-08 3.72E-08
Particulate Matter (unspecified) 0.00E+00 0.00E+00 0.00E+00 0.00E+00
Dust (unspecified) 1.04E-08 2.22E-07 4.65E-08 2.79E-07
Figure A-15: GaBi Plan and Inputs for the Construction of the LNG Regasification Facility

Appendix: NGCC-LCA
32
A.1.2.4 Operation Assumptions
LNG Tanker Transport It was assumed that the LNG tanker is a 138,000-cubic meter carrier and that propulsion is fueled by cargo boil-off and then supplemented with diesel fuel in Wartsila dual-fuel engines (Colton Company, 2006; Namba, 2006; Wärtsilä Corporation, 2005). The amount of boil-off is variable for both the laden and ballast voyages (current values are industry average ) (Hasan, Zheng et al.). The percent usable cargo volume and heel (quantity in percent of initial volume remaining for fuel for return trip) quantity are also variable. After accounting for the quantity of LNG used for fuel and heel, the actual delivered quantity of LNG is 127,498 cubic meters (Colton Company, 2006; Hasan, Zheng et al.; Namba, 2006; DOE, 2005; Panhandle Energy, 2006). This value forms the basis for the emissions from the tanker and is a calculated reference flow.
Carbon dioxide and NOX emissions are calculated from engine manufacturer specifications (Wärtsilä Corporation, 2005), assuming that the engines are running at 75 percent load (higher emissions than for 100 percent load). Remaining air pollutant emissions were estimated by applying the EPA AP-42 emission factors for Large Stationary Diesel and All Stationary Dual-Fuel Engines (EPA, 1995). Emission factors were not available for NH3 or Hg. Table A-16 and Figure A-16 show the air emissions and energy inputs needed for LNG tanker operations.
Table A-16: Air Emissions (kg/kg LNG) during LNG Tanker Operations
Emissions (kg/kg LNG)
Diesel at refinery PE
LNG Tanker Transport - Operation
Total
Lead 2.18E-10 0.00E+00 2.18E-10
Mercury 1.84E-11 0.00E+00 1.84E-11
Ammonia 3.22E-08 0.00E+00 3.22E-08
Carbon dioxide 4.81E-03 6.61E-02 7.09E-02
Carbon monoxide 7.03E-06 4.82E-04 4.89E-04
Nitrogen oxides 1.49E-05 8.63E-04 8.78E-04
Nitrous oxide (laughing gas) 8.25E-08 0.00E+00 8.25E-08
Sulfur dioxide 1.93E-05 6.55E-07 2.00E-05
Sulfur hexafluoride 1.83E-14 0.00E+00 1.83E-14
Methane 5.01E-05 1.48E-04 1.98E-04
Methane (biotic) 0.00E+00 0.00E+00 0.00E+00
VOC (unspecified) 2.09E-08 7.26E-05 7.26E-05
Particulate Matter (unspecified) 0.00E+00 2.63E-05 2.63E-05
Dust (unspecified) 2.85E-07 0.00E+00 2.85E-07

Appendix: NGCC-LCA
33
Figure A-16: GaBi Plan and Energy Input for LNG Tanker Operation
LNG Tanker Berthing LNG tanker escort, docking, and berthing/deberthing air emissions at Trunkline LNG are modeled using air emissions estimates generated for these operations at a proposed power plant at Mare Island in Vallejo, California (URS, 2003). The docking facility is sized to service a 70,000 dead weight ton (DWT) LNG tanker with an LNG storage capacity of 130,000 cubic meters (URS, 2003). Each LNG tanker would be propelled by steam boiler/steam turbine systems. The inbound voyage would rely on LNG vapors as a fuel source. Vessel hoteling during LNG offloading would rely on 0.5% sulfur fuel oil. The outgoing voyage would use 1.5% sulfur heavy fuel oil (URS, 2003). Round trip fuel consumption (pilot on to pilot off, including offloading of cargo) would require 120 metric tons equivalent of fuel oil (URS, 2003).
Each LNG tanker would be escorted by tugs, and each tug would be equipped with a 4200 horsepower (hp) diesel engine. Each tanker would require two tugs for escort per visit (2 hours each way/tug or 8 tug-hours total/visit). Four tugs would assist berthing (2 hours/tug or 8 tug-hours total/visit) and three tugs would assist deberthing (1 hours/tug or 3 tug-hours total/visit). One additional tug would be on standby duty for approximately 15 hours per tanker visit (URS, 2003).
Future emissions regulations will mandate lower sulfur content for marine diesel powered vessels. Operations with lower fuel sulfur content have not been modeled and are considered a data limitation. Emissions of CO2, CH4, and N2O were estimated using fuel emissions factors (EPA, 2002). A mercury emission factor for heavy fuel oil was not readily available for inclusion in the modeling and is considered a data limitation. Ammonia emissions were estimated using emission factors for combustion sources (Battye, Battye et al., 1994). Mercury emissions from diesel fuel was estimated using a mercury concentration in fuel study (Conaway, Mason et al., 2005). Table A-17 and Figure A-17 show the energy inputs and air emissions associated with tanker berthing.

Appendix: NGCC-LCA
34
Table A-17: Air Emissions (kg/kg LNG) emitted during LNG Tanker Berthing Operations
Emissions (kg/kg LNG)
Diesel at refinery PE
Fuel oil heavy at refinery
LNG Tanker Escort, Docking, &
Berthing/Deberthing Total
Lead 5.73E-12 4.42E-11 0.00E+00 4.99E-11
Mercury 4.85E-13 4.12E-12 4.09E-14 4.65E-12
Ammonia 8.47E-10 8.00E-09 2.69E-07 2.77E-07
Carbon dioxide 1.27E-04 1.03E-03 8.42E-03 9.57E-03
Carbon monoxide 1.85E-07 1.36E-06 2.86E-06 4.41E-06
Nitrogen oxides 3.93E-07 2.84E-06 3.51E-05 3.84E-05
Nitrous oxide (laughing gas) 2.17E-09 1.63E-08 2.14E-07 2.33E-07
Sulfur dioxide 5.08E-07 3.85E-06 2.33E-05 2.76E-05
Sulfur hexafluoride 4.83E-16 3.72E-15 0.00E+00 4.20E-15
Methane 1.32E-06 9.15E-06 6.14E-07 1.11E-05
Methane (biotic) 0.00E+00 0.00E+00 0.00E+00 0.00E+00
VOC (unspecified) 5.49E-10 3.82E-09 1.38E-06 1.39E-06
Particulate Matter (unspecified) 0.00E+00 0.00E+00 6.47E-06 6.47E-06
Dust (unspecified) 7.49E-09 5.45E-08 0.00E+00 6.20E-08
Figure A-17: GaBi Plan and Energy Inputs for LNG Tanker Berthing Operations

Appendix: NGCC-LCA
35
LNG Regasification Facility
The data sources for this unit process include mass balance and equipment data as reported by the Trunkline LNG facility to FERC (FERC, 2009), emission factors for the combustion of natural gas and diesel (EPA, 1995), and criteria pollutants provided by Trunkline LNG (DEQ Louisiana, 2007). The LNG regasification facility uses a small portion of LNG input as fuel for a turbine and vaporizers. According to FERC documentation, natural gas is consumed at an average rate of 1.61 percent of the regasified natural gas product. Thus, for the production of 1 kg of regasified natural gas, 0.016 kg of natural gas is used for onsite energy generation, which translates to a total of 1.016 kg of LNG input.
The combustion of natural gas for onsite energy results in air emissions of CO2, CH4, and N2O. These air emissions were calculated by applying the amount of natural gas combusted (0.016 kg) to generic emission factors for natural gas combustion in stationary equipment (EPA, 1995). In order to perform this calculation, it was necessary to convert natural gas from a mass basis to an energy basis; a heating value of 1,025 Btu/scf and density of 0.042 lbs/scf were used to complete this calculation.
In addition to the natural gas that is used for onsite energy, diesel is used for pumps and backup generators. The amount of diesel required per unit of production was determined from an equipment list provided by Trunkline LNG to FERC. This equipment list itemizes the fuel consumption per hour and annual hours of operation for each piece of diesel equipment used at the LNG regasification facility. This data was used to calculate a yearly diesel fuel consumption. The diesel fuel consumption is then divided by Trunkline’s output to determine diesel usage on a per kilogram of regasified natural gas basis.
The CO2 emissions from diesel combustion were calculated using emission factors for diesel combustion in diesel equipment (EPA, 2005a). This calculation was similar to the calculation used for CO2 emissions from natural gas combustion as described above. Generic emission factors for diesel combustion were used to calculate CH4 and N2O emissions from diesel combustion in construction equipment (EPA, 2005b).
CAPs for the LNG regasification facilities were based on emission data reported by the Trunkline LNG facility (DEQ Louisiana, 2007). These emissions include VOC, NOX, SO2, PM, and CO. Trunkline LNG did not report any NH3, Pb, or Hg emissions and is considered a data limitation.
Trunkline LNG combusts natural gas (primarily CH4) and uses the combustion heat to regasify LNG. During this process, the cooled exhaust stream results in condensed water discharge. The amount of water discharged is estimated by assuming all the natural gas burned is CH4 (for larger organic molecules [ethane, propane, etc.], larger quantities of water would be produced for each molecule combusted). Water production was estimated based on the amount of water produced from complete combustion of the amount of gas used for fuel. This quantity was then determined per kilograms of natural gas output.
Estimation of electricity requirements was based on FERC data reporting the operational power costs for Trunkline LNG activities. Electricity price data obtained from EIA was used to complete the estimate of the electrical energy consumed. The energy requirement was then expressed on the basis of kilograms of natural gas output. Table A-18 and Figure A-18 show the energy inputs and air emission outputs for Trunkline LNG operations unit process.

Appendix: NGCC-LCA
36
Table A-18: Air Emissions (kg/kg NG) for LNG Regasification Operations
Emissions (kg/kg NG)
SERC Power Grid Mix
2005
Diesel at refinery
Regasification Operations Total
Lead 2.10E-10 2.60E-13 0.00E+00 2.11E-10
Mercury 5.93E-11 2.21E-14 0.00E+00 5.94E-11
Ammonia 2.03E-08 3.85E-11 0.00E+00 2.03E-08
Carbon dioxide 4.23E-03 5.76E-06 3.84E-02 4.26E-02
Carbon monoxide 1.75E-06 8.41E-09 9.40E-06 1.12E-05
Nitrogen oxides 8.18E-06 1.79E-08 1.71E-05 2.53E-05
Nitrous oxide (laughing gas) 5.60E-08 9.86E-11 7.34E-08 1.29E-07
Sulfur dioxide 2.40E-05 2.31E-08 1.40E-07 2.41E-05
Sulfur hexafluoride 2.88E-14 2.19E-17 0.00E+00 2.88E-14
Methane 4.63E-06 5.99E-08 3.16E-03 3.17E-03
Methane (biotic) 0.00E+00 0.00E+00 0.00E+00 0.00E+00
VOC (unspecified) 5.90E-10 2.49E-11 1.26E-06 1.26E-06
Particulate Matter (unspecified) 0.00E+00 0.00E+00 1.58E-06 1.58E-06
Dust (unspecified) 4.55E-07 3.41E-10 0.00E+00 4.55E-07
Figure A-18: GaBi Plan and Energy Inputs for the Operation of the Regasification Facility

Appendix: NGCC-LCA
37
A.1.3 Life Cycle Stage #3: NGCC Energy Conversion Facility without CCS
A.1.3.1 GaBi Plan Figure A-19 defines the second level GaBi plan for the NGCC case without CCS. This plan is based on a reference flow of 1 MW electricity output over the 30-year study lifetime.
Figure A-19: GaBi Plan for NGCC Case without CCS

Appendix: NGCC-LCA
38
A.1.3.2 Commissioning, Installation, and Decommissioning Assumptions
The energy and water used, as well as the emissions associated with the installation and deinstallation of a power plant, are dominated by the use of diesel fuel to power construction equipment. Data for the installation of a power plant came from the Russell City Energy Center Application for Certification to the California Energy Commission (Calpine/Bechtel, 2001). The application was for the proposed Russell Energy Center, a 14.7 acre, 600-MW NGCC plant with equipment needs (two gas turbines with heat recovery steam generators [HRSGs] and one steam turbine) similar to those in the Baseline Report (NETL, 2010).
The application included data on diesel fuel use, water use, and CAPs associated with a 21-month installation period. The data were calculated assuming many emission control measures were implemented, including water spray for dust suppression, low sulfur fuels, preventative maintenance on construction equipment, and limited idling time (Calpine/Bechtel, 2001). It is noted as a minor data limitation that emissions are based on a plant in California, while our model is considering a plant in Illinois. Some differences are expected due to varying landscapes and regulatory requirements.
Although it was assumed that water suppression was used to control PM emissions, no data were given on the specific amount of water used during installation. This amount was calculated using a given application rate of water, and took into account several assumptions. Water usage was only calculated for the first two months as the application stated that most of the plant fugitive dust emissions occurred in the first month or two (Calpine/Bechtel, 2001). The application also stated that the construction process would occur from 6 a.m. to 6 p.m., Monday through Saturday, for a total of 288 hours of construction per month of activity (Calpine/Bechtel, 2001). Finally, it was assumed that the application rate of 0.25 hours per application (or four applications per hour) was incorrectly reported in the source (Calpine/Bechtel, 2001); applying that amount of water would result in approximately one inch of water per day being used over the entire installation area. Research and Development Solutions, LLC (RDS) felt that, although dust would be suppressed, such an amount of water would cause additional problems with standing water and mud. Therefore, an adjusted application rate of 0.25 applications per hour was assumed, which correlated to one application every four hours. This application rate seemed more practical, and an inverse of units as written in the original report is a realistic error.
Diesel use during installation was obtained from the Russell City Energy Center Application for Certification (Calpine/Bechtel, 2001). In Appendix 8.1-E, Table 8.1E-8 lists the total diesel use, in gallons per year, of each piece of construction equipment. These amounts were summed for a total of 122,817.7 gal/yr. This value was multiplied by the length of the construction period, 21 months (or ~1.75 years), for the volume over the entire construction period. This value was then multiplied by the density of diesel (7.1 lb/gal) and converted to kilograms (American Petroleum Institute, 2004).
The amount of CO2 released during installation of the power plant was calculated by first determining how much carbon was present in the amount of diesel used. There are 2,778 grams of carbon in one gallon of diesel (EPA, 2005a). The amount of carbon in the diesel (568,645.9 kg) was converted to CO2 by following EPA and Intergovernmental Panel on Climate Change (IPCC) guidelines, which state that 99 percent of carbon in a fuel is oxidized and emitted as CO2; the mass of CO2 was determined by multiplying by the ratio of the molecular weights of CO2 (44
Appendix: NGCC-LCA
39
moles/gram) and carbon (12 moles/gram) (EPA, 2005a). The total calculated mass of CO2 released during construction was divided by the number of acres of construction that the study was based on (14.7, Calpine/Bechtel, 2001) to determine kg/acre of CO2.
Table 8.1E-3 of the Russell City application lists the emissions, in tons/year, for five pollutants – NOX, CO, VOC, SOX, and PM (Calpine/Bechtel, 2001). The values for each, 22.95 tons/yr for NOX, 63.82 tons/year for CO, 6.09 tons/year for VOC, 0.58 tons/year for SOX, and 3.1 tons/year for PM, were multiplied by the number of years of construction (1.75) and then converted into kilograms. Finally, these values were divided by the total area of the construction site to get the amount of each emission per acre.
The emissions of four other pollutants were calculated using different sources – CH4, N2O, NH3, and Hg. The emissions factors for CH4 and N2O were pulled from Appendix H of a DOE report, which references the EPA GHG inventory (EPA, 2008). It was assumed that the diesel-powered construction equipment would be representative of the equipment used at the power plant. These emission factors were 0.58 g/gallon of diesel for CH4 and 0.26 g/gallon for N2O (EPA, 2008). The NH3 emission factor was obtained from an EPA-published report documenting the development and selection of emission factors for NH3. The emission factor for the combustion of diesel from mobile sources was given as 0.11 kg/1,000 L of diesel (Battye, Battye et al., 1994). The emission factor of the final pollutant, Hg, was determined by dividing the average concentration of Hg in diesel from various studies by the number of samples to get 0.1564 ng/g diesel (Conaway, Mason et al., 2005).
Each of the pollutants was converted from their emission factor units into kg/acre to correspond with the other emissions. Both the CH4 and N2O emissions were calculated by converting first to kg/gallon of diesel, and then by multiplying by the previously determined gallons of diesel used per acre of development. The NH3 was also converted to kg/gallon and multiplied by the gallons of diesel used, but there was an intermediate conversion from 1,000 L to gallons. Finally, the Hg was converted by changing g diesel to kg diesel, multiplying by the diesel use per acre (in kg/acre), and dividing by 1012 (ng/kg). These calculations gave total emissions, per acre of development, of 8.48 kg CH4, 3.80 kg N2O, 6.09 kg NH3, and 7.36 x 10-06 kg Hg.
The total amount of water and diesel used and the emissions released includes decommissioning of the power plant site. It was assumed that the decommissioning use and emissions were 10 percent of the total commissioning use and emissions (Odeh and Cockerill, 2008). The diesel use, water use, and emissions were all multiplied by 10 percent, and this value was added onto the total values previously calculated on a per acre of installation basis.
Figure A-20 and Table A-19 represent the GaBi plan and air emissions outputs for power plant installation/deinstallation, respectively. This is the same for all cases within this study.

Appendix: NGCC-LCA
40
Figure A-20: GaBi Plan for Power Plant Installation/Deinstallation
Table A-19: GaBi Air Emission Outputs and Profiles for Power Plant Installation/Deinstallation, kg/MWh Plant Output
Emissions (kg/MWh plant output) Total
Diesel at Refinery
PE
Power Plant Installation/Deinstallation
Lead 8.91E-11 8.91E-11 0.00E+00
Mercury 8.30E-12 7.55E-12 7.48E-13
Ammonia 6.32E-07 1.32E-08 6.19E-07
Carbon dioxide 1.70E-02 1.97E-03 1.50E-02
Carbon monoxide 7.03E-04 2.88E-06 7.00E-04
Nitrogen oxides 2.58E-04 6.12E-06 2.52E-04
Nitrous oxide (laughing gas) 4.20E-07 3.37E-08 3.86E-07
Sulfur dioxide 1.43E-05 7.91E-06 6.36E-06
Sulfur hexafluoride 7.51E-15 7.51E-15 0.00E+00
Methane 2.13E-05 2.05E-05 8.62E-07
Methane (biotic) 0.00E+00 0.00E+00 0.00E+00
VOC (unspecified) 6.68E-05 8.53E-09 6.68E-05
Particulate Matter (unspecified) 3.40E-05 0.00E+00 3.40E-05
Dust (unspecified) 1.17E-07 1.17E-07 0.00E+00

Appendix: NGCC-LCA
41
A.1.3.3 Construction Assumptions This process encompasses the material inputs necessary for the construction of an NGCC power plant without CCS. The inputs and outputs are expressed in terms of units per megawatt-hour of produced power. The data includes materials for the power plant itself and the trunkline and switchyard to transmit electricity from the plant to the power grid
Data for the construction of the power plant were taken from several studies, each of which listed the amounts of between two to five major materials for construction. The materials for the construction of the plant, according to the various studies, were concrete, steel, steel pipes, iron, and aluminum (Spath, Mann et al., 1999; CWLP, 2009; Peterson, 2005; Tokimatsu, Kosugi et al., 2006; Widiyanto, 2003; Mithethwa, 2004). The amounts of each construction material given in the studies were divided by the net output of the plant in the study to put them on a per megawatt produced basis. Each material that was listed in more than one study or for more than a single plant was averaged and the value was converted to kilograms to give construction material quantities on a kg/MW basis.
There are four components for the switchyard and trunkline – the transmission towers, the foundation for the towers, air break switches, and circuit breakers. The necessary materials for each component were calculated individually and then summed across the entire switchyard and trunkline.
The towers are assumed to be lattice steel towers, each weighing approximately 8.75 tons (Brune, 2008). Each leg (four on each tower) of a tower is supported by a cylindrical concrete foundation 3.50 feet wide and 22.50 feet deep (Aspen Environmental Group, 2008). The volume of each foundation was multiplied by four for the volume of concrete for one tower, and then multiplied by the density of concrete (Portland Cement Association, 2008) to get the total weight of concrete for a single tower. To determine the number of towers in the trunkline, it was assumed that it was 50 miles long (Skone, 2008) and that the towers were spaced approximately every 900 feet (CapX 2020, 2007), resulting in 293 towers over the 50 miles. Finally, to calculate the amount of concrete and steel in the trunkline towers, the weight of each for a single tower was multiplied by the total number of towers.
For the conductors, it was assumed that there was a single, three-phase conductor running the length of the trunkline. There was no allowance for sag in the calculation of conductor length, and there was no consideration for electrical losses. The conductors are aluminum conductors, aluminum-clad steel reinforced (ACSR/AW) and are sized to carry the net plant output, based on cable ampacity. The ampacity of the conductors, based on an output of 640.25 MW, a voltage of 345,000, and a power factor of 90 percent, is 1,190 amps. The smallest size conductor that can carry 1,190 amps is 1272 MCM (Phelps Dodge, 2005). For this size conductor, the aluminum and steel components were converted from lb/1,000 feet to kg/mile, and then multiplied by the assumed trunkline distance of 50 miles to get a total weight of aluminum and steel for the conductors.
The next component was the switchyard air break switch. It was assumed that there will be eight total air break switches – two for each sulfur hexafluoride (SF6) circuit breaker. Once again, the conductors coming through the switchyard air break switches are three phase and there are assumed to be three sets of two, 220-kV rated insulators to make an insulator rated for 345 kV. The weight of a single 220-kV insulator was gathered from vendor data (Keidy Electro-

Appendix: NGCC-LCA
42
Mechanical Company, 2008). As stated previously, there are three sets of two insulator assemblies per phase, and taking that total times the number of phases gives the total weight of insulators for one air break switch.
To calculate the amount of steel in an air break switch, it was assumed that all components, except for the insulators, were constructed of steel. To get the weight of one air break switch, the weight of a switch for one phase (General Switchgear & Controls, 2008) was multiplied by the number of phases. The weight of the insulators was subtracted from the total weight of one air break switch to get a total estimated amount of steel for a single switch.
The last component of the air break switches is the concrete foundation. It was assumed that the foundation of one phase of a switch would be roughly the same size as the foundation of one leg of the conductor towers. The foundations are cylindrical, and the volume was multiplied by the density of concrete to determine the total weight for all three phases of one air break switch. One final step for the air break switches was to multiply each material (steel, concrete, and insulators) by the total number of switches for the switchyard, and then convert everything to kilograms.
The final component of the switchyard and trunkline are the SF6 circuit breakers. There are a total of two, three-phase SF6 breakers at the plant. There are two insulator assemblies per phase, and each assembly has two, 220-kV insulators. The weights of a single circuit breaker and the amount of SF6 in each breaker were taken from vendor specifications (HVB AE Power Systems, 2003). Again, the weight of insulators in a breaker was calculated by taking the weight of one insulator (Keidy Electro-Mechanical Company, 2008) and multiplying by the number of insulators in an assembly, the number of assemblies per phase, and the number of phases for one breaker. The amount of steel in one circuit breaker was determined by subtracting the weight of SF6 and the weight of the insulator assemblies from the total weight of a single circuit breaker.
The concrete foundation assumptions and calculations are identical to those of the air break switches. The final step for the circuit breakers was to multiply the weight of each material (steel, concrete, SF6, and insulators) by the total number of breakers in the switchyard and converting to kilograms.
The weights of all the construction materials for the switchyard and trunkline were summed – cold-rolled steel for the towers, conductors, air break switches, and SF6 circuit breakers; concrete for the foundation of the tower, switches, and breakers; aluminum for the conductors; insulators for the switches and breakers; and SF6 for the circuit breakers.
Finally, the construction materials for each plant site component (power plant, switchyard, and trunkline) were divided by the total megawatts of electricity produced during the lifetime of the plant. This put each major component on a kg/MWh produced basis. Lastly, materials present in more than one of the plant site components were added together to give a total for the process. Figure A-21 represents the GaBi plan and Table A-20 shows the air emissions and material profiles used for NGCC plant construction without CCS.

Appendix: NGCC-LCA
43
Figure A-21: GaBi Plan for NGCC Plant Construction without CCS

Appendix: NGCC-LCA
44
Table A-20: GaBi Air Emission Outputs and Profiles used for NGCC Plant Construction without CCS, kg/MWh Plant Output
Emissions (kg/MWh)
SERC Power Grid Mix
2005
Cast iron part (sand
casting)
Aluminum sheet mix
PE
Concrete, Ready
Mixed, R-5-0 (100%
Portland Cement)
Thermal energy from heavy fuel
oil PE
Steel Pipe, Welded, BF, Manufacture
WOR: Steel Plate, BF,
Manufacture NETL [MP-
CG]
Total
Lead 4.41E-09 1.29E-10 9.27E-09 0.00E+00 1.85E-11 1.45E-07 3.21E-07 4.80E-07
Mercury 1.24E-09 4.98E-12 7.50E-10 0.00E+00 8.55E-14 3.84E-09 2.02E-08 2.60E-08
Ammonia 4.25E-07 5.01E-09 2.15E-07 0.00E+00 6.61E-10 0.00E+00 0.00E+00 6.46E-07
Carbon dioxide 8.86E-02 2.59E-03 5.76E-02 6.76E-02 1.14E-04 4.77E-02 1.62E-01 4.26E-01
Carbon monoxide 3.66E-05 3.28E-06 4.97E-04 8.71E-05 4.18E-08 3.53E-04 1.37E-03 2.35E-03
Nitrogen oxides 1.72E-04 2.03E-06 1.01E-04 2.06E-04 1.30E-07 7.78E-05 2.72E-04 8.31E-04
Nitrous oxide (laughing gas)
1.17E-06 3.72E-08 9.98E-07 0.00E+00 9.95E-10 2.66E-06 8.43E-06 1.33E-05
Sulfur dioxide 5.03E-04 1.45E-06 3.19E-04 1.57E-04 4.80E-07 1.35E-04 3.69E-04 1.48E-03
Sulfur hexafluoride 6.04E-13 8.82E-15 5.84E-12 0.00E+00 4.89E-17 0.00E+00 0.00E+00 6.46E-12
Methane 9.72E-05 2.07E-06 9.46E-05 0.00E+00 1.17E-07 5.05E-05 1.23E-04 3.67E-04
Methane (biotic) 0.00E+00 0.00E+00 0.00E+00 3.08E-06 0.00E+00 0.00E+00 0.00E+00 3.08E-06
VOC (unspecified) 1.24E-08 6.90E-11 2.28E-06 7.60E-06 4.72E-11 6.43E-06 2.41E-05 4.04E-05
Particulate Matter (unspecified)
0.00E+00 0.00E+00 0.00E+00 0.00E+00 0.00E+00 0.00E+00 0.00E+00 0.00E+00
Dust (unspecified) 9.54E-06 4.24E-06 9.78E-05 2.01E-04 2.12E-09 5.60E-05 3.89E-05 4.08E-04

Appendix: NGCC-LCA
45
A.1.3.4 Operation Assumptions The NGCC plant without CCS was modeled using the Baseline Report results for Case 13, an Advanced F-Class natural gas combustion turbine generator (CTG) plant (without CCS) producing a net output of 555 MWe (NETL, 2010). The system consists of two parallel CTG trains. Each CTG train is configured with a CTG and an HRSG; the two CTG trains share a common steam turbine. An 85 percent capacity factor is assumed, making the calculated net output 472 MWe (NETL, 2010).
Air Emissions
Auxiliary Boiler Operation During NGCC plant non-operation, the Baseline Report specifies that a shop fabricated, 40,000 lb/hr, 400 pounds per square inch (psi) water tube auxiliary boiler is used to replace the primary system. It is assumed that the auxiliary boiler is operated for 50 percent of the downtime such that operation time for the boiler is calculated to be 10 percent of one year.
The only mention of the auxiliary boiler in the Baseline Report is that it can use either oil or gas; no fuel use amounts or emissions associated with the auxiliary boiler operation are included. Therefore, natural gas was assumed as the fuel used (versus fuel oil), and consumption of the auxiliary boiler is estimated to be 53,000 standard ft3/hr based upon highest fuel consumption claims for two similarly sized boilers in the sited brochures (Wabash Power Equipment Company, 2009). Using 23.8 ft3/lb as the specific volume of natural gas, auxiliary boiler natural gas consumption is calculated to be 0.1578 kg/MWh.
A controlled burn emissions profile is added for natural gas combustion in a large-walled boiler from AP 42, under the assumption that a low-NOX burner is used (EPA, 1998). The boiler emits NOX, CO, CO2, N2O, PM, SO2, CH4, VOC, and Pb. Mercury emissions from natural gas were assumed to be negligible as reliable data were not found and Hg is not a typical contaminant in natural gas supplies. Emission rates for each pollutant or gas is included in Table A-21. These values were converted to kg/MWh of net output. No NH3 emission values for the auxiliary boiler were identified.

Appendix: NGCC-LCA
46
Table A-21: Air Releases from Auxiliary Boiler
Pollutant lb/106 SCF
Nitrogen oxides (controlled) 140
Carbone Monoxide 84
Carbon Dioxide 120,000
Nitrous oxide (controlled) 0.64
Particulate Matter (total) 7.6
Sulfur Dioxide 0.6
Methane 2.3
VOC 5.5
Lead 0.0005
Mercury N/A
Primary NGCC Plant Operation The NGCC plant consumes 75,902 kg/hr of natural gas as specified in the Baseline Report, which is equivalent to 136.76 kg/MWh net electricity output (NETL, 2010). The Baseline Report also specifies CO2 and NOX emissions for the NGCC plant Case 13 in Exhibit ES-2 (NETL, 2010). These emissions were added to the auxiliary boiler emissions for CO2 and NOX for calculation of their respective output parameters. The Baseline Report specifies negligible Hg emissions from both NGCC plant cases, and additional data searches on the EPA’s National Emissions Inventory confirmed that fact. Therefore, no Hg emissions are estimated for either NGCC plant or the auxiliary boiler. Additionally, NH3 (to air) emissions were not given in the Baseline Report for the NGCC plants. However, due to the use of selective catalytic reduction (SCR) for NOX control, some NH3 is emitted. The Baseline Report states a 10 parts per million volume (ppmv) NH3 slip rate (through the stack) at the end of the catalyst life. Further investigation showed that as the SCR catalyst degrades, the NH3 slip increases; once new catalyst is added to the system the slip rate goes to zero (Blackman and Averyt, 2006). We assumed the following to simplify the calculation of an NH3 emission rate: the 10 ppmv rate is the maximum rate at the end of the catalyst life, each layer (in the two layer catalyst system) has a two-year lifetime (Mack and Patchett, 1997), and the slip rate is linear to catalyst activity. Using the available data and assumptions, a 5 ppmv average slip rate was calculated for the lifetime of the plant. Lead emissions to air were estimated from the EPA National Emissions Inventory 2005 by taking the average pounds of Pb emitted to air per megawatt electric (MWe) nameplate output of seven natural gas-fired plants (EPA, 2005b). These seven plants vary in combustion technologies, output, locations, and control technologies. Therefore, the data does not follow the logical trend of more output equals more Pb and the calculated emission factor for Pb from the NGCC plant is noted as a data limitation. Because the Pb emissions from the

Appendix: NGCC-LCA
47
emissions inventory did not specify whether auxiliary boiler emissions were included, both emissions are included in the total Pb emissions output for completeness.
Circuit Breaker SF6 Leakage Once electricity is produced in the NGCC plant, circuit breakers are used for safety during electricity transmission. It was assumed that four circuit breakers would be needed to operate the NGCC plant – three at the output of each generator (two CTG and one steam turbine) and one at the end of the switchyard. It is common practice to use SF6 gas in the breakers, which is a GHG with a high global warming potential (GWP). The amount of SF6 used in each circuit breaker is given in the literature as 690 lbs; therefore, the NGCC plant requires 1251.92 kg of SF6 (HVB AE Power Systems, 2003). Although estimates vary, the national electrical manufacturers association states that the management guidelines for leakage of SF6 from circuit breakers are 0.1 percent/year (Blackman and Averyt, 2006). This calculates to a leakage rate of 3.056 × 10⁻⁷ kg/MWh net output. This leakage rate is noted as a data limitation. Table A-22 includes all air emissions associated with NGCC plant operations without CCS.
Table A-22: Air Emissions (kg/MWh) due to Power Plant Operations, NGCC without CCS
Emissions (kg/MWh)
NGCC w/o CCS Plant
Operations Lead 2.44E-06
Mercury 0.00E+00
Ammonia 2.00E-02
Carbon dioxide 4.18E+02
Carbon monoxide 3.12E-04
Nitrogen oxides 3.23E-02
Nitrous oxide (laughing gas) 2.38E-06
Sulfur dioxide 2.23E-06
Sulfur hexafluoride 3.47E-07
Methane 8.56E-06
Methane (biotic) 0.00E+00
VOC (unspecified) 2.05E-05
Particulate Matter (unspecified) 2.83E-05
Dust (unspecified) 0.00E+00
Water Withdrawals and Emissions Total water withdrawal for the NGCC plant without CCS is specified in the Baseline Report as 0.96 m3/MWh net output (NETL, 2010). The Baseline Report assumes a 1:1 ratio of water input from surface and ground water supplies. It is important to note that the cooling water demand in

Appendix: NGCC-LCA
48
the Baseline Report is based on an NGCC power plant located in the Midwestern United States; the NGCC plant in this study is assumed to be in Mississippi. The differences in elevation and ambient conditions between the two locations would result in differences in cooling water needs. This is noted as a data limitation in this study as no changes were made to the Baseline Report water data to account for the difference in location. The Baseline Report does not specify water consumption; a second National Energy Technology Laboratory (NETL) study was used to determine the fraction of water that is discharged and evaporated (consumed) by the system (NETL, 2007). The fraction of water discharged was calculated as 0.225, giving a water discharge rate of 0.216 m3/MWh.
A.1.4 Life Cycle Stage #3, Case 2: NGCC Energy Conversion Facility with CCS
A.1.4.1 GaBi Plan Figure A-22 defines the second level GaBi plan for the NGCC case with CCS. This plan is based on a reference flow of 1 MW electricity output. The addition of the pipeline third level plan is the main differences between Stage #3 in the two cases. Assumptions on the commissioning/decommissioning, construction, and operation of the pipeline are included in the following sections.
Figure A-22: GaBi Plan for Stage #3, Case 2: NGCC with CCS

Appendix: NGCC-LCA
49
A.1.4.2 Commissioning, Installation, and Decommissioning Assumptions
There are no case-specific power plant installation/deinstallation parameters within this study; Section A.1.3.2 and Figure A-20 represent both cases. Additionally, the pipeline installation is assumed to be the same for all underground operations in Stage #1, Stage #2, and Stage #3.
A.1.4.3 Construction Assumptions The majority of construction assumptions have already been described in Section A.1.3.3. However, additional construction material is needed for carbon capture. Carbon capture equipment weight for the NGCC plant was estimated using carbon capture and CO2 compressor infrastructure weights for a similar installation that was scaled to the CO2 output of the NGCC plant (Koornneef, van Keulen et al., 2008). The weight of the CO2 pipeline from the plant to the sequestration site was estimated using a pipeline sizing application to estimate the pipe size and summing the weight of the distance of the pipeline. The weight of the materials for the injection well were estimated based on a discussion with an in-house authority. Table A-23 and Figure A-23 show the inputs and air emissions associated with NGCC plant with CCS construction.

Appendix: NGCC-LCA
50
Table A-23: Air Emissions (kg/MWh) for NGCC with CCS Plant Construction
Emissions (kg/MWh)
US: SERC Power
Grid Mix 2005
Cast iron part (sand
casting)
Aluminum sheet mix
PE
US: Concrete,
Ready Mixed, R-5-0
(100% Portland Cement)
Thermal energy from
heavy fuel oil
Steel Pipe, Welded, BF, Manufacture
Steel Plate, BF,
Manufacture
Steel, Stainless,
316 2B, 80% Recycled
Total
Lead 4.69E-09 1.29E-10 1.05E-08 0.00E+00 1.85E-11 5.31E-07 3.31E-07 0.00E+00 8.77E-07
Mercury 1.32E-09 4.98E-12 8.46E-10 0.00E+00 8.55E-14 1.41E-08 2.08E-08 0.00E+00 3.70E-08
Ammonia 4.52E-07 5.01E-09 2.43E-07 0.00E+00 6.61E-10 0.00E+00 0.00E+00 0.00E+00 7.01E-07
Carbon dioxide 9.43E-02 2.59E-03 6.50E-02 7.19E-02 1.14E-04 1.74E-01 1.67E-01 9.56E-03 5.85E-01
Carbon monoxide 3.90E-05 3.28E-06 5.61E-04 9.27E-05 4.18E-08 1.29E-03 1.41E-03 1.71E-05 3.41E-03
Nitrogen oxides 1.83E-04 2.03E-06 1.14E-04 2.20E-04 1.30E-07 2.84E-04 2.80E-04 2.17E-05 1.10E-03
Nitrous oxide (laughing gas)
1.25E-06 3.72E-08 1.13E-06 0.00E+00 9.95E-10 9.73E-06 8.68E-06 0.00E+00 2.08E-05
Sulfur dioxide 5.35E-04 1.45E-06 3.60E-04 1.67E-04 4.80E-07 4.95E-04 3.80E-04 4.40E-05 1.98E-03
Sulfur hexafluoride 6.43E-13 8.82E-15 6.60E-12 0.00E+00 4.89E-17 0.00E+00 0.00E+00 0.00E+00 7.25E-12
Methane 1.03E-04 2.07E-06 1.07E-04 0.00E+00 1.17E-07 1.85E-04 1.27E-04 0.00E+00 5.24E-04
Methane (biotic) 0.00E+00 0.00E+00 0.00E+00 3.28E-06 0.00E+00 0.00E+00 0.00E+00 0.00E+00 3.28E-06
VOC (unspecified) 1.32E-08 6.90E-11 2.57E-06 8.09E-06 4.72E-11 2.35E-05 2.49E-05 0.00E+00 5.90E-05

Appendix: NGCC-LCA
51
Emissions (kg/MWh)
US: SERC Power
Grid Mix 2005
Cast iron part (sand
casting)
Aluminum sheet mix
PE
US: Concrete,
Ready Mixed, R-5-0
(100% Portland Cement)
Thermal energy from
heavy fuel oil
Steel Pipe, Welded, BF, Manufacture
Steel Plate, BF,
Manufacture
Steel, Stainless,
316 2B, 80% Recycled
Total
Particulate Matter (unspecified)
0.00E+00 0.00E+00 0.00E+00 0.00E+00 0.00E+00 0.00E+00 0.00E+00 0.00E+00 0.00E+00
Dust (unspecified) 1.01E-05 4.24E-06 1.10E-04 2.14E-04 2.12E-09 2.05E-04 4.01E-05 1.26E-05 5.96E-04

Appendix: NGCC-LCA
52
Figure A-23: GaBi Plan and Inputs for NGCC Plant with CCS Construction
A.1.4.4 Operation Assumptions The NGCC plant with CCS was modeled using the Baseline Report results for Case 14, an Advanced F-Class natural gas CTG plant producing a net output of 477 MWe (NETL, 2010). The system consists of two parallel CTG trains. Each CTG train is configured with a CTG and an HRSG; the two CTG trains share a common steam turbine. The CO2 is separated from the flue gas using an Econamine FG PlusSM amine-based capture system. An 85 percent capacity factor is assumed, making the calculated net output 405 MWe (NETL, 2010).
Operation of the auxiliary boiler and the trunkyard and switchyard system are the same as for the case without CCS and are therefore not repeated here.
Air Emissions
Primary NGCC Plant Operation The NGCC plant consumes 75,902 kg/hr of natural gas as specified in the Baseline Report, which is equivalent to 160.1 kg/MWh net electricity output (NETL, 2010). The Baseline Report also specifies CO2 and NOX emissions for the NGCC plant Case 14 in Exhibit ES-2 (NETL, 2010). These emissions were added to the auxiliary boiler emissions for CO2 and NOX for calculation of their respective output parameters. The Baseline Report specifies negligible Hg emissions from both NGCC plant cases, and additional data searches on the EPA’s National

Appendix: NGCC-LCA
53
Emissions Inventory confirmed that fact. Therefore, no Hg emissions are estimated for either NGCC plant or the auxiliary boiler. Additionally, NH3 (to air) emissions were not given in the Baseline Report for the NGCC plants. However, due to the use of SCR for NOX control, some NH3 is emitted. The Baseline Report states a 10 ppmv NH3 slip rate (through the stack) at the end of the catalyst life. Further investigation showed that as the SCR catalyst degrades, the NH3 slip increases; once new catalyst is added to the system the slip rate goes to zero (Blackman and Averyt 2006). We assumed the following to simplify the calculation of an NH3 emission rate: the 10 ppmv rate was is the maximum rate at the end of the catalyst life, each layer (in the two layer catalyst system) has a two-year lifetime (Mack and Patchett 1997), and the slip rate is linear to catalyst activity. Using the available data and assumptions, a 5 ppmv average slip rate was calculated for the lifetime of the plant. Lead emissions to air were estimated from the EPA National Emissions Inventory 2005 by taking the average pounds of Pb emitted to air per MWe nameplate output of seven natural gas-fired plants (EPA, 2005b). These seven plants vary in combustion technologies, output, locations, and control technologies. Therefore, the data does not follow the logical trend of more output equals more Pb and the calculated emission factor for Pb from the NGCC plant is noted as a data limitation. Because the Pb emissions from the emissions inventory did not specify whether auxiliary boiler emissions were included, both emissions are included in the total Pb emissions output for completeness.
CCS System CO2 Leakage The captured CO2 from this system is dried and pressurized to a supercritical state before being placed into a pipeline for transport to the saline sequestration site. Carbon dioxed becomes more dense when in its supercritical phase, making transport easier and more economical (Gale and Davison, 2004). Once in the pipeline, it can be assumed that some leakage might occur, but because CO2 pipelines are a relatively new infrastructure, little data is available on leak rates. Personal email communication with Faith Moore, a Regulatory Specialist for Denbury Onshore, LCC, stated, “Pipelines are monitored very closely by [the U.S. Department of Transportation’s Pipeline and Hazardous Materials Safety Administration (PHMSA)] under CFR 195 and leaks are not tolerated, other than if there is a pipe failure or a rupture of that nature” (Moore, 2009). In an effort to account for any monitoring limitations, a conservative leak rate estimate of 0.5 percent per 100 miles was assumed. This is noted as a data limitation.
This study includes little in the way of operations of the saline sequestration site. No energy or emissions associated with the day-to-day operation of the site are modeled, but a leak rate is assumed for the loss of CO2 over the lifetime of the system. Again, this is not an established infrastructure and little is known about sequestration potential over an extended period of time. Therefore, the arbitrary value of one percent is applied as a leak rate parameter for the sequestration site. NETL believes that a saline site which may leak more than one percent would not be a candidate for CO2 sequestration in the first place. Table A-24 shows the air emissions associated with NGCC plant operations including the CCS system.

Appendix: NGCC-LCA
54
Table A-24: Air Emissions (kg/MWh) associated with NGCC plant Operations with CCS
Emissions (kg/MWh)
NGCC with CCS Plant Operations
Lead 2.44E-06
Mercury 0.00E+00
Ammonia 2.15E-02
Carbon dioxide 5.35E+01
Carbon monoxide 3.63E-04
Nitrogen oxides 3.76E-02
Nitrous oxide (laughing gas) 2.77E-06
Sulfur dioxide 2.60E-06
Sulfur hexafluoride 4.03E-07
Methane 9.95E-06
Methane (biotic) 0.00E+00
VOC (unspecified) 2.38E-05
Particulate Matter (unspecified) 3.29E-05
Dust (unspecified) 0.00E+00
Water Withdrawal and Consumption Total water Withdrawal for the NGCC plant with CCS is specified in the Baseline Report as 1.84 m3/MWh net output (NETL, 2010). The increase in water withdrawal and consumption for the case with CCS (compared to 1.02 m3/MWh net output for the without CCS case) is due to additional water needs during the carbon capture process to cool both the flue gas before it enters the amine absorber and the column during absorption (the reaction between CO2 and the amine solvent is exothermic) (Reddy, Johnson et al., 2008). For comparison, the flue gas enters the stack (after carbon capture) at 85.1°F in the case with CCS versus 220°F in the plant without CCS (NETL, 2010). The Baseline Report assumes a 1:1 ratio of water input from surface and ground water supplies. It is important to note that the cooling water demand in the Baseline Report is based on an NGCC power plant located in the Midwestern United States; the NGCC plant in this study is assumed to be in Mississippi. The differences in elevation and ambient conditions between the two locations would result in differences in cooling water needs. This is noted as a data limitation in this study as no changes were made to the Baseline Report water data to account for the difference in location. The Baseline Report does not specify water consumption; a second NETL study was used to determine the fraction of water that is discharged and evaporated (consumed) by the system (NETL, 2007). The NETL water loss study does not consider a plant with CCS, so some assumptions were made to account for the

Appendix: NGCC-LCA
55
additional cooling water usage. The fraction of water consumed by evaporation was calculated as 0.21, giving a water discharge rate of 0.38 m3/MWh. The water discharge rate was estimated from a study with no CCS, which was extrapolated to the CCS case, and is noted as a data limitation.
A.1.5 Life Cycle Stage #4: Product Transportation – Electrical Grid Once the electricity is produced and sent through the switchyard and trunkline system it is ready for transmission, via the grid, to the user. A seven percent loss in electricity during transmissions was assumed for all the NETL Power Life Cycle Analysis (LCA) studies (Bergerson, 2005; EIA, 2007). This loss only impacts the cost parameters, as no environmental inventories are associated with transmission loss. Table A-25 shows how this loss is captured in the GaBi modeling framework. The transmission line was considered existing infrastructure, therefore the construction of the line, along with the associated costs, emissions, and land use changes, was not included within the system boundaries for this study.
Table A-25: GaBi Modeling Framework Inputs for Transmission Line Loss
Parameter Formula Value Comments
Elec_loss
7% Transmission line loss (EIA 2005)
Pow_loss 100/(100-Elec_loss) 1.0753 [%] Electricity input to the transmission line.
Sulfur hexafluoride leakage rates from the U.S. transmission and distribution grid are estimated using information collected and compiled from EPA's "SF6 Emission Reduction Partnership for Electric Power Systems" (EPA, 2007). Data is collected and compiled from various members of the partnership, which in 2006 represented 42 percent of the U.S. grid in terms of U.S. transmission mileage.
EPA utilizes the aforementioned data to develop the "Inventory of US Greenhouse Gas Emissions and Sinks" (EPA, 2008). In preparing the national SF6 leakage estimate, EPA assumes that "partners commit to reducing SF6 emissions through technically and economically feasible means. However, non-partners were assumed not to have implemented any changes that would have reduced emissions over time."
It was noted that in 2007 and 2008 the partnership continued to grow but there was no quantification of the percent representation of the U.S. power grid. Therefore, it has been assumed that in 2007, the partnership represented 42 percent of the U.S. grid (conservative estimate which will result in slightly higher SF6 emissions estimate). For this analysis, it is assumed that the SF6 leak rate for non-partners (remaining 58 percent of the U.S. grid transmission mileage) will be twice that of partners. This value could be entered as a parameter and could be varied in a sensitivity analysis. Note that SF6 emissions calculated in this manner exceed EPA's estimates by five percent (EPA, 2008).

Appendix: NGCC-LCA
56
A.1.6 Life Cycle Stage #5: End User – Electricity Consumption Finally, the electricity is delivered to the end user in LC Stage #5. All NETL power generation LCA studies assume electricity is used by a non-specific, 100 percent efficient process. This assumption avoids the need to define a unique user profile, and allows all power generation studies to be compared on equal footing. Therefore, no environmental inventories were collected for Stage #5.

Appendix: NGCC-LCA
57
References AES Corporation (2007). Appellant's Consolidated Record Submission AES Sparrows Point
FERC Application Volumes I and II, Table 9A-37a. Office of General Counsel Coastal Zone Management Act Consistency Appeals Website. http://www.ogc.doc.gov/CZMA.nsf/d7d1f8ff6d15c2248525717e00810cb3/8fbae1ab129464e68525735a007d4626?OpenDocument.
AES Corporation (2009). AES Sparrows Point LNG [cited May 6 2009] Available from: http://www.aessparrowspointlng.com/sparrowspoint.asp#anchor1.
ALL Consulting (2004). Coal Bed Methane Primer: New Source of Natural Gas -- Environmental Implications. February, 2004.
ALNG (2006). Atlantic LNG: Company of Trindad and Tobago [cited May 13 2009] Available from: http://www.atlanticlng.com/.
API (2004). Compendium of Greenhouse Gas Emissions. API. http://www.api.org/ehs/climate/new/upload/2004_COMPENDIUM.pdf.
API (2009). Compendium of Greenhouse Gas Emissions for the Oil and Natural Gas Industry. API. Washington, DC. 2009. http://www.api.org/ehs/climate/new/upload/2009_GHG_COMPENDIUM.pdf (Accessed May 18, 2010)
Argonne National Laboratory (2008). Transportation Technology R&D Center, DOE H2A Delivery Analysis [cited November 11th, 2008] Available from: http://www.transportation.anl.gov/modeling_simulation/h2a_delivery_analysis/.
Arnold (1999). Surface Production Operations: Design of gas-handling systems and facilities. Gulf Professional Publishing. Houston, Texas. 1999.
Aspen Environmental Group,(2008). Transmission Line Construction [cited July 30 2008] Available from: ftp://ftp.cpuc.ca.gov/gopher-data/environ/tehachapi_renewables/FS6.pdf.
Bare, Jane C., Norris, Gregory A., Pennington, David W., et al. (2003). "TRACI: The Tool for the Reduction and Assessment of Chemical and Other Environmental Impacts". Journal of Industrial Ecology 6 (3-4):49-78. http://www.epa.gov/ORD/NRMRL/std/sab/traci/index.html
Battye, R., Battye, W., Overcash, C., et al.,(1994). Development and Selection of Ammonia Emission Factors. U.S. Environmental Protection Agency, Office of Research and Development.
Bechtel,(2004). Energy Frontier: Australia's Remote North Coast is the Setting for a New Cost-effecient Liquiefied Natural Gas Project [cited May 10 2009] Available from: http://www.bechtel.com/energy_frontier.html.
Bergerson, Joule Andrea. (2005). Future Electricity Generation: An Economic and Environmental Perspective on Near-, Mid- and Long-Term Technology Options and Policy Implementations, Carnegie Mellon University, Pittsburgh, Pennsylvania.
Billings, Richard and Wilson, Darcy,(2004). Data Quality Control and Emissions Inventories of OCS Oil and Gas Production Activities in the Brenton Area of the Gulf of Mexico. U.S

Appendix: NGCC-LCA
58
Department of the Interior, Minerals Management Service. http://www.gomr.mms.gov/PI/PDFImages/ESPIS/2/3008.pdf.
Blackman, J. and Averyt, M. (2006). SF6 Leak Rates from High Voltage Circuit Breakers - U.S. E.P.A. Investigates Potential Greenhouse Gas Emissions Source. Paper presented at IEEE Power Engineering Society General Meeting, at Montreal, Quebec, Canada.
Brune, P. (2008). A Pain in the Ice: Nebraska Public Power District 2007 Ice Storm. Paper presented at Edison Electric Institute Spring 2008 Conference.
Calpine/Bechtel,(2001). Application for Certification: Russell City Energy Center, Appendix 8.1E: Construction Emissions and Impact Analysis. California Energy Commission, Hayward, California. http://www.energy.ca.gov/sitingcases/russellcity/index.html.
Canals, L. M., Bauer, C., Depestele, J., et al. (2007). "Key Elements in a Framework for Land Use Impact Assessment within LCA". International Journal of Life Cycle Assessment 12:5-15.
CapX 2020,(2007). Proposed Transmission Line Infrastructure [cited October 28 2008] Available from: http://www.capx2020.com/Images/Transmission_Line_Factsheet_1.pdf
Colton Company,(2006). The World Fleet of LNG Carriers. Colton Company] Available from: (Internet link no longer active).
Conaway, Christopher H., Mason, Robert P., Steding, Douglas J., et al. (2005). "Estimate of mercury emission from gasoline and diesel fuel consumption, San Francisco Bay area, California". Atmospheric Environment 39 (1):101-105. http://www.sciencedirect.com/science/article/B6VH3-4DPC3KY-2/2/f5afa2357561d9a8485df82f60084a68
ConocoPhillips,(2005). Darwin LNG Operations Environmental Management Plan [cited May 1 2009] Available from: http://www.conocophillips.com.au/NR/rdonlyres/79B19009-8E3F-44A1-81A0-7E78F7227888/0/DLNGHSEPLN001_s05_r1.pdf.
CPM,(1994). SPINE LCI dataset: Extraction of Crude Oil and Gas, Norway. Center for Environmental Assessment of Product and Material Systems, Chalmers University [cited April 29 2009] Available from: http://www.cpm.chalmers.se/CPMDatabase/Start.asp.
CWLP,(2009). Building a New Power Plant. City Water, Light & Power, Electric Division, Springfield, Illinois [cited April 9 2009] Available from: http://www.cwlp.com/electric_division/generation/build_new_plant.htm.
Davis, Stacy C., Diegel, Susan, W. and Boundy, Robert G.,(2008). Trasportation Energy Data Book: Edition 27. U.S Department of Energy, Office of Energy Efficiency and Renewable Energy. http://www-cta.ornl.gov/data/download27.shtml. ORNL-6981.
Dennis, Scott M. (2005). "Improved Estimates of Ton-Miles". Journal of Transportation and Statistics 8 (1).
DEQ Louisiana,(2007). 2007 Certified Totals of Criteria Pollutants for Lousiana. Department of Environmental Quality,] Available from:

Appendix: NGCC-LCA
59
http://www.deq.louisiana.gov/portal/LinkClick.aspx?fileticket=KvqcnDz%2fj4w%3d&tabid=1758
DOE (1996). Buying an Energy-Efficient Electric Motor. Department of Energy, Industrial Technologies Program. 1996. http://www1.eere.energy.gov/industry/bestpractices/pdfs/mc-0382.pdf (Accessed May 18, 2010)\ EIA, 2007. Natural Gas Compressor Stations on the Interstate Pipeline Network: Developments Since 1996.
DOE (1997). Renewable Energy Technology Characterization. Department of Energy, Office of Utility Technologies, Energy Efficiency and Renewable Energy, Washington DC. Report Number TR-109496.
DOE (2005). Liquefied Natural Gas: Understanding the Basic Facts. Department of Energy. http://www.fossil.energy.gov/programs/oilgas/publications/lng/LNG_primerupd.pdf. DOE/FE-0489.
DOI (2001). Proposed Use of Floating Production, Storage, and Offloading Systems On the Gulf of Mexico Outer Continental Shelf. Department of the Interior, Minerals Management Services, New Orleans, Louisiana. Report Number OCS EIS/EA MMS 2000-090.
EIA (2003). The Global Liquefied Natural Gas Market: Status and Outlook. http://www.eia.doe.gov/oiaf/analysispaper/global/importers.html DOE/EIA-0637.
EIA (2007). Annual Energy Outlook 2007 with Projections to 2030. Energy Information Administration. http://www.eia.doe.gov/oiaf/archive/aeo07/index.html. Report Number DOE/EIA-0383(2007).
EIA (2007b). http://tonto.eia.doe.gov/FTPROOT/features/ngcompressor.pdf. (Accessed May 18, 2010)
EIA (2008). Fuel Emission Factors. Energy Information Administration. http://74.125.47.132/search?q=cache:3aY1ZwFEJW8J:www.eia.doe.gov/oiaf/1605/excel/Fuel%2520Emission%2520Factors.xls+Fuel+Emission+Factors&hl=en&ct=clnk&cd=1&gl=us&client=firefox-a.
EIA (2009a). Annual Energy Outlook 2009. Department of Energy, Energy Information Administration. http://www.eia.doe.gov/oiaf/aeo/index.html. DOE/EIA-0383(2009).
EIA (2009b). Natural Gas Annual 2007. Energy Information Administration, Office of Oil and Gas, Washington, DC. http://www.eia.doe.gov/pub/oil_gas/natural_gas/data_publications/natural_gas_annual/current/pdf/nga07.pdf. DOE/EIA-0131(07).
EIA (2009c). United States Total 2008: Distribution of Wells by Production Rate Bracket. Energy Information Administration. 2009.
EIA (2009d). Natural Gas Year-In-Review. http://www.eia.doe.gov/pub/oil_gas/natural_gas/feature_articles/2009/ngyir2008/ngyir2008.html (Accessed July 16, 2010).
EIA (2010). Personal communication with Damian Gaul, Natural Gas Division, Office of Oil and Gas, EIA. May 10, 2010.

Appendix: NGCC-LCA
60
EPA (1990). Clean Air Act. In Title 42, Chapter 85, Subchapter I, Part A, edited by U.S Environmental Protection Agency.
EPA (1995). Compilation of Air Pollutant Emission Factors, Volume I: Stationary Point and Area Sources, AP-42. US EPA Office of Air Quality Planniing and Standards. Research Triangle Park, North Carolina. 1995. http://www.epa.gov/ttnchie1/ap42 (Accessed May 18, 2010)
EPA (1995). Compilation of Air Pollutant Emission Factors, Volume I: Stationary Point and Area Sources. U.S. Environmental Protection Agency, Office of Air and Radiation, Office of Air Quality Standards and Planning, Research Triangle Park, NC.
EPA (1998). AP 42 Chapter 1: External Combustion Sources, 1.4 Natural Gas Combustion, Supplement D. Available from: http://www.epa.gov/ttn/chief/ap42/ch01/final/c01s04.pdf.
EPA (2000). AP 42, Fifth Edition, Volume I, Chapter 3.2: Natural Gas-fired Reciprocating Engines U.S Environmental Protection Agency. http://www.epa.gov/ttn/chief/ap42/ch03/index.html.
EPA (2002). Control of Emissions from Compression-Ignititon Marine Diesel Engines At or Above 30 Liters per Cylinder. Office of Transportation and Air Quality. Report Number: EPA420-D-02-002.
EPA (2005a). Emission Facts. U.S. Environmental Protection Agency, Office of Transportation and Air Quality. http://www.epa.gov/OMS/climate/420f05001.htm#calculating. Report Number EPA420-F-05-001.
EPA (2005b). National Emissions Inventory Data & Documentation. U.S. Environmental Protection Agency. Available for download: http://www.epa.gov/ttn/chief/net/2005inventory.html.
EPA (2006). Replacing Glycol Dehydrators with Desiccant Dehydrators, EPA, October 2006, Washington DC. http://www.epa.gov/gasstar/documents/ll_desde.pdf (Accessed June 1, 2010)
EPA (2007). SF6 Emission Reduction Partnership for Electric Power Systems : 2006 Annual Report. http://www.epa.gov/electricpower-sf6/documents/sf6_2006_ann_report.pdf.
EPA (2007). SF6 Emission Reduction Partnership for Electric Power Systems : 2006 Annual Report. http://www.epa.gov/electricpower-sf6/documents/sf6_2006_ann_report.pdf.
EPA (2008). Inventory of U.S. Greenhouse Gas Emissions and Sinks: 1990-2006. U.S. Environmental Protection Agency. http://www.epa.gov/climatechange/emissions/usinventoryreport.html. Report Number: US EPA 430-R-08-005.
EPA (2009). 2009 U.S. Greenhouse Gas Inventory Report: Inventory of U.S. Greenhouse Gas Emissions and Sinks: 1990-2007. U.S. Environmental Protection Agency. http://www.epa.gov/climatechange/emissions/usinventoryreport.html.
EPA (2010). Inventory of Greenhouse Gas Emissions and Sinks: 1990-2008. U.S. EPA, Washington, D.C. April 15, 2010.

Appendix: NGCC-LCA
61
FERC (1995). Yukon Pacific LNG Project: Final Environmental Impact Statement. Office of Pipeline Regulation, Washington, DC. Report Number: FERC/EIS-0071.
FERC (2009). North American LNG Terminals:Approved [cited May 10 2009] Available from: http://www.ferc.gov/industries/lng/indus-act/terminals/lng-approved.pdf.
Gale, John and Davison, John. (2004). "Transmission of CO2 - Safety and Economic Considerations". Energy 29:1319-1328.
GE Oil and Gas (2005). Reciprocating Compressors. General Electric Company. Florence, Italy. 2005.
General Switchgear & Controls,(2008). Aluminum Vertical Break Disconnect Switch 7.5kV. to 345kV. 1200 to 4000 Amp, Bulletin T2050-1 [cited August 4 2008] Available from: http://www.gs.on.ca/acrobat/AVBCAT.PDF.
Hasan, M. M. Faruque, Zheng, Alfred Minghan and Karimi, I. A. "Minimizing Boil-Off Losses in Liquefied Natural Gas Transportation". Industrial & Engineering Chemistry Research 0 (0). http://pubs.acs.org/doi/abs/10.1021/ie801975q
Hayden, J., D. Pursell (2005). The Barnett Shale: Visitors Guide to the Hottest Gas Play in the US. Pickering Energy Partners. October 2005.
Houston Advanced Research Center (2006). Natural Gas Compressor Engine Survey for Gas Production and Processing Facilities, H68 Final Report. Houston Advanced Research Center. Houston, Texas. 2006. http://www.utexas.edu/research/ceer/GHG/files/ConfCallSupp/H068FinalReport.pdf (Accessed May 18, 2010)
HVB AE Power Systems,(2003). Dead Tank SF6 Gas Circuit Breakers. HVB AE Power Systems, Inc. [cited July 30 2008] Available from: http://www.hvbi.com/Products/GCB/HPI/GCB%20362kV-550%20HPI%20info_V2.pdf.
Hydrocarbons Technology (2009a). Darwin LNG Project, Darwin Harbour, Australia. SPG Media Group Ltd [cited May 6 2009] Available from: http://www.hydrocarbons-technology.com/projects/darwin/.
Hydrocarbons Technology (2009b). Qatar Gas I LNG Plant. Ras Laffan, Qatar [cited May 6 2009] Available from: http://www.hydrocarbons-technology.com/projects/raslaffanlng/.
ICF Consulting Ltd (2002). Unit Costs of Constructing New Transmission Assets at 380kV within the European Union, Norway, and Switzerland. DG TREN/European Commission. http://ec.europa.eu/energy/electricity/publications/doc/comp_cost_380kV_en.pdf. Study Contract NoTREN/CC/03-2002.
IPCC (2007). Climate Change 2007 Fourth Assessment Report. Edited by Intergovernmental Panel on Climate ChangeNew York: Cambridge University Press.
ISO (2006). Environmental management - Life Cycle assessment - Requirements and guidelines. International Standards Organization. ISO - 14044:2006.

Appendix: NGCC-LCA
62
Jaramillo, Paulina. (2007). A Life Cycle Comparison of Coal and Natural Gas for Electricity Generation and the Production of Transportation Fuels, Civil and Environmental Engineering, Carnegie Mellon University, Pittsburgh, Pennsylvania.
Keidy Electro-Mechanical Company,(2008). SF6 Circuit Breaker Porcelain Bushing [cited August 4 2008] Available from: http://www.keidy.com/electric/1-1/16-1.htm.
Koellner, T. and Scholz, R.W. (2007). "Assessment of Land Use Impacts on the Natural Environment. Part 1: An Analytical Framework for Pure Land Occupation and Land Use Change". International Journal of Life Cycle Assessment 12:16-23.
Koornneef, Joris, van Keulen, Tim, Faaij, André, et al. (2008). "Life cycle assessment of a pulverized coal power plant with post-combustion capture, transport and storage of CO2". International Journal of Greenhouse Gas Control 2 (4):448-467. http://www.science-direct.com/science/article/B83WP-4T24FXP-2/2/7b014fe251d8ab6d3b0962e992e4c248
Lunsford, K. (2006). Optimization of Amine Sweetening Units. Bryan Research and Engineering. 2006.
Mack, Stanley and Patchett, Joseph. (1997). SCR Catalyst Management Strategies to Reduce Operating Expenses. Paper presented at Conference on Selective Catalytic and Non-Catalytic Reduction for NOx Control.
Mithethwa, Mzingaye,(2004). The Impact of Power Generation Projects on the Steel Industry. China Steel Construction Society [cited April 1 2009] Available from: http://www.cncscs.org/saisc/The%20impact%20of%20power%20generation%20projects%20on%20the%20steel%20industry.pdf
Moore, Faith. (2009). RE: CO2 Pipeline Leakage Data Search from Faith Moore, Regulatory Specialist at Denbury Onshore, LCC Pittsburgh, Pennsylvania, February 10, 2009.
NACO (2009). Project Details. NACO Construction and Trading [cited May 9 2009] Available from: http://www.naco-construction.com/ProjectDetail.asp?PID=91.
Namba, N. (2006). Transportation of Clean Energy at Sea: Mitsubishi LNG Carrier at Present and in the Future. Mitsubishi Heavy Industries, Ltd.] Available from: (Internet link no longer active).
Natural Gas.org (2004). Well Completion. http://naturalgas.org/naturalgas/well_completion.asp#liftingwell (Accessed July 1, 2010)
NETL (2007). Power Plant Usage and Loss Study. National Energy Technology Laboratory.
NETL (2008). DOE/NETL's Power Systems Financial Model (PSFM) [cited August 28, 2008] Available from: http://www.netl.doe.gov/technologies/coalpower/gasification/sys-analysis/.
NETL (2010). Cost and Performance Baseline for Fossil Energy Plants: Volume 1. Department of Energy, National Energy Technology Laboratory, Pittsburgh, Pennsylvania. Report Number DOE/NETL-2010/1397.
Odeh, Naser A. and Cockerill, Timothy T. (2008). "Life Cycle Analysis of UK Coal Fired Power Plants". Energy Conversion and Management 49:212-220.

Appendix: NGCC-LCA
63
Offshore Technology (2009). Bombax Pipeline Development, Trindad and Tobago. SPG Media Limited [cited February 18 2009] Available from: http://www.offshore-technology.com/projects/bombax/.
Offshore-technology.com (2010). Mars, Gulf of Mexico, USA. Net Resources International. http://www.offshore-technology.com/projects/mars/(Accessed June 11, 2010)
Panhandle Energy (2006). Flexible LNG Services [cited April 29, 2009] Available from: http://www.panhandleenergy.com/serv_lng.asp.
Peterson, P. (2005). The Future of Nuclear Energy Policy: A California Prespective. Department of Nuclear Engineering, University of California [cited April 1 2009] Available from: http://www.nuc.berkeley.edu/news/CEC/CEC_Nuclear_Workshop_PFP_8=051.pdf
Phelps Dodge (2005). Aluminum Conductors, Aluminum-Clad Steel Reinforced. Phelps Dodge International Corporation [cited October 6 2008] Available from: http://www.pdic.com/NR/rdonlyres/23379782-8EF2-498B-894A-95D881E64BEB/0/PDIC01048.pdf
Polasek (2006). Selecting Amines for Sweetening Units. Bryan Research and Engineering. 2006.
Portland Cement Association,(2008). Concrete Technology [cited July 30 2008] Available from: http://www.cement.org/tech/faq_unit_weights.asp.
Reddy, Satish, Johnson, Dennis and Gilmartin, John,(2008). Fluor's Econamine FG PlusSM Technology for CO2 Capture at Coal-fired Power Plants. Fluors.
Richardson, F.W., Hunter, P., Diocee, T., et al.,(1999). Passing the Baton Cleanly: Commissioning & Start-Up of the Atlantic LNG Project in Trinidad. Conocophillips, . http://lnglicensing.conocophillips.com/NR/rdonlyres/51C1F725-27A2-40E2-8A4A-8D2CB49FBDE0/0/passingthebaton.pdf.
SCS (2008). LCSEA FRAMEWORK: Protocols for Conducting LCIA in Accordance with Draft ASTM E06.71.10. Scientific Certification Systems. http://www.scscertified.com/events/DOCS/AnnexA_LCSEA_0108F.pdf.
Skone, Tim. (2008). Life Cycle Assessment Meeting Notes. Pittsburgh PA.
SMUD (2001). Application for Certification for the Consumnes Power Plant Project. Sacramento Municipal Utility District. http://www.energy.ca.gov/sitingcases/smud/.
Spath, Pamela L., Mann, Margaret K. and Keer, Dawn R. (1999). Life Cycle Assessment of Coal-fired Power Production. NREL. NREL/TP-570-25119.
Steel Pipes & Tools,(2009). Steel Pipe Weight Calculator [cited May 1 2009] Available from: http://www.steel-pipes-tubes.com/steel-pipe-weight-calculator.html.
Stewart, E.J. (1994). Reduce Amine Plant Solvent Losses. Hydrocarbon Processing. Gulf Publishing. Houston, Texas. May 1994.
Tamura, I., Tanaka, T., Kagajo, T., et al. (2001). "Life Cycle CO2 Analysis of LNG and City Gas". Applied Energy 68:301-319.
Tokimatsu, Koji, Kosugi, Takanobu, Asami, Takayoshi, et al. (2006). "Evaluation of lifecycle CO2 emissions from the Japanese electric power sector in the 21st century under various

Appendix: NGCC-LCA
64
nuclear scenarios". Energy Policy 34 (7):833-852. http://www.sciencedirect.com/science/article/B6V2W-4DDR74D-1/2/0ba452ea277fb229a1c99e7be30915fe
U.S. Government Accountability Office (2010). Natural Gas Flaring and Venting: Opportunities to Improve Data and Reduce Emissions. Washington, D.C. July 2004. http://www.gao.gov/new.items/d04809.pdf (Accessed June 18, 2010)
URS (2003). "Preliminary Evaluation of Air Quality Impacts for the Proposed Mare Island Energy Center".
URS (2005). Darwin LNG Plant Environmental Management Programme, Volume 1 - EMP Overview and Compliance Audit Register. URS Australia Pty Ltd.
Wabash Power Equipment Company,(2009). 40000 PPH Nebraska, Watertube, Trailer mounted, 350 psi, gas/oil. Surplusrecord.com, [cited February 2 2009] Available from: http://www.surplusrecord.com/cgi-bin/adpop.pl?097693.
Wärtsilä Corporation,(2005). Wärtsilä 50DF. Wärtsilä Corporation] Available from: (Internet link no longer active).
Widiyanto, Anugerah. (2003). "Environmental Impact Analysis of Indonesian Electric Generation Systems". JSME International Journal Series B 46 (4):650-659.
Zecchino, Paul. (2008). Phone Conversation with HVB AE Power Systems, Ltd. Representative, October 24, 2008.