Appendix: Notes on signal processing · A digital s Fig. 1: ... Notes the Spectru peech signal ......
13
Append Capturing A digital s Fig. 1: Transform time serie based on Fourier Tr transform being ana The comp The comp e jq = cos The real p series is a e jwt = cos Two comp Figure 2 s Fig. 2: e dix: Notes g the Spectru speech signal m analysis dec es. The compo different def ransform. In a m analysis det alyzed. plex exponen plex exponent sq + j sinq part is a cosin complex sum s(wt) + j sin(w plex exponen shows a set o 0 dt e e t j t j on signal p m: Transform such as the o composes thi onent time se initions of co a Fourier tran ermines the w ntial tial is a comp e function. Th m of two time wt) ntials of differ of orthogonal if processing m analysis: Th one shown in s sequence o eries must be mponent tim nsform, the co weights of th lex sum of tw he imaginary e series rent frequenc complex exp g he discrete Fo Fig. 1 is a seq of numbers in e precisely def me series. The omponent tim e component wo sinusoids. part is a sine cies are “ortho ponential time ourier transfo quence of num to a weighted fined. Differe e most popula me series are t time series t e function. A c ogonal” to ea e series of the orm mbers. d sum of othe ent transform ar transform complex exp that comprise complex expo ach other. i.e. e same frequ er (componen analyses are used is the ponentials. Th e the given si onential time . ency. nt) e he gnal
Transcript of Appendix: Notes on signal processing · A digital s Fig. 1: ... Notes the Spectru peech signal ......
Append
Capturing
A digital s
Fig. 1:
Transform
time serie
based on
Fourier Tr
transform
being ana
The comp
The comp
ejq = cos
The real p
series is a
ejwt = cos
Two comp
Figure 2 s
Fig. 2:
e
dix: Notes
g the Spectru
speech signal
m analysis dec
es. The compo
different def
ransform. In a
m analysis det
alyzed.
plex exponen
plex exponent
sq + j sinq
part is a cosin
complex sum
s(wt) + j sin(w
plex exponen
shows a set o
0dtee tjtj
on signal p
m: Transform
such as the o
composes thi
onent time se
finitions of co
a Fourier tran
ermines the w
ntial
tial is a comp
e function. Th
m of two time
wt)
ntials of differ
of orthogonal
if
processing
m analysis: Th
one shown in
s sequence o
eries must be
mponent tim
nsform, the co
weights of th
lex sum of tw
he imaginary
e series
rent frequenc
complex exp
g
he discrete Fo
Fig. 1 is a seq
of numbers in
e precisely def
me series. The
omponent tim
e component
wo sinusoids.
part is a sine
cies are “ortho
ponential time
ourier transfo
quence of num
to a weighted
fined. Differe
e most popula
me series are
t time series t
e function. A c
ogonal” to ea
e series of the
orm
mbers.
d sum of othe
ent transform
ar transform
complex exp
that comprise
complex expo
ach other. i.e.
e same frequ
er (componen
analyses are
used is the
ponentials. Th
e the given si
onential time
.
ency.
nt)
e
he
gnal

A signal su
of differen
which the
three sets
Fig. 3:
The discre
Fourier tr
coefficien
transform
decompo
analyzed.
exponent
actually a
reality, it
data are o
Consider t
Fig. 4:
uch as the on
nt frequencie
e signal is ana
s of complex e
ete Fourier tr
ansform of a
nts (or weight
m decomposes
ses a signal in
An aperiodic
ials. Or into a
ssumes that t
computes the
one period.
the signal in F
ne in Fig. 1 is e
es. The numb
lyzed) is deci
exponential t
ransform
discrete sign
ts) A, B, and C
s the signal in
nto exactly as
c signal canno
a sum of any c
the signal bei
e Fourier spe
Fig. 4.
expressed as
er of such tim
ded by the al
time series.
al is often ca
C, for example
nto the sum o
s many expon
ot be decomp
countable set
ing analyzed
ctrum of the
a sum of seve
me series (and
lgorithm used
lled Discrete
e, would be o
of a finite num
nentials as the
posed into a s
t of periodic s
is exactly one
infinitely long
eral such com
d therefore th
d to obtain th
Fourier Trans
obtained by a
mber of comp
ere are samp
um of a finite
signals. The d
e period of an
g periodic sig
mplex expone
he number of
he transform.
sform, or DFT
DFT. The disc
plex exponent
les in the sign
e number of c
discrete Fourie
n infinitely lon
gnal, of which
ential time ser
f frequencies
Fig. 3 shows
T. In Fig. 3, the
crete Fourier
tials. In fact, i
nal being
complex
er transform
ng signal. In
the analyzed
ries,
into
s
e
it
d

The discre
periodic s
this signa
Fig. 5:
The kth po
x[n] is the
spectrum
identical t
Discrete F
part sinq
ejq = cosq
As a resul
X[k] = Xre
A magnitu
Xmagnitude[
A power s
Xpower[k] =
For speec
A discrete
compone
frequenci
the DFT re
][kX
MX [
M
n
ete Fourier tr
signal shown
l is 31 sample
oint of a Fouri
e nth point in t
. M is the tot
to the kth Fou
Fourier transf
q + j sinq
t, every X[k]
al[k] + jXimagina
ude spectrum
k] = sqrt(Xreal
spectrum is th
= Xreal[k]2 + Xim
ch recognition
e Fourier tran
nts, i.e. the D
es in the cont
epresents 0H
1
0
2
][M
n
j
enx
M
n
kM1
0
]
][1
0
2 eenx nj
ansform of th
in Fig. 5. Note
es in this exam
ier transform
the analyzed
al number of
rier coefficie
form coefficie
has the form
ry[k]
m represents o
[k]2 + Ximag[k]2
he square of t
mag[k]2
n, we usually
sform of an M
DFT of an M p
tinuous‐time
z, or the DC c
2
M
kn
M
Mj
enx2
][
1
0
2
xeM
n
M
knj
he above sign
e that the spe
mple.
m is computed
data sequenc
f points in the
nt
ents are gene
only the magn2)
the magnitud
use the magn
M‐point sequ
oint sequenc
signal that w
component o
M
n
nk
nx1
0
][
][2
enx M
knj
nal actually co
ectrum exten
d as:
ce. X[k] is the
e sequence. N
rally complex
nitude of the
de spectrum
nitude or pow
ence will only
ce will have M
was digitized t
f the signal. T
M
kj
M
Mnj
ee 22
]
][kX
omputes the
ds from –infi
value of the
Note that the
x. ejq has a rea
Fourier coeff
wer spectra
y compute M
M points. The
to obtain the
The (M‐1)th po
M
kn
Fourier spect
nity to +infini
kth point in it
(M+k)th Fouri
al part cosq a
ficients
M unique frequ
M‐point DFT
digital signal
oint in the DF
trum of the
ity. The perio
ts Fourier
ier coefficient
and an imagin
uency
represents
. The 0th poin
FT represents
od of
t is
nary
t in
(M‐
1)/M time
0 and the
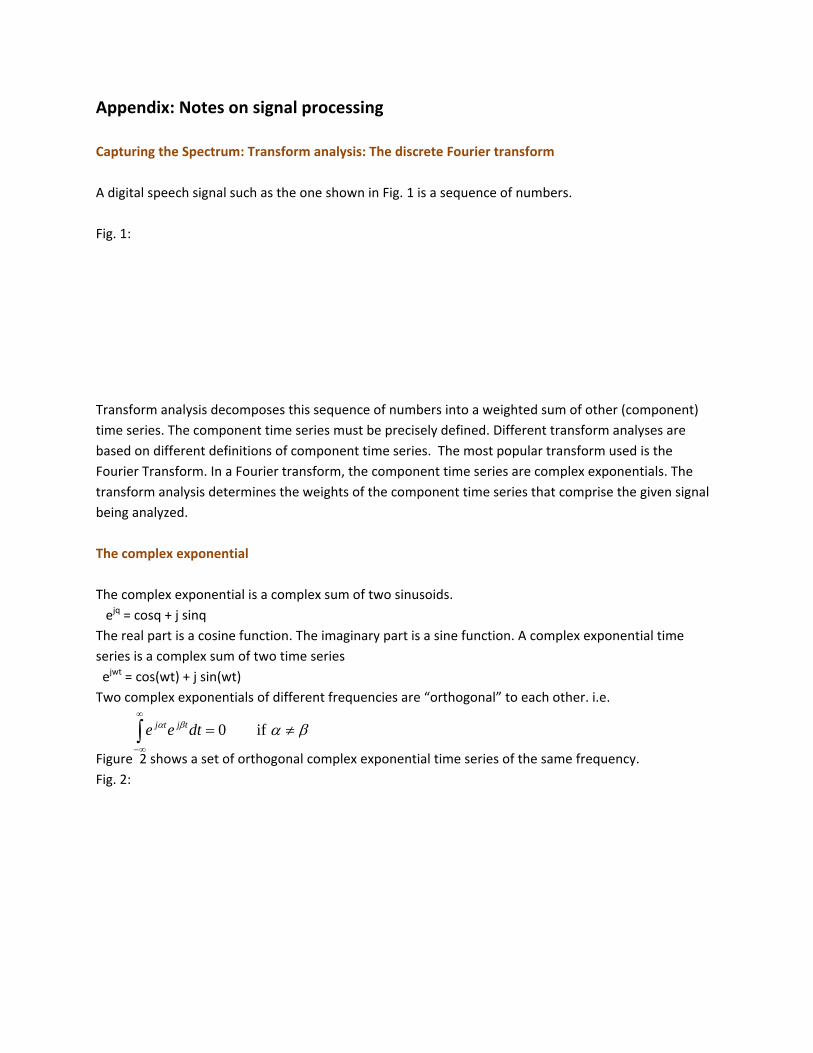
Fig. 6 (a) s
point mag
Fig. 6: (a)
(b)
The Fast F
the DFT co
signal can
Windowin
The DFT o
sinusoid f
Fig. 6: (a)
(a)
(b)
es the sampli
sampling fre
shows a 50 po
gnitude DFT is
)
Fourier Transf
omputation t
n be recovere
ng
of one period
from –infinity
a sinusoid; (b
1
][M
kMnx
ng frequency
quency.
oint segment
s shown in Fig
form (FFT) is
to reduce the
d from its DF
of the sinuso
y to +infinity.
b) one period
1
0
2
][ M
knj
ekX
y. All DFT poin
t of a decaying
g. 6(b). The 5
simply a fast
e total numbe
T as:
oid shown in t
of the sinuso
nts are unifor
g sine wave s
1st point (sho
algorithm to
er of arithmet
the Fig. 6 com
oid; (c) DFT of
mly spaced o
sampled at 80
own in red) is
compute the
tic operations
mputes the Fo
f (b)
on the frequen
000 Hz. The co
identical to t
e DFT. It utiliz
s greatly. The
ourier series o
ncy axis betw
orresponding
the 1st point.
es symmetry
time domain
of the entire
ween
g 50
in
n
(c)
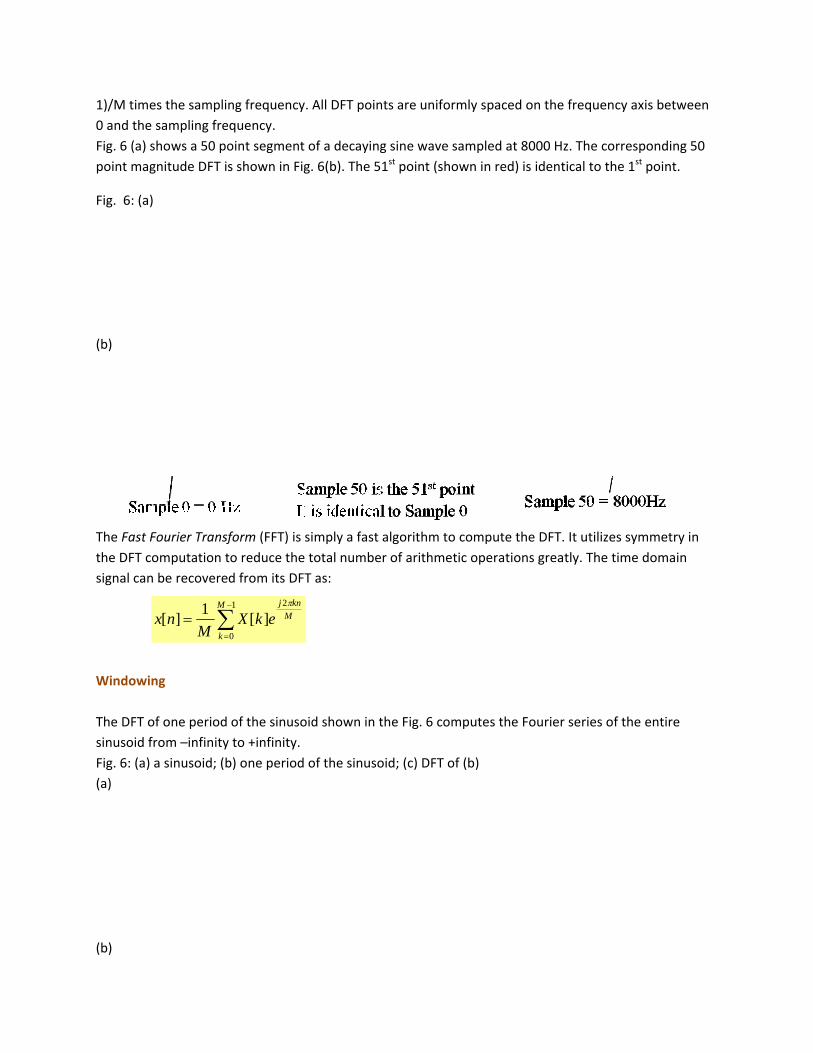
The DFT o
The DFT o
that segm
Fig. 7: (a)
of the “co
(a)
(b)
(c)
of any sequen
of a partial se
ment, and not
Partial segme
orrect” sinuso
nce computes
gment of a si
of the entire
ent of a sinus
oid
s the Fourier s
nusoid (Fig. 7
e sinusoid. Th
soid; (b) corre
series for an
7) computes t
is will not giv
esponding inf
infinite repet
the Fourier se
e us the DFT
finite periodic
tition of that s
eries of an ini
of the sinuso
c signal; (c) DF
sequence.
finite repetiti
oid itself!
FT of (b); (d) D
ion of
DFT

(d)
The differ
what the
the obser
Fig. 8: The
in 7(b) ins
The implic
These are
boundarie
discontinu
Fig. 8: disc
While we
discontinu
9(a). We c
Fig. 9: (a)
inferred w
(a)
rence betwee
signal actuall
rved window
e transform c
stead.
cit repetition
e shown encir
es of what ha
uities.
continuities a
can never kn
uities at the b
call this proce
windowing; (
windowed sig
en Fig. 7 (c) a
y looks like o
from what ha
annot infer th
of the observ
rcled in green
as been reliab
at the points o
now what the
boundaries. W
edure window
(b) change in
nal
nd Fig. 7 (d)
outside the ob
appens inside
he signal outs
ved signal int
n in Fig. 8. This
bly observed.
of replication
e signal looks
We do this by
wing. We refe
the central re
occurs due to
bserved wind
e. As a result,
side the seen
troduces large
s distorts eve
The actual si
n in the signal
like outside t
multiplying t
er to the resu
egions of the
o two reasons
ow . Rather, i
a signal such
window as s
e discontinuit
en our measu
ignal (whatev
inferred by t
the window, w
the signal wit
lting signal as
selected seg
s: The transfo
it infers what
as Fig. 8 can
such. It infers
ties at the po
rement of wh
ver it is) is unl
the transform
we can try to
h a window f
s a “windowe
gment due to
orm cannot k
t happens out
not be inferre
the signal sh
ints of repeti
hat happens a
likely to have
m
minimize the
unction, as in
ed” signal.
windowing; (
now
tside
ed.
own
tion.
at the
such
e
n Fig.
(c)

(b)
(c)
Windowin
in Fig. 9(b
The DFT o
introduce
complete
Fig. 10: (a
(a)
(b)
ng attempts t
b), and reduce
of the window
ed by disconti
signal whose
a) a windowed
to keep the w
e or eliminate
wed signal sho
nuities in the
e segment we
d signal; (b) m
windowed sign
e the disconti
own in Fig. 10
e signal. Often
e have analyz
magnitude spe
nal similar to
nuities in the
0(a) is shown
n it is also a m
ed.
ectrum of the
the original i
e implicit peri
in Fig. 10(b).
more faithful r
e wndowed s
n the central
odic signal, a
It does not h
reproduction
ignal in (a)
regions, as sh
s in Fig. 9(c).
have any artef
of the DFT o
hown
facts
f the

Fig. 11 su
spectrum
Fig. 11: (a
Magnitud
(a)
(b)
(c)
As we see
to the orig
complete
tradeoffs
a Hammin
(In the fol
Hamming
Hanning:
mmarizes the
:
a) Magnitude
de spectrum o
e in Fig. 9, Win
ginal (comple
signal anywh
between the
ng window. T
llowing, wind
g: w[n] = 0.54
w[n] = 0.5 – 0
e advantages
spectrum of
of complete s
ndowing is no
ete) signal wit
here. Several
e fidelity in th
his is one of a
ow length is
– 0.46 cos(2p
0.5 cos(2pn/M
of windowin
original segm
ine wave
ot a perfect s
thin the segm
windowing fu
e central regi
a class of win
M, Index beg
pn/M)
M)
g in terms of
ment; (b) Mag
olution. The o
ment. The win
unctions have
ions and the s
dows called c
gins at 0)
the changes
gnitude spectr
original (unw
ndowed segm
e been propo
smoothing at
cosine windo
achieved in t
rum of windo
indowed) seg
ent is often n
osed that strik
t the boundar
ws. Some cos
the signal
owed signal; (
gment is iden
not identical t
ke different
ries. Fig. 9(a)
sine windows
(c)
tical
to the
uses
s are:

Blackman
Geometri
Fig. 12: Ge
Zero Padd
We can pa
algorithm
algorithm
padding is
padding is
signal in F
samples in
does not c
Fig. 13: an
(a)
(b)
n: 0.42 – 0.5 c
c windows ar
eometric win
ding
ad zeros to th
m we use) requ
m : it requires
s to change th
s shown in Fig
Fig. 13(b) is es
nserted in be
contain less i
n example of
os(2pn/M) +
re another ca
dows: (a) Rec
he end of a si
uires signals o
signals of len
he periodic si
g. 13, which s
ssentially the
etween. It doe
nformation.
a zero‐padde
0.08 cos(4pn
tegory of com
ctangular (bo
gnal to make
of a specified
gth 2n , wher
ignal whose F
shows a zero‐
same as the
es not contain
ed signal; (a) t
n/M)
mmon window
oxcar); (b) Tria
it a desired l
length. (one
re n is a natur
Fourier spectr
‐padded signa
DFT of the un
n any addition
the signal; (b)
ws. Some of t
angular (Bartl
ength. This is
example is a
ral number). T
rum is being c
al and its DFT
npadded sign
nal informati
) its DFT
these are sho
lett); (c) Trap
s useful if the
radix‐2 FFT c
The conseque
computed by
T. The DFT of t
nal, with addit
on over the o
own in Fig. 12
ezoid
FFT (or any o
computation
ence of zero
the DFT. Zer
the zero padd
tional spectra
original DFT. I
.
other
ro
ded
al
t also

Fig. 14 fut
Fig. 14: Th
windowin
essentially
between.
less inform
Fig. 15 illu
that appe
also do no
ther illustrate
he left panels
ng are not the
y the same as
It does not c
mation.
ustrates the s
ear to be less
ot introduce a
es the conseq
s show the sig
e same as the
s the DFT of t
contain any ad
pecial case of
discontinuou
any new infor
quences of zer
gnals, and the
effects of ze
the unpadded
dditional info
f zero paddin
us at the edge
rmation into
ro padding.
e right panels
ro padding. T
d signal, with
ormation over
ng windowed
es, the “regula
the signal by
show the ma
The DFT of the
additional sp
r the original
signals. Wile
arization” of t
merely padd
agnitude spec
e zero padde
pectral sample
DFT. It also d
windowing r
the signal is o
ing it with ze
ctra. The effe
d signal is
es inserted in
does not conta
esults in sign
only illusory. W
ros.
cts of
n
ain
als
We

Fig. 15: (a
signal
(a)
(b)
(c)
Other exa
Fig. 16: Le
a) zero‐padde
amples of mag
eft panels sho
d signal (b) si
gnitude spect
ow the signals
ignal as perce
tra are shown
s and the righ
eived by the t
n in Fig. 16.
ht panels show
transform (c)
w the corresp
magnitude sp
ponding magn
pectrum of th
nitude spectr
he
a.
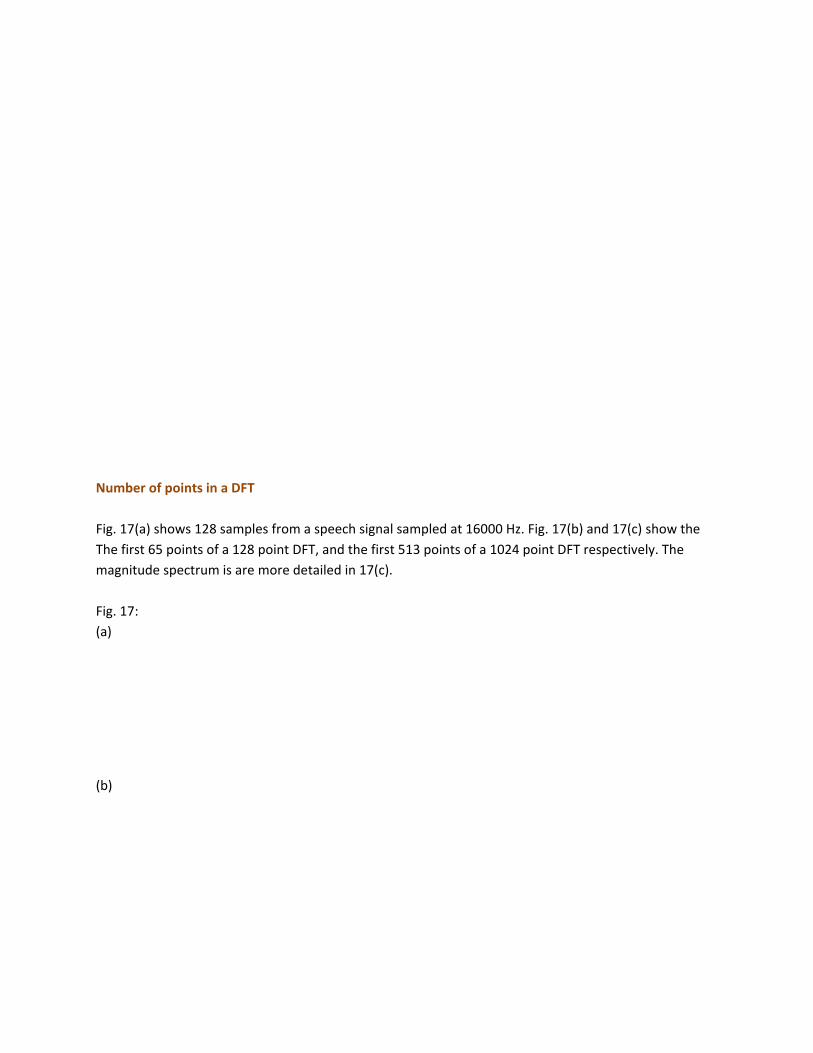
Number o
Fig. 17(a)
The first 6
magnitud
Fig. 17:
(a)
(b)
of points in a
shows 128 sa
65 points of a
e spectrum is
DFT
amples from
128 point DF
s are more de
a speech sign
FT, and the fir
etailed in 17(c
nal sampled a
rst 513 points
c).
at 16000 Hz. F
s of a 1024 po
Fig. 17(b) and
oint DFT resp
17(c) show t
pectively. The
the

(c)


![Survey of Current S peech Translation Research · Survey of Current S peech Translation Research ... prototype was tested in the field in Zagreb in April 2001, see [Frederick 2002]](https://static.fdocuments.net/doc/165x107/5f0a73767e708231d42bb285/survey-of-current-s-peech-translation-research-survey-of-current-s-peech-translation.jpg)