Appendix M Fire Monitoring Plan - National Park Service...vegetation management staff conducting...
104
1 FIRE MONITORING PLAN REDWOOD NATIONAL PARK APPROVED FOR REDWOOD NATIONAL PARK: Chief of Resource Management, Terry Hofstra_________________________________________________________ Fire Management Officer, Rick Young________________________________________________________________ Chief of Vegetation Management, Leonel Arguello_____________________________________________________ Regional Fire Ecologist, Robin Wills__________________________________________________________________
Transcript of Appendix M Fire Monitoring Plan - National Park Service...vegetation management staff conducting...

1
FIRE MONITORING PLAN
REDWOOD NATIONAL PARK
APPROVED FOR REDWOOD NATIONAL PARK:
Chief of Resource Management, Terry Hofstra_________________________________________________________
Fire Management Officer, Rick Young________________________________________________________________
Chief of Vegetation Management, Leonel Arguello_____________________________________________________
Regional Fire Ecologist, Robin Wills__________________________________________________________________

2
CONTENTS
Introduction ............................................................................................................................................ 4
Redwood Fire Management History .................................................................................................... 4
Redwood Fire Monitoring History ....................................................................................................... 9
Fire & Fuels Management ..................................................................................................................... 11
Ecology & Landscape Management ...................................................................................................... 13
The Bald Hills .................................................................................................................................... 15
Coastal Prairies ................................................................................................................................. 19
Little Bald Hills .................................................................................................................................. 20
Second Growth Forest ...................................................................................................................... 22
Boyes Prairie ..................................................................................................................................... 23
Management Goals & Objectives .......................................................................................................... 25
Fire Management Objectives ............................................................................................................ 25
Monitoring Design ................................................................................................................................ 26
Data Management & Analysis ........................................................................................................... 32
Data Management & Quality Control ................................................................................................ 32
Data Analysis .................................................................................................................................... 36
Reporting & Adaptive Management ..................................................................................................... 37
Collaboration .................................................................................................................................... 37
Roles & Responsibilities ........................................................................................................................ 38
Staff Roles & Responsibilities ............................................................................................................ 38
Work Plans & Prioritization ............................................................................................................... 39
Plan Input and Acknowledgements ....................................................................................................... 40
References ............................................................................................................................................ 42
Appendices ........................................................................................................................................... 46
A. Data collection tools and references .......................................................................................... 46
B. Plant List & Voucher Collection ................................................................................................. 46
C. Job Hazard Analysis ................................................................................................................... 55
D. Customized Data Sheet Examples ............................................................................................. 60
E. FFI User Guide ........................................................................................................................... 66
F. Maps ............................................................................................................................................. 75

3
F. Monitoring Schedule ................................................................................................................. 84
G. Bald Hills “Fir Plots” Methodology ............................................................................................. 90
I. Bald Hills Oak Woodland (FQUGA1D09) Canopy Cover Protocol............................................... 94
J. Bald Hills Oak Woodland (FQUGA1D09) FMH-4 ........................................................................ 95
K. Bald Hills Mixed Prairie (GMIPR1D03) FMH-4 ............................................................................ 98
L. FEMO Report Template ........................................................................................................... 100
On the cover: Images from the 2008 Copper Creek prescribed fire in the Bald Hills.
4
INTRODUCTION
The fire ecology program at Redwood National Park is responsible for providing monitoring and research support
to Redwood’s fire management program. This ensures that fire management is based upon the best available
science and knowledge. The fire ecology program assesses fire management actions through monitoring and
evaluation of management objectives. This fire monitoring plan communicates the monitoring and evaluation
strategy used to measure fire management program success. It is an appendix to Redwood’s Fire Management
Plan or RFMP (USDI NPS 2010), and is updated annually by fire ecology program staff.
When Redwood National Park was created in 1968, it included three state park units (Del Norte Redwoods,
Jedediah Smith Redwoods, and Prairie Creek Redwoods State Parks) within its boundaries. It was assumed that
the state park lands would be donated to the National Park Service (NPS), but this never happened (USDI NPS
CDPR 2000). This situation formed an opportunity for a unique partnership between the NPS and California
Department of Parks and Recreation (CDPR) to jointly manage these lands for resource protection, visitor
experience, and overall efficiency (USDI NPS CDPR 2000). While Redwood’s Fire Management Plan is written for
the Redwood National and State Park (RNSP) partnership, this Fire Monitoring Plan includes and applies to only
NPS lands. The one exception to this is long-term fire effects monitoring in Boyes Prairie of Prairie Creek
Redwoods State Park, which is discussed later in this plan. Redwood’s fire monitoring program was a
consequence of NPS policy such as Director’s Order # 18: Wildland Fire Management (USDI NPS 2008a) and its
accompanying Reference Manual #18: Wildland Fire Management (USDI NPS 2008b) that mandated monitoring
of NPS prescribed fire programs. Integrating the three state parks within the RNSP partnership into Redwood’s
fire monitoring program is a future possibility.
REDWOOD FIRE MANAGEMENT HISTORY
Early fire management at Redwood was the responsibility of the protection ranger staff. Total fire suppression
was the sole fire management objective from the park’s inception in 1968 until 1980. Engine stations were
established during the early 1980s at Hiouchi and Wolf Creek, and wildland fires were aggressively suppressed.
District Rangers were responsible for each engine, fire equipment, and initial attack response within their
assigned areas of the park. They were required to respond to all fires within their district and act as Incident
Commander, while permanent and seasonal protection staff was required to respond to fires and assist in a
capacity commensurate with their qualifications. Every summer one to three fire control aids were hired for each
engine; they were responsible for all of the engine maintenance, prevention and pre-suppression activities. In
addition to the protection staff and the seasonal fire control aids, all fireline qualified (e.g., red carded) park
personnel were expected to remain fire ready during critical fire danger periods and available for call-out after the
ranger staff resources were exhausted (USDI NPS 1985).
Schoolhouse Peak lookout was built in 1940, and was staffed and owned by CAL FIRE (California Department of
Forestry). The lookout was staffed seven days a week starting July 1st
, unless conditions warranted an earlier
season start, until the end of the fire season (USDI NPS 1985). In the late 1990s, the building along with the
responsibility of staffing the lookout was transferred from CAL FIRE to the park. In 2005, it was determined that
staffing the lookout full-time was no longer necessary. Currently the lookout is staffed only during prescribed fire
season and periods of lightning activity within the area (J. McClelland, pers. comm.).
5
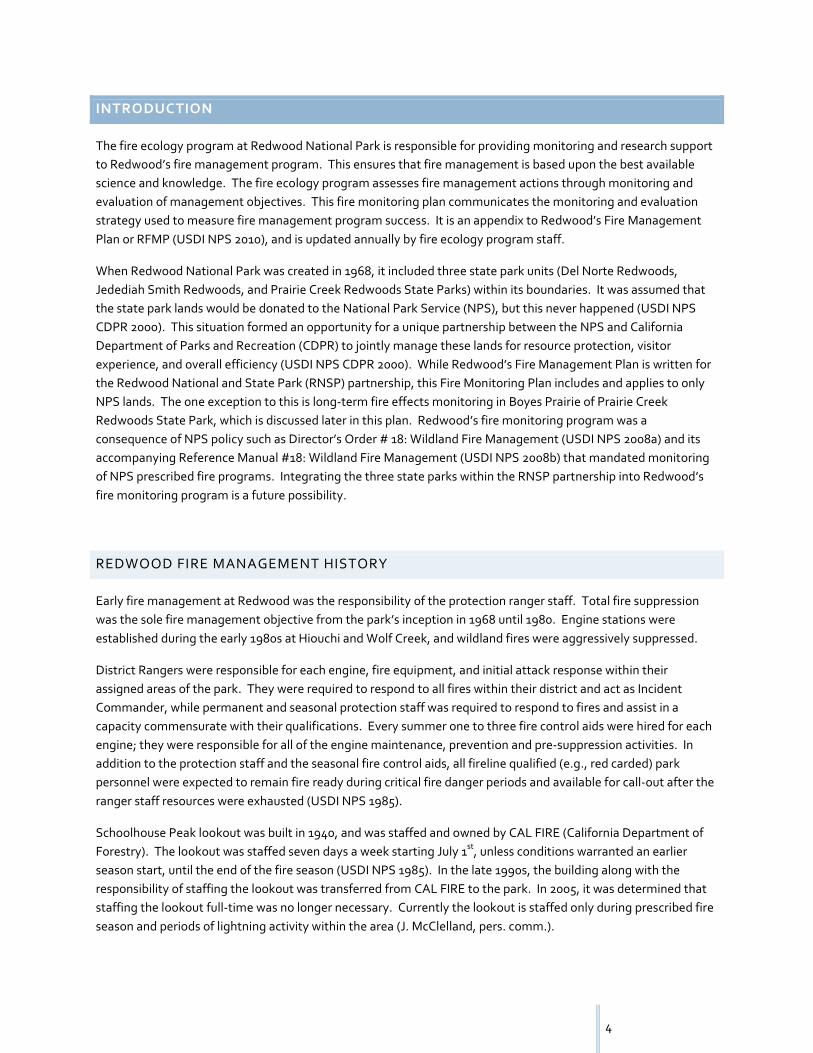
Figure 1. Northern segment of Redwood National and State Parks shown by Fire Management Unit (FMU).
6
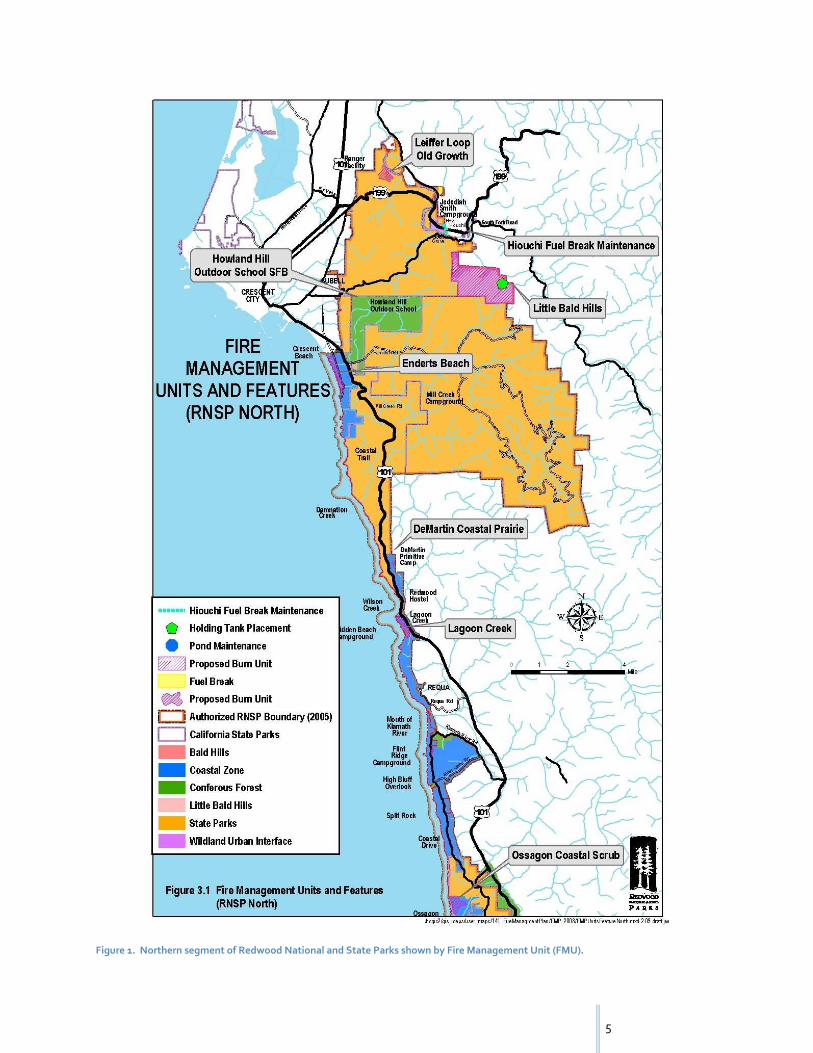
Figure 2. Southern segmnet of Redwood National and State Parks by FMU.
7
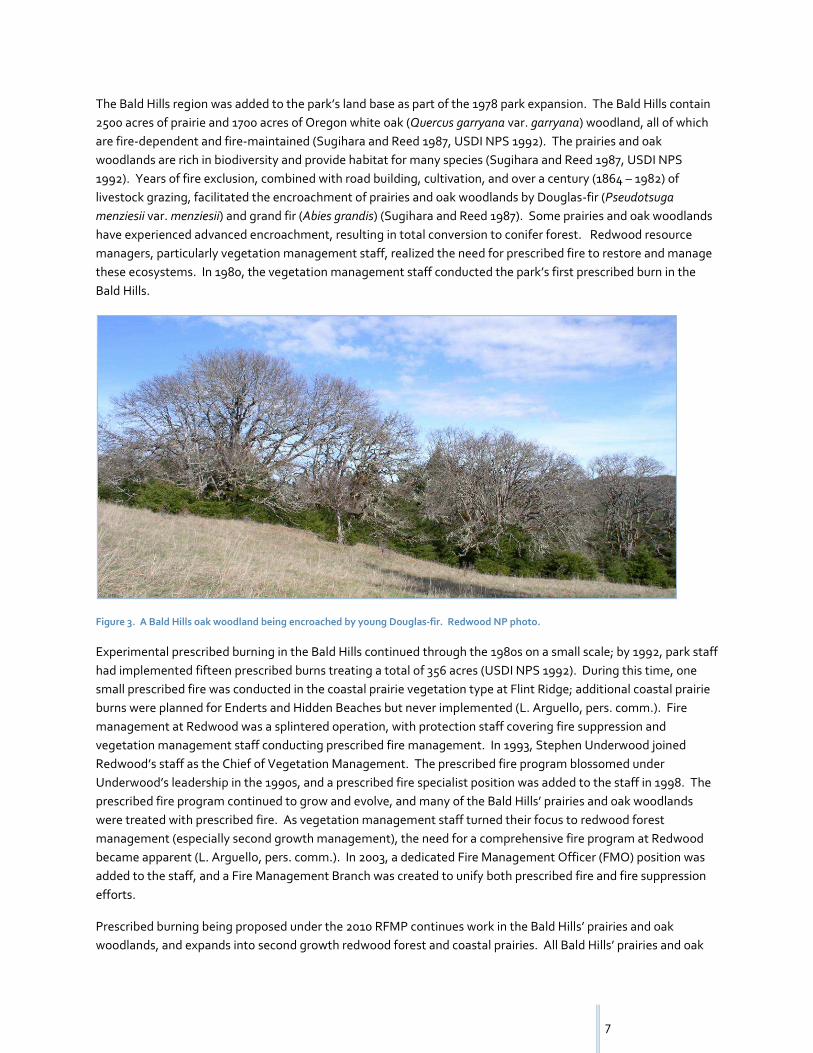
The Bald Hills region was added to the park’s land base as part of the 1978 park expansion. The Bald Hills contain
2500 acres of prairie and 1700 acres of Oregon white oak (Quercus garryana var. garryana) woodland, all of which
are fire-dependent and fire-maintained (Sugihara and Reed 1987, USDI NPS 1992). The prairies and oak
woodlands are rich in biodiversity and provide habitat for many species (Sugihara and Reed 1987, USDI NPS
1992). Years of fire exclusion, combined with road building, cultivation, and over a century (1864 – 1982) of
livestock grazing, facilitated the encroachment of prairies and oak woodlands by Douglas-fir (Pseudotsuga
menziesii var. menziesii) and grand fir (Abies grandis) (Sugihara and Reed 1987). Some prairies and oak woodlands
have experienced advanced encroachment, resulting in total conversion to conifer forest. Redwood resource
managers, particularly vegetation management staff, realized the need for prescribed fire to restore and manage
these ecosystems. In 1980, the vegetation management staff conducted the park’s first prescribed burn in the
Bald Hills.
Figure 3. A Bald Hills oak woodland being encroached by young Douglas-fir. Redwood NP photo.
Experimental prescribed burning in the Bald Hills continued through the 1980s on a small scale; by 1992, park staff
had implemented fifteen prescribed burns treating a total of 356 acres (USDI NPS 1992). During this time, one
small prescribed fire was conducted in the coastal prairie vegetation type at Flint Ridge; additional coastal prairie
burns were planned for Enderts and Hidden Beaches but never implemented (L. Arguello, pers. comm.). Fire
management at Redwood was a splintered operation, with protection staff covering fire suppression and
vegetation management staff conducting prescribed fire management. In 1993, Stephen Underwood joined
Redwood’s staff as the Chief of Vegetation Management. The prescribed fire program blossomed under
Underwood’s leadership in the 1990s, and a prescribed fire specialist position was added to the staff in 1998. The
prescribed fire program continued to grow and evolve, and many of the Bald Hills’ prairies and oak woodlands
were treated with prescribed fire. As vegetation management staff turned their focus to redwood forest
management (especially second growth management), the need for a comprehensive fire program at Redwood
became apparent (L. Arguello, pers. comm.). In 2003, a dedicated Fire Management Officer (FMO) position was
added to the staff, and a Fire Management Branch was created to unify both prescribed fire and fire suppression
efforts.
Prescribed burning being proposed under the 2010 RFMP continues work in the Bald Hills’ prairies and oak
woodlands, and expands into second growth redwood forest and coastal prairies. All Bald Hills’ prairies and oak
8
woodlands are contained within prescribed burn units and are set to burn on a 3 – 7 year rotation (USDI NPS
2005). Second growth units to be burned under the new plan are the C-10 (339 acres), Upper K&K (40 acres), and
Wildcat (1054 acres). The coastal prairie units of DeMartin Prairie (4.7 acres), Enderts (109 acres), Lagoon Creek
(68 acres), and Major Creek are slated to burn under the new RFMP.
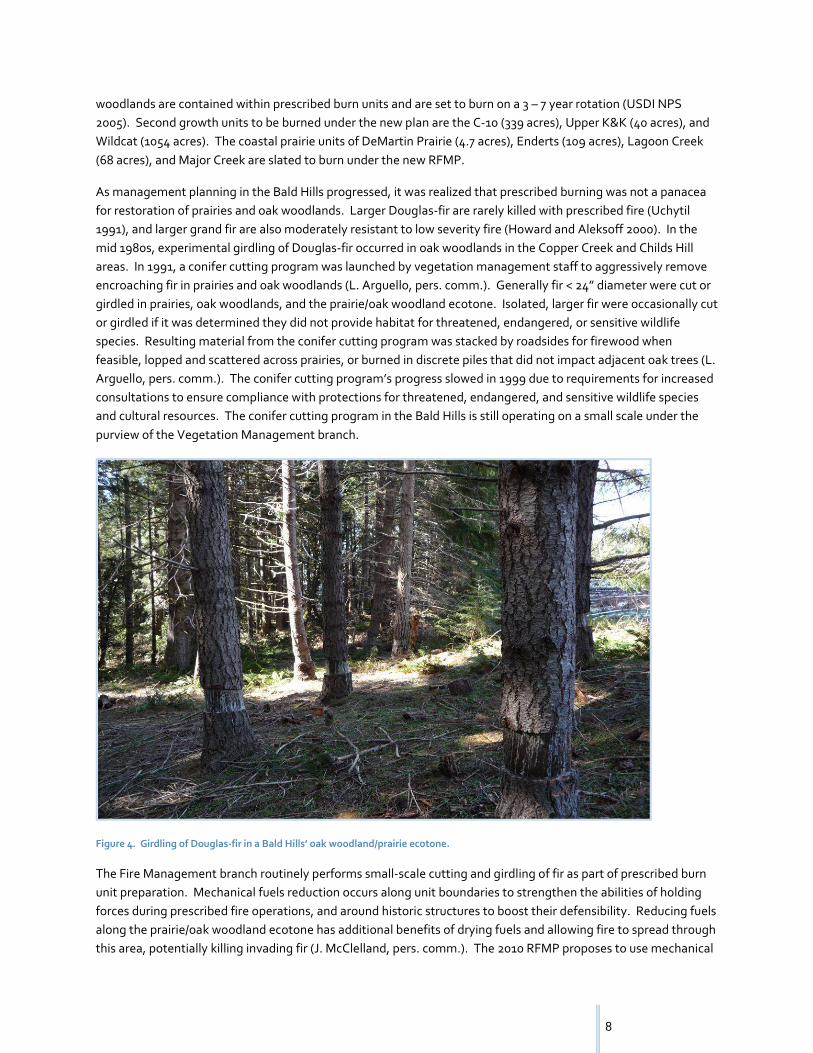
As management planning in the Bald Hills progressed, it was realized that prescribed burning was not a panacea
for restoration of prairies and oak woodlands. Larger Douglas-fir are rarely killed with prescribed fire (Uchytil
1991), and larger grand fir are also moderately resistant to low severity fire (Howard and Aleksoff 2000). In the
mid 1980s, experimental girdling of Douglas-fir occurred in oak woodlands in the Copper Creek and Childs Hill
areas. In 1991, a conifer cutting program was launched by vegetation management staff to aggressively remove
encroaching fir in prairies and oak woodlands (L. Arguello, pers. comm.). Generally fir < 24” diameter were cut or
girdled in prairies, oak woodlands, and the prairie/oak woodland ecotone. Isolated, larger fir were occasionally cut
or girdled if it was determined they did not provide habitat for threatened, endangered, or sensitive wildlife
species. Resulting material from the conifer cutting program was stacked by roadsides for firewood when
feasible, lopped and scattered across prairies, or burned in discrete piles that did not impact adjacent oak trees (L.
Arguello, pers. comm.). The conifer cutting program’s progress slowed in 1999 due to requirements for increased
consultations to ensure compliance with protections for threatened, endangered, and sensitive wildlife species
and cultural resources. The conifer cutting program in the Bald Hills is still operating on a small scale under the
purview of the Vegetation Management branch.
Figure 4. Girdling of Douglas-fir in a Bald Hills’ oak woodland/prairie ecotone.
The Fire Management branch routinely performs small-scale cutting and girdling of fir as part of prescribed burn
unit preparation. Mechanical fuels reduction occurs along unit boundaries to strengthen the abilities of holding
forces during prescribed fire operations, and around historic structures to boost their defensibility. Reducing fuels
along the prairie/oak woodland ecotone has additional benefits of drying fuels and allowing fire to spread through
this area, potentially killing invading fir (J. McClelland, pers. comm.). The 2010 RFMP proposes to use mechanical

9
thinning to create shaded fuel breaks along portions of park boundaries and around park structures to create
defensible space and facilitate control in case of wildfire.
Figure 5. Prescribed burn unit preparation in the Lower Elk Camp unit of the Bald Hills. Thinned materials are scattered across the
prairie edge, where many small fir are concentrated.
REDWOOD FIRE MONITORING HISTORY
The Bald Hills are the epicenter of Redwood’s prescribed fire program, and this is where fire effects monitoring
work has been concentrated. Early efforts in the Bald Hills to monitor the effects of prescribed fire upon oak
woodland and prairie vegetation were made by the vegetation management staff. In the early 1980s, four long-
term prairie monitoring sites (treatment and control) were established in Childs Hill, Elk Camp, Maneze, and
South Pasture prairies (USDI NPS 1992). All sites but Childs Hill had their control plots burned by wildfire, which
resulted in these monitoring sites being abandoned. The Childs Hill monitoring plots have been continuously
sampled and maintained by vegetation management staff since 1980. Four control and five treatment long-term
oak woodland monitoring sites were established in 1985 as part of Sugihara and Reed’s (1987) research; this
monitoring effort was abandoned in the late 1980s.
Beginning in 1990, Redwood implemented an official long-term fire effects monitoring program based on the
Western Region Fire Monitoring Handbook (1990b) protocols. The Western Region Fire Monitoring Handbook
morphed into the NPS Fire Monitoring Handbook (2003), and this continues to be Redwood’s standard
monitoring protocol. The Fire Monitoring Handbook (FMH) includes different levels of monitoring (Levels I – IV)
ranging from reconnaissance to long-term. FMH plots have been installed in the prairies and oak woodlands of
the Bald Hills, and on a small and experimental scale in old growth redwood forests.

10
In 2008, the fire ecology program inherited a set of long-term monitoring plots from vegetation management and
California State Park staff in Boyes Prairie of Prairie Creek Redwoods State Park. These plots were installed in the
1980s and have been continuously sampled over the years in concert with prescribed fire operations.
The evolution of staffing developments for the fire ecology program is best represented by a timeline:
1990 – 1992: Redwood’s fire effects monitoring program was staffed by two dedicated seasonal fire
effects monitors.
1993-1997: One of the seasonal fire effects monitor positions was converted to a permanent, subject-to-
furlough lead fire effects monitor position, and the fire effects crew expanded their duties to include
work at Lassen Volcanic National Park (LAVO), Lava Beds National Monument (LABE), and Whiskeytown
National Recreation Area (WHIS). The fire effects crew was known as the “Northern California Fire
Effects Monitoring Team.” Student Conservation Association (SCA) volunteers were placed at each park
(four total) to assist with field work and complete data entry.
1997: Two additional seasonal fire effects monitor positions were added in response to the expanding
workload.
1998: One permanent, subject-to-furlough assistant lead fire effects monitor position was added to the
crew, and Crater Lake National Park (CRLA) and Oregon Caves National Monument (ORCA) were added
to the crew’s responsibilities. The crew’s name changed to the Klamath-Cascades Fire Effects
Monitoring Team.
2000: One fire ecologist position was created and assigned to oversee the fire effects crew and take
responsibility for data management and analysis. This was the inception of the Klamath-Cascades fire
ecology program, consisting of the fire ecologist and the fire effects monitoring crew. The fire ecologist
position was originally located at Redwood, with responsibilities for all six NPS units (CRLA, LABE, LAVO,
ORCA, Redwood, and WHIS) in the Klamath Network (KLMN).
2000: The lead fire effects monitor position was converted to permanent full-time, and the crew
consisted of the lead fire effects monitor, the assistant lead fire effects monitor, two seasonal fire effects
monitors, and four SCA volunteers with responsibilities for fire effects monitoring work in the KLMN.
2001: The fire ecologist’s duty station moved to WHIS. The supervision of the fire effects crew was
transferred to Redwood’s Chief of Vegetation Management.
2001: The fire effects crew consisted of a permanent, full-time lead fire effects monitor, a permanent,
subject-to-furlough assistant lead fire effects monitor, three seasonal fire effects monitors, and one SCA
volunteer.
2002: The use of SCA volunteers ended. The fire effects crew consisted of a permanent, full-time lead
fire effects monitor, a permanent, subject-to-furlough assistant lead fire effects monitor, and four
seasonal fire effects monitors. The crew configuration remained this way until 2008.
2002: An additional fire ecologist position (“Southern Cascades” fire ecologist) was created for the
KLMN, based at CRLA and also covering LAVO and LABE. The “Klamath” fire ecologist continued to be
responsible for work at Redwood, WHIS, and ORCA.
2003: A Fire Management Officer position was created for Redwood, and the supervision of the fire
effects monitoring crew was transferred to this position.
2007: The Klamath fire ecologist’s duty station returned to Redwood. This position regained the
supervisory responsibilities for the fire effects crew.
2008: The Klamath-Cascades fire effects crew split into two crews (“Klamath” and “Southern Cascades”),
working under the respective fire ecologists. Currently the Klamath fire ecology program consists of a
fire ecologist, a permanent, full-time lead fire effects monitor and two seasonal fire effects monitors,
11
with responsibilities at Redwood, WHIS, and ORCA. The Southern Cascades fire ecology program
consists of a fire ecologist, a permanent, subject-to-furlough lead fire effects monitor, and two seasonal
fire effects monitors, with responsibilities at CRLA, LABE, and LAVO.
Redwood’s long-term fire effects monitoring plot network consists of 26 FMH oak woodland plots, 37 FMH prairie
plots, four FMH old growth redwood plots, and seven Boyes Prairie plots. Due to the workload issues faced by
fire effects crews of the past, the decision was made in 1998 to reduce the number of oak woodland plots to 14
and the number of prairie plots to 18 (USDI NPS 1998). The excess plots were deemed “inactive” and were
maintained as such. This workload reduction also eliminated one recommended FMH plot sampling event: the
one year postburn visit. The crew split alleviated some workload issues, and in 2008, the “inactive” plots were re-
activated after they were determined necessary for meeting minimum plot numbers for detecting change.
Additional monitoring has occurred, but it has been short-term and experimental in nature, and focused on
measuring mortality of encroaching fir (both Douglas-fir and grand fir) in prairies and oak woodlands of the Bald
Hills. The first attempt at monitoring fir encroachment utilized “Ecotone” plots and was implemented in 1999.
This effort was abandoned in 2001, and no monitoring of prescribed fire induced mortality of encroaching fir
occurred until 2008. A short-term monitoring protocol (“Fir Plots”) is currently in place. This protocol is simple in
nature and monitors fire management objectives from preburn to two years postburn. The current protocol is
summarized in Appendix H. Currently 34 “Fir Plots” exist in the Bald Hills.
Limited monitoring of mechanical treatments has occurred. Two monitoring sites were established in 1985 by
vegetation management staff to monitor vegetation recovery in areas of Douglas-fir removal; however, this
monitoring effort was abandoned in the late 1980s. No monitoring of the conifer cutting program has been
conducted by vegetation management staff. To date, the fire ecology program has not monitored any
mechanical treatments performed by fire management staff. As mechanical treatments proposed under the 2010
RFMP are applied to park landscapes, monitoring will be conducted by the fire ecology program.
As Redwood’s fire management program moves into treating second growth redwood (Sequoia sempervirens)
forests, serpentine grasslands and Jeffrey pine (Pinus jeffreyii) woodlands of the Little Bald Hills, coastal prairies,
and eventually old growth redwood forests with prescribed fire, additional monitoring protocols will be developed
and implemented as appropriate. Some of these monitoring protocols will be designed at the project-level
(especially for second growth forest burns) where burn prescriptions and fire management objectives are tailored
to meet site-specific conditions. If existing NPS fire ecology protocols are not used to monitor management
objectives, regional approval will be sought for the protocols used, as per direction in Wildland Fire Management:
Reference Manual #18 (2008b).
FIRE & FUELS MANAGEMENT
One of the functions of the fire ecology program is to measure fire management objectives expressed as
programmatic objectives for prescribed fire and mechanical treatment in the RFMP. The programmatic
objectives are fine-tuned in individual prescribed burn plans and tailored to achieve site- and ecosystem-specific
management strategies. Fire management objectives have their origins in park planning documents such as the
Bald Hills Vegetation Management Plan (1992) or BHVMP, Redwood’s Resource Management Plan or RRMP
(USDI NPS 1994), and the Redwood National and State Park General Management Plan/General Plan or RNSP
GMP/GP (USDI NPS CDPR 2000). The goals stated in park planning documents are provided below to illustrate

12
how fire management objectives are tiered from and closely related to the overall vision for managing park
ecosystems.
The RNSP GMP/GP outlines the overall strategy for managing the parks’ natural and cultural resources. Those
pertinent to the fire management program are listed here:
Recognize the past and present existence of peoples in the region and the traces of their use as an
important part of the environment to be preserved and interpreted
Ensure that all resource management efforts are consistent with and supportive of the perpetuation of
the redwood forest ecosystem as the prime resource of the parks
Restore and maintain the RNSP ecosystems as they would have evolved without human influences since
1850 and perpetuate ongoing natural processes
Cooperate with the timber industry, private landowners, and other government agencies to accomplish
long-range resource management planning and reduce threats to RNSP resources
Acquire and analyze baseline inventory data to determine the nature and status of the natural resources
under RNSP stewardship
Monitor selected resources and environmental factors to detect change and to distinguish natural
variation from local and bioregional human-induced resource threats
The recognition of fire as a critical process for sustaining ecosystem health is not explicitly stated in the RNSP
GMP/GP, but it is singled out as an important natural resource management objective in the RRMP. The RRMP
expresses the following resource management objectives that relate to the fire management program:
Restore and/or maintain the natural ecosystems of the park
Continue with biological and physical restoration of park lands severely impacted by past land use
practices
Evaluate the changing influence of natural fire on park resources and cooperate with other agencies and
landowners in the implementation of the fire management plan and the use of prescribed fire to restore
natural fire effects to park ecosystems
Minimize the impacts on park resources resulting from current human activity outside the park
Preserve the prehistoric, historic, and contemporary traditional features that trace human use of the
redwood region
Develop basic resource information about the park’s cultural resources and manage them in a manner
consistent with the natural values for which the park was established
The goals of the fire management program as stated in the RFMP are tiered from the foundation laid in the RNSP
GMP/GP and RRMP:
Ensure firefighter and public safety are the highest priorities in every fire management action
Protect the public, private property, and the natural and cultural resources of the park utilizing strategies
and tactics commensurate with the values at risk
Use fire as a management tool to meet resource objectives where deemed appropriate and identified risk
is both manageable and acceptable
Manage wildland fire complexes in order to protect resources at risk and minimize unacceptable impacts
from fire
Cooperate with adjacent landowners and land management agencies in the full range of fire
management activities, respecting the jurisdiction, interests, and legal mandates of each participant
Increase the understanding of the role and function of fire in the parks

13
Restore fire as an ecosystem process in the parks’ biotic communities to the fullest extent practical
Programmatic objectives for Redwood’s prescribed fire program are listed in the RFMP and consist of the
following:
Returning fire as an ecological process within the park
Improving, or at a minimum maintaining, the native plant species within RNSP
Reducing the conifer encroachment within the grasslands and woodlands within the park
As stated in the RFMP, the programmatic objectives for mechanical thinning conducted by Redwood’s fire
management program will be modified for each project unit but will generally achieve the following:
Retain larger trees (dominant and co-dominant tree species > 18” diameter at breast height or DBH)
Remove tree limbs up to a set height to reduce ladder fuels
Cut shrub species when present
Remove intermediate and suppressed trees (< 18” DBH)
The programmatic objectives for the use of prescribed fire and mechanical thinning by the fire management
program support overall park management goals and objectives for the judicious use of fire in maintaining and
restoring park ecosystems.
ECOLOGY & LANDSCAPE MANAGEMENT
Redwood NP contains a diverse array of ecosystems, each adapted to a suite of natural processes that have
shaped them for millennia. Fire is one such process, and defining its contemporary role can be convoluted and
complicated. The historic (defined here as pre- EuroAmerican settlement) role of fire differs among park
ecosystems, and its contemporary role can vary even within individual park vegetation communities based on
factors such as elevation, slope, aspect, fog regime, species composition, historic Native American ignition
patterns, and past land use. Most terrestrial park ecosystems have been affected by fire exclusion, which has
altered them to varying degrees. Additional anthropogenic disturbances such as logging, livestock grazing,
introduction of invasive organisms and pathogens, and climate change have caused and are causing drastic
changes in ecosystem structure, function, and composition. Given the inherent complexity of ecosystem
management and restoration, it is helpful to comprehend the task at hand by first creating ecological models.
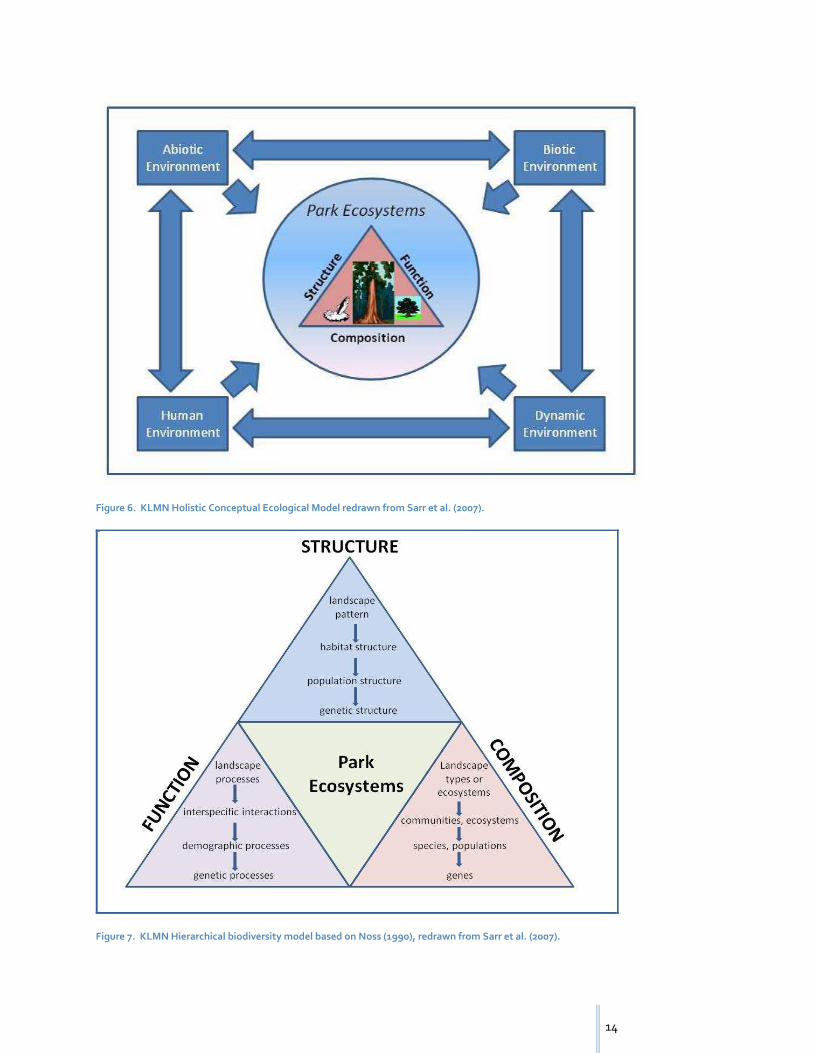
The KLMN Inventory and Monitoring Program has developed multiple versions of ecological models that apply to
parks within their network. The overarching model is called the Holistic Conceptual Model of Influences on
Klamath Park Ecosystems (Sarr et al. 2007), and is represented by Figure 3 with slight modifications for purposes
of this plan. The Holistic Conceptual model synthesizes all influences on park ecosystems into four categories:
abiotic, biotic, dynamic, and human; and illustrates how the influences interact with park ecosystems and each
other. The KLMN also uses a hierarchical biodiversity model created by Noss (1990); this is depicted in Figure 4.
The Noss model defines ecosystems by their structural, functional, and compositional attributes and incorporates
scale into this characterization. Despite the complexity involved in synthesizing this information into a coherent
fire management strategy, the park has distilled its management concerns into a few key variables that it actively
manages and monitors (Figure 5).
14
Figure 6. KLMN Holistic Conceptual Ecological Model redrawn from Sarr et al. (2007).
Figure 7. KLMN Hierarchical biodiversity model based on Noss (1990), redrawn from Sarr et al. (2007).

15
Figure 8. An ecosystem model depicting fire and resource management features and concerns at Redwood. Symbols courtesy of the
Integration and Application Network (ian.umces.edu/symbols/), University of Maryland Center for Environmental Science.
The Redwood Fire Management Plan Environmental Assessment (2010b) discusses the vegetation communities,
cultural resources, special-status species, and other issues that need to be considered when making fire and
resource management decisions. The Affected Environment (pp. 34-67) and Environmental Consequences (pp.
68-143) sections provide a foundation for how park ecosystems have evolved with fire, and describes their
resiliency and resistance to fire. That discussion is expanded upon here for the vegetation communities that are
scheduled for treatment with prescribed fire under the RFMP.
THE BALD HILLS
Redwood’s Bald Hills region encompasses 4200 acres of prairie and Oregon white oak woodland along the eastern
edge of the lower Redwood Creek drainage. Interspersed among and adjacent to the oak woodland and prairie
include old growth redwood forests; second growth forests of redwood and Douglas-fir; and mixed evergreen-
hardwood forests of Douglas-fir, tan oak (Lithocarpus densiflorus var. densiflorus), California bay (Umbellularia
californica), and Pacific madrone (Arbutus menziesii). Oak woodlands and prairies have experienced varying
degrees of encroachment by Douglas-fir and grand fir; grand fir affects areas along the lower slopes of Redwood

16
Creek that are closer to the ocean and receive much fog. The Bald Hills region supports a large diversity of plant
and animal species including two amphibian species, five reptile species, 34 mammal species, 64 bird species, 231
plant species recorded in the oak woodlands, and 284 plant species recorded in the prairies (USDI NPS 1992). The
oak woodlands are dominated by Oregon white oak, with occasional black oak (Quercus kelloggii), Douglas- and
grand fir, tanoak, and Pacific madrone. Their understory consists of native and non-native annual and perennial
grasses and forbs, with occasional shrubs present. Common understory vegetation in the oak woodlands includes
blue wildrye (Elymus glaucus), tall oatgrass (Arrhenatherum elatius), hedgehog dogtail (Cynosurus echinatus),
California brome (Bromus californicus), vetch (Vicia spp.), bedstraw (Galium spp.), and Torilis (Torilis arvensis). The
prairies are dominated by native and non-native annual and perennial grasses and forbs including tall oatgrass,
hedgehog dogtail, sweet vernal grass (Anthoxanthum odoratum), California oatgrass (Danthonia californica),
orchard grass (Dactylis glomerata), sedge (Carex tumulicola), cat’s-ear (Hypochaeris spp.), and sheep sorrel (Rumex
acetosella).
The Bald Hills region was occupied by Native Americans for at least 6000 years prior to their removal in 1864
(Benson 1983, Bickel 1979, and Hayes 1985 in Sugihara and Reed 1987). The 1850s were the beginning of the Bald
Hills’ ranching era, which was characterized by sheep and cattle grazing, introduction of non-native pasture
grasses, cultivation of cereal grains and crops, and selective timber harvest (USDI NPS 1992). Beginning in the
1940s, old growth redwood and Douglas-fir were commercially logged; this resulted in the construction of roads
and skid trails (USDI NPS 1992). The Bald Hills region was added to Redwood’s land base during the 1978 park
expansion; the 2300 acre Coyote Creek (Morganroth/McKee property) addition was acquired in 1991.
The prairies and oak woodlands are fire-maintained; they become choked by encroaching woody species,
especially Douglas-fir and grand fir, in the absence of fire (Sugihara and Reed 1987). The lightning regime of
coastal Northwestern California consists of few starts in the summer months, and Native Americans are widely
considered to be the primary ignition source in this area (Stuart and Stephens 2006). Fire was one of the most
important tools used by Native Americans to manage their environment. They burned for many reasons,
including facilitating travel; improving the quality and quantity of plants used for food, medicine and materials;
driving animals for hunting; enhancing defense and visibility; and preventing catastrophic fire (Anderson 2005,
Sawyer 2006). With the absence of fire, woody species (especially Douglas-fir) become established in the prairies
and oak woodlands. As canopies of encroaching species close, much herbaceous diversity and wildlife habitat is
lost (Sugihara and Reed 1987).
Native Americans regularly and frequently applied fire to the Bald Hills, perhaps as often as every one to two
years (Sugihara and Reed 1987). Much is unknown about the timing, placement, specific purpose, and rotation of
Native American ignitions, but research (Arguello 1994) has supported fall burning for promoting native plants in
the Bald Hills. The current strategy for burning the Bald Hills is on a 3 – 7 year rotation from August – December.
Burn units are classified into “early” and “late” units, depending on whether they are burned prior to or after the
arrival of fall rains. “Early” burn units contain fireline, mowline, or roads along the entire perimeter to keep the
fire contained. “Late” burn units combine human-made fire control lines with forest edge to contain the fire to
the lighter, grass-dominated fuels of the prairies and oak woodlands. The forest edge serves as a natural fire
barrier due to heavier fuels and closed canopy conditions that hinder fuel moisture loss.
Livestock grazing, cultivation, road building, and timber harvest have facilitated the introduction of many non-
native plant species to the Bald Hills, including highly invasive species such as Scotch broom (Cytisus scoparius),
Himalayan blackberry (Rubus discolor), tall oatgrass, and Harding grass (Phalaris aquatica). Redwood fire and
resource managers are concerned not only with the restoration of fire as an ecosystem process, but also with
maintaining the integrity of native plant species that comprise park vegetation communities. Disturbances such
17
as fire can promote and facilitate the spread and dispersal of non-native plants, and in some situations exacerbate
the balance between native and non-native plant species (Agee 1996, Tveten and Fonda 1999, Maret and Wilson
2000, Wilson et al. 2004, Maret and Wilson 2005).
Two threatened species, the northern spotted owl (Strix occidentalis caurina) and the marbled murrelet
(Brachyramphus marmoratus), and one candidate species for listing, the Pacific fisher (Martes pennanti) are found
in old growth forests within the Bald Hills region. Protections for these species affect preparation and ignition of
prescribed fire units that contain, adjoin, or are within 500’ of threatened and endangered species habitat. These
protections limit the use of mechanized equipment and prescribed fire ignitions to outside the nesting, denning,
and breeding period of February 1 – September 15, unless immediately adjacent to a well-traveled road (Bensen
2009). This period may be adjusted based on recent wildlife survey findings. Protections for migratory bird
nesting habitat are also considered when preparing prescribed fire units for treatment. These include limiting the
cutting of brush to outside the May 31 - July 31 nesting window. Additionally, large snags (> 36” DBH) and large
downed logs (>36” diameter on long end and > 10’ long) are retained when possible during prescribed fire
operations to protect mammal, bat, and cavity nesting bird habitat.
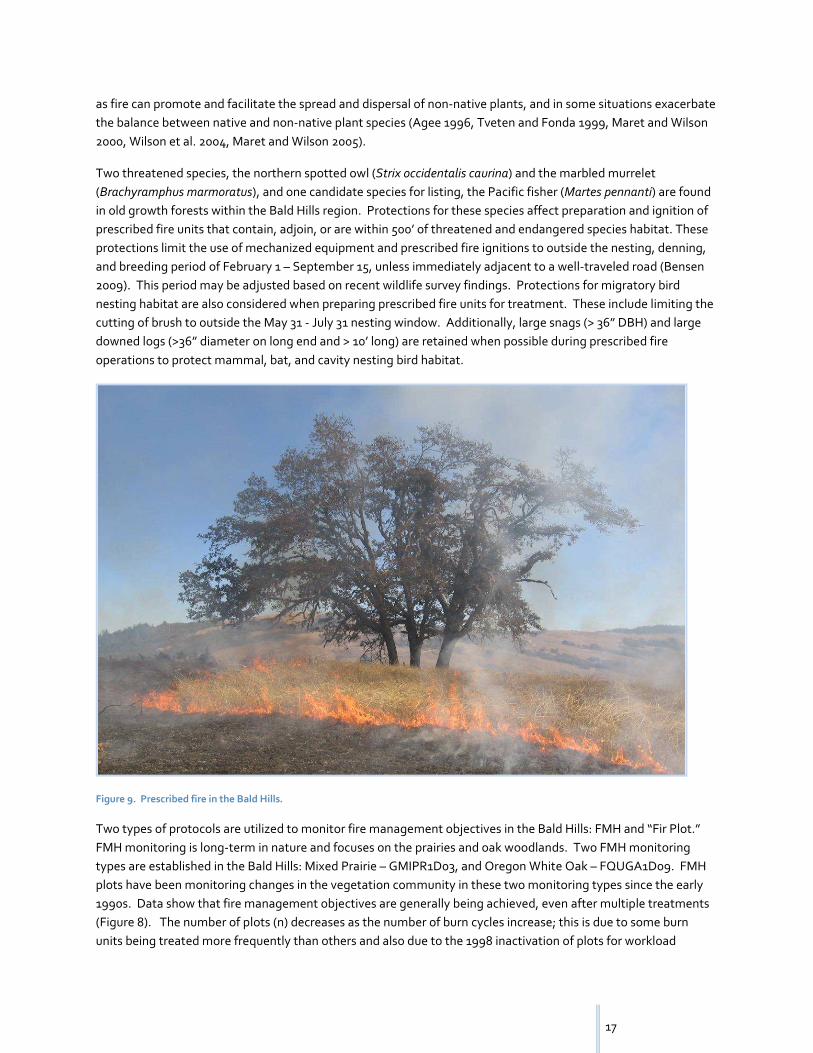
Figure 9. Prescribed fire in the Bald Hills.
Two types of protocols are utilized to monitor fire management objectives in the Bald Hills: FMH and “Fir Plot.”
FMH monitoring is long-term in nature and focuses on the prairies and oak woodlands. Two FMH monitoring
types are established in the Bald Hills: Mixed Prairie – GMIPR1D03, and Oregon White Oak – FQUGA1D09. FMH
plots have been monitoring changes in the vegetation community in these two monitoring types since the early
1990s. Data show that fire management objectives are generally being achieved, even after multiple treatments
(Figure 8). The number of plots (n) decreases as the number of burn cycles increase; this is due to some burn
units being treated more frequently than others and also due to the 1998 inactivation of plots for workload
18
management. As time passes and all units are treated multiple times with prescribed fire and re-activated plots
are sampled, plot numbers should equalize among burn cycles.
Fire Management Objective FQUGA1D09 – Change in native plant
relative cover from original preburn
conditions
GMIPR1D03 – Change in native plant
relative cover from original preburn
conditions
Do not reduce the relative
cover of native plants by
≥ 10% two years postburn as
measured from original
preburn conditions
01YR02 (n = 17): +0.4%
02YR02 (n = 8): +5.1%
03YR02 (n = 7): +2.2%
04YR02 (n = 4): -6.5%
01YR02 (n = 27): +11.6%
02YR02 (n = 16): +5.6%
03YR02 (n = 13): +26.0%
04YR02 (n = 5): -0.2%
05YR02 (n = 2): +21.0%
Table 1. Fire management objective vs. FMH plot results for oak woodland (FQUGA1D09) and mixed prairie (GMIPR1D03) monitoring
types. 01YR02 indicates two years after the first prescribed burn; 02YR02 means two years after the second prescribed burn; etc.
Fir Plots measure prescribed fire-induced mortality on small (< 3’ tall) encroaching fir in prairies and oak
woodlands. The protocol was implemented in 2008, and preliminary results suggest that fire management
objectives are close to being achieved (Figure 7); additional plots are needed for a complete assessment. Fir Plot
monitoring is short-term in nature, spanning from preburn to two years postburn. To date, 34 Fir Plots have been
installed in three monitoring types: 16 plots in open prairie (5 have burned), 13 plots in “early” oak woodland units
(5 have burned), and 5 plots in “late” oak woodland units (1 has burned). Fir Plots will be accompanied by an
upcoming landscape-level assessment of fire and vegetation management success at meeting management
targets for the Bald Hills established in the BHVMP.
Fire Management Objective Change in live fir (< 3’ tall) density immediately after the burn
from preburn conditions
In open prairie, reduce density of
live fir, < 3’ tall, by ≥ 80% within two
years of the burn
01 POST (n = 5): -76%
In “early” oak woodland units,
reduce density of live fir, < 3’ tall, by
≥ 70% within two years of the burn
01POST (n = 5): -66%
In “late” oak woodland units,
reduce density of live fir, < 3’ tall, by
≥ 50% within two years of the burn
01POST (n = 1): -100%
Table 2. Fire management objectives vs. Fir Plot monitoring results for prairie, "early" oak woodland, and "late" oak woodland
monitoring types. 01POST indicates plots were sampled immediately (within 2 weeks - 2 months of the burn) postburn.
Reference conditions exist for the Bald Hills and are summarized in Sugihara and Reed (1987) and the BHVMP.
These reference conditions are spatial (mapped in 1983) and delineate the extent of prairie and oak woodland as
they existed in 1850. The BHVMP classifies the prairies and oak woodlands into four categories:
1. Little Encroachment: Fir exist as seedlings or large individuals
2. Moderate Encroachment: Fir exist as dense thickets of saplings; fir occupy a subcanopy position in the
oak woodlands
3. Heavy Encroachment: Prairie has been usurped by fir; fir is co-dominant with the oaks
4. Advanced Conversion to Conifer Forest: prairie is lost; fir is the dominant species in the oak woodland
canopy and oaks are dead

19
Under the BHVMP, no action is proposed for Category 4 prairies and oak woodlands. Category 1 areas are
maintained with prescribed fire on a regular frequency (every 5 – 10 years in the BHVMP; this has since been
truncated to 3 – 7 years) with selected fir removal. Category 2 areas are regularly prescribed burned and treated
by the conifer cutting program. Category 3 areas are first treated by the conifer cutting program, and then
followed up with regular prescribed burning. Desired future conditions as expressed in the BHVMP are to restore
Category 1 – 3 prairies and oak woodlands and maintain them with prescribed fire and conifer cutting. The
previously mentioned landscape assessment will measure management success and progress with meeting this
target.
COASTAL PRAIRIES
Coastal prairies are open areas dominated by perennial grasses and forbs in close proximity to the ocean. The
coastal prairies may harbor the greatest plant diversity of any grassland in North America (Stromberg et al. 2001
in Stuart and Stephens 2006). The historic coastal prairie extent is thought to be created and maintained by
Native American fire use (Veirs 1987). Coastal prairies are diminishing in size due to encroachment by woody
species and are considered to be rare and endangered (Ford and Hayes 2007). In the absence of fire, coastal
prairies are lost via succession to shrubland then forest dominated by species such as Sitka spruce (Picea
sitchensis) and red alder (Alnus rubra) (Nuckols 2002).
Figure 10. Typical coastal prairie vegetation. Redwood NP photo.

20
Lightning-caused ignitions in and near the coastal prairies are rare (Kay 2007, van Wagtendonk and Cayan 2008).
Native American population density along the coast was high (Sawyer 2006, Kay 2007), and coastal prairies were
shaped by frequent Native American ignitions (Lewis 1973, Heady et al. 1977, Veirs 1987, Keeley 2002, Zobel 2002,
Anderson 2005, Kay 2007). The frequency and timing of coastal prairie burning is unknown, although regional
historic accounts indicate burning occurred during the fall and fairly often, perhaps even annually (Veirs 1987).
Coastal prairies are extremely productive grasslands, and early settlers capitalized on this by subjecting them to
livestock grazing (Ford and Hayes 2007). Early accounts describe coastal prairies as dominated by native
perennial grasses; today coastal prairies are heavily impacted by non-native plant species (Ford and Hayes 2007).
The 2010 RFMP proposes to burn four coastal prairie units, DeMartin (4.7 acres), Enderts (109 acres), Lagoon
Creek (68 acres) and Major Creek (7 acres). No fire effects monitoring of the coastal prairies has occurred to date,
although vegetation management staff installed 80 long-term monitoring plots at DeMartin prairie in 1982.
These plots were last sampled in 1989 and may be difficult to relocate, especially since additional prairie has
experienced encroachment since 1989. Reference conditions and desired future conditions have not yet been
defined for the coastal prairies. Only one prescribed burn (1980) has been conducted within Redwood’s coastal
prairies. After this burn, cover of the dominant preburn species, orchard grass, was reduced, while cover of hairy
cat’s ear (Hypochaeris radicata) and lupine (Lupinus spp.) increased (USDI NPS 1995). After the burn, cover of
pioneering non-native plant species increased, but then decreased over time as preburn vegetation recovered
(USDI NPS 1995).
The Enderts prescribed fire unit may harbor the threatened Oregon silverspot butterfly (Speyeria zerene
hippolyta). It has not been detected in the park to date, but it will be surveyed for prior to ignition (Bensen 2009).
LITTLE BALD HILLS
The Little Bald Hills (LBH) comprise approximately 1500 acres in the northeast corner of the park. The LBH are
underlain by two unique soil assemblages: one of ultramafic origin (derived from serpentine, peridotite, and
dunite parent materials), and one sedimentary soil high in clay and containing a shallow hardpan (Goforth and
Veirs 1989). The ultramafic, or serpentine, soils are high in some elements considered toxic for plant life such as
nickel, chromium, and magnesium, and contain low amounts of essential plant nutrients such as nitrogen,
calcium, potassium, and phosphorus (Goforth and Veirs 1989, Harrison et al. 2004, Harrison et al. 2006). This
combination of soil types results in a diverse suite of vegetation able to tolerate harsh growing conditions.
Serpentine soils have been recognized as harboring a high amount of endemism by and diversity of native plants
(Whittaker 1960, Goforth and Veirs 1989, Harrison et al. 2006a, 2006b). Twenty one plant species considered to
be rare or uncommon by the California Native Plant Society are found within the LBH, primarily within the Jeffrey
pine woodland.
Redwood’s LBH are a matrix of Jeffrey pine woodland; knobcone pine (Pinus attenuata) woodland;
chaparral/pygmy forest; Douglas-fir forest; Douglas-fir/Port Orford cedar (Chamaecyparis lawsoniana) forest; and
Douglas-fir, redwood, and western hemlock (Tsuga heterophylla) forest (Goforth and Veirs 1989). Vegetation
community descriptions are summarized from Goforth and Veirs (1989). The Jeffrey pine woodland comprises
360 acres and contains an abundant herbaceous understory dominated by Idaho fescue (Festuca idahoensis).
Knobcone pine woodland has a shrub understory of primarily huckleberry oak (Quercus vaccinifolia) and tan oak
21
(Lithocarpus densiflorus var. echinoides). Chaparral occupies the sedimentary soils and consists of chinquapin
(Chrysolepis chrysophylla var. minor), manzanita (Arctostaphylos columbiana and A. viscida), evergreen huckleberry
(Vaccinium ovatum), rhododendron (Rhododendron macrophyllum), and salal (Gaultheria shallon) with diminutive
Douglas-fir and knobcone pine trees interspersed within the shrubs. The Douglas-fir dominated forests are
believed to exist on deeper serpentine soils with greater moisture-holding capacities (Goforth and Veirs 1989).
The fire history of the LBH is unknown beyond a large fire recorded in 1940 affecting knobcone pine woodland. A
research project is underway that is investigating stand dynamics and fire history within the Jeffrey pine and
knobcone pine woodlands of the LBH. Jeffrey pine woodlands are being encroached by Douglas-fir, which is due
to fire exclusion (Goforth and Veirs 1989). Throughout its range, Jeffrey pine has been shown to decline without
fire as it is replaced by more shade-tolerant and closed canopy creating species (Gucker 2007). Jeffrey pine is a
fire-adapted species able to withstand or resist most fires due to its thick bark, self-pruning crown, protective bud
scales, and mineral soil/high light requirements for seedling germination (Gucker 2007). Knobcone pine is also a
fire-adapted species, but where Jeffrey pine adopts a “resister” life history strategy to survive low to medium
intensity fires, knobcone pine shows an “evader” life history strategy to ensure it remains on site after fire (Agee
1993). Knobcone pine’s fire “evading” adaptation is bearing serotinous cones that are sealed by resin and open
only after exposure to heat (Howard 1992). Knobcone pine’s regeneration requirements mirror the postfire
environment, with abundant mineral soil and high light conditions necessary for seedling germination (Howard
1992). Knobcone pines are easily killed by even low-intensity fires due to their thin bark (Howard 1992). Fire
maintains the knobcone pine woodlands within the LBH, and without recurring fire, the species could not persist
(Goforth and Veirs 1989).
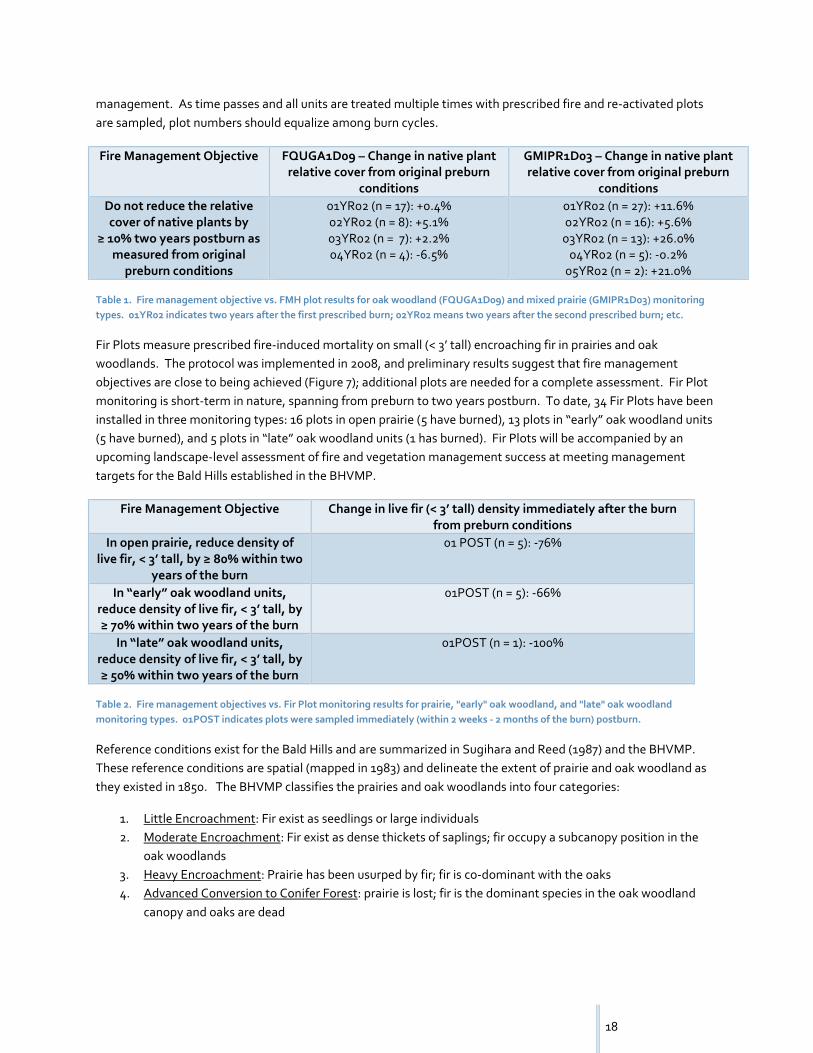
Figure 11. 2007 experimental prescribed burn in the Little Bald Hills’ Jeffrey pine woodland.

22
One species of concern, the Mardon skipper (Polites mardon), is found within the Jeffrey pine woodlands and
grasslands of the LBH. The Mardon skipper is a candidate for listing as a federally threatened or endangered
species. Prescribed fire planning in the LBH involves Redwood’s Fish & Wildlife staff to ensure that burn timing,
size, frequency, and rotation are adequate for sustaining Mardon skipper populations. The size of a single burn in
one calendar year within Mardon skipper habitat will be limited to 50 acres to ensure population viability (Bensen
2009). Prescribed fire will enhance and potentially expand Mardon skipper habitat by killing small fir encroaching
upon Jeffrey pine woodlands and grasslands.
Only one small prescribed burn has been conducted in the LBH; this occurred in 2007 and treated three acres
within the Jeffrey pine woodland. Reference conditions and desired future conditions for the LBH have not yet
been developed. No fire effects monitoring has occurred in the LBH to date; although vegetation management
has installed 270 monitoring plots in the LBH that were last sampled in 1984.
SECOND GROWTH FOREST
Almost 50,000 acres of old-growth redwood forest were logged between 1950 and 1978 in what is now Redwood
National Park (USDI NPS 2008c). Stand development and recovery in these logged areas have taken many
different trajectories based on the old growth stand composition, timber harvest techniques used (clearcutting vs.
selective harvest), the type of equipment used to harvest trees, site characteristics (slope, aspect, elevation, soil
type), and the reforestation technique used (aerial seeding, planting), if any (USDI NPS 2008c). Some of
Redwood’s second growth stands are in severe need of management, as many have little redwood dominance,
very high stand densities, small diameters in relation to height, depauperate understories, and even tree canopies
with very little diversity (USDI NPS 2008c).
Thinning is the primary means for restoring Redwood’s second growth forests. Another tool for managing second
growth redwood forests is prescribed fire. This has been used on a small scale within the park in recent years. The
17 acre D-A second growth prescribed burn unit was treated in 2007. Vegetation management staff installed 21
monitoring plots before the fire, and these plots were sampled one year postburn in 2008. Plot data indicate that
large overstory trees (> 20 cm DBH) experienced a 3.6% reduction in density (from 577 trees/ha to 556 trees/ha)
and a 2.1% reduction in basal area (from 67.9 m2/ha to 66.5 m
2/ha) one year postburn. Smaller trees (< 20 cm
DBH) experienced a 54.8% reduction in density (from 1052 trees/ha to 476 trees/ha) and a 22.4% reduction in
basal area (from 8.5 m2/ha to 6.6 m
2/ha) one year postburn. These results suggest that prescribed fire can be a
very effective tool for causing mortality to smaller-diameter trees while favoring the retention of larger diameter
trees, which is in line with management efforts to promote the development of old-growth forest characteristics
in these stands.
No fire effects monitoring has occurred in second growth forests to date. In addition to the D-A plots, vegetation
management staff manages 8 long-term monitoring plots in the Dolason Trailhead area that were treated with
prescribed fire in 2003. Desired future conditions will be developed for each project unit due to the varied nature
of second growth stands, and monitoring will be designed at the project level rather than developing a
comprehensive second growth forest monitoring type. The 2010 RFMP proposes to burn three second growth
units, the Upper K & K (40 acres), Wildcat (1054 acres), and the C-10 (339 acres). Burn severity data will be
requested for the C-10 and Wildcat projects through the NPS-USGS Burn Severity Mapping program.
23
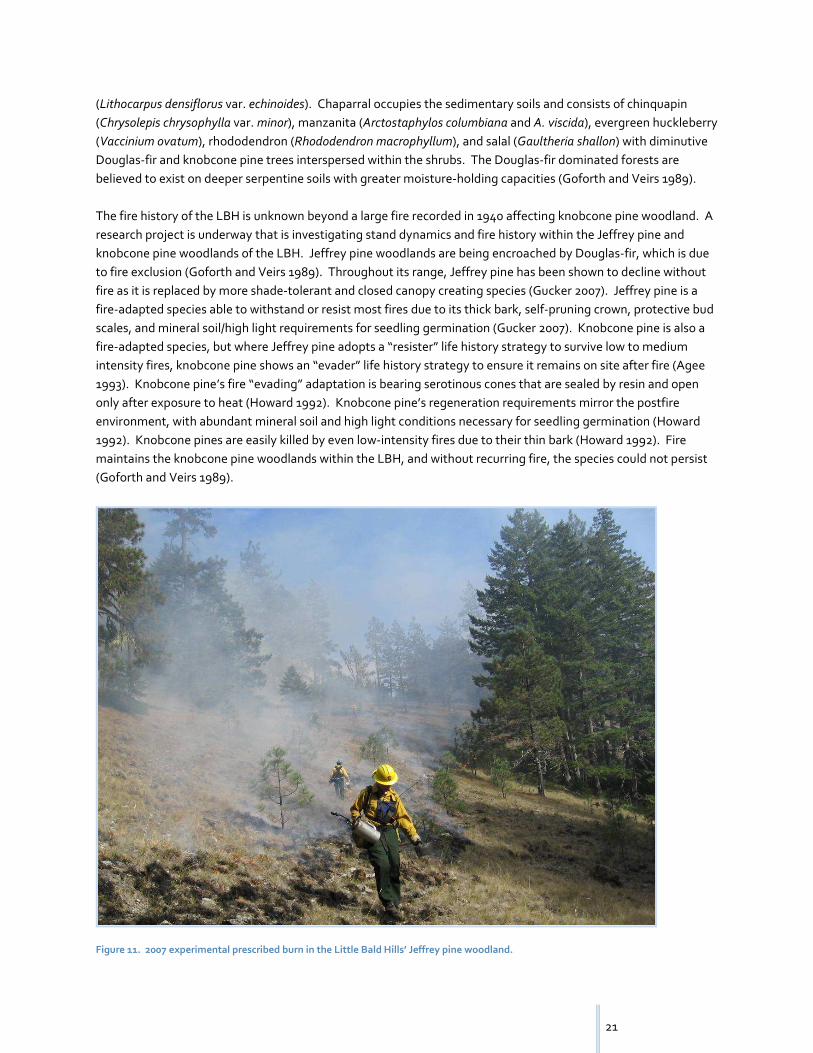
Figure 12. Prescribed burn in the Douglas-fir dominated D-A second growth unit, 2007.
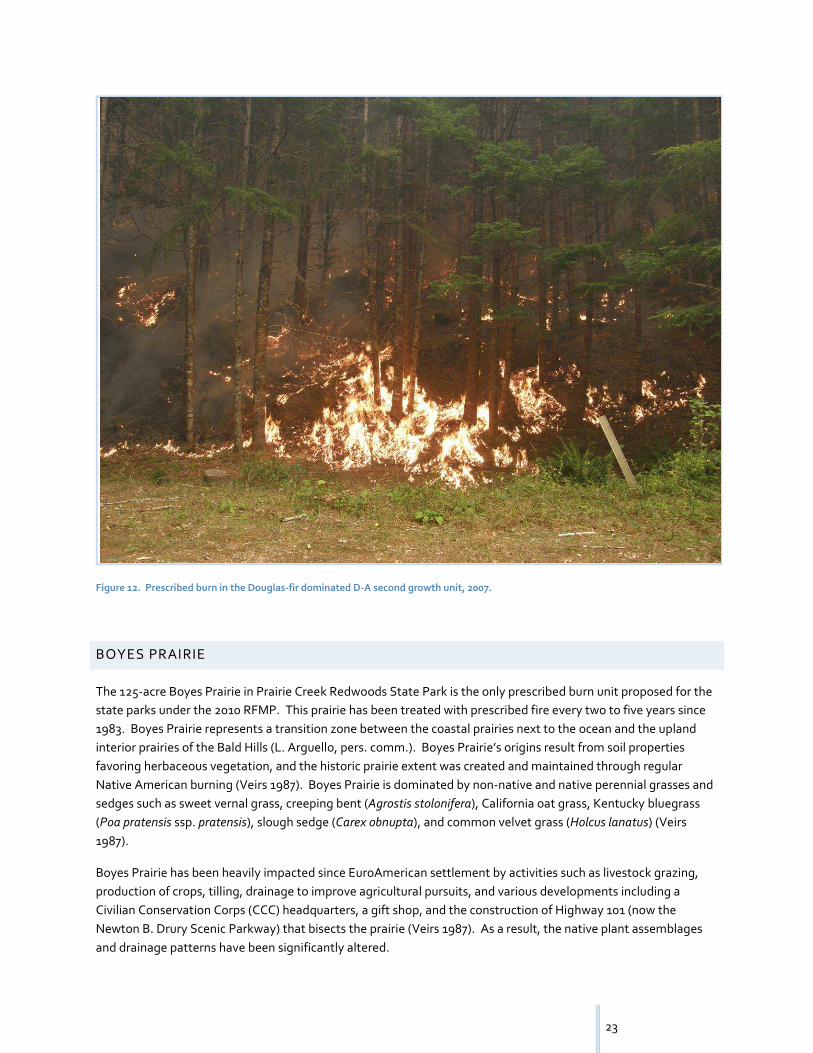
BOYES PRAIRIE
The 125-acre Boyes Prairie in Prairie Creek Redwoods State Park is the only prescribed burn unit proposed for the
state parks under the 2010 RFMP. This prairie has been treated with prescribed fire every two to five years since
1983. Boyes Prairie represents a transition zone between the coastal prairies next to the ocean and the upland
interior prairies of the Bald Hills (L. Arguello, pers. comm.). Boyes Prairie’s origins result from soil properties
favoring herbaceous vegetation, and the historic prairie extent was created and maintained through regular
Native American burning (Veirs 1987). Boyes Prairie is dominated by non-native and native perennial grasses and
sedges such as sweet vernal grass, creeping bent (Agrostis stolonifera), California oat grass, Kentucky bluegrass
(Poa pratensis ssp. pratensis), slough sedge (Carex obnupta), and common velvet grass (Holcus lanatus) (Veirs
1987).
Boyes Prairie has been heavily impacted since EuroAmerican settlement by activities such as livestock grazing,
production of crops, tilling, drainage to improve agricultural pursuits, and various developments including a
Civilian Conservation Corps (CCC) headquarters, a gift shop, and the construction of Highway 101 (now the
Newton B. Drury Scenic Parkway) that bisects the prairie (Veirs 1987). As a result, the native plant assemblages
and drainage patterns have been significantly altered.

24
In the absence of fire, the prairie becomes choked with invading species such as cascara (Rhamnus purshiana) and
Himalayan blackberry, and especially the eastern margin becomes encroached by young redwood, Douglas-fir,
western hemlock (Tsuga heterophylla), and Sitka spruce (Veirs 1987, CDPR 2009). Management objectives for
burning include maintaining and restoring the prairie extent, improving elk habitat by decreasing cover of the
unpalatable slough sedge, and increasing the cover of native plant species. The prairie is immediately adjacent to
marbled murrelet and spotted owl habitat, so preparation and burning activities occur outside of the breeding and
noise restriction periods. Prescribed fire preparation and ignition also occur outside the migratory bird nesting
period, and snags are protected as much as possible during operations to protect wildlife habitat.
Fifteen long-term monitoring transects were established in 1986 to monitor the vegetation of Boyes Prairie. They
have been sampled over time in coordination with prescribed fire treatments. Seven of these transects were
taken over by the fire ecology program in 2008.
Figure 13. A postburn image of Boyes Prairie with a long-term monitoring plot stake in the foreground. Newton B. Drury Scenic
Parkway bisects the prairie along the fence line. Redwood NP photo.

25
MANAGEMENT GOALS & OBJECTIVES
Evaluation of fire management actions is the primary purpose of Redwood’s fire ecology program. Crafting fire
management objectives is a task shared by Redwood’s fire and resource management staff. The foundation of
the objectives lies in previously mentioned park planning documents. Since prescribed fire has been one of
Redwood’s resource management tools since the 1980s, fire management objectives have evolved throughout
the years. The general direction of park management with respect to prescribed fire has not changed much over
the years; semantical changes have been made to fire management objectives and management targets have
been revised over time. The fire management objectives stated here resulted from an interdisciplinary meeting of
Redwood fire and resource managers in April 2009, and they were subsequently fine-tuned by the Chief of
Vegetation Management and the fire ecologist. As the prescribed fire program is periodically assessed and
evaluated, management objectives may again be revised as needed.
FIRE MANAGEMENT OBJECTIVES
The programmatic fire management objectives stated in the 2010 RFMP are expanded upon in individual
prescribed burn plans to explicitly state the intended management target, the desired effect, and the timeframe
for achieving management success. The fire management objectives provided here are the ones measured by
Redwood’s fire ecology program and the ones expressed in prescribed burn plans. They are organized by Fire
Management Unit (FMU), and sometimes address specific vegetation communities.
Bald Hills:
In open grassland, reduce density of live fir, < 3’ tall, by ≥ 80% within two years of the burn.
Early Season Burns: In oak woodlands with conifer encroachment, reduce density of live fir, < 3’ tall, by ≥
70% within two years of the burn.
Late Season Burns: In oak woodlands with conifer encroachment, reduce density of live fir, < 3’ tall, by ≥
50% within two years of the burn.
Do not reduce the relative cover of native plants in oak woodlands by ≥ 10% two years postburn as
measured from original preburn conditions.
Do not reduce the relative cover of native plants in prairies by ≥ 10% two years postburn as measured
from original preburn conditions.
Do not reduce overall oak woodland canopy cover by ≥ 10% two years postburn as measured from
original preburn conditions.
Coastal Prairie:
Do not reduce native plant species diversity (alpha diversity or number of native plant species) by ≥ 10%
two years postburn as measured from original preburn conditions.
Do not reduce the relative cover of native plants by ≥ 10% two years postburn as measured from original
preburn conditions.
Reduce small (< 3’ tall) tree density and shrub cover by > 20% with two years of the burn.

26
Little Bald Hills:
Do not reduce native plant species diversity (alpha diversity or number of native plant species) by ≥ 10%
two years postburn as measured from original preburn conditions.
Do not reduce the relative cover of native plants by ≥ 10% two years postburn as measured from original
preburn conditions.
Reduce density of small (< 3’ tall) conifers in prairies and woodlands by > 50% within two years of the
burn.
Reduce dead & down fuel loading in prairies by > 40% immediately postburn.
Second Growth Forests:
Create ≤ ½ acre gaps (dead/dying trees with < 5% live crowns) in the second growth forest at an average
rate of one gap per five acres, two years postburn.
Increase mean stem diameter of residual mixed conifer stand by at least 10% two years postburn.
Increase shrub and herbaceous cover by ≥ 25% two years postburn.
Retain ≥ 50% of forest canopy throughout the unit with the same gap distribution as desired above two
years postburn.
Boyes Prairie (Prairie Creek Redwoods State Park):
Reduce cover of slough sedge (Carex obnupta) by any amount within two years of the burn.
Increase diversity (alpha diversity or species richness; the total number of native plant species) of native
plants by any amount within two years of the burn.
Increase the relative cover of native plant species by any amount within two years of the burn.
Reduce shrub cover and encroaching tree density by any amount within two years of the burn.
MONITORING DESIGN
Four levels of monitoring are ongoing at Redwood to support the fire management program. The Fire Monitoring
Handbook (USDI NPS 2003) describes these levels in detail, and they are summarized here.
Level I: Environmental Monitoring
Level I environmental monitoring at Redwood consists of collecting data on weather, fire danger rating, fuel
conditions, resource availability, and concerns and values to be protected (USDI NPS 2003). These monitoring
data are used for both wildland and prescribed fires. There are two Remote Automated Weather Stations (RAWS)
within the park maintained and operated by fire management staff; the Schoolhouse RAWS is located on
Schoolhouse Peak in the Bald Hills, and the Westside RAWS is located on the A-9 Deck off the Westside Access
Road. Fire danger and fuel conditions are tracked using National Fire Danger Rating System (NFDRS) indices
available from the Weather Information Management System (WIMS) and the local dispatch office. Park staffing
is outlined in the park preparedness plan and is linked to the NFDRS energy release component (ERC), while
concerns and values to be protected are addressed in the RMFP. Monitoring of fire danger rating, fuel conditions,
and resource availability occurs primarily during fire season at Redwood.

27
Level II: Fire Observations
This level of monitoring involves direct observations of wildland and prescribed fire at Redwood. It is divided into
two parts: reconnaissance monitoring and fire conditions monitoring. Reconnaissance monitoring occurs on all
wildland fires and is included in a fire “size-up” performed by the Incident Commander of the incident. The size-
up consists of the following information and is delivered to the park Duty Officer: fire cause and ignition point,
fire location and size, logistical information, fuels and vegetation description, topographic variables (slope,
aspect, elevation), current and predicted fire behavior, fuel model, potential for further spread, current and
forecasted weather, resource or safety threats or constraints, and smoke volume and movement (USDI NPS
2003). This information is also documented in a “Fire Report” form that is completed for each incident. Data from
reconnaissance monitoring are updated and reported as needed for each incident.
Fire observation monitoring occurs on all prescribed fires and wildland fires that go into extended attack, and
consists of collecting data on the following: ambient conditions (current and forecasted weather, seasonal
outlooks, fire weather watches and warnings), fuel moisture, fire characteristics (fire behavior, fire size, spotting
potential), smoke characteristics, holding options, and resource advisor concerns (USDI NPS 2003). Data from fire
observation monitoring is updated and reported as needed for each prescribed burn or wildland fire, and may be
included in the Wildland Fire Decision Support System (WFDSS) planning process for unplanned ignitions. One or
more Resource Advisors will be assigned to any wildland fire that goes into extended attack at Redwood; the
Resource Advisor Guide outlines natural and cultural resource concerns and issues related to managing wildland
fires.
Many of these Level II variables are incorporated into modeling fire behavior and effects, identifying holding
concerns and resource needs, and in the development of smoke management plans, individual prescribed burn
plans and multi-year prescribed fire treatment plans. The Fire Monitor(s) or FEMO(s) assigned to individual
prescribed burns are responsible for preparing a postburn report within one month of the burn to be filed with the
prescribed burn plan. Many Level II monitoring variables are documented in the FEMO report; a FEMO report
template for Redwood can be found in Appendix L.
Level III: Short-Term Change in Vegetation and Fuels
This level of monitoring occurs at Redwood to assess prescribed fire and mechanical treatment objectives that
can best be addressed with a temporary, short-term approach. To date, Level III monitoring has been used only in
assessing the effectiveness of using prescribed fire to kill encroaching fir seedlings (< 3’ tall) in the Bald Hills’
prairies and oak woodlands through the use of “Fir Plots.” The complete Fir Plot methodology can be found in
Appendix H. Other Level III monitoring protocols that will be used on larger wildland and prescribed fires at
Redwood are the Composite Burn Index and Normalized Burn Ratio (Key and Benson 2006). Additional Level III
monitoring will be used to assess mechanical treatment success through repeat photography at established photo
points.
Level IV: Long-Term Change in Vegetation and Fuels
Long-term monitoring is the standard for assessing prescribed fire objectives at Redwood. FMH protocols have
been utilized to monitor the Bald Hills’ oak woodlands and prairies since 1990; almost twenty years of monitoring
data exist that cover as many as six burning cycles. FMH methodology has also been used in a very limited and
experimental fashion in the old growth redwood forest. Level IV monitoring has been used since 1986 in Boyes
Prairie of Prairie Creek Redwoods State Park. Level IV monitoring will be used to assess management success at
treating second growth forests, coastal prairies, the Little Bald Hills, and eventually old growth redwood forests.

28
As park managers prepare to treat these areas with prescribed fire, target conditions and desired future
conditions will be developed by park staff, and a monitoring design will be developed by the fire ecologist.
Minimum Plot Determinations for Monitoring Levels III and IV
Minimum plot numbers are not calculated for certain Level III monitoring such as photo points and Composite
Burn Index plots. Minimum plot numbers have not and will not be calculated for the Boyes Prairie plots due to
their purpose to track vegetative trends rather than rigorously detect change after treatment with prescribed fire.
To date, all of the prescribed fire objectives measured by the fire ecology program are “change” objectives,
meaning that they seek to cause some change in target variables within a set timeframe through management
action (USDI NPS 2003). Minimum plot numbers for short and long-term monitoring of “change” objectives are
determined using a sample size equation described in Elzinga et al. (1998) to detect the difference between two
means using paired sampling units. The equation is summarized here:
n = (s)2(Zα + Zβ)
2/(MDC)
2
where: s = standard deviation of the difference between paired samples
Zα = Z-coefficient for the false-change error rate
Zβ = Z-coefficient for the missed-change error rate
MDC = Minimum detectable change size expressed in absolute terms
Redwood’s fire monitoring objectives are to monitor change objectives at the following levels:
Confidence level = 80%
Statistical power = 80%
False-change error rate, α = 20%
Missed-change error rate, β = 20%
Monitoring Design: Bald Hills Oak Woodland (FQUGA1D09)
The FQUGA1D09 monitoring type is based upon standard FMH forest plot protocol, described in detail in the Fire
Monitoring Handbook (2003). Within each 50 m x 20 m plot, the following data are collected:
Overstory Trees (> 15 cm DBH): species, live/dead status, DBH, crown position code, damage, scorch
height, char height, percent of canopy scorched; trees are mapped and tagged
Pole-Size Trees (< 15 cm DBH and > 2.5 cm DBH): species, live/dead status, DBH, height; trees are
mapped and tagged
Seedling Trees (< 2.5 cm DBH): species, live/dead status, height, whether seedling originates from seed
or sprouting

29
Understory Vegetation: species, height of tallest vegetation, live/dead status, invasive plant species of
concern
Dead & Down Fuel Loading: litter depth; duff depth; loading of 1, 10, 100, and 1000 (sound & rotten)
fuels
Burn severity: quantitative estimate of burn severity to substrate and vegetation
Photos: repeat photography documents changes over time on eight permanent photo points per plot
Physical data: slope, aspect, UTM coordinate location, plot location
Very little documentation exists to explain how plots were installed during the early years of FMH monitoring
other than that they were located in a random fashion (USDI NPS 1990a). Plots are typically sampled from July
through September. During years with heavy workloads, often the vegetation transects of oak plots are read
during their phenological peak (July – mid August), and the rest of the plot is completed when time allows to
ensure seasonally-affected vegetation is sampled during its prime.
FMH protocols are adhered to for sampling oak plots with a few exceptions. A canopy cover protocol (Appendix I)
was added in 2008 to address the canopy cover fire management objective. It is hoped that this objective can be
assessed using a combination of canopy cover data with overstory oak tree mortality data. The collection of
shrub density data was suspended in 2008. This is due to inconsistency and gaps in data collection of this protocol
from 2003 – 2007. The sampling schedule for the oak plots excludes the one year postburn (YR01) sampling
event; plots are sampled preburn, two years postburn (YR02), five years postburn (YR05), and every subsequent
five years thereafter. Canopy cover is sampled immediately before the burn (and before any oak leaves have
fallen for the season) and two years postburn. The “Species seen within 5 meters of the transect” component of
the herbaceous transect has been eliminated and replaced by an “Invasive plant species of concern seen within 5
meters of the transect” effort. More details specific to the oak plots are discussed in the following “Data
Management” and “Quality Control” sections. The FMH-4, or Monitoring Type Description Sheet, is attached as
Appendix J, and outlines specifics for the oak plot protocol.
The minimum desired change for relative native plant cover in the oak woodlands is stated to be 10%, or 5.5%
(preburn relative native plant cover is 55.05%). Minimum plot numbers have been calculated for the Bald Hills
FQUGA1D09 monitoring type using the previously stated sample size equation. 24 plots are needed to detect
change with the confidence and power stated above, and 26 plots are currently active in this monitoring type.
Monitoring Design: Bald Hills Prairie (GMIPR1D03)
The GMIPR1D03 monitoring type is based upon standard FMH grass plot protocol, described in detail in the Fire
Monitoring Handbook (2003). For each 30 m transect, the following data are collected:
Understory Vegetation: species, height of tallest vegetation, live/dead status; invasive plant species of
concern
Burn severity: quantitative estimate of burn severity to substrate and vegetation
Photos: repeat photography documents changes over time on two permanent photo points per plot

30
Physical data: slope, aspect, UTM coordinate location, plot location
Very little documentation exists to explain how plots were installed during the early years of FMH monitoring
other than that they were located in a random fashion (USDI NPS 1990a). Plots have been sampled from June
through late July, although it is preferred to complete sampling by the end of June.
FMH protocols are adhered to with the following exception: the “Species seen within 5 meters” sampling effort
has been replaced by a “Invasive plant species of concern seen within 5 meters of the transect” belt. More details
specific to the grass plots are discussed in the following “Data Management” and “Quality Control” sections. The
FMH-4, or Monitoring Type Description Sheet, is attached as Appendix K, and outlines specifics for the grass plot
protocol.
The minimum desired change for relative native plant cover in the prairies is stated to be 10%. Minimum plot
numbers are currently being re-calculated for the GMIPR1D03 monitoring type and are pending rectification of
recently identified errors in the database and data entry of newly installed plots. These calculations should be
completed prior to the dissemination of the 2009 Fire Ecology Annual Report. During previous minimum plot
calculations, a high number (> 80) of plots were needed to detect change. If plot numbers are still prohibitively
high after database corrections have been made, then a new strategy will be developed for dealing with sampling
relative native plant cover in the grass plot network, and may involve splitting the monitoring type into two types
or increasing the level of minimum detectable change.
Monitoring Design: Fir Plots (FIRG, FIROE, FIROL)
Please refer to Appendix H for a full account of Fir Plot methodology. Minimum plot numbers have not been
calculated for the Fir Plots; this is due to not enough plots being treated with prescribed fire at the time of this
writing. Fir Plot minimum plot calculations are scheduled to occur over the winter of 2010.
Monitoring Design: Old Growth Redwood (FSESE1D08)
Only four plots exist in this monitoring type, and only one has been treated with prescribed fire. The FSESE1D08
type utilizes standard FMH forest plot methodology. Due to the relatively small size of the standard FMH forest
plot and the low density of old growth redwood trees, additional overstory tree sampling was identified as being
needed to augment standard FMH protocols. An experimental approach was used for additional overstory
sampling, and all four old growth plots have four different additional overstory sampling protocols. This
monitoring type is currently inactive; the one plot that has been treated with prescribed fire will be sampled every
five years to track trends in forest structure and composition.
The role of fire in old growth redwood forests needs to be further investigated, and research on the effects of
prescribed fire on the northern spotted owl and marbled murrelet needs to occur before any prescribed burning or
fire effects monitoring occurs in this vegetation type. If or when prescribed burning is proposed for old growth
redwood forests, a new monitoring design will be created.

31
Monitoring Design: Little Bald Hills
No monitoring design exists; this section is a work in progress. Monitoring design will be developed by the fire
ecologist and lead fire effects monitor in consultation with park fire and resource managers and the regional fire
ecologist.
Monitoring Design: Coastal Prairie
No monitoring design exists; this section is a work in progress. Monitoring design will be developed by the fire
ecologist and lead fire effects monitor in consultation with park fire and resource managers (especially cultural
resource managers) and the regional fire ecologist.
Monitoring Design: Second Growth Forests
No monitoring design exists; this section is a work in progress. Monitoring design will be developed by the fire
ecologist and lead fire effects monitor in consultation with park fire and resource managers (especially the park
forester) and the regional fire ecologist.
Monitoring Design: Boyes Prairie
The purpose of the Boyes Prairie sampling is to track changes in vegetation cover and detect trends in the
vegetation community. These plots were installed in 1986 and were not linked to any specific objective for
prescribed fire management, so no minimum number plots has or will be determined. The current plot network
consists of seven transects (the original number was 15), and each transect is a 200’ long point-intercept transect
with vegetation sampled every 1’ (100 points total per transect). Plots are sampled two years after each
prescribed burn.
Monitoring Design: Burn Severity Assessments
Burn severity data will be requested for single fires (planned and unplanned) that exceed 300 acres or multiple
fires that exceed 500 acres in areas of shrub or forest-dominated vegetation. Data will be requested by the fire
ecologist through the NPS-USGS Burn Severity Mapping Program (http://burnseverity.cr.usgs.gov/). These
requests will be made annually within two months of the end of fire season. Remotely sensed burn severity data
in the form of the differenced Normalized Burn Ratio (dNBR) or the relative differenced Normalized Burn Ratio
(RdNBR) will be field verified using the Composite Burn Index (CBI) methodology (Key and Benson 2006).
Prescribed burn units proposed under the 2010 FMP that will be especially targeted for burn severity assessment
are the C-10 (339 acres) and Wildcat (1054 acres) second growth forest burns.

32
Monitoring Design: Mechanical Treatments
Mechanical treatments conducted by Redwood’s fire management program will be monitored using permanent
photo points and repeat photography. Specific protocol has yet to be developed.
DATA MANAGEMENT & ANALYSIS
The Redwood fire ecology program is responsible for managing almost 20 years worth of fire effects monitoring
data. A major challenge of any long-term monitoring program is maintaining consistency and accuracy in data
collection and management over time. The fire ecology program takes this challenge seriously, and is constantly
evolving its data management and analysis strategy to ensure the collection, management, and analysis of
meaningful, high quality data.
DATA MANAGEMENT & QUALITY CONTROL
The highest standards for data management and quality control are upheld within the Klamath Fire Ecology
Program. Throughout the years, many different strategies have been developed to ensure that high quality field
data are collected, entered and analyzed. Listed below are some of the methods and standards developed for
data management and quality control.
Data Management
The “matrix” for Redwood is a master list of all plots located within the park, organized by monitoring
type and burn unit. It also lists Universal Transverse Mercator (UTM) coordinates in North American
Datum 27 (NAD27) and North American Datum (NAD83) if available, along with a date for every time the
plot has burned, and every data collection event. The matrix is updated as often as possible throughout
the year, and if major changes occur, a new matrix is saved with the date the changes occur. The current
matrix is attached as Appendix G, while all previous matrices can be found here: S:\team\shdata\Fire\Fire
Effects Team\Parks\REDW\Matrix
Each plot has its own archival binder and field folder. The original data sheets are kept in the archival
binder and copies are made for the field folder. This ensures that original data sheets are not
compromised by inclement weather or human error. Digital pictures for each sampling event are printed
and filed within the field folder so plot pictures can be replicated as closely as possible through time. A
plot history and plot maintenance log is located within each field folder; all burn and data collection dates
are recorded in the plot history log, while plot maintenance activities are recorded on the plot
maintenance sheet. The plot maintenance sheet is referenced before traveling to a plot in the event that
tags need to be made, or rebar stakes need to be replaced.
Inactive and rejected plot folders are kept in a separate file cabinet drawer within the field folder file
cabinet. Rejected plots are placed within the “busy work” section until there is time to pull rebar stakes.
Once rebar has been pulled, archival and field folders for the rejected plot are moved to the “deceased
plot” section of the file cabinet drawer. Inactive plot field folders and archival binders are placed in the
“inactive plot” section of the drawer. These changes should also be documented on the matrix in the
“inactive” and “deceased” worksheets of the Microsoft Excel workbook.

33
Plot slides are located within archival slide binders. Each slide is labeled as per instructions on the sign
hanging above the light table in the fire effects office. If signs are unreadable on the slide, the photo log
notebook is used to help determine where the picture was taken. Slide film can be purchased from
Swanlund’s Camera on F Street in Eureka. Slide film is commonly taken to a local drug store (e.g., Rite
Aid) to be developed. This process usually takes at least two weeks before slides are ready to be picked
up.
Every time a picture is taken, either digital or slide, it should be recorded within the appropriate camera’s
photo log notebook, located in the camera bags. Each roll of slide film is labeled before placing it into
the camera. A document providing more details on these subjects is located here:
S:\team\shdata\Fire\Fire Effects Team\Data Mgmt\Film Protocols
Before the start of field season, the lead fire effects monitor and fire ecologist meet to discuss the
upcoming field season and develop a work plan. Based on this meeting, a list of field work and a travel
schedule are compiled by the lead fire effects monitor. A master list of all field work needing to be
completed is created and includes important information such as burn unit, plot name, sampling event,
and estimated amount of time needed to complete each burn unit’s plots. The travel schedule includes
the crew’s location, holidays and training throughout the months of May, June, July and August. In
addition, it is important to send a copy of this schedule to all pertinent fire and resource management
staffs at all parks and effects crew members for planning purposes. Examples of these are located here:
S:\team\shdata\Fire\Fire Effects Team\09 Season\2009 Season Stuff
Pre-season meetings with the lead fire effects monitor, fire ecologist, and pertinent fire and resource
management staff at each park are held to discuss the 5-year burn plan (especially revisions) and the
scheduling of upcoming burns. This is especially important to help define priority units for plot
installation efforts and to address any of the fire and resource management staff’s questions.
A document has been produced that details the ins-and-outs of fire effects life. It discusses topics such as
crew travel, per diem, vehicle maintenance, time reporting, and what is expected of seasonal staff. A
copy is given to all crew members at the start of the season and it is discussed with them. Crew
members are also provided with a pocket card-size list of important Redwood fire management staff
phone numbers, and a Klamath Network contact list that is kept current for reference by the fire effects
crew. Again, examples of these can be found here: S:\team\shdata\Fire\Fire Effects Team\09
Season\2009 Season Stuff
All field data are entered into the database and software program specifically designed to house federal
fire effects monitoring data, FFI. FFI is an acronym that stands for FEAT FIREMON Integrated, revealing
its legacy as a new database and analysis tool to replace the National Park Service’s fire effects database,
FEAT (Fire Ecology and Assessment Tool), and the U.S. Forest Service’s fire effects database, FIREMON
(Fire Effects Monitoring and Inventory System). FFI data are backed up in triplicate regularly to the hard
drive of the “master” FFI fire effects computer, to an external hard drive attached to previously named
computer, and to Redwood’s network (S:drive).
Spatial data for Redwood are found on the N:drive. Helpful locations on the N:drive include the fire
history geodatabase (N:\geodatabase\001_SOC_FIRE_FirePerimeter), vector data
(N:\GIS_Data\Agency\rnsp), raster data (N:\GIS_Data\Raster), 2010 RFMP files
(N:\GIS_Maps\user_maps\141_FireManagmentPlan\FMP_2009), layer files associated with the 2010
RFMP and fire history data (N:\GIS_Custom\Layers\agency\rnsp\fireandfuels), and the RNSP Atlas
topographic version (N:\GIS_Maps\share_maps\PDF\RNSP_Atlas-07_23_06) and NAIP imagery version
(N:\GIS_Maps\share_maps\PDF\RNSP_Atlas_Imagery_CurrentVersion). Maps of prescribed burn units in
.pdf format are found on the network: S:\team\shdata\Fire\BurnUnitAtlas. Projects created and
managed by the fire ecology program are stored on the network: S:\team\Fire\Fire

34
Ecology\REDW\GIS\Projects and any maps created are exported to this folder: S:\team\Fire\Fire
Ecology\REDW\GIS\Maps.
Quality Control
A field calibration session is conducted by the lead fire effects monitor at the beginning of each season
with all members of the fire effects crew to ensure all field measurements are conducted in an accurate
and consistent manner. Activities such as compass use, laying out measuring tapes, filling out data
sheets correctly, taking plot photos, and data collection techniques for each plot variable sampled are
discussed to ensure that all crew members are aware of the proper methodology and operating
procedures. A document with all of the field calibration talking points and exercises is located here:
S:\team\shdata\Fire\Fire Effects Team\Data Mgmt
A blank, unknown species master list is created at the beginning of each season. This includes pages for
individually numbered unknown forb (FUNK) and unknown grass (GUNK) species. Each new unknown
species receives the next consecutive number, which is recorded on data sheets and ensures that all
species are tracked from collection to identification. An example of this master list can be found here:
S:\team\shdata\Fire\Fire Effects Team\Data Mgmt This blank, unknown species master list is used only
for purposes of managing and tracking unknowns. A separate protocol for recording unknown species is
utilized for data entry and inclusion on the species list.
If a species is not able to be identified to the genus level, it will be entered into FFI using a generic family
(e.g., LILIA for unknown Liliaceae), genus (e.g., IRISX for unknown Iris), or life form (e.g., FUNK1 for
unknown forbs; GUNK1 for unknown grasses) code. Duplicate generic unknown codes should be utilized
for two or more unknown but different species found on a single plot during one sampling event (e.g.,
IRISX1 for unknown Iris species 1; IRISX2 for unknown Iris species 2).
Digital pictures are downloaded and labeled within a reasonable amount of time after being taken.
Digital pictures are labeled as follows: Plot name (e.g., QUGA04)_location (e.g., Q4-Q1)_sampling event
(e.g., 05YR02). All digital pictures are stored on the external hard drive attached to the desktop
computer in the fire effects cubicle. No unlabeled photos are stored here. The photos on the external
hard drive are backed up once a year onto CDs, which are then stored above the desktop computer.
A document has been created to assist with data entry and general use of the fire effects database and
analysis tool, Ecological Monitoring Utilities or FEAT FIREMON Integrated (FFI). It includes step-by-step
directions for entering data for each protocol, creating plot species lists and lists of trees, and quality
checking data with certain issues to keep in mind. It is called “FFI Mumblings” and is included as
Appendix E. It is also located here: S:\team\shdata\Fire\Fire Effects Team\Data Mgmt
New data sheets have been created to assist with data entry in FFI. While continuing to use original FMH
data sheets is still acceptable, the new FFI data sheets arrange the data variables by the order they are
presented in FFI. This enables the crew to cut back on data entry mistakes and save on optometry bills
from having to squint at data sheets to find the next column of data to enter. The new “Overstory
Tagged Tree” (FMH-8) data sheet includes extra columns for previous (most recent sampling event) DBH,
previous live or dead status, and previous crown position code. For each plot, data from the previous
sampling event is queried from FFI and imported into an Excel spreadsheet, and then arranged into a new
data sheet allowing comparisons of previous and current measurements. The new “Pole-Size Tree”
(FMH-9) data sheet is similar, as it has extra columns for previous DBH, previous live or dead status, and
previous tree height. The new “Forest Plot Fuels Inventory” (FMH-19) data sheet contains columns for

35
previous 1000 hour logs, and the foot mark where the log was found. This ensures that logs can be
tracked throughout the years. The new “Tree Postburn Assessment” (FMH-20) data sheet includes a
column for quarter where the tree is located, previous live or dead status, new DBH and previous DBH.
The new “Overstory Tagged Tree,” “Pole-Size Tree,” “Forest Plot Fuels Inventory,” “30 Meter Transect”
(FMH-16), and “Tree Postburn Assessment” data sheets are in Excel format to enable the import of FFI
data. The data sheets are found here: S:\team\shdata\Fire\Fire Effects Team\FFI\Data Sheets\Excel
Datasheets
Each year, a master list of sampled plots is created to track data through the collection, entry, quality
checking and filing phases. Once one of the steps of the data’s “life” is completed, the master list
hanging on the file cabinet in the fire effects office should be checked in the appropriate box for the
completed phase. Completed data sheets are not allowed in the “data entry” bins until all unknowns are
identified and every header of the data sheet is filled out. After data are entered into FFI, the data sheets
for the plot move to the “quality checking” bin. After the quality checking is complete, the data sheets
move to the “data to copy” bin. Data sheets are photocopied dark enough to be legible, and the copies
and original data sheets are placed in the “data to file” bin. Lastly, the data sheets are filed in their
appropriate archival binder and field folder.
All data are quality checked for errors after they are entered. It is important that quality data go into FFI
and that quality data come out of FFI. The individual who performed data entry is discouraged from
quality checking that same data. By using two separate crewmembers for each process, fewer mistakes
are made in the quality checking effort. Every line of data entry should be quality checked for errors,
along with the data sheet headers for each protocol within FFI. The “FFI Mumblings” document explains
in detail common errors within the database to watch out for.
Over time, there have been issues with the FQUGA1D09 monitoring type and measuring multi-stemmed
oaks. During plot installation in the 1990s, there was inconsistency with the definition of an “overstory
oak tree.” Some plots were installed with only the largest overstory tree bole being tagged within a
clump of oaks, while other plots were installed with every overstory tree bole in a clump of oaks being
tagged within the plot. Over the years, changes have been made in data collection protocol for multiple-
stemmed oaks, such as removing tree tags from multiple-stemmed individuals and retaining the tag for
only the largest stem, measuring diameter at root crown of oak clumps, and measuring the DBH of all
stems and then calculating the average or “composite” DBH for the clump. Unfortunately, there is little
or no documentation to accompany not only the actual changes made through time, but also the
reasoning behind the changes. It has been determined that current and future protocol will be to
maintain consistency with original (preburn) data collection efforts. For example, when a plot is sampled
that has only the largest stem of an individual clump tagged, the trees will continue to be sampled this
way, and good documentation will be made of how many ‘extra’ stems exist, and if they are live or dead.
These data are entered into the Tree protocol form in FFI under the “Num. Live Stems” column and
“Num. Dead Stems” column. If a plot has all overstory tree multiple stems tagged, the plot should again
continue to be sampled this way, with good documentation made that every stem is tagged. The
collection of diameter at root crown data and calculation of average or composite DBH has been
discontinued.

36
DATA ANALYSIS
Monitoring data will be analyzed in a timely manner, and results will be disseminated to fire and resource
managers as available. Intended data analyses are listed below, organized by FMU or monitoring type. Bold type
indicates that analysis measures a stated fire management objective. Data analysis is listed here for only
monitoring types with sufficient sample size to support such analyses.
FQUGA1D09 MONITORING TYPE:
Overall oak woodland canopy cover
Overstory tree density and basal area (total, by species, by live/dead, by crown position code, by
diameter class)
Overstory tree damage
Average overstory tree scorch and char height and average percent canopy scorched (also by species,
crown position code, diameter)
Pole size tree density and basal area (total, by species, by live/dead, by height)
Fuel loading (total, by size class, litter and duff depth)
Seedling tree density (total, by species, by live/dead)
Relative cover of native plants
Understory vegetation cover (by species, by life form, by life cycle, by live/dead, by any combination of
previously stated variables)
Understory vegetation community analysis
GMIPR1D03 MONITORING TYPE:
Relative cover of native plants
Understory vegetation cover (by species, by life form, by life cycle, by live/dead, by any combination of
previously stated variables)
Understory vegetation community analysis
FIR PLOTS:
Density of live small (< 3’ tall) fir (by species) in grasslands
Density of live small (< 3’ tall) fir (by species) in early burn unit oak woodlands
Density of live small (< 3’ tall) fir (by species) in late burn unit oak woodlands

37
BOYES PRAIRIE PLOTS:
Relative cover of native plants
Vegetation cover (by species, by life form, by life cycle, by live/dead, by any combination of previously
stated variables)
Vegetation community analysis
REPORTING & ADAPTIVE MANAGEMENT
The fire ecologist and lead fire effects monitor will prepare an annual report of monitoring findings and
disseminate it to interested parties and post it on the Redwood intranet. This report will also be sent to Regional
and National Fire Ecology offices and posted on the NPS intranet. The fire ecologist and lead fire effects monitor
will present annual findings to Redwood staff at a “Brown Bag” luncheon, and may publish monitoring results in
Redwood’s Resource Management and Science newsletter, Redwood Currents. At minimum, the fire ecologist,
lead fire effects monitor, FMO, lead fuels technician, Chief of Vegetation Management, and supervisory forestry
technician will gather at the end of the fire season for a review of the season’s progress, success, and issues and to
conduct an Ecological After Action Review (EAAR). The fire ecologist will generate monitoring results for each
prescribed burn or mechanical treatment plan, with an assessment of whether management objectives were
achieved or not. This report will be provided to the FMO and burn boss prior to the annual FMP update, and will
be added as an appendix to the prescribed burn or mechanical treatment plan.
Monitoring results, plot data, and photos will be made available to park interpretive staff for their use in sharing
this information with park visitors and the general public. The fire ecologist will work with the FMO to ensure
programmatic accomplishments are summarized into “fire success stories” and shared as appropriate with NPS
fire communication and education staff.
If monitoring results indicate that management objectives are not being achieved, then the fire ecologist will alert
Redwood fire and resource managers as soon as possible, and a discussion will ensue to determine the next course
of action. Adaptive Management will be practiced regularly, and feedback will be delivered in a timely manner to
fire and resource managers.
Periodic fire ecology program reviews will be conducted by the Regional Fire Ecologist and his team. The last
program review was conducted in 2005.
Monitoring results and findings may also be summarized into posters, presentations, or papers to share with the
scientific community at conferences, symposia, or in the technical literature.
COLLABORATION
The fire ecology program believes that its strength lies in its ability to collaborate with other resource managers,
scientists, and interpreters and educators. Redwood has a strong natural and cultural resource staff, and fire
management has been and will continue to be an interdisciplinary effort. Fire management and fire monitoring
objectives are developed with the input of many park specialists. The fire management program works closely
with the vegetation management staff to coordinate prescribed fire and mechanical treatments with exotic plant

38
management efforts, the conifer cutting program, and second growth forest management. The program works
closely with the fish & wildlife staff to ensure that protections and considerations for threatened, endangered, and
sensitive species, migratory birds, and wildlife habitat are abided by and incorporated into all aspects of fire
management planning and implementation. The fire management staff also works closely with the cultural
resource program to ensure that all steps are taken to protect cultural resources to the highest degree possible
during fire management planning and operations, and to maintain and restore cultural landscapes as appropriate
through the use of fire. A Resource Advisor program (managed by the fire ecologist) has recently been created at
Redwood that unites park scientists and managers in an effort to protect park natural and cultural resources
through preparing for unplanned wildland fire events. The fire ecology program intends to take an active role in
sharing monitoring data and results with interpretive and education staff. The fire ecology staff also intends to
collaborate with scientists from the KLMN Inventory and Monitoring program, local USGS research stations
(Western Ecological Research Stations in CA and Forest and Rangeland Ecosystem Science Center in OR), and
local universities (e.g., Humboldt State University) to address fire research needs.
ROLES & RESPONSIBILITIES
The fire ecology program is nested within the Redwood fire management program, which is a branch within the
Resource Management division. The fire ecology program consists of the Fire Ecologist, the Lead Fire Effects
Monitor, and seasonal Fire Effects Monitors. Many additional people work directly with the fire ecology program
and are jointly responsible for its success.
STAFF ROLES & RESPONSIBILITIES
The roles and responsibilities of individuals closely connected to the fire ecology program are defined here. These
definitions are based upon those outlined in the RFMP (2010) and RM-18 (DOI NPS 2008b) and summarized:
The Regional Fire Ecologist (RFE) reviews and approves the Fire Monitoring plan and provides monitoring and
research guidance and support to the Fire Ecologist. The RFE also approves funding requests for monitoring and
is the point of contact for additional funding needs. The RFE organizes regional ecologist meetings and
communicates direction from the regional and national offices to park fire ecology programs. Fire ecology
program reviews and site visits are completed by the RFE. The RFE coordinates and prioritizes research needs
and requests.
The Chief of Resource Management and Science (CRMS) is responsible for ensuring that fire management
program goals and objectives are clearly stated. The CRMS also ensures that the fire monitoring plan reflects the
goals and objectives stated in related park management documents. The CRMS supervises the Fire Management
Officer and has overall responsibility for the fire management program. The CRMS approves prescribed fire and
mechanical treatment plans and communicates programmatic activity and success to the park Superintendent.
The Chief of Vegetation Management (CVM) communicates and coordinates frequently with the Fire
Management Officer and the Fire Ecologist to ensure the efficient management of park vegetation communities.
The CVM collaborates with the Fire Ecologist to identify and manage fire research needs and ensure vegetation
management objectives are being appropriately monitored. The CVM participates in the park Resource Advisor

39
program and collaborates with the Fire Ecologist on fire rehabilitation needs and management. The CVM reviews
the fire management plan and prescribed burn and mechanical treatment plans, and provides vegetation
management objectives to the fire program.
The Fire Management Officer (FMO) maintains overall responsibility for Redwood’s fire program. The FMO
provides supervision to the Fire Ecologist and provides training and development opportunities to this position.
The FMO ensures that the fire management program complies with policy directives for monitoring of fire
management activities. The FMO maintains a cohesive fire management staff and ensures that the fire ecology
program is involved with and integrated into fire management planning, operations, and activities. The FMO
writes and maintains the Fire Management Plan.
The Lead Fuels Technician (LFT) ensures that fire ecology personnel are kept abreast of prescribed fire and
mechanical treatment planning. The LFT collaborates with fire ecology staff to ensure objectives are reflected in
treatment plans and that monitoring is implemented prior to treatment.
The Fire Ecologist directs and manages the park fire ecology program and serves as the staff specialist in fire
ecology. The Fire Ecologist supervises the Lead Fire Effects Monitor and provides training and development
opportunities to this position, and provides direction and support to the Fire Effects Monitoring crew. The Fire
Ecologist helps develop fire management and monitoring objectives. The Fire Ecologist retains overall
responsibility for the Fire Effects Monitoring program and maintains the fire monitoring plan. The Fire Ecologist
reviews prescribed fire and mechanical treatment plans and assists with setting schedules for prescribed fire and
mechanical treatment. The Fire Ecologist analyzes monitoring data and shares results and findings with
interested parties. The Fire Ecologist identifies fire research needs and pursues efforts to have fire research
conducted. The Fire Ecologist manages the Resource Advisor program. The Fire Ecologist also acts as the fire
ecologist for ORCA and WHIS.
The Lead Fire Effects Monitor (LFEM) supervises, trains, and provides development opportunities for the fire
effects monitoring crew. The LFEM leads and organizes the collection, entry, and management of fire effects
data and ensures that protocol is followed accurately and correctly. The LFEM assists the fire ecologist with
developing new monitoring protocols, writing plans and reports, and communicating results of the fire ecology
program with interested parties. The LFEM upholds a high standard for data quality and management and passes
this along to crew members. The LFEM maintains voucher collections, plot spatial data, and electronic and hard
copy monitoring data. The LFEM also leads fire effects monitoring efforts at ORCA and WHIS.
The Fire Effects Monitors (FEMs) collect, enter, and quality check fire effects monitoring data. The FEMs follow
established protocol for maintaining high levels of data quality. The FEMs also conduct fire effects monitoring
work at ORCA and WHIS.
WORK PLANS & PRIORITIZATION
Annual work plans are prepared at the beginning of each calendar year after the previous year’s reporting and
presentation is completed. Recurring field work is organized and scheduled by the Lead Fire Effects Monitor,
which is then approved by the Fire Ecologist. New field work is identified by the Fire Ecologist after holding pre-
season meetings with Redwood’s fire and resource management staff to discuss upcoming projects, priorities,
and activities. Ongoing field work is always a high priority, and installation of new plots is accommodated as
much as possible. In years with unusually heavy workloads, assistance is requested in the National Fire Plan

40
Operations and Reporting System (NFPORS) and from the Regional office via additional funds to either hire one
or more Redwood seasonal monitors or gain assistance from nearby fire effects crews (especially the Southern
Cascades fire effects team). Assistance can also be solicited from Redwood fire and resource management staff.
If the annual monitoring workload exceeds staff capabilities, triage is performed by the fire ecologist and lead fire
effects monitor to ensure the highest priority work is completed.
PLAN INPUT AND ACKNOWLEDGEMENTS
This monitoring plan is a revision of the 2005 Redwood Fire Monitoring Plan written by Tim Bradley (previous Fire
Ecologist) and Jennifer Gibson (Ecologist, Whiskeytown National Recreation Area). The 2010 Redwood Fire
Monitoring Plan was written by Jen Beck (Fire Ecologist) and Becky Smith (Lead Fire Effects Monitor). Historical
information on the fire management and fire monitoring programs were gleaned from discussions with Leonel
Arguello (Chief, Vegetation Management) and John McClelland (Lead Fuels Technician and Battalion Chief).
Leonel Arguello also helped refine fire management and monitoring objectives. The current set of fire
management objectives were crafted in a April 15, 2009 meeting with Karin Anderson (Chief, Cultural Resources),
Leonel Arguello, Jeff Ayers (Supervisory Forestry Technician and Engine Captain 30), Jen Beck, Keith Benson (Fish
& Wildlife Biologist), Terry Hofstra (Chief, Resource Management and Science Division), John McClelland, Aida
Parkinson (Chief, Fish & Wildlife Branch and Environmental Specialist), Becky Smith, Jason Teraoka (Forester),
Jim Wheeler (Interpretive Specialist), and Rick Young (Fire Management Officer). Jason Teraoka generously
provided access to data and results from vegetation monitoring in the D-A second growth prescribed burn unit.
Julie Dubose initiated the “Data Management and Quality Control” section. Leonel Arguello and Robin Wills
(Regional Fire Ecologist, Pacific West Region) reviewed the draft of this plan and provided suggestions that
greatly improved the final version.

We would like to honor the memory of past
passed away in August 2009 after a long battle
Effects legacy, and his laughter echoes among tagged oaks and rebar
missed.
41
past (1998 – 2000) Assistant Lead Fire Effects Monitor Dale Haskamp, who
passed away in August 2009 after a long battle with cancer. His creative uses for the U-Dig-It tool remain a Fire
and his laughter echoes among tagged oaks and rebar-studded prairies in the Bald
41
Lead Fire Effects Monitor Dale Haskamp, who
It tool remain a Fire
in the Bald Hills. He is greatly

42
REFERENCES
Agee, J.K. 1993. Fire Ecology of Pacific Northwest Forests. Island Press, Washington, D.C. 493 pp.
Agee, J.K. 1996. Fire in restoration of Oregon white oak woodlands. Pp. 72 – 73 in Hardy, C.C. and S.F. Arno, eds.
The use of fire in forest restoration. General Technical Report INT-GTR-341. U.S. Department of
Agriculture, Forest Service, Intermountain Research Station, Ogden, Utah.
Anderson, M.K. 2005. Tending the Wild: Native American Knowledge and the Management of California’s
Natural Resources. University of California Press, Berkeley and Los Angeles, California. 526 pp.
Arguello, L. 1994. The effects of fire on two perennial bunchgrasses in the Bald Hills prairies of Redwood National
Park. M.A. Thesis. Humboldt State University, Arcata, California. 82 pp.
Bensen, K. 2009. A biological assessment of impacts to terrestrial threatened and endangered species from the
2010 Redwood National Park Fire Management Plan and prescribed burning in Prairie Creek Redwoods
and Jedediah Smith Redwoods State Parks in Redwood National and State Parks (RNSP). Copy available
at park office in Orick, California.
Benson, J.R. 1983. Archaeological test excavations at four sites in Redwood National Park, Humboldt County,
California. Redwood National Park, Orick, California. 191 pp.
Bickel, P.M. 1979. A study of cultural resources in Redwood National Park. U.S. Department of the Interior,
National Park Service, Denver Service Center, Denver, Colorado. 198 pp.
California Department of Parks and Recreation. 2009. Boyes Prairie Prescribed Burn Plan, Prairie Creek
Redwoods State Park. Copy available at RNSP office in Orick, California.
Elzinga, C.L., D.W. Salzer, and J.W. Willoughby. 1998. Measuring and Monitoring Plant Populations. U.S.
Department of the Interior, Bureau of Land Management. Natural Applied Resource Sciences Center,
Denver, Colorado. 477 pp.
Ford, L.D. and G.F. Hayes. 2007. Northern coastal scrub and coastal prairie. Pp. 180 – 207 in M.G.Barbour, T.
Keeler-Wolf, and A.A. Schoenherr (eds.), Terrestrial Vegetation of California. University of California
Press, Berkeley and Los Angeles, CA. 712 pp.
Goforth, D. and S. Veirs. 1989. Little Bald Hills Vegetation Study: Final Report. Copy available at park office in
Orick , California.
Gucker, C.L. 2007. Pinus jeffreyi. In: Fire Effects Information System, [Online]. U.S. Department of Agriculture,
Forest Service, Rocky Mountain Research Station, Fire Sciences Laboratory (Producer). Available:
http://fs.fed.us/database/feis/
Harrison, S., H. Safford, and J. Wakabayashi. 2004. Does the age of exposure of serpentine explain variation in
endemic plant diversity in California? International Geology Review 46: 235 – 242.
Harrison, S., J.B. Grace, K.F. Davies, H.D. Safford, and J.H. Veirs. 2006a. Invasion in a diversity hotspot: exotic
cover and native richness in the Californian serpentine flora. Ecology 87 (3): 695 – 703.

43
Harrison, S., H.D. Safford, J.B. Grace, J.H. Veirs, and K.F. Davies. 2006b. Regional and local species richness in an
insular environment: serpentine plants in California. Ecological Monographs 76 (1): 41 – 56.
Hayes, J.F. 1985. An analysis of Redwood National Park artifacts. 8489-5-0169, 8480-5-0302. U.S. Department
of the Interior, National Park Service, Redwood National Park, Crescent City, California. 143 pp.
Heady, H.F., T.C. Foin, M.M. Hektner, D.W. Taylor, M.G. Barbour, and W.J. Barry. 1977. Coastal prairie and
northern coastal scrub. Pp. 733 – 760 in M.G. Barbour and J. Major, eds., Terrestrial Vegetation of
California. California Native Plant Society Special Publication Number 9.
Hickman, J.C., editor. 1993. The Jepson Manual: Higher Plants of California. University of California Press,
Berkeley and Los Angeles, California.
Howard, J.L. and K.C. Aleksoff. 2000. Abies grandis. In: Fire Effects Information System, [Online]. U.S.
Department of Agriculture, Forest Service, Rocky Mountain Research Station, Fire Sciences Laboratory
(Producer). Available: http://www.fs.fed.us/database/feis/
Kay, C.E. 2007. Are lightning fires unnatural? A comparison of aboriginal and lightning ignition rates in the
United States. Pages 16 – 28 in R.E. Masters and K.E.M. Galley (eds.). Proceedings of the 23rd
Tall
Timbers Fire Ecology Conference: Fire in Grassland and Shrubland Ecosystems. Tall Timbers Research
Station, Tallahassee, Florida.
Keeley, J.E. 2002. Native American impacts on fire regimes of the California coastal ranges. Journal of
Biogeography 29: 303 – 320.
Key, C.H. and N.C. Benson. 2006. Landscape Assessment (LA): Sampling and analysis methods. In D.C. Lutes
(ed.), FIREMON: Fire Effects Monitoring and Inventory System. General Technical Report RMRS-GTR-
164-CD, U.S. Department of Agriculture, Forest Service, Rocky Mountain Research Station, Odgen, Utah.
Lewis, H.T. Patterns of Indian burning in California: ecology and ethnohistory. Ballena Press Anthropological
Papers 1. Ballena Press, Menlo Park, California.
Maret, M.P. and M.V. Wilson. 2000. Fire and seedling population dynamics in western Oregon prairies. Journal of
Vegetation Science 11: 307 – 314.
Maret, M.P. and M.V. Wilson. 2005. Fire and litter effects on seedling establishment in western Oregon upland
prairies. Restoration Ecology 13 (3): 562 – 568.
Nuckols, J.L. 2002. Assessing the role of seed banks and fire in the restoration of coastal prairie. M.S. Thesis,
Humboldt State University, Arcata, California.
Sarr, D.A., D.C. Odion, S.R. Mohren, E.E. Perry, R.L. Hoffman, L.K. Bridy, and A.A. Merton. 2007. Klamath
Network Vital Signs Monitoring Plan. Natural Resource Report NPS/KLMN/NRR-2007/016. National
Park Service, Fort Collins, Colorado.
Sawyer, J.O. 2006. Northwest California: A Natural History. University of California Press, Berkeley and Los
Angeles, California. 247 pp.
Stromberg, M.R., P. Kephart, and V. Yadon. 2001. Composition, invisibility, and diversity in coastal California
grasslands. Madroño 48: 236 – 252.y

44
Stuart, J.D. and S.L. Stephens. North Coast Bioregion. Pp. 147 – 169 in N.G. Sugihara et al., eds., Fire in California
Ecosystems. University of California Press, Berkeley and Los Angeles, California. 596 pp.
Sugihara, N.G. and L.J. Reed. 1987. Vegetation ecology of the Bald Hills oak woodlands of Redwood National
Park. Redwood National Park Technical Report 21. US Department of the Interior, National Park
Service, Redwood National Park. Orick, California.
Tveten, R.K. and R.W. Fonda. Fire effects on prairies and oak woodlands on Fort Lewis, Washington. Northwest
Science 73 (3): 145 – 158.
Uchytil, R.J. 1991. Pseudotsuga menziesii var. menziesii. In: Fire Effects Information System, [Online]. U.S.
Department of Agriculture, Forest Service, Rocky Mountain Research Station, Fire Sciences Laboratory
(Producer). Available: http://www.fs.fed.us/database/feis/
U.S. Department of the Interior, National Park Service. 1985. Fire Management Plan, Redwood National Park.
Copy available at park office in Orick, California.
U.S. Department of the Interior, National Park Service. 1990a. Prescribed Fire Effects Monitoring (N-52): 1990
Progress Report, Redwood National Park. Copy available at park office in Orick, California.
U.S. Department of the Interior, National Park Service. 1990b. Western Region Fire Monitoring Handbook.
Western Regional Office. San Francisco, California.
U.S. Department of the Interior, National Park Service. 1992. Bald Hills Vegetation Management Plan. Copy
available at park office in Orick, California.
U.S. Department of the Interior, National Park Service. 1994. Resources Management Plan, Redwood National
Park. Copy available at park office in Orick, California.
U.S. Department of the Interior, National Park Service. 1995. Fire Management Plan, Redwood National Park.
Copy available at park office in Orick, California.
U.S. Department of the Interior, National Park Service. 2003. Fire Monitoring Handbook. National Interagency
Fire Center, Boise, Idaho. 274 pp.
U.S. Department of the Interior, National Park Service. 2005. Fire Management Plan, Redwood National and
State Parks. Copy available at park office in Orick, California.
U.S. Department of the Interior, National Park Service. 2008a. Director’s Order #18: Wildland Fire Management.
National Interagency Fire Center, Boise, Idaho.
U.S. Department of the Interior, National Park Service. 2008b. Reference Manual #18: Wildland Fire
Management. National Interagency Fire Center, Boise, Idaho. 396 pp.
U.S. Department of the Interior, National Park Service. 2008c. South Fork Lost Man Creek Second Growth Forest
Restoration Environmental Assessment, Redwood National Park. Copy available at park office in Orick,
California.
U.S. Department of the Interior, National Park Service. 2010a. Fire Management Plan, Redwood National and
State Parks. Copy available at park office in Orick, California.

45
U.S. Department of the Interior, National Park Service. 2010b. Redwood National Park Fire Management Plan
Environmental Assessment. Copy available at park office in Orick, California.
U.S. Department of the Interior, National Park Service and California Department of Parks and Recreation. 2000.
General Management Plan/General Plan. Redwood National and State Parks. Humboldt and Del Norte
Counties, California. Denver Service Center. Denver, Colorado.
van Wagtendonk, J.W. and D.R. Cayan. 2008. Temporal and spatial distribution of lightning strikes in California in
relation to large-scale weather patterns. Fire Ecology 4 (1): 34 – 56.
Veirs, S.D. 1987. Vegetation studies of Elk Prairie, Prairie Creek Redwoods State Park, Humboldt County,
California. Copy available at park office in Orick, California.
Whittaker, R.H. 1960. Vegetation of the Siskiyou Mountains, Oregon and California. Ecological Monographs 30
(3): 279 – 338.
Wilson, M.V., C.A. Ingersoll, M.G. Wilson, and D.L. Clark. 2004. Why pest plant control and native plant
establishment failed: a restoration autopsy. Natural Areas Journal 24 (1): 23 – 31.
Zobel, D.B. 2002. Ecosystem use by indigenous people in an Oregon coastal landscape. Northwest Science 76
(4): 304 – 314.

46
APPENDICES
A. DATA COLLECTION TOOLS AND REFERENCES
All field reference guides, plant identification books and taxonomic keys are located at the South Operations
Center (SOC) in the Fire Effects office. Redwood’s herbarium is located on the second floor of the building in the
museum collection; James (Bow) O’Barr (Park Curator) and Stassia Samuels (Plant Ecologist) can grant access and
provide further information.
Field equipment is stored within the Fire Effects vehicle, and excess field gear is stored within the Fire
Effects/Vegetation Management cage area in the SOC building.
B. PLANT LIST & VOUCHER COLLECTION
The Fire Ecology program’s voucher collection is located within the Fire Effects office at SOC. The voucher
specimens are split into three binders: dicots, monocots (except Poaceae) and Poaceae. Each voucher specimen
is pressed between two pieces of self sealing adhesive sheets and is arranged alphabetically by family within each
binder.
The Jepson Manual (Hickman 1993) and the Jepson Flora Project’s Jepson Online Interchange
(http://ucjeps.berkeley.edu/interchange/about_interchange.html) are used for naming standards. Each species
has a designated species symbol within FFI, usually a four letter code consisting of the first two letters of the
genus and the first two letters of the species. If there is a subspecies, first letter of the subspecies is added for the
fifth letter in the species symbol. Some species have a number fixed to the end of their species symbol; this
number originates from the USDA Plants Database (http://plants.usda.gov/).
A plant list is compiled from the Redwood FFI database at the beginning of each field season to represent all
species that have been found or observed within plots throughout the years. This list includes the species symbol
used in FFI, family name, common name, scientific name and nativity. An example of the list is included below.

47
Redwood FFI Species List
*exotics highlighted in gray
Species Symbol Family Common Name Scientific Name Native Species
ABGR Pinaceae grand fir Abies grandis TRUE
ACMA3 Aceraceae bigleaf maple Acer macrophyllum TRUE
ACMI2 Asteraceae common yarrow Achillea millefolium TRUE
ACTR Berberidaceae deer foot Achlys triphylla ssp. tryphylla TRUE
ADBI Asteraceae American trailplant Adenocaulon bicolor TRUE
AGCA5 Poaceae colonial bent; colonial bentgrass Agrostis capillaris FALSE
AGGR Asteraceae bigflower agoseris; shortbeak agoseris Agoseris grandiflora TRUE
AGHA2 Poaceae Hall's bentgrass Agrostis hallii TRUE
AGID Poaceae Idaho bentgrass; Idaho redtop Agrostis idahoensis TRUE
AGROS Poaceae Agrostis unknown Agrostis unknown FALSE
AGST2 Poaceae creeping bentgrass Agrostis stolonifera FALSE
AICA Poaceae silver hairgrass Aira caryophyllea FALSE
AMALS Rosaceae Pacific serviceberry; Saskatoon serviceberry Amelanchier alnifolia var. semiintegrifolia TRUE
AMUT Rosaceae Utah serviceberry Amelanchier utahensis TRUE
ANAR7 Poaceae annual vernalgrass Anthoxanthum aristatum FALSE
ANMA Asteraceae pearly everlasting Anaphalis margaritacea TRUE
ANOD Poaceae sweet vernalgrass Anthoxanthum odoratum FALSE
ANTO Apiaceae woolly angelica Angelica tomentosa TRUE
APAN2 Apocynaceae bitterroot; flytrap dogbane; spreading dogbane Apocynum androsaemifolium TRUE
APIAC Apiaceae Apiaceae unknown Apiaceae unknown FALSE
AQFO Ranunculaceae crimson columbine; western columbine Aquilegia formosa TRUE
AREL3 Poaceae tall oatgrass Arrhenatherum elatius FALSE
ARHIG Brassicaceae mountain rockcress Arabis hirsuta var. glabrata TRUE
ARME Ericaceae pacific madrone Arbutus menziesii TRUE
ASCA2 Aristolochiaceae British Columbia wildginger Asarum caudatum TRUE
AVBA Poaceae slender oat; slender wildoat Avena barbata FALSE
AVFA Poaceae flaxgrass; wild oats Avena fatua FALSE
BAPI Asteraceae coyotebrush Baccharis pilularis TRUE
BEAQ2 Berberidaceae mountain grape Berberis aquifolium TRUE
BRCA5 Poaceae California brome; mountain brome Bromus carinatus TRUE
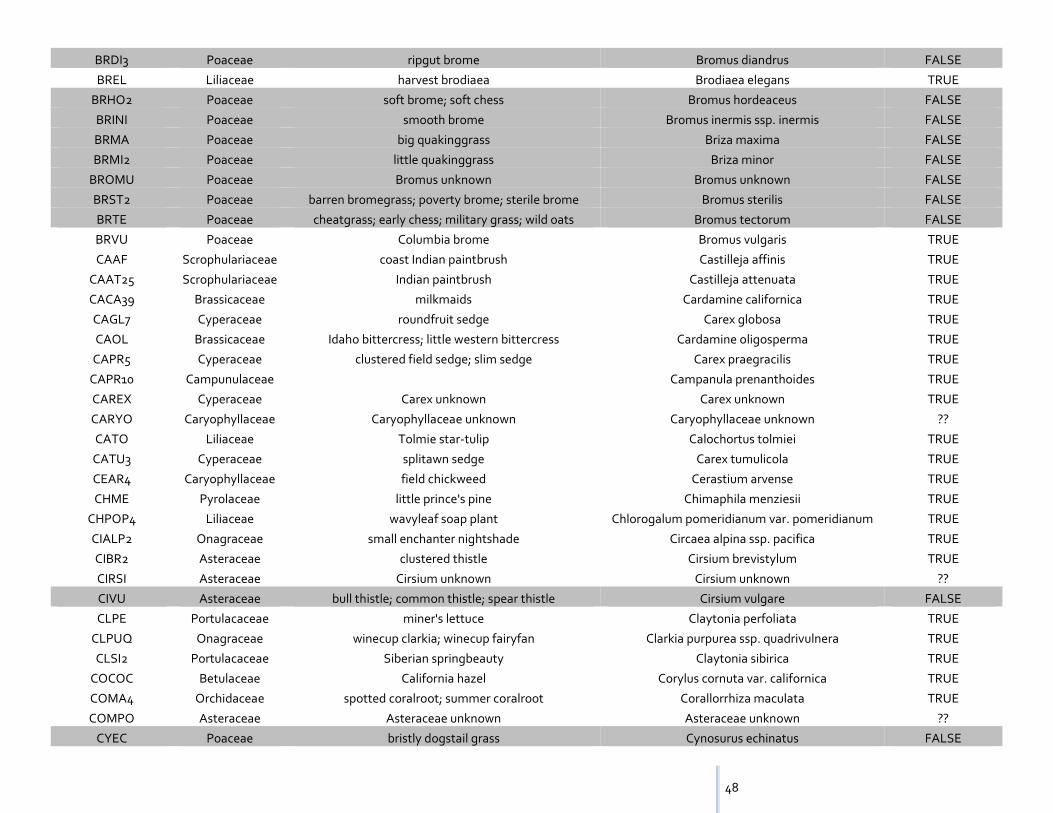
48
BRDI3 Poaceae ripgut brome Bromus diandrus FALSE
BREL Liliaceae harvest brodiaea Brodiaea elegans TRUE
BRHO2 Poaceae soft brome; soft chess Bromus hordeaceus FALSE
BRINI Poaceae smooth brome Bromus inermis ssp. inermis FALSE
BRMA Poaceae big quakinggrass Briza maxima FALSE
BRMI2 Poaceae little quakinggrass Briza minor FALSE
BROMU Poaceae Bromus unknown Bromus unknown FALSE
BRST2 Poaceae barren bromegrass; poverty brome; sterile brome Bromus sterilis FALSE
BRTE Poaceae cheatgrass; early chess; military grass; wild oats Bromus tectorum FALSE
BRVU Poaceae Columbia brome Bromus vulgaris TRUE
CAAF Scrophulariaceae coast Indian paintbrush Castilleja affinis TRUE
CAAT25 Scrophulariaceae Indian paintbrush Castilleja attenuata TRUE
CACA39 Brassicaceae milkmaids Cardamine californica TRUE
CAGL7 Cyperaceae roundfruit sedge Carex globosa TRUE
CAOL Brassicaceae Idaho bittercress; little western bittercress Cardamine oligosperma TRUE
CAPR5 Cyperaceae clustered field sedge; slim sedge Carex praegracilis TRUE
CAPR10 Campunulaceae Campanula prenanthoides TRUE
CAREX Cyperaceae Carex unknown Carex unknown TRUE
CARYO Caryophyllaceae Caryophyllaceae unknown Caryophyllaceae unknown ??
CATO Liliaceae Tolmie star-tulip Calochortus tolmiei TRUE
CATU3 Cyperaceae splitawn sedge Carex tumulicola TRUE
CEAR4 Caryophyllaceae field chickweed Cerastium arvense TRUE
CHME Pyrolaceae little prince's pine Chimaphila menziesii TRUE
CHPOP4 Liliaceae wavyleaf soap plant Chlorogalum pomeridianum var. pomeridianum TRUE
CIALP2 Onagraceae small enchanter nightshade Circaea alpina ssp. pacifica TRUE
CIBR2 Asteraceae clustered thistle Cirsium brevistylum TRUE
CIRSI Asteraceae Cirsium unknown Cirsium unknown ??
CIVU Asteraceae bull thistle; common thistle; spear thistle Cirsium vulgare FALSE
CLPE Portulacaceae miner's lettuce Claytonia perfoliata TRUE
CLPUQ Onagraceae winecup clarkia; winecup fairyfan Clarkia purpurea ssp. quadrivulnera TRUE
CLSI2 Portulacaceae Siberian springbeauty Claytonia sibirica TRUE
COCOC Betulaceae California hazel Corylus cornuta var. californica TRUE
COMA4 Orchidaceae spotted coralroot; summer coralroot Corallorrhiza maculata TRUE
COMPO Asteraceae Asteraceae unknown Asteraceae unknown ??
CYEC Poaceae bristly dogstail grass Cynosurus echinatus FALSE
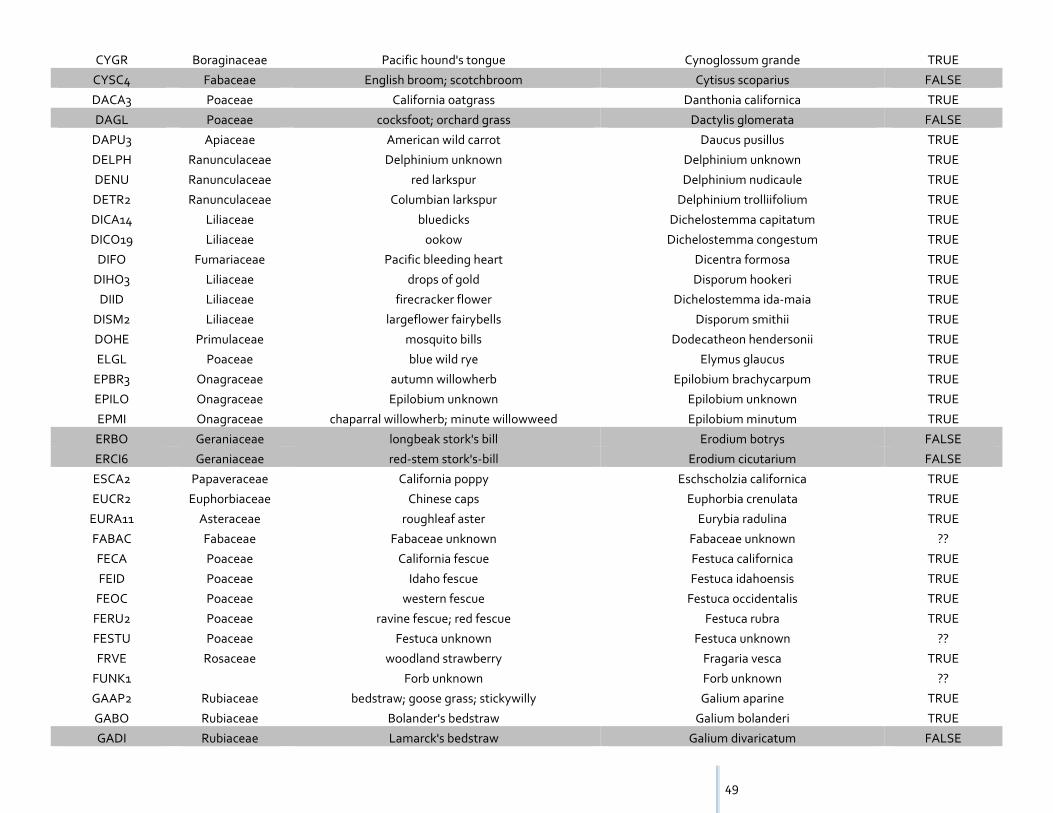
49
CYGR Boraginaceae Pacific hound's tongue Cynoglossum grande TRUE
CYSC4 Fabaceae English broom; scotchbroom Cytisus scoparius FALSE
DACA3 Poaceae California oatgrass Danthonia californica TRUE
DAGL Poaceae cocksfoot; orchard grass Dactylis glomerata FALSE
DAPU3 Apiaceae American wild carrot Daucus pusillus TRUE
DELPH Ranunculaceae Delphinium unknown Delphinium unknown TRUE
DENU Ranunculaceae red larkspur Delphinium nudicaule TRUE
DETR2 Ranunculaceae Columbian larkspur Delphinium trolliifolium TRUE
DICA14 Liliaceae bluedicks Dichelostemma capitatum TRUE
DICO19 Liliaceae ookow Dichelostemma congestum TRUE
DIFO Fumariaceae Pacific bleeding heart Dicentra formosa TRUE
DIHO3 Liliaceae drops of gold Disporum hookeri TRUE
DIID Liliaceae firecracker flower Dichelostemma ida-maia TRUE
DISM2 Liliaceae largeflower fairybells Disporum smithii TRUE
DOHE Primulaceae mosquito bills Dodecatheon hendersonii TRUE
ELGL Poaceae blue wild rye Elymus glaucus TRUE
EPBR3 Onagraceae autumn willowherb Epilobium brachycarpum TRUE
EPILO Onagraceae Epilobium unknown Epilobium unknown TRUE
EPMI Onagraceae chaparral willowherb; minute willowweed Epilobium minutum TRUE
ERBO Geraniaceae longbeak stork's bill Erodium botrys FALSE
ERCI6 Geraniaceae red-stem stork's-bill Erodium cicutarium FALSE
ESCA2 Papaveraceae California poppy Eschscholzia californica TRUE
EUCR2 Euphorbiaceae Chinese caps Euphorbia crenulata TRUE
EURA11 Asteraceae roughleaf aster Eurybia radulina TRUE
FABAC Fabaceae Fabaceae unknown Fabaceae unknown ??
FECA Poaceae California fescue Festuca californica TRUE
FEID Poaceae Idaho fescue Festuca idahoensis TRUE
FEOC Poaceae western fescue Festuca occidentalis TRUE
FERU2 Poaceae ravine fescue; red fescue Festuca rubra TRUE
FESTU Poaceae Festuca unknown Festuca unknown ??
FRVE Rosaceae woodland strawberry Fragaria vesca TRUE
FUNK1 Forb unknown Forb unknown ??
GAAP2 Rubiaceae bedstraw; goose grass; stickywilly Galium aparine TRUE
GABO Rubiaceae Bolander's bedstraw Galium bolanderi TRUE
GADI Rubiaceae Lamarck's bedstraw Galium divaricatum FALSE

50
GALIU Rubiaceae Galium unknown Galium unknown ??
GAPU3 Asteraceae spoonleaf purple everlasting Gamochaeta purpurea TRUE
GASH Ericaceae salal Gaultheria shallon TRUE
GEDI Geraniaceae cutleaf geranium Geranium dissectum FALSE
GEMO Geraniaceae awnless geranium; dovefoot geranium Geranium molle FALSE
GNAPH Asteraceae Gnaphalium uknown Gnaphalium unknown ??
GOOB2 Orchidaceae western rattlesnake plantain Goodyera oblongifolia TRUE
GUNK1 Poaceae Grass unknown Grass unknown ??
HECOT Asteraceae hayfield tarweed Hemizonia congesta ssp. tracyi TRUE
HEMA80 Apiaceae common cowparsnip Heracleum maximum TRUE
HIOC Poaceae California sweetgrass Hierochloe occidentalis TRUE
HODI Rosaceae oceanspray Holodiscus discolor TRUE
HOLA Poaceae common velvetgrass; velvet prom dress! Holcus lanatus FALSE
HYGL2 Asteraceae smooth catsear Hypochaeris glabra FALSE
HYPE Clusiaceae common St Johnswort Hypericum perforatum FALSE
HYRA3 Asteraceae common cat's-ear; false dandelion Hypochaeris radicata FALSE
IRDO Iridaceae Douglas iris Iris douglasiana TRUE
IRISX Iridaceae Iris unknown Iris unknown TRUE
JUBO Juncaceae Bolander's rush Juncus bolanderi TRUE
JUBUB Juncaceae toad rush Juncus bufonius var. bufonius TRUE
JUCO2 Juncaceae Colorado rush Juncus confusus TRUE
JUEF Juncaceae common rush; lamp rush Juncus effusus TRUE
JUNCU Juncaceae Juncus uknown Juncus unknown TRUE
JUPA2 Juncaceae spreading rush Juncus patens TRUE
JUTE Juncaceae field rush Juncus tenuis TRUE
LAMIA Lamiaceae Lamiaceae unknown Lamiaceae unknown ??
LANEN Fabaceae sierra pea Lathyrus nevadensis var. nevadensis TRUE
LAVEO Fabaceae Lathyrus vestitus var. ochropetalus TRUE
LETA Asteraceae hairy hawkbit; lesser hawkbit Leontodon taraxacoides FALSE
LEVU Asteraceae oxeye daisy Leucanthemum vulgare FALSE
LIAN Polemoniaceae false babystars Linanthus androsaceus TRUE
LIAP Apiaceae celeryleaf licorice-root Ligusticum apiifolium TRUE
LIBI5 Linaceae pale flax Linum bienne FALSE
LICA Apiaceae California licorice-root Ligusticum californicum TRUE
LIDED2 Fagaceae tanoak Lithocarpus densiflorus var. densiflorus TRUE
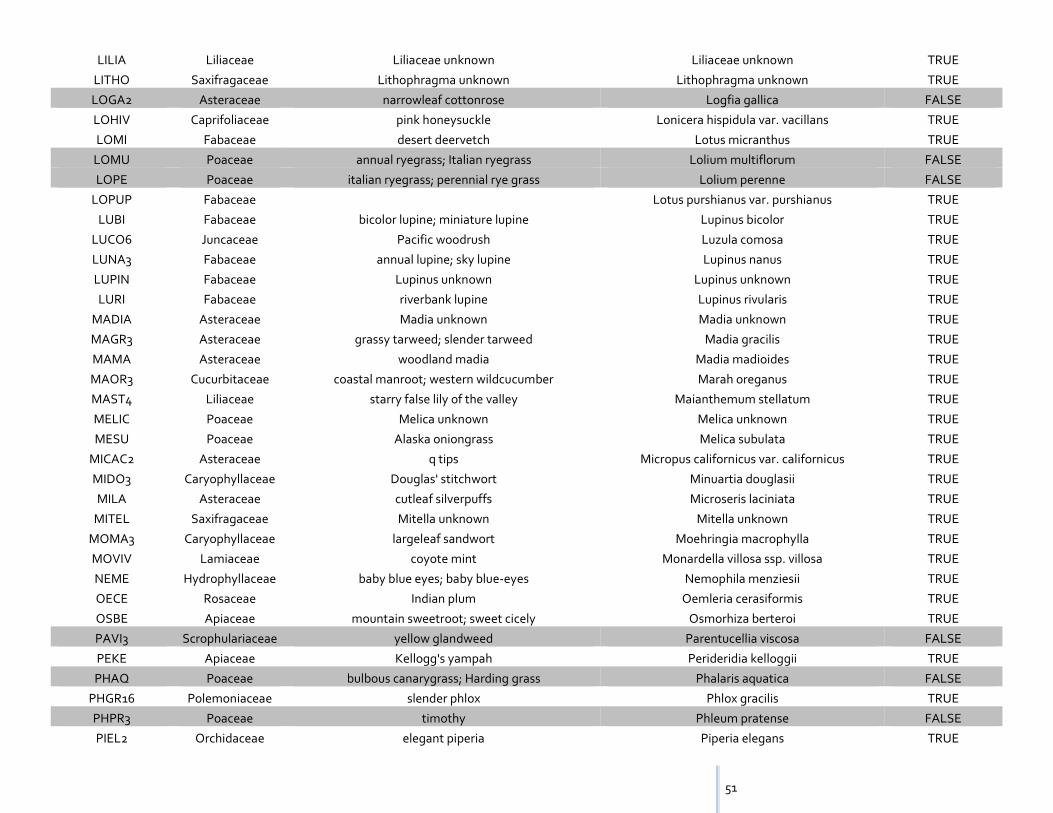
51
LILIA Liliaceae Liliaceae unknown Liliaceae unknown TRUE
LITHO Saxifragaceae Lithophragma unknown Lithophragma unknown TRUE
LOGA2 Asteraceae narrowleaf cottonrose Logfia gallica FALSE
LOHIV Caprifoliaceae pink honeysuckle Lonicera hispidula var. vacillans TRUE
LOMI Fabaceae desert deervetch Lotus micranthus TRUE
LOMU Poaceae annual ryegrass; Italian ryegrass Lolium multiflorum FALSE
LOPE Poaceae italian ryegrass; perennial rye grass Lolium perenne FALSE
LOPUP Fabaceae Lotus purshianus var. purshianus TRUE
LUBI Fabaceae bicolor lupine; miniature lupine Lupinus bicolor TRUE
LUCO6 Juncaceae Pacific woodrush Luzula comosa TRUE
LUNA3 Fabaceae annual lupine; sky lupine Lupinus nanus TRUE
LUPIN Fabaceae Lupinus unknown Lupinus unknown TRUE
LURI Fabaceae riverbank lupine Lupinus rivularis TRUE
MADIA Asteraceae Madia unknown Madia unknown TRUE
MAGR3 Asteraceae grassy tarweed; slender tarweed Madia gracilis TRUE
MAMA Asteraceae woodland madia Madia madioides TRUE
MAOR3 Cucurbitaceae coastal manroot; western wildcucumber Marah oreganus TRUE
MAST4 Liliaceae starry false lily of the valley Maianthemum stellatum TRUE
MELIC Poaceae Melica unknown Melica unknown TRUE
MESU Poaceae Alaska oniongrass Melica subulata TRUE
MICAC2 Asteraceae q tips Micropus californicus var. californicus TRUE
MIDO3 Caryophyllaceae Douglas' stitchwort Minuartia douglasii TRUE
MILA Asteraceae cutleaf silverpuffs Microseris laciniata TRUE
MITEL Saxifragaceae Mitella unknown Mitella unknown TRUE
MOMA3 Caryophyllaceae largeleaf sandwort Moehringia macrophylla TRUE
MOVIV Lamiaceae coyote mint Monardella villosa ssp. villosa TRUE
NEME Hydrophyllaceae baby blue eyes; baby blue-eyes Nemophila menziesii TRUE
OECE Rosaceae Indian plum Oemleria cerasiformis TRUE
OSBE Apiaceae mountain sweetroot; sweet cicely Osmorhiza berteroi TRUE
PAVI3 Scrophulariaceae yellow glandweed Parentucellia viscosa FALSE
PEKE Apiaceae Kellogg's yampah Perideridia kelloggii TRUE
PHAQ Poaceae bulbous canarygrass; Harding grass Phalaris aquatica FALSE
PHGR16 Polemoniaceae slender phlox Phlox gracilis TRUE
PHPR3 Poaceae timothy Phleum pratense FALSE
PIEL2 Orchidaceae elegant piperia Piperia elegans TRUE
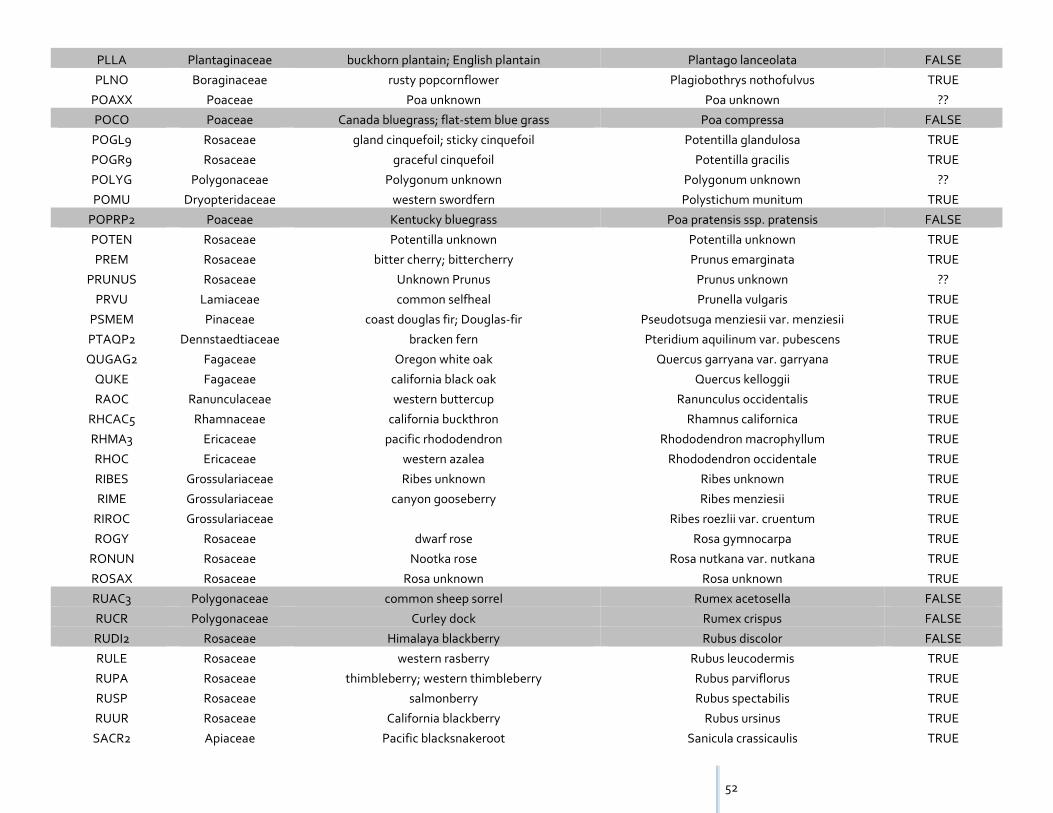
52
PLLA Plantaginaceae buckhorn plantain; English plantain Plantago lanceolata FALSE
PLNO Boraginaceae rusty popcornflower Plagiobothrys nothofulvus TRUE
POAXX Poaceae Poa unknown Poa unknown ??
POCO Poaceae Canada bluegrass; flat-stem blue grass Poa compressa FALSE
POGL9 Rosaceae gland cinquefoil; sticky cinquefoil Potentilla glandulosa TRUE
POGR9 Rosaceae graceful cinquefoil Potentilla gracilis TRUE
POLYG Polygonaceae Polygonum unknown Polygonum unknown ??
POMU Dryopteridaceae western swordfern Polystichum munitum TRUE
POPRP2 Poaceae Kentucky bluegrass Poa pratensis ssp. pratensis FALSE
POTEN Rosaceae Potentilla unknown Potentilla unknown TRUE
PREM Rosaceae bitter cherry; bittercherry Prunus emarginata TRUE
PRUNUS Rosaceae Unknown Prunus Prunus unknown ??
PRVU Lamiaceae common selfheal Prunella vulgaris TRUE
PSMEM Pinaceae coast douglas fir; Douglas-fir Pseudotsuga menziesii var. menziesii TRUE
PTAQP2 Dennstaedtiaceae bracken fern Pteridium aquilinum var. pubescens TRUE
QUGAG2 Fagaceae Oregon white oak Quercus garryana var. garryana TRUE
QUKE Fagaceae california black oak Quercus kelloggii TRUE
RAOC Ranunculaceae western buttercup Ranunculus occidentalis TRUE
RHCAC5 Rhamnaceae california buckthron Rhamnus californica TRUE
RHMA3 Ericaceae pacific rhododendron Rhododendron macrophyllum TRUE
RHOC Ericaceae western azalea Rhododendron occidentale TRUE
RIBES Grossulariaceae Ribes unknown Ribes unknown TRUE
RIME Grossulariaceae canyon gooseberry Ribes menziesii TRUE
RIROC Grossulariaceae Ribes roezlii var. cruentum TRUE
ROGY Rosaceae dwarf rose Rosa gymnocarpa TRUE
RONUN Rosaceae Nootka rose Rosa nutkana var. nutkana TRUE
ROSAX Rosaceae Rosa unknown Rosa unknown TRUE
RUAC3 Polygonaceae common sheep sorrel Rumex acetosella FALSE
RUCR Polygonaceae Curley dock Rumex crispus FALSE
RUDI2 Rosaceae Himalaya blackberry Rubus discolor FALSE
RULE Rosaceae western rasberry Rubus leucodermis TRUE
RUPA Rosaceae thimbleberry; western thimbleberry Rubus parviflorus TRUE
RUSP Rosaceae salmonberry Rubus spectabilis TRUE
RUUR Rosaceae California blackberry Rubus ursinus TRUE
SACR2 Apiaceae Pacific blacksnakeroot Sanicula crassicaulis TRUE
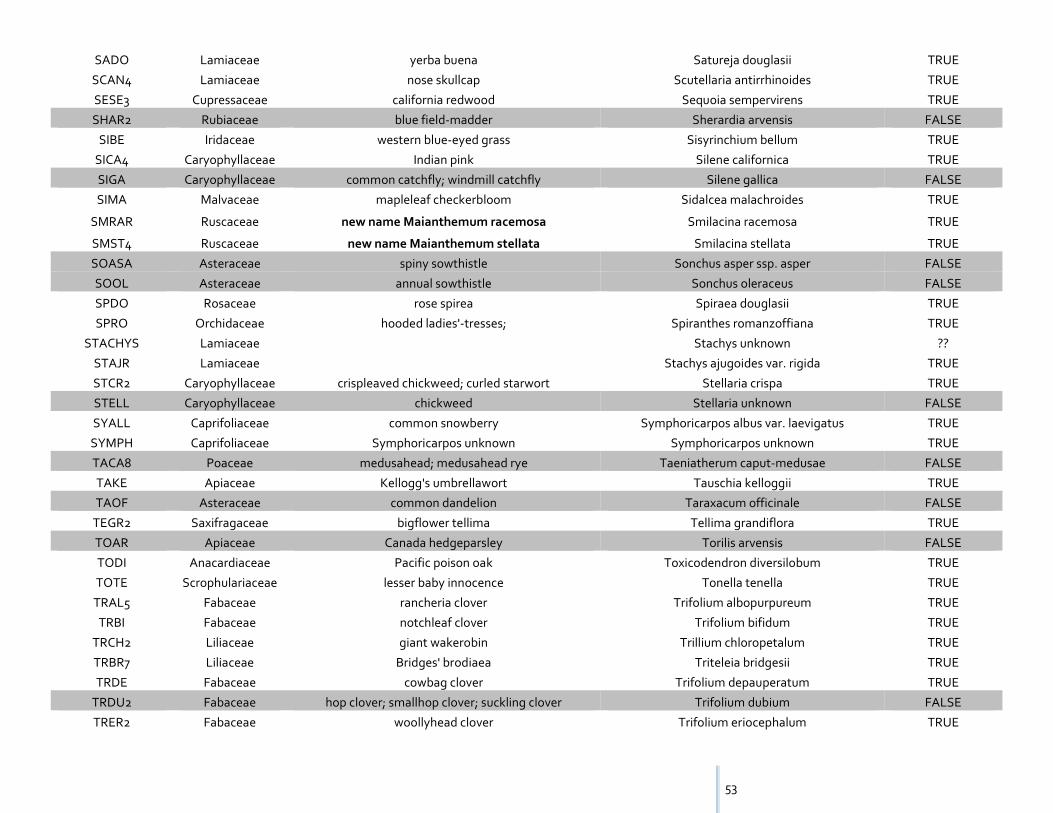
53
SADO Lamiaceae yerba buena Satureja douglasii TRUE
SCAN4 Lamiaceae nose skullcap Scutellaria antirrhinoides TRUE
SESE3 Cupressaceae california redwood Sequoia sempervirens TRUE
SHAR2 Rubiaceae blue field-madder Sherardia arvensis FALSE
SIBE Iridaceae western blue-eyed grass Sisyrinchium bellum TRUE
SICA4 Caryophyllaceae Indian pink Silene californica TRUE
SIGA Caryophyllaceae common catchfly; windmill catchfly Silene gallica FALSE
SIMA Malvaceae mapleleaf checkerbloom Sidalcea malachroides TRUE
SMRAR Ruscaceae new name Maianthemum racemosa Smilacina racemosa TRUE
SMST4 Ruscaceae new name Maianthemum stellata Smilacina stellata TRUE
SOASA Asteraceae spiny sowthistle Sonchus asper ssp. asper FALSE
SOOL Asteraceae annual sowthistle Sonchus oleraceus FALSE
SPDO Rosaceae rose spirea Spiraea douglasii TRUE
SPRO Orchidaceae hooded ladies'-tresses; Spiranthes romanzoffiana TRUE
STACHYS Lamiaceae Stachys unknown ??
STAJR Lamiaceae Stachys ajugoides var. rigida TRUE
STCR2 Caryophyllaceae crispleaved chickweed; curled starwort Stellaria crispa TRUE
STELL Caryophyllaceae chickweed Stellaria unknown FALSE
SYALL Caprifoliaceae common snowberry Symphoricarpos albus var. laevigatus TRUE
SYMPH Caprifoliaceae Symphoricarpos unknown Symphoricarpos unknown TRUE
TACA8 Poaceae medusahead; medusahead rye Taeniatherum caput-medusae FALSE
TAKE Apiaceae Kellogg's umbrellawort Tauschia kelloggii TRUE
TAOF Asteraceae common dandelion Taraxacum officinale FALSE
TEGR2 Saxifragaceae bigflower tellima Tellima grandiflora TRUE
TOAR Apiaceae Canada hedgeparsley Torilis arvensis FALSE
TODI Anacardiaceae Pacific poison oak Toxicodendron diversilobum TRUE
TOTE Scrophulariaceae lesser baby innocence Tonella tenella TRUE
TRAL5 Fabaceae rancheria clover Trifolium albopurpureum TRUE
TRBI Fabaceae notchleaf clover Trifolium bifidum TRUE
TRCH2 Liliaceae giant wakerobin Trillium chloropetalum TRUE
TRBR7 Liliaceae Bridges' brodiaea Triteleia bridgesii TRUE
TRDE Fabaceae cowbag clover Trifolium depauperatum TRUE
TRDU2 Fabaceae hop clover; smallhop clover; suckling clover Trifolium dubium FALSE
TRER2 Fabaceae woollyhead clover Trifolium eriocephalum TRUE

54
TRHY3 Liliaceae white brodiaea; wild hyacinth Triteleia hyacinthina TRUE
TRIFO Fabaceae Trifolium unknown Trifolium unknown FALSE
TRILL Liliaceae Trillium unknown Trillium unknown TRUE
TRLA Myrsinaceae star flower Trientalis latifolia TRUE
TRLA16 Liliaceae Ithuriel's spear Triteleia laxa TRUE
TRMI5 Fabaceae thimble clover Trifolium microdon TRUE
TROL Fabaceae fewflower clover Trifolium oliganthum TRUE
TROV2 Liliaceae Pacific trillium Trillium ovatum TRUE
TRPU16 Scrophulariaceae dwarf owl's-clover Triphysaria pusilla TRUE
TRRE3 Fabaceae Dutch clover; ladino clover; white clover Trifolium repens FALSE
TRSU3 Fabaceae subterranean clover Trifolium subterraneum FALSE
TRWI Fabaceae Trifolium willdenovii TRUE
TRWO Fabaceae cow clover; Sierra clover Trifolium wormskioldii TRUE
UMCA Lauraceae california laurel Umbellularia californica TRUE
UNKN1 Unknown Unknown ??
VAHE Berberidaceae white insideout flower Vancouveria hexandra TRUE
VAOV2 Ericaceae California huckleberry; evergreen blueberry Vaccinium ovatum TRUE
VIAD Violaceae blue violet; hook violet; hookedspur violet Viola adunca TRUE
VIAMA3 Fabaceae American vetch; purple vetch Vicia americana ssp. americana TRUE
VICA5 Vitaceae California grape; California wild grape Vitis californica TRUE
VICIA Fabaceae Vicia unknown Vicia unknown ??
VIGL Violaceae pioneer violet Viola glabella TRUE
VIOLA Violaceae Viola unknown Viola unknown TRUE
VIPR3 Violaceae astoria violet; canary violet Viola praemorsa TRUE
VISA Fabaceae Common Vetch Vicia sativa FALSE
VISE3 Violaceae evergreen violet Viola sempervirens TRUE
VUBR Poaceae brome six-weeks grass; desert fescue Vulpia bromoides FALSE
VUMI Poaceae little fescue; small fescue; twoflower fescue Vulpia microstachys TRUE
VUMY Poaceae foxtail fescue Vulpia myuros FALSE
WHMO Hydrangeaceae common whipplea Whipplea modesta TRUE

55
C. JOB HAZARD ANALYSIS
JOB HAZARD ANALYSIS (JHA) Date: July 29, 2003 New JHA
Revised JHA
Park Unit: Redwood NP Division: Resource Management Branch: Fire Location: South Operations Center
JOB TITLE: Fire Effects Monitor JHA Number: (1) Page __1____of ___2___
Job Performed By:
Fire Effects Monitors & VIPs
Analysis By: Dana Sandifer &
Julie DuBose
Supervisor: Rick Young Approved By:
Required Standards
and General Notes:
Traveling to Vegetation Monitoring Plots (REDW, ORCA, WHIS)
Required Personal
Protective Equipment:
Seat belt, boots, pants, hardhat
Tools and Equipment:
Spare tire, jack, emergency travel kits, automobile & personal first aid kits, radios

56
Sequence of Job Steps Potential Hazards Safe Action or Procedure 1) Travelling to Plots – Road
2) Travelling to Plots – Off-road
a) Basic hazard of driving (#1 cause of
deaths in US)
b) Other drivers
c) Inclement weather, slippery or unsafe
driving surface
d) Road construction, road blocks,
detours
e) Animals in roadway, fallen trees or
debris
f) Fatigued drivers
g) Long hours on the road
h) Lost/off-course
a) Uneven terrain, tripping hazards
b) Potential for getting lost or separated
from crew
c) Inclement/extreme weather conditions
d) Biting insects and animals
e) Falling trees or limbs
a) State-required Defensive Driver course, tailgate
safety before departure
b) Frequent rotation of drivers
c) Check road conditions
d) Carry emergency rations, water, traffic sign, flares,
vest, first-aid kit, sleeping bag, chains, owner’s
manual, GSA credit card
e) Stay aware, drive at a safe speed, listen to concerns
of passengers
f) Know route and planned stops
g) Have back-up plan for multi-vehicle caravan in case
of lost vehicles or stragglers
h) Ensure that all drivers know when and how to
engage 4-Wheel-Drive
a) Wear PPE (high-ankled boots, long pants,
sunscreen, hat, sunglasses, warm clothes, hardhat)
b) Walk in pairs, know route, know how to use map,
compass, GPS – plan for meeting if separation
occurs
c) Carry radios programmed with proper frequencies
d) Know frequencies, groups, and channels for other
parks. Ensure that all employees know how to
operate radios and use proper etiquette.
e) Walk slowly, watching for tripping hazards, snags,
widow-makers, snakes, bees, poison oak, or other
potential biting or dermatitis-causing hazards

57
1. WORK PROJECT/ACTIVITY 2. LOCATION 3. UNIT
REDWOOD NATIONAL PARK Fire Effects Plot Work Klamath Network Parks RMS-Fire
JOB HAZARD ANALYSIS (JHA) 4. NAME OF ANALYST 5. JOB TITLE 6. DATE PREPARED
Julie DuBose Fire Effects Monitor 05-16-06
7. SEQUENCE OF BASIC JOB STEPS 8. POTENTIAL HAZARDS 9. ABATEMENT ACTIONS
Engineering Controls * Substitution * Administrative Controls * PPE
1. Transporting rebar in the field 1. a) Can get caught on tree
limbs/shrubbery if carried in a backpack
b) Possible electrocution if carried during
potential or active lightening storms
c) Potential for impalement or other
injury if tripping occurs
1. a) Watch out for each other. Someone without rebar should walk
ahead of or behind the person carrying rebar in order to disentangle
them when necessary.
b) When lightning is seen or likely to occur, immediately remove rebar
from backpack or hands, move away from the area . If threat persists
longer than reasonable to wait out the storm, leave the rebar and get
another time or day.
c) Walk slowly and carefully. Carry rebar in downhill-side-hand if
walking in steep terrain. If hiking up- or downhill, keep spacing at least
10 feet apart, in order to avoid rebar falling onto another person in case
of a fall or slip.
7. SEQUENCE OF BASIC JOB STEPS 8. POTENTIAL HAZARDS 9. ABATEMENT ACTIONS
Engineering Controls * Substitution * Administrative Controls * PPE
58
2. Installing rebar
2. a) Potential to hit hand/fingers while
pounding in rebar
b) Material may fly into eye
2. a) Wear gloves while installing rebar. Make sure hammer/mini-
sledge is not too heavy to use safely. The hand holding the rebar
steady should be at least six inches below the end that is being
pounded.
b) Wear eye protection when pounding in rebar. Keep head back and
as far away as possible while striking the end with a hammer.
3. Locating rebar in the field (locating plot)
3. a) Tripping hazard
b) Potential contact with dermatitis-
causing plants and insects
3. a) Be aware that rebar may be hidden from view. Walk slowly,
scanning the ground and pulling back bushes while searching. Once
found, flag rebar that is not easily seen.
b) Wear long pants and long-sleeved shirts to avoid contact with
poison oak or other dermatitis-causing vegetation. Try to keep
equipment out of problem vegetation. If contact occurs, wash area
immediately with soap and water, or Technu. Wear fresh uniform each
day if contact is occurring.
7. SEQUENCE OF BASIC JOB STEPS 8. POTENTIAL HAZARDS 9. ABATEMENT ACTIONS
Engineering Controls * Substitution * Administrative Controls * PPE

59
4. Collecting field data
4. a) Tripping, spraining, twisting
b) Contact with dermatitis-causing
plants and insects
c) Bee and wasp stings
d) Branches or other objects poking in
eyes
e) Heat stress, dehydration
4. a) Watch footing and identify hazards to coworkers. Flag hazards if
necessary. Wear proper footgear and other PPE. Take time going up
and down steep slopes or travelling off trail.
b) See abatement procedures for 3b.
c) Watch for wasp nests in trees, holes in ground indicating the
potential for a nest, or yellow-jackets/wasps flying around, indicating a
nest may be in close proximity. Put flagging around a tree containing a
nest, identifying in writing on the flagging what the hazard is. Flag a
large circular area around any ground nests, indicating in writing on the
flagging what the hazard is. Do not work in or around the area once the
hazard has been identified.
d) Wear eye protection. Identify hazards to coworkers. Flag hazards if
necessary.
e) Carry plenty of water for entire day. Drink frequently. Limit intake
of caffeine and other diuretics. Rest if needed.
5. Standing in and hiking through forested
areas with a potential for snags or trees to fall
5. Whole trees or parts of trees falling,
causing injury or death
5. Wear hard hats. Let others know if a threat exists. Post a lookout if
necessary. Avoid walking and working near snags or leaning trees.
10. LINE OFFICER SIGNATURE 11. TITLE 12. DATE
60
D. CUSTOMIZED DATA SHEET EXAMPLES
Page ___ of ___ Park Code:__________
1a. TREES – INDIVIDUALS (METRIC) – OVERSTORY
Plot ID: ___________________ Plot Size: __________________________
Date: _____/_____/_____ Snag Plot Size: _______________________
Project Area: ___________________ Break Point Diameter: 15 Subplot Fraction: 1
Recorders: ____________________________ Burn Cycle: ________ (i.e. 01, 02, 03)
Burn Status (circle one): PRE YR1 YR2 YR3 YR5 YR10 YR20
QTR. Tag Species Status Prev. DBH
(cm)
Prev. Crown
Class
Prev.
Crown
Class
Damage
L/D DBH
(cm)
L D
L D
L D
L D
L D
L D
L D
L D
L D
L D
L D
L D
L D
L D
Crown Class Codes: Damage Codes:
D = Dominant ABGR = Abnormal Growth FORK = Forked Top ROOT = Root
C = Co-Dominant BIRD = Bird (Woodpecker Holes) FRST = Frost Crk. ROTT = Rot
I = Intermediate BLIG = Blight GALL = Galls SPAR = Sparse Foliage
SC = Sub Canopy BROK = Brkn Top HOLW = Hollowed Out SPRT = Sprout. Frm Base
O = Open Growth BROM = Witches Broom INSE = Insects or Signs of TWIN = Twin blw DBH
RS = Recent Snag BURL = Burl LEAN = Tree is Leaning
LBS = Loose Bark Snag CONK = Conk, Shelf Fungus LICH = Lichen UMAN = Human Damage
CS = Clean Snag CROK = Crooked Bole LIGT = Lightning Scar WOND = Wound, Cracks
BAD = Broken Above DBH DTOP = Dead Top MAMM = Mammal Damage
BBD = Broken Below DBH EPIC = Sprouting from Bole/Limbs MISL = Mistletoe Present
DD = Dead and Down EPIP = Epiphytes MOSS = Moss
CUS = Cut Stump FIRE = Fire Scar OZON = Ozone
Date Entered: ____________ Date Checked: ________________
Initials: _____________ Initials: __________

61
Page ___ of ___ Park Code:____________
2a. TREES – INDIVIDUALS (METRIC) – POLES
Plot ID: __________________ Plot Size: __________________________
Date: _____/_____/_____ Snag Plot Size: _______________________
Project Area: ___________________ Break Point Diameter: 15 Subplot Fraction: _____
Recorders: ____________________________ Burn Cycle: ________ (i.e. 01, 02, 03)
Burn Status (circle one): PRE YR1 YR2 YR3 YR5 YR10 YR20
QTR. Tag Species Status
Prev.
DBH (cm)
Prev.
Height (m) Prev. Height (m) L/D DBH
(cm)
L D
L D
L D
L D
L D
L D
L D
L D
L D
L D
L D
L D
L D
L D
L D
L D
L D
L D
L D
L D
L D
L D
L D
L D
Height Ranges (in Meters):
0 - 0.15 = 0.15 2.1 - 3.0 = 3.0 7.1 - 8.0 = 8.0
0.16 - 0.3 = 0.3 3.1 - 4.0 = 4.0 8.1 - 9.0 = 9.0
0.31 - 0.6 = 0.6 4.1 - 5.0 = 5.0 9.1 + = 10.0
0.61 - 1.0 = 1.0 5.1 - 6.0 = 6.0
1.1 - 2.0 = 2.0 6.1 - 7.0 = 7.0
Please record height ranges by using the upper end of the range (bold numbers).
Date Entered: ____________ Date Checked: _________
Initials: _____________ Initials: __________

62
6. SURFACE FUELS (ENGLISH) Park Code:________
Plot ID: _______________________ Date: _____/_____/_____ Burn Unit: ___________________
Recorders: ___________________________ Burn Cycle: ________ (i.e. 01, 02, 03)
Burn Status (circle one): PRE IM. POST (month____) YR____(1, 2, 5, 10, 20)
1hr 10hr 100hr 1000hr hits 3.1"+ 1000hr hits 3.1"+ Litter and Duff Depths
hits hits hits Decay Class 3 (Sound) Decay Class 4 (Rotten)
0-.25” .25-1” 1-3” old new old new L D Veg L D Veg
Transect 1 1 35
Az: _____ 5 40
10 45
Slope% 15
______ 20
25
30
1hr 10hr 100hr 1000hr hits 3.1"+ 1000hr hits 3.1"+ Litter and Duff Depths
hits hits hits Decay Class 3 (Sound) Decay Class 4 (Rotten)
0-.25” .25-1” 1-3” old new old new L D Veg L D Veg
Transect 2 1 35
Az: _____ 5 40
10 45
Slope% 15
______ 20
25
30
1hr 10hr 100hr 1000hr hits 3.1"+ 1000hr hits 3.1"+ Litter and Duff Depths
hits hits hits Decay Class 3 (Sound) Decay Class 4 (Rotten)
0-.25” .25-1” 1-3” old new old new L D Veg L D Veg
Transect 3 1 35
Az: _____ 5 40
10 45
Slope% 15
______ 20
25
30
1hr 10hr 100hr 1000hr hits 3.1"+ 1000hr hits 3.1"+ Litter and Duff Depths
hits hits hits Decay Class 3 (Sound) Decay Class 4 (Rotten)
0-.25” .25-1” 1-3” old new old new L D Veg L D Veg
Transect 4 1 35
Az: _____ 5 40
10 45
Slope% 15
______ 20
25
30
Date entered:______________ Date checked:________________
Initials:__________ Initials:___________

63
FMH-22 REDW GRASS PLOT BURN SEVERITY (Metric)
Plot ID: _________________________________ B / C Date: ______________
Burn Unit: _______________________________ Recorders: __________________________________
Burn Status: (Indicate number of times treated) _______ Post
Record severity every 1.5m. Each observation is from a 4dm square area.
FMH Point
Meter Point SUBSTRATE VEGETATION
5 1.5
10 3.0
15 4.5
20 6.0
25 7.5
30 9.0
35 10.5
40 12.0
45 13.5
50 15.0
55 16.5
60 18.0
65 19.5
70 21.0
75 22.5
80 24.0
85 25.5
90 27.0
95 28.5
100 30.0
Severity Ratings:
5 = Unburned 2 = Moderately Burned
4 = Scorched 1 = Heavily Burned
3 = Lightly Burned 0 = Not Applicable
64
FMH Forest Plot Densiometer Data Sheet
Y = canopy, N = no canopy
P1-P2 line Y or N 0P-50P line Y or N
2m 4m
4m 6m
6m 8m
8m 10m
12m 12m
14m 14m
16m 16m
18m 18m
20m
Plot:_______________________________ 22m
Date:_______________________________ 24m
Plot Read Status:____________________ 26m
Burn Unit:___________________________ 28m
UTM Datum:__________ 30m
UTM E:______________________ 32m
UTM N:______________________ 34m
36m
38m
40m
42m
44m
46m
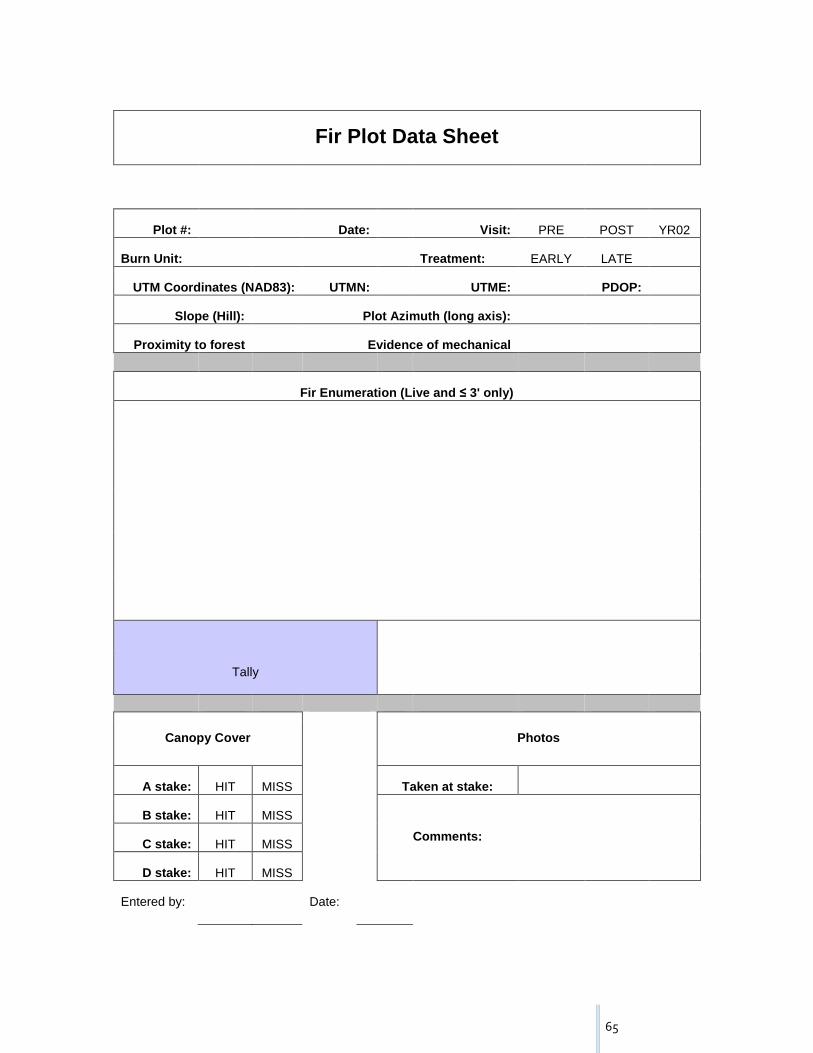
65
Fir Plot Data Sheet
Plot #: Date: Visit: PRE POST YR02
Burn Unit: Treatment: EARLY LATE
UTM Coordinates (NAD83): UTMN: UTME: PDOP:
Slope (Hill): Plot Azimuth (long axis):
Proximity to forest Evidence of mechanical
Fir Enumeration (Live and ≤ 3' only)
Tally
Canopy Cover Photos
A stake: HIT MISS Taken at stake:
B stake: HIT MISS
Comments:
C stake: HIT MISS
D stake: HIT MISS
Entered by: Date:

66
E. FFI USER GUIDE
FFI Mumblings
Directions:
1. Turn on desktop computer in Fire Effects office, give it time to boot up to the log in screen before trying to open
FFI on any computer other then the desktop. This is our master database computer and must be on for FFI to
work; you do not have to be logged into the master computer while using FFI.
2. Double click on the FFI icon on desktop. Note that there will also be FFI Database Administration and Protocol
Builder icons, you want just the FFI icon!
3. FFI Database Select window will open; choose INPREDW105504/SQLEXPRESS from the first drop down list.
Should this not appear in the drop down list the master computer is not on or fully booted up yet; or you’ve just
crashed the system and we’ve lost 20 years of data (not really).
4. Enter your user name and password.
5. If it locks up on the first letter of your password, something is wrong, close FFI and talk to Becky or Jen.
6. After you’ve entered your password, be patient and eventually the Select or enter a database name: pull down
list will populate. Choose which fun filled database you’d like to enjoy. Hit OK. Please only work in FFI_REDW,
FFI_ORCA and FFI_WHIS unless you’re told otherwise.
7. The FFI Administrative Unit window will then open and the database you’re trying to open should be listed.
Select it, hit CONTINUE.
8. Patience is virtue, Grasshopper.
9. FFI will open to the Project Management page
Common Shrub Belt (Density Belt) Subplot Fractions
Dimensions # of Transects Square Meters Subplot Fraction
50 x 1 1 50 0.05
50 x 1 2 100 0.1
50 x 2 1 100 0.1
50 x 2 2 200 0.2
50 x 5 1 250 0.25
50 x 5 2 500 0.5

67
Common Seedling Belt (Density Quadrat) Subplot Fractions
Dimensions # of Transects Square Meters Subplot Fraction
5 x 10 1 50 0.05
25 x 10 1 250 0.25
50 x 20 1 1000 1
How to set up a new macro plot in FFI:
1. Start in the Project Management page.
2. Highlight the monitoring type you would like to add a plot to (FQUGA1D09, GMIPR1D03, FQUKE1D09…)
3. Select the New dropdown menu in the top left corner of the screen (directly above the list of monitoring types).
From the New menu select Macro Plot.
4. Starting at the top of the screen you will enter a name for the new macro plot; it should be something like this:
GMIPR1D0399 with the last two numbers being the plot number.
5. Select Grassland, Forest, or Shrubland from the Type dropdown menu.
6. Leave Purpose blank.
7. Under Site Characteristics please enter all available information. Please note that elevation is in meters!
8. Under Location please enter all information available, most importantly UTMs in NAD83, please only enter
NAD83 UTMs for now (do not enter NAD27)!
9. Under Installation please enter an Installation Date (make sure this is the date it was installed and not the day
you’re entering the data).
10. Enter all crewmembers who were involved in Located By:.
11. Under the Directions area please enter full directions from the FMH-5. Leave Start Point blank.
12. Move on to the Metadata tab and please enter the burn unit where plot was installed, such as: Copper Creek
Burn Unit.
13. Continue on to the Comments tab and enter the burn unit again, exactly as you typed it under the Metadata tab.
14. Lastly hit Save at the top. It may take a few moments, but your new Macro Plot should then appear on the left
hand side of the screen under the correct Monitoring Type.
How to set up a new plot sampling event:
1. In the Project Management page select the Macro Plot (on the left) you would like to add a sampling event to.
2. Select the New dropdown menu in the top left corner of the screen (directly above the list of monitoring
types/macro plots). From the New menu, select Sample Event.
3. Once the Sample Event page appears enter the correct date the plot was read.

68
4. Ensure the correct Macro Plot is listed.
5. Under the Protocols tab select the Add/Remove Protocols button (it is not intuitive and does not look like a
button!).
6. When the Protocol Selector window opens highlight the protocol under the Available Protocols that you will
need to enter information into, and hit the >> button in the middle to move it to the Assigned Protocols.
7. Here is a guide of what data goes into what protocol:
a. 30 and 50m veg. transect = Cover – Points (metric)
b. Species observed on above veg. transect = Cover – Species Composition
c. Shrub belts = Density – Belts (metric)
d. Seedlings = Density – Quadrats (metric)
e. Browns or Grassland post burn severity points = Postburn Severity (metric)
f. Browns transects = Surface Fuels (be careful not to select the metric option!)
g. Overstory and pole size trees = Trees – Individual (metric)
h. Immediate postburn tree data = Trees – Individual (metric)
8. Once you have selected all of the protocols you will need to enter data into, hit OK and the Protocol Selector
window will close and the chosen protocols should then be listed.
9. Under the Team tab please add all crewmembers’ names that were involved in data collection.
10. Once completed hit Save at the top of the screen and wait until the new sampling event has appeared under the
correct Macro Plot on the left side of the screen.
How to enter a plot into FFI from start to finish:
Browns Transects
1. Browns transect data are entered under the Surface Fuels (double check it is NOT the metric protocol!) tab.
2. Start at the top with Fine Woody Debris (in small blue lettering).
3. Number of transects should be 4, assuming it’s a typical FMH forest plot.
4. 1 hr Transect Length: 6’
5. 10 hr Transect Length: 6’
6. 100 hr Transect Length: 12’
7. Transect column is what transect it is, typically 1-4.
8. Azimuth is the azimuth of each transect.
9. Slope is the slope of each transect.
10. 1, 10 and 100 hr count columns are simply the tally of each for each transect.
11. Next go to the lower left hand corner to Coarse Woody Debris, a.k.a. 1000 hours.
12. Number of transects should be 4.
13. Transect length should be 50.
14. Transect column is what transect the 1000 hour is found on.
15. The slope relates to the slope of the specific transect entered into column 1.
16. Do not worry about log number.
17. Enter diameter of 1000 hour log, it must be at least 3.1 or greater, do not enter 3.0 logs!
18. Decay class discerns if it is a solid or rotten log. Please use decay class 3 for solid logs and decay class 4 for rotten
logs until further notice.
19. Enter the foot mark where the log is found on the transect in the comment column like so: @21’
20. Move on to the Duff and Litter section in the lower right hand corner.
21. Transect is again 1-4.

69
22. Sample location will be 1, 5, 10, 15, 20…
23. The Off Set column should be placed at Yes if reading is taken at a spot other than at the actual tape measure
point (if there’s a rock, rotten log, stump in way…).
24. Enter litter depth and duff depth into appropriate column.
25. Hit save and hope for no red exclamation points!
Veg. Transect
1. Veg. transects get entered under the Cover - Points (metric) tab.
2. Number of Transects: 1 or 2, depending on how many are read for a plot…
3. Transect length: 50m transect = 49.8 (it is important to enter specifically 49.8 otherwise the numbers get funky
towards the bottom), 30m transect = 30
4. Num. Points/Tran: 50m transect = 166, 30m transect = 100
5. Q4-Q1 transect is always transect 1!! This would then make Q3-Q2 transect #2.
6. Actually entering data:
a. Starting in the far left column, Transect, will always be 1 or 2, I suggest starting with 1 if there are
multiple.
b. Point is the point # (1-166 or 1-100). It will not let you enter anything in the tape column; it will
automatically increase itself 0.3 m for each new point after you hit return.
c. Order number is the order plants are on the datasheet if there are multiple plants at each point (i.e. at
point 3, tape 0.9, height of 0.05 with ROGY and then WOOD, ROGY would be Order 1, and WOOD would
be 2).
d. Height is the height of the first species found at that point, if there are multiple species per point, the
second species gets a height of 0. Please ensure this 0 gets entered for data uniformity, do not leave this
column blank. If the species does not have a height, such as LITT or ROCK, please enter a 0.
e. Species is where you actually type in the four letter code for the species. Watch out, it likes to fill things
in for you and it can be utterly frustrating getting it to enter the species you actually want! Don’t fret if
there is a number behind the code. FFI will not allow you to enter any funky four letter codes; if it’s not
in our plant database you cannot enter it! If you cannot find the four letter code that is listed on the
field data sheet, start by checking this website which is the Jepson Online Interchange:
http://ucjeps.berkeley.edu/interchange/ I would recommend trying to enter the Genus if you can figure
it out, and then search for the species that corresponds. If you’re entering old data the name has most
likely changed and it will tell you this under the taxonomic details on the website of each species. DO
NOT enter new plants into our database without talking to Becky or Jen first!
f. Status is L or D for Live or Dead. Ensure that all non living things such as LITT, WOOD, ROCK are entered
as D! BOLE is L and there will occasionally be plants listed as D. Remember that dead annuals are always
entered as “L.”
g. When you hit enter it will start the next row, transect, point, tape and status columns will automatically
populate.
h. If there is an unknown that cannot be identified to at least species it will be entered into FFI as GUNK1
or FUNK1. NEVER add a new FUNK or GUNK to the species list!
7. Hit save and hope for no red exclamation points!
8. If there are any species observed (exotics only, within 5 meters of the line) go to the “Cover-Species
Composition (metric)” tab.
9. Please use 0.1 for the Minimum Cover Level at the top of the form.
10. Enter the species code for the plant; leave the rest of the columns blank.

70
Seedlings
1. Seedlings are entered under the Density – Quadrats (metric) tab.
2. Number of Transects: 1
3. Number of Quad./Tran.: 1
4. Length is 5, width is 10, unless all of Q1 was used, at which point it would be length: 25, width 10
5. Multiply length and width to get Quad. Area.
6. Transect and Quad columns will each be 1, unless again there were multiple areas where data were taken.
7. Item code is seedling spp.
8. Status is live or dead (L or D)
9. Please leave Size Class and Age Class empty.
10. Count is the number/tally of seedlings for each class.
11. Height is in actual meters, DO NOT USE the height code here! Please use the top end of each height code, i.e.
height code 5 = 2m, height code 1 = 0.15 (this is a moot point with new 2009 data sheets…)
12. Subplot fraction is VERY IMPORTANT! Simply take your Quad Area from above and divide by 1000. So, if our
seedling quad is 5 x 10, or 50 square meters, the subplot fraction is 0.05. Please see chart on page two for quick
subplot fraction reference!
13. Hit save and hope for no red exclamation points!
Shrubs
1. Shrubs are entered into the Density – Belts (metric) tab.
2. Number of transects will be one or two.
3. Number of Subbelts will be how many times the belt was broken up, usually into 5m sections (for a 30m belt this
would be 6, for a 50m belt this is usually 10).
4. Transect length should be 30 or 50.
5. Transect width should be listed on the data sheet, if it’s not please ensure you find this data out and then write
it on the data sheet!
6. Transect Area is the length times the width (30 x 10m belt would be 300, 50 x 2 would be 100…)
7. If there are two shrub belts, the Q4-Q1 belt will always be Transect 1; it is also this way for the veg. transects!
8. Item Code is the shrub species, again please do not add species to our database without talking to Jen or Becky
first!
9. Status is L for Live and D for Dead.
10. Leave size class blank.
11. Age Class will be I for Immature, M for Mature and R for Resprout.
12. Count is the tally for that species and size class, live or dead for each subbelt.
13. Please leave Height blank.
14. Subplot fraction is again very important. Please refer to the table on the first page of this long winded
document to ensure you are using the correct subplot fraction for the correct size shrub belt!
15. When you are complete make sure you hit Save at the top of the page. It will not allow you to change
tabs/protocols until the information is saved or the entire page is blank. Hope for no angry red exclamation
points!

71
Trees, Overstory and Pole
1. Overstory and pole size trees are entered into the Trees – Individual (metric) tab.
2. Plot size is 0.1 (1000m = 1/10 of a hectare)
3. Snag plot size is 0.1
4. Break Pnt. Diameter is 15 (meaning that all trees 15 cm dbh and less are pole, 15.1 is overstory).
5. Quarter column on far left is whatever quarter the tree is in (1-4).
6. Subplot fraction: overstory trees will be 1, (assuming overstory are recorded within entire plot), pole size trees
will be 0.25, 0.5 or 1 (if pole size tree data are collected only in Q1, use 0.25 – or ¼ of the plot, if poles are
recorded in Q1 and Q2 – which is rare, use 0.5, and if pole data were collected in the entire plot (all quarters)
use 1).
7. Tag number is hopefully obvious. If there is no tag number, please enter 0 as I don’t think FFI will allow you to
leave it blank.
8. Species is the species of tree.
9. Status is L or D or live or dead, we don’t use the other options they give you.
10. DBH should be obvious. You MUST enter a DBH, it is the only way to filter overstory versus pole size trees for
analysis purposes! If there is no DBH listed please look at the data sheets from the most previous read and use
those DBHs. This is applicable even is the tree is dead!
11. Height is only used for pole size trees. Please enter a height in meters, not the height code. Please use the
upper end of the height code, i.e. height code 8 = 5m. This again a moot point with the new 2009 datasheets.
12. We do not currently use crown ratio on traditional FMH plots.
13. Crown class will be D = dominant, C = codominant, LBS = loose bark snag; it will not allow you to use numbers in
this column.
14. If entering burn severity such as scorch height, percent or char height scroll to the right until you find the
columns labeled as such (they are right before the damage code columns).
15. If there are damage codes on the data sheet please make sure to enter them, scroll to the right until you find
these. There is room for 5 damage codes; we do not currently use the damage severity column related to each
damage code.
16. If you are entering a REDW QUGA plot and there are notes about how many live and dead stems are included in
the tagged tree clump (hopefully you’ll find this information on data sheets starting in 2009) please enter this
information into the columns titled ‘Num. Live Stems’ and ‘Num. Dead Stems’.
17. Hit save and hope for no red exclamation points!
Immediate Post Burn Data:
1. Most of the time you will need these protocols for a forest plot immediate post burn read:
a. Postburn Severity (metric)
b. Surface Fuels
c. Trees – Individuals (metric)
2. If it is a grass plot you will only need Postburn Severity (metric).
3. Once the new read is set up with protocols, navigate to the data entry and edit section.
4. Surface Fuels are entered the same way.
5. Postburn Severity:
a. Number of Transects: 4 for forest, 1 for grass
b. Transect Length: 50 for forest, 30 for grass
c. Number of Points/Transect: 10 for forest, 20 for grass
72
d. Plot Type: Forest or Grass
e. Point Area: 400 (this is a 2dm x 2dm area)
f. Transect Number will be 1-4 for forest, 1 for grass
g. Point will be 1-10 for forest, 1-20 for grass
h. Tape column indicates what mark on the tape the reading is being taken
i. Vegetation and Substrate are numbers 0-5 relating to the burn severity
6. Trees – Individual
a. All trees will be entered as they are for other reads. All trees need to have a tag number, and most
importantly, a DBH! To enter the scorch height, percent and char height scroll numerous columns to the
right. They will be found immediately before the damage codes.
How to quality check a plot in FFI from start to finish:
1. In lower left hand corner, select Data Entry and Edit.
2. Navigate to the Monitoring Type and then to the plot. Example: You want to quality check BSAGE1D06-55;
maximize BSAGE1D06, and then maximize B:BSAGE1D06:55.
3. Click on the specific sample event, listed by date in this format: year/month/date, which you would like to
quality check.
4. Quality check data for errors. Should you happen to find an error, make the necessary changes and then hit
Save, which is located in the upper left corner of the big window, directly below the protocol tabs.
5. It may give you a warning that it is unable to save due to errors on the form. We hope that wherever the error
is, a small red circle with an exclamation point will appear. This does not always happen. If you’re not able to
figure out where the error is and it won’t let you save, hit Cancel. This means you now have to try to redo your
changes.
6. Things to look for:
a. Take time to specifically look at subplot fractions, and Browns transect 1000 hours. Commonly if you
are quality checking old data that was imported from FEAT these two things will need to be changed.
See tables above to find correct subplot fraction. For plots that were imported from FEAT (anything
2007 and earlier) and if there are multiple 1000 hours but not all transects are represented, FFI usually
messed up the transect number where the log was found. Please ensure that the far left column
‘Transect’ matches what transect it says in the farthest right column ‘UV3’ (it will say something like
Fuel1 or Fuel3 meaning transect 1 and transect 3).
b. Also check out the Cover – Points (metric) form to ensure that all LITT, ROCK and other non-plants have
a D for dead in the Status column.
c. Please check to make sure that the burn unit where the plot is located got entered into the Metadata
and Comments within the Project Management section.
d. Check to make sure if it’s a 50m veg. transect, the top of the form it actually says 49.8 for Transect
Length – otherwise you’ll notice funny tape numbers such as 48.09 towards the end.
How to produce a pretty plot spp. list:
1. Enter FFI.
2. Click on Query at the bottom of the left hand menu.
3. Once in Query start at the left and work your way to the right, with Method and the protocol drop down list.

73
4. Choose Cover – Points (metric) from drop down list, and then highlight (by clicking) Cover – Points (metric) from
list below when it appears.
5. Under Macroplot highlight the macroplot that you’d like to produce a list for; it is possible to highlight more
than one, so be careful that you only highlight what you want!
6. Under Sample Event and Monitoring Status highlight all; this will ensure that all reads are represented on the
report.
7. Now go to the Additional/Calculated Fields tab.
8. Under Species Field click boxes: Scientific Name, Common Name and Nativity.
9. Go to the Grouping and Summary Calculations Tab
10. Under Macroplot Group By click the Macroplot box.
11. In Species Attributes click Species.
12. Click on the top of the Species Symbol column to alphabetize query.
13. Go to the top of the page and hit export. Save it somewhere where you can find it and please put at least the
plot number at the end so we can differentiate between the different plots.
14. Navigate to where you saved it, do a Save As. Change document name into something meaningful such as
FBUGR1D55-09 (plot name) Spp. List 1999, also change document type to Microsoft Office Excel Workbook.
15. Please then put a nice header at the top of the plot name, delete the macroplot column after you’ve identified
the plot in the top header and delete the Row Count column. Make all columns wide enough to read and fit on
one page, landscape orientation. Please save this document in the appropriate Park folder, Spp. List folder
within the Fire Effects Folder on the S:// drive.
How to produce a pretty overstory, pole or immediate postburn tree data sheet:
1. Enter FFI.
2. Click on Query at the bottom of the left hand menu.
3. Once in Query start at the left and work your way to the right, starting under Method and the protocol drop
down list.
4. Choose Trees – Individual (metric) from drop down list, and then highlight (by clicking) Trees – Individual
(metric) from list below when it appears.
5. Under Macroplot highlight the macroplot that you’d like to produce a list for; it is possible to highlight more
than one, so be careful that you only highlight what you want!
6. Under Sample Event and Monitoring Status please find the most recent read with tree data. HINT: this will NOT
be a POST read!
7. Under Species please check the boxes ‘Exclude non-vascular:’ and ‘Exclude trees dead/down:’.
8. Click on the top of the Quarter (QTR) column so that all trees in Q1 are at the top of the query.
9. Go to the top of the page and hit export. Save it somewhere where you can find it and please put at least the
plot number at the end so we can differentiate between the different plots.
10. Navigate to where you saved it, open it and delete ALL columns, except for these from the spreadsheet: Species
Symbol, QTR, SubFrac, TagNo, Status, DBH, Height, CrwnCl, and DamCd1, DamCd2, Dam Cd3.
11. Once all unnecessary columns are deleted, center all data in the columns/rows so it looks a little prettier.
12. Now determine what field data sheet you’ll be pasting this information into; will it be overstory, poles or
immediate post burn?
13. If you are creating an overstory sheet, either look at the Height or SubFrac column to determine which are poles
and which are overstory trees. Please cut and paste all poles to a new excel spreadsheet to get out of your way.
Poles will most likely always have a height, where as overstory trees should never have a height. Poles will not
have damage codes.

74
14. Once it has been determined which trees are poles, and they have been removed, the Height and SubFrac
columns can be deleted. Please double check for trees that have the crown class DD, these are dead and down
trees and we do not want them on the data sheet.
15. Select the entire excel page (this is very important, all columns of data must be selected or you will have to start
over from step one!) and under the Data menu choose sort. Sort by Quarter column (ascending order), then by
Tag Number (ascending). If you have a header column, which you should, please choose this option and the
header should un-highlight. Once OK is clicked the page should be sorted by quarter and then tag number.
16. Now the data needs to end up in the same column order as the field data sheet, so cut and paste the Species
Symbol column between the TagNo and Status columns. Insert an extra column between Species and Status,
Status and DBH, and DBH and Crown Class. In a nutshell this is the order that columns should be in on the excel
sheet: Quarter, Tag, Species, blank, Status, blank, DBH, blank, Crown Class, Damage Codes.
17. Now go to S://drive, fire effects folder, FFI folder, Datasheets folder, Excel folder. Open the Overstory Tree field
data sheet. Please immediately do a ‘Save As’ and rename it with the plot name.
18. Now simply cut and paste data from excel sheet into data sheet. Please ensure that all data transfers and ends
up in the correct column on the data sheet. Please cut and paste the L and D back into the Status column.
Please fill out the top part of the data sheet as much as possible, with at least the Plot ID filled out.
19. Once all data is on the data sheet, save and print out to take into the field.
20. Producing a pole data sheet is very similar, except that you will need the height column. You will not need the
crown class and damage code columns.
21. Insert an extra column between Species and Status, Status and DBH, and DBH and Height. To review, your excel
sheet should have the columns in this order: Quarter, Tag, Species, blank, Status, blank, DBH, blank, Height.
22. Again, sort the data by quarter and then by tag number. Copy and paste into pole data sheet and print out.
23. For an Immediate Postburn Tree data sheet, follow the above guidelines except delete height, crown class and
damage columns.
24. Organize excel spreadsheet in this way: Quarter, Tag, Species, blank, Status, blank, DBH
25. Again please cut and paste, fill out top of data sheet, save and print.
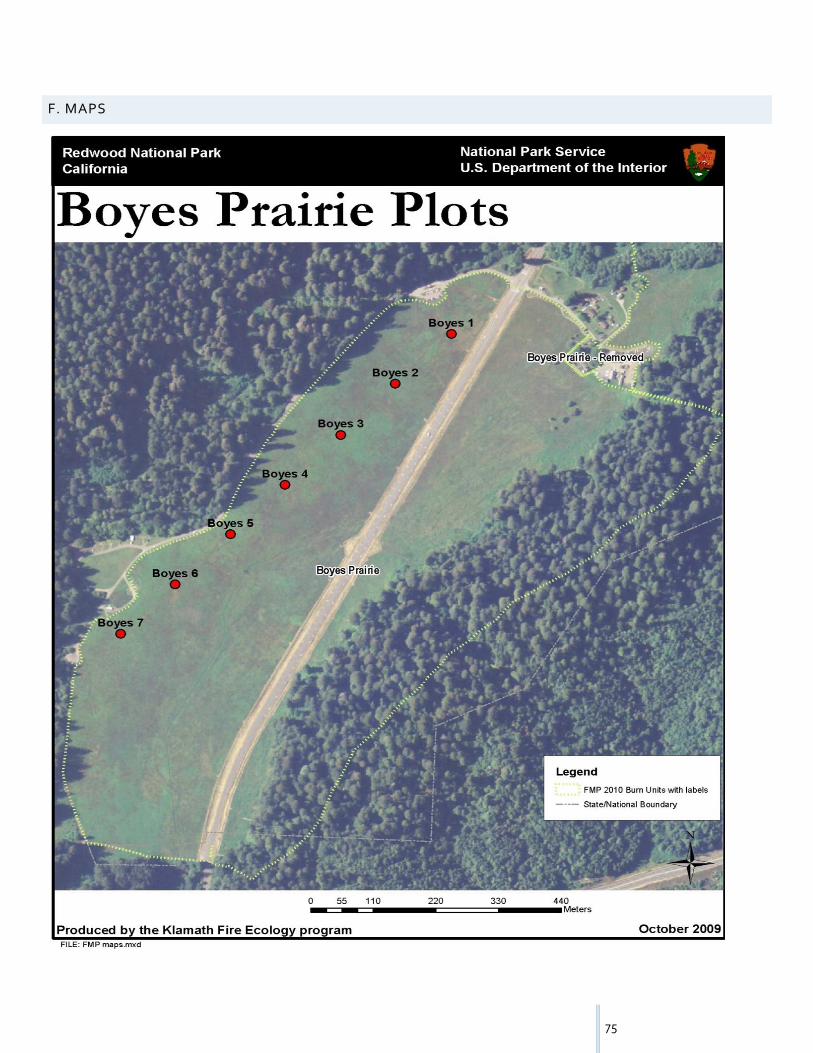
75
F. MAPS

76
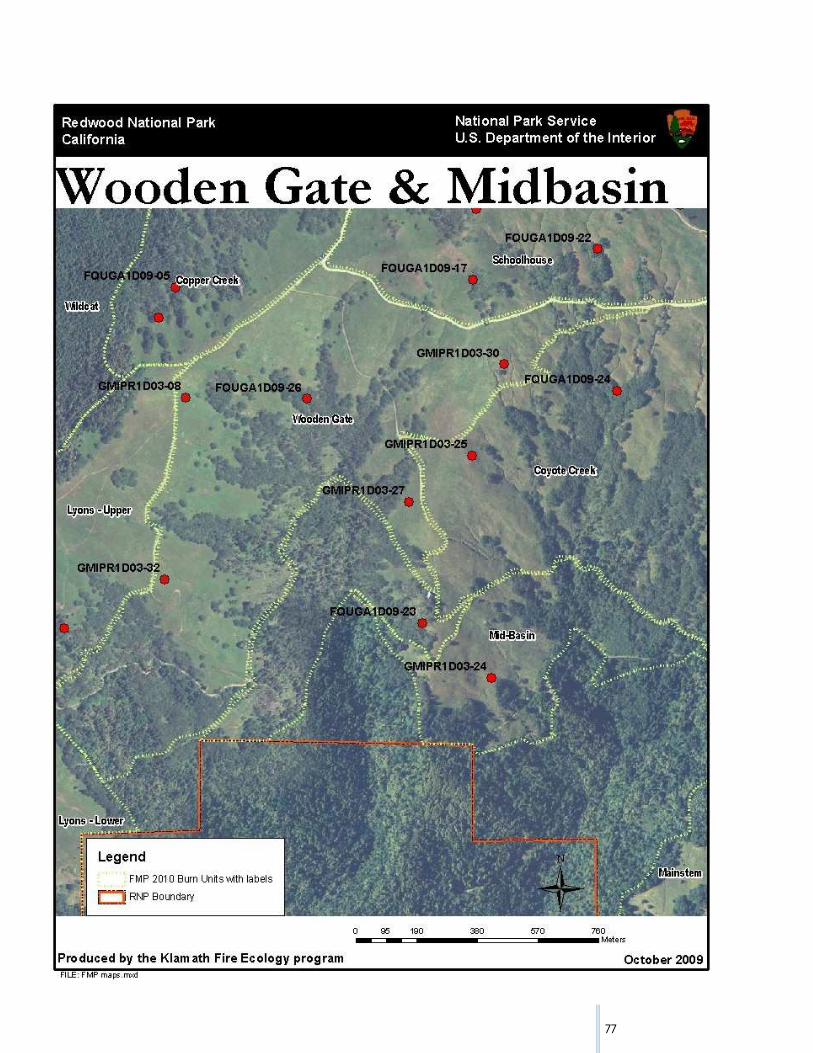
77

78

79

80
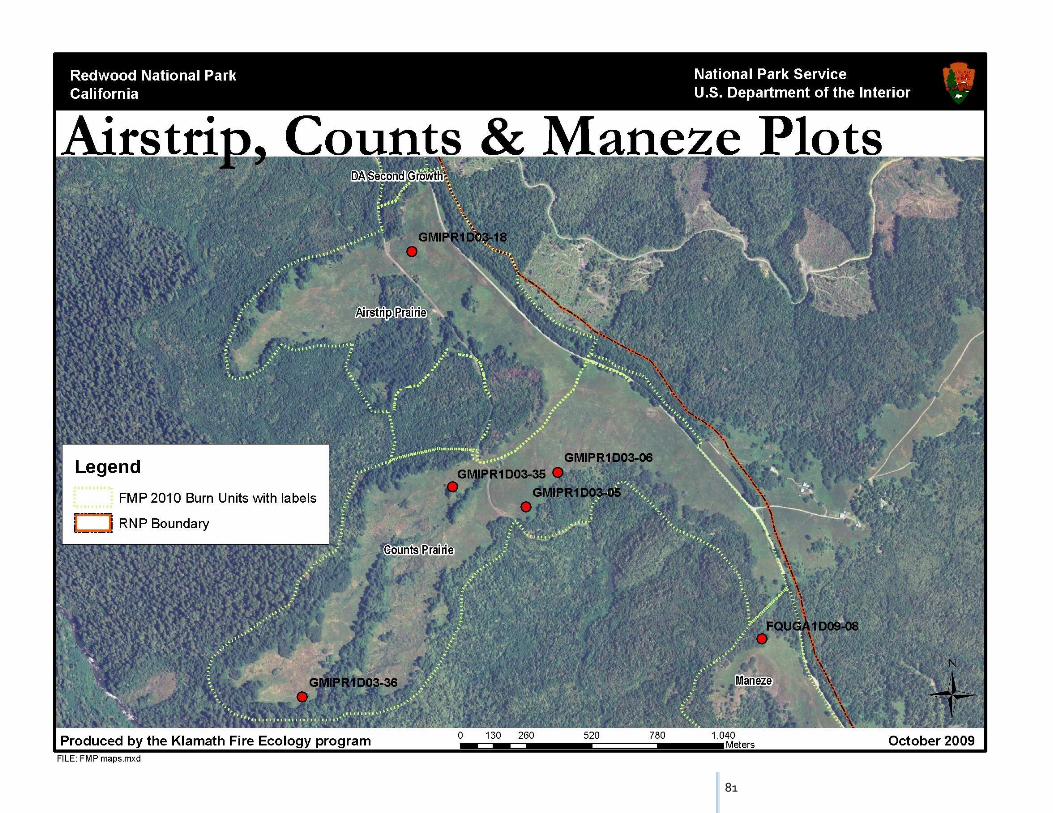
81
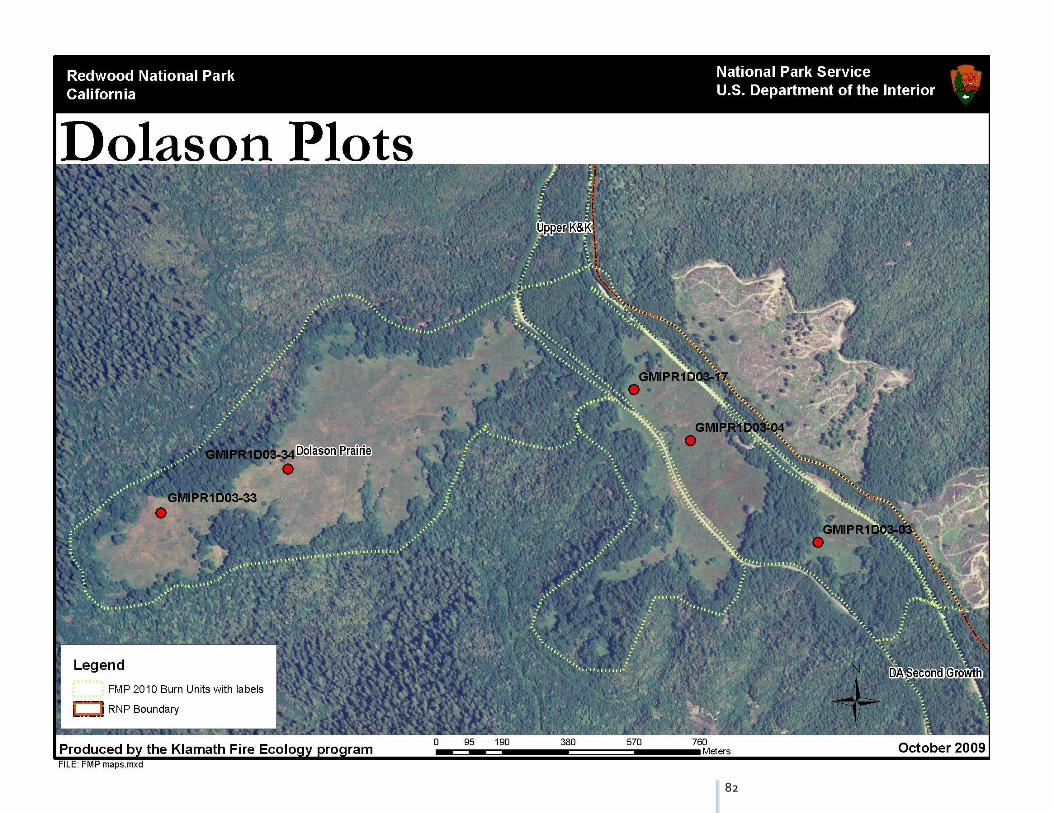
82

83
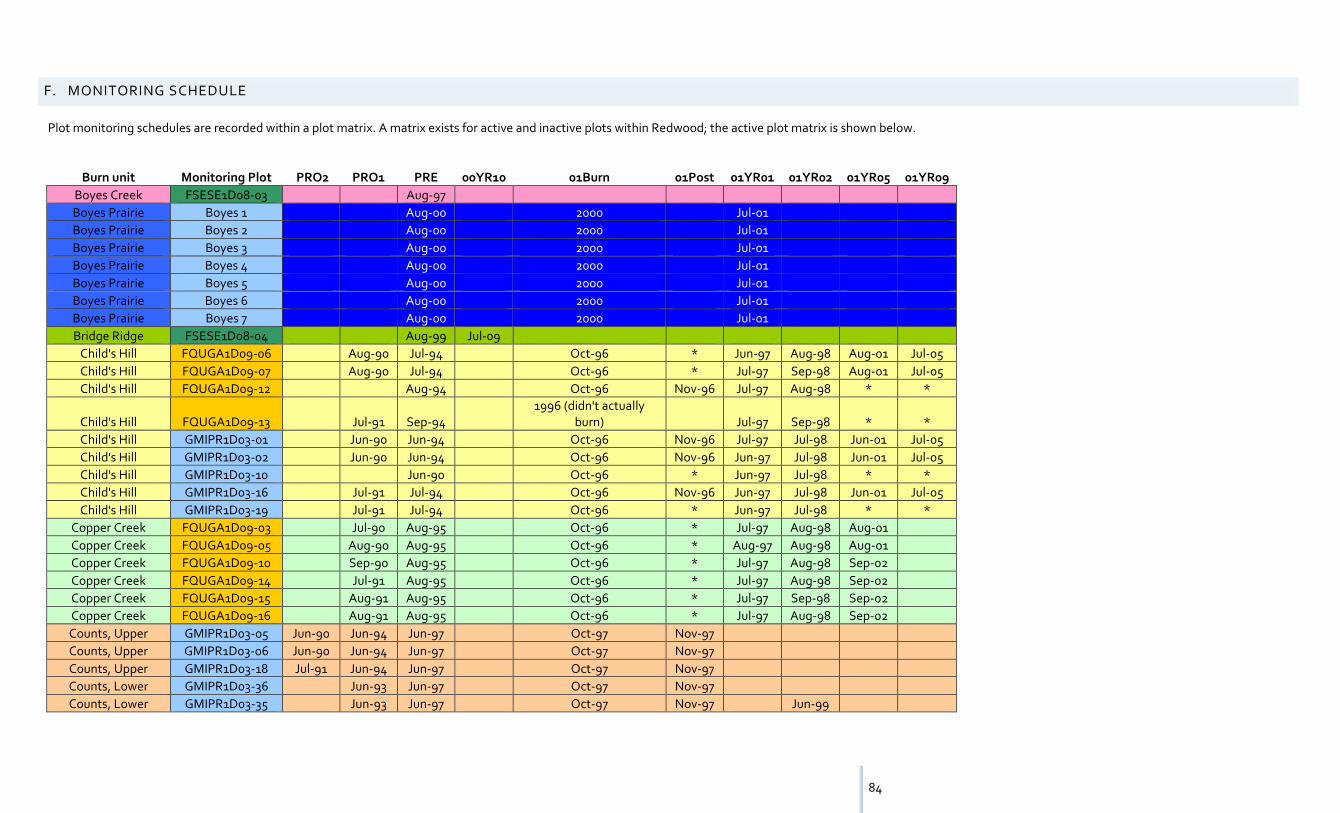
84
F. MONITORING SCHEDULE
Plot monitoring schedules are recorded within a plot matrix. A matrix exists for active and inactive plots within Redwood; the active plot matrix is shown below.
Burn unit Monitoring Plot PRO2 PRO1 PRE 00YR10 01Burn 01Post 01YR01 01YR02 01YR05 01YR09
Boyes Creek FSESE1D08-03 Aug-97
Boyes Prairie Boyes 1 Aug-00 2000 Jul-01
Boyes Prairie Boyes 2 Aug-00 2000 Jul-01
Boyes Prairie Boyes 3 Aug-00 2000 Jul-01
Boyes Prairie Boyes 4 Aug-00 2000 Jul-01
Boyes Prairie Boyes 5 Aug-00 2000 Jul-01
Boyes Prairie Boyes 6 Aug-00 2000 Jul-01
Boyes Prairie Boyes 7 Aug-00 2000 Jul-01
Bridge Ridge FSESE1D08-04 Aug-99 Jul-09
Child's Hill FQUGA1D09-06 Aug-90 Jul-94 Oct-96 * Jun-97 Aug-98 Aug-01 Jul-05
Child's Hill FQUGA1D09-07 Aug-90 Jul-94 Oct-96 * Jul-97 Sep-98 Aug-01 Jul-05
Child's Hill FQUGA1D09-12 Aug-94 Oct-96 Nov-96 Jul-97 Aug-98 * *
Child's Hill FQUGA1D09-13 Jul-91 Sep-94
1996 (didn't actually
burn) Jul-97 Sep-98 * *
Child's Hill GMIPR1D03-01 Jun-90 Jun-94 Oct-96 Nov-96 Jul-97 Jul-98 Jun-01 Jul-05
Child's Hill GMIPR1D03-02 Jun-90 Jun-94 Oct-96 Nov-96 Jun-97 Jul-98 Jun-01 Jul-05
Child's Hill GMIPR1D03-10 Jun-90 Oct-96 * Jun-97 Jul-98 * *
Child's Hill GMIPR1D03-16 Jul-91 Jul-94 Oct-96 Nov-96 Jun-97 Jul-98 Jun-01 Jul-05
Child's Hill GMIPR1D03-19 Jul-91 Jul-94 Oct-96 * Jun-97 Jul-98 * *
Copper Creek FQUGA1D09-03 Jul-90 Aug-95 Oct-96 * Jul-97 Aug-98 Aug-01
Copper Creek FQUGA1D09-05 Aug-90 Aug-95 Oct-96 * Aug-97 Aug-98 Aug-01
Copper Creek FQUGA1D09-10 Sep-90 Aug-95 Oct-96 * Jul-97 Aug-98 Sep-02
Copper Creek FQUGA1D09-14 Jul-91 Aug-95 Oct-96 * Jul-97 Aug-98 Sep-02
Copper Creek FQUGA1D09-15 Aug-91 Aug-95 Oct-96 * Jul-97 Sep-98 Sep-02
Copper Creek FQUGA1D09-16 Aug-91 Aug-95 Oct-96 * Jul-97 Aug-98 Sep-02
Counts, Upper GMIPR1D03-05 Jun-90 Jun-94 Jun-97 Oct-97 Nov-97
Counts, Upper GMIPR1D03-06 Jun-90 Jun-94 Jun-97 Oct-97 Nov-97
Counts, Upper GMIPR1D03-18 Jul-91 Jun-94 Jun-97 Oct-97 Nov-97
Counts, Lower GMIPR1D03-36 Jun-93 Jun-97 Oct-97 Nov-97
Counts, Lower GMIPR1D03-35 Jun-93 Jun-97 Oct-97 Nov-97 Jun-99
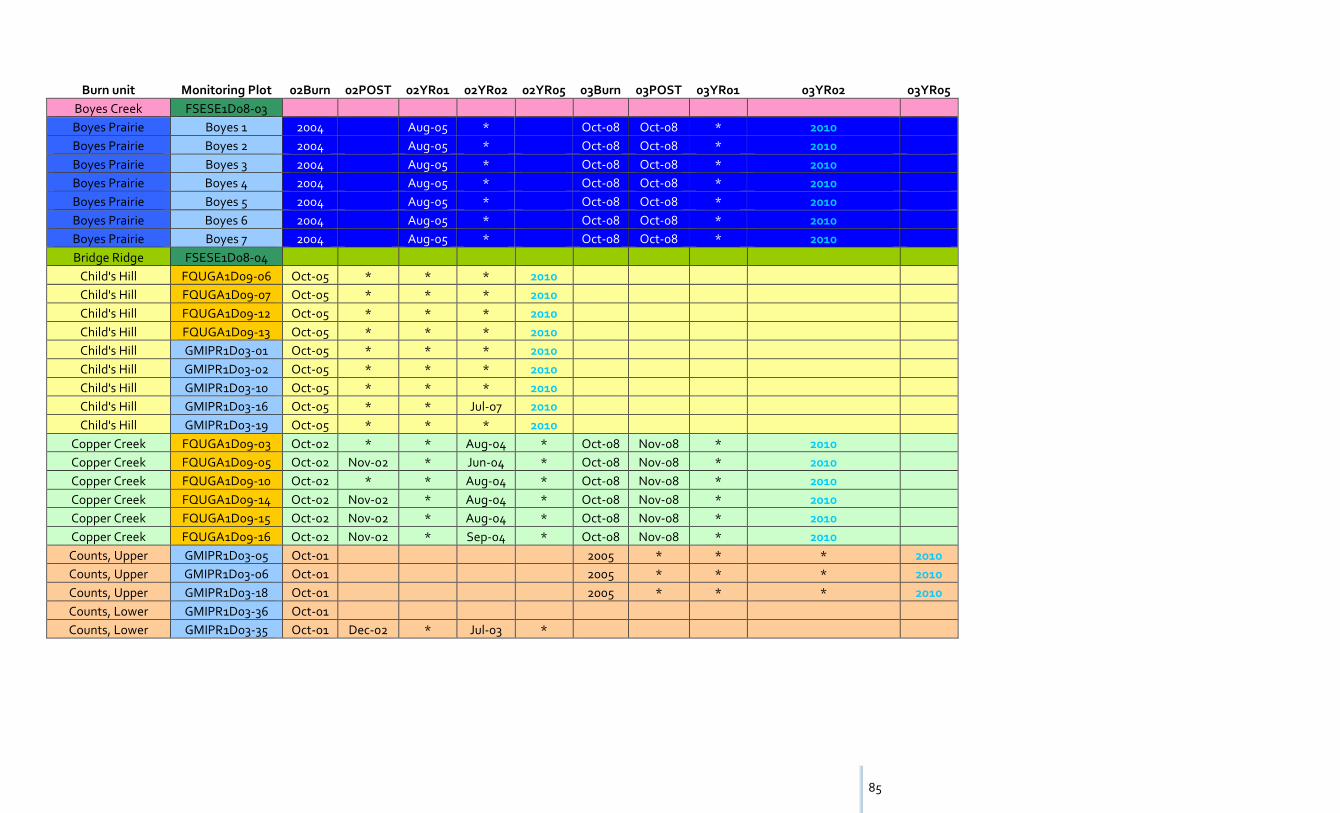
85
Burn unit Monitoring Plot 02Burn 02POST 02YR01 02YR02 02YR05 03Burn 03POST 03YR01 03YR02 03YR05
Boyes Creek FSESE1D08-03
Boyes Prairie Boyes 1 2004 Aug-05 * Oct-08 Oct-08 * 2010
Boyes Prairie Boyes 2 2004 Aug-05 * Oct-08 Oct-08 * 2010
Boyes Prairie Boyes 3 2004 Aug-05 * Oct-08 Oct-08 * 2010
Boyes Prairie Boyes 4 2004 Aug-05 * Oct-08 Oct-08 * 2010
Boyes Prairie Boyes 5 2004 Aug-05 * Oct-08 Oct-08 * 2010
Boyes Prairie Boyes 6 2004 Aug-05 * Oct-08 Oct-08 * 2010
Boyes Prairie Boyes 7 2004 Aug-05 * Oct-08 Oct-08 * 2010
Bridge Ridge FSESE1D08-04
Child's Hill FQUGA1D09-06 Oct-05 * * * 2010
Child's Hill FQUGA1D09-07 Oct-05 * * * 2010
Child's Hill FQUGA1D09-12 Oct-05 * * * 2010
Child's Hill FQUGA1D09-13 Oct-05 * * * 2010
Child's Hill GMIPR1D03-01 Oct-05 * * * 2010
Child's Hill GMIPR1D03-02 Oct-05 * * * 2010
Child's Hill GMIPR1D03-10 Oct-05 * * * 2010
Child's Hill GMIPR1D03-16 Oct-05 * * Jul-07 2010
Child's Hill GMIPR1D03-19 Oct-05 * * * 2010
Copper Creek FQUGA1D09-03 Oct-02 * * Aug-04 * Oct-08 Nov-08 * 2010
Copper Creek FQUGA1D09-05 Oct-02 Nov-02 * Jun-04 * Oct-08 Nov-08 * 2010
Copper Creek FQUGA1D09-10 Oct-02 * * Aug-04 * Oct-08 Nov-08 * 2010
Copper Creek FQUGA1D09-14 Oct-02 Nov-02 * Aug-04 * Oct-08 Nov-08 * 2010
Copper Creek FQUGA1D09-15 Oct-02 Nov-02 * Aug-04 * Oct-08 Nov-08 * 2010
Copper Creek FQUGA1D09-16 Oct-02 Nov-02 * Sep-04 * Oct-08 Nov-08 * 2010
Counts, Upper GMIPR1D03-05 Oct-01 2005 * * * 2010
Counts, Upper GMIPR1D03-06 Oct-01 2005 * * * 2010
Counts, Upper GMIPR1D03-18 Oct-01 2005 * * * 2010
Counts, Lower GMIPR1D03-36 Oct-01
Counts, Lower GMIPR1D03-35 Oct-01 Dec-02 * Jul-03 *

86
Burn unit Monitoring Plot PRO2 PRO1 PRE 01Burn 01Post 01YR01 01YR02 01YR06 01YR10 02Burn 02POST 02YR01
Coyote Creek, Upper GMIPR1D03-21 Jun-92 Oct-94 Dec-94 Jun-95 May-96 Oct-96 Oct-96 Jun-97
Coyote Creek, Upper GMIPR1D03-29 Jun-92 Oct-94 Dec-94 Jun-95 Jun-96 Oct-96 Oct-96 Jun-97
Coyote Creek, Lower GMIPR1D03-20 Jun-92 Oct-94 Dec-94 Jun-95 Jun-96 Oct-96 Nov-96 Jun-97
Coyote Creek, Lower GMIPR1D03-25 Aug-92 Oct-94 Nov-94 Jun-95 Jun-96 Oct-96 Nov-96 Jun-97
Coyote Creek, Lower GMIPR1D03-31 Jun-92 Oct-94 Nov-94 Jun-95 Jun-96 Oct-96 Oct-96 Jun-97
Coyote Creek, Lower FQUGA1D09-20 Jul-92 Oct-94 Nov-94 Aug-95 Aug-96 Oct-96 Oct-96 May-97
Coyote Creek, Lower FQUGA1D09-24 Jul-92 Nov-94 Aug-95 Aug-96 Aug-97
Coyote Creek, Lower FQUGA1D09-25 Aug-92 Oct-94 Nov-94 Aug-95 Aug-96 Oct-96 * May-97
Dolason, Upper GMIPR1D03-03 Jun-90 Jun-95 Oct-95 * Jul-96 Jun-97 1997 Dec-97
Dolason, Upper GMIPR1D03-04 Jun-90 Jun-95 Oct-95 * Jul-96 Jun-97 1997 Nov-97
Dolason, Upper GMIPR1D03-17 Jun-91 Jun-95 Oct-95 * Jul-96 Jun-97 1997 Nov-97 *
Dolason, Lower GMIPR1D03-33 Jun-93 Oct-95 * Jul-96 Jul-97 1997 Nov-97
Dolason, Lower GMIPR1D03-34 Jun-93 Oct-95 * Jul-96 Jul-97 1997 Nov-97 *
Eastside GMIPR1D03-28 Jun-92 Aug-98 Jul-08
Eastside GMIPR1D03-37 Jul-09
Eastside GMIPR1D03-38 Jul-09
Eastside FQUGA1D09-27 Jul-09
Elk Camp, Lower GMIPR1D03-13 Jun-91 Oct-93 Nov-93 Jun-94 Jun-95 Oct-95 Nov-95 *
Elk Camp, Lower GMIPR1D03-14 May-94 Jul-97 1997 Nov-97 2001
Elk Camp, Lower GMIPR1D03-15 Jun-91 Jun-94 Jul-97 1997 Oct-97 2001
Little Bald Hills FPIJE1D02-02 Jul-92
Little Bald Hills FPIAT1D04-01 Jul-92
Lyon's Ranch, Upper FQUGA1D09-04 Jul-90 Aug-93 Oct-93 * Sep-94 Aug-95 Sep-96 Oct-96 Jul-97
Lyon's Ranch, Upper FQUGA1D09-19 Jul-92 Oct-93 Nov-93 Sep-94 Aug-95 Sep-96 Nov-96 Jul-97
Lyon's Ranch, Upper GMIPR1D03-11 Jul-90 Jun-93 Oct-93 Nov-93 Jul-94 Jun-95 Sep-96 * Jun-97
Lyon's Ranch, Lower GMIPR1D03-22 Jun-92 Oct-93 Nov-93 Jul-94 Jun-95 Jul-99 Jul-03 Oct-04 Nov-04 *
Lyon's Ranch, Lower GMIPR1D03-23 Jun-92 Oct-93 Nov-93 Jul-94 Jun-95 Jul-99 Jul-03 Oct-04 Nov-04 *
Lyon's Ranch, Lower GMIPR1D03-26 Jun-92 Oct-93 Nov-93 Jul-94 Jun-95 Jul-99 Oct-04

87
Burn unit Monitoring Plot 02YR02 02YR05 03Burn 03POST 03YR01 03YR02 03YR05 04 Burn 04POST 04YR01 04YR02 04YR05 05 Burn 05 Post 05YR01 05YR02 05YR05
Coyote Creek, Upper GMIPR1D03-21 Jun-98 Aug-98 Sep-98 * Jun-00 Jul-03 Oct-03 Oct-03 Jul-04 Oct-05 Oct-05 * * 2010
Coyote Creek, Upper GMIPR1D03-29 Jun-98 Aug-98 Nov-98 * Jun-00 Jul-03 Oct-03 Oct-03 Jul-04 Oct-05 Oct-05 * * 2010
Coyote Creek, Lower GMIPR1D03-20 Jun-98 Aug-98 Sep-98 * Jun-00 Jul-03 Sep-05 Nov-05 * * 2010
Coyote Creek, Lower GMIPR1D03-25 Jun-98 Aug-98 Oct-98 * Jun-00 Jul-03 Sep-05 Nov-05 * * 2010
Coyote Creek, Lower GMIPR1D03-31 Jul-98 Aug-98 Sep-98 * Jun-00 Jul-03 Sep-05 Nov-05 * Jul-07 2010
Coyote Creek, Lower FQUGA1D09-20 Jul-98 Aug-98 Oct-98 * * Sep-03 Sep-05 * * * 2010
Coyote Creek, Lower FQUGA1D09-24 Jul-98 Oct-98 Sep-05 2010
Coyote Creek, Lower FQUGA1D09-25 Jul-98 Aug-98 Nov-98 * * Sep-03 Sep-05 * * * 2010
Dolason, Upper GMIPR1D03-03 Sep-98 Nov-98 2001 2006 * * Jul-08 2011
Dolason, Upper GMIPR1D03-04 Sep-98 Nov-98 2001 2006 * * Jul-08 2011
Dolason, Upper GMIPR1D03-17 Sep-98 Nov-98 * Aug-00 Oct-01 Dec-01 * Jul-03 * 2006 * * * 2011
Dolason, Lower GMIPR1D03-33 Oct-05 2010
Dolason, Lower GMIPR1D03-34 Jun-99 Jun-02 Oct-05 * * * 2010
Eastside GMIPR1D03-28
Eastside GMIPR1D03-37
Eastside GMIPR1D03-38
Eastside FQUGA1D09-27
Elk Camp, Lower GMIPR1D03-13 Jul-97 Sep-97 Nov-97 * Jul-99 Jun-02 Oct-03 Oct-03 Jul-04 * Jul-08
Elk Camp, Lower GMIPR1D03-14 2003 Jul-08
Elk Camp, Lower GMIPR1D03-15 2003 *
Little Bald Hills FPIJE1D02-02
Little Bald Hills FPIAT1D04-01
Lyon's Ranch, Upper FQUGA1D09-04 Jul-98 Aug-98 Oct-98 * Aug-00 Oct-02 Nov-02 * Jul-04 Oct-07 Oct-07 * Jul-09
Lyon's Ranch, Upper FQUGA1D09-19 Aug-98 Aug-98 Oct-98 * Aug-00 Oct-02 Nov-02 * Aug-04 Oct-07 Oct-07 * Jul-09
Lyon's Ranch, Upper GMIPR1D03-11 Jul-98 Aug-98 Oct-98 Oct-02 * Oct-07 Jul-09
Lyon's Ranch, Lower GMIPR1D03-22 * Jul-09
Lyon's Ranch, Lower GMIPR1D03-23 * Jul-09
Lyon's Ranch, Lower GMIPR1D03-26 Jul-09
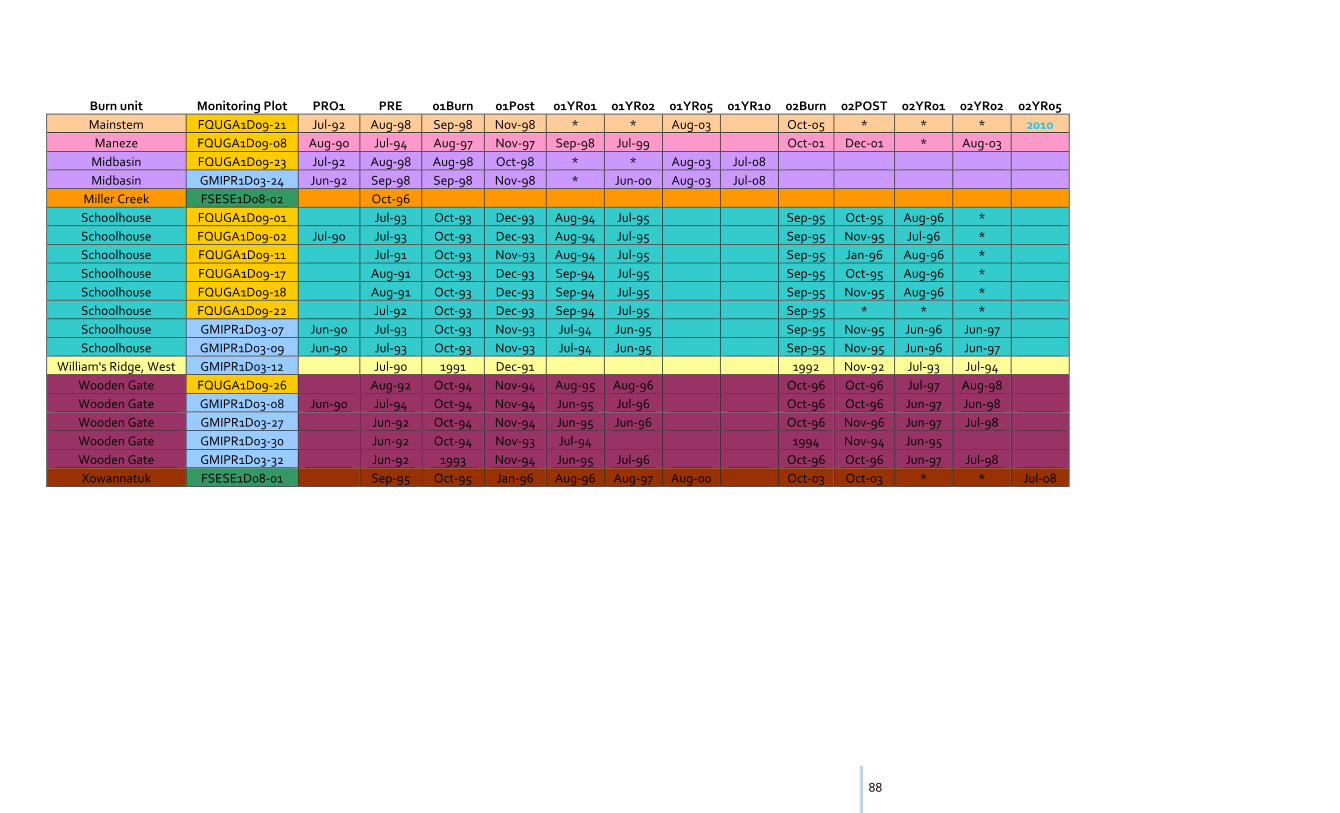
88
Burn unit Monitoring Plot PRO1 PRE 01Burn 01Post 01YR01 01YR02 01YR05 01YR10 02Burn 02POST 02YR01 02YR02 02YR05
Mainstem FQUGA1D09-21 Jul-92 Aug-98 Sep-98 Nov-98 * * Aug-03 Oct-05 * * * 2010
Maneze FQUGA1D09-08 Aug-90 Jul-94 Aug-97 Nov-97 Sep-98 Jul-99 Oct-01 Dec-01 * Aug-03
Midbasin FQUGA1D09-23 Jul-92 Aug-98 Aug-98 Oct-98 * * Aug-03 Jul-08
Midbasin GMIPR1D03-24 Jun-92 Sep-98 Sep-98 Nov-98 * Jun-00 Aug-03 Jul-08
Miller Creek FSESE1D08-02 Oct-96
Schoolhouse FQUGA1D09-01 Jul-93 Oct-93 Dec-93 Aug-94 Jul-95 Sep-95 Oct-95 Aug-96 *
Schoolhouse FQUGA1D09-02 Jul-90 Jul-93 Oct-93 Dec-93 Aug-94 Jul-95 Sep-95 Nov-95 Jul-96 *
Schoolhouse FQUGA1D09-11 Jul-91 Oct-93 Nov-93 Aug-94 Jul-95 Sep-95 Jan-96 Aug-96 *
Schoolhouse FQUGA1D09-17 Aug-91 Oct-93 Dec-93 Sep-94 Jul-95 Sep-95 Oct-95 Aug-96 *
Schoolhouse FQUGA1D09-18 Aug-91 Oct-93 Dec-93 Sep-94 Jul-95 Sep-95 Nov-95 Aug-96 *
Schoolhouse FQUGA1D09-22 Jul-92 Oct-93 Dec-93 Sep-94 Jul-95 Sep-95 * * *
Schoolhouse GMIPR1D03-07 Jun-90 Jul-93 Oct-93 Nov-93 Jul-94 Jun-95 Sep-95 Nov-95 Jun-96 Jun-97
Schoolhouse GMIPR1D03-09 Jun-90 Jul-93 Oct-93 Nov-93 Jul-94 Jun-95 Sep-95 Nov-95 Jun-96 Jun-97
William's Ridge, West GMIPR1D03-12 Jul-90 1991 Dec-91 1992 Nov-92 Jul-93 Jul-94
Wooden Gate FQUGA1D09-26 Aug-92 Oct-94 Nov-94 Aug-95 Aug-96 Oct-96 Oct-96 Jul-97 Aug-98
Wooden Gate GMIPR1D03-08 Jun-90 Jul-94 Oct-94 Nov-94 Jun-95 Jul-96 Oct-96 Oct-96 Jun-97 Jun-98
Wooden Gate GMIPR1D03-27 Jun-92 Oct-94 Nov-94 Jun-95 Jun-96 Oct-96 Nov-96 Jun-97 Jul-98
Wooden Gate GMIPR1D03-30 Jun-92 Oct-94 Nov-93 Jul-94 1994 Nov-94 Jun-95
Wooden Gate GMIPR1D03-32 Jun-92 1993 Nov-94 Jun-95 Jul-96 Oct-96 Oct-96 Jun-97 Jul-98
Xowannatuk FSESE1D08-01 Sep-95 Oct-95 Jan-96 Aug-96 Aug-97 Aug-00 Oct-03 Oct-03 * * Jul-08
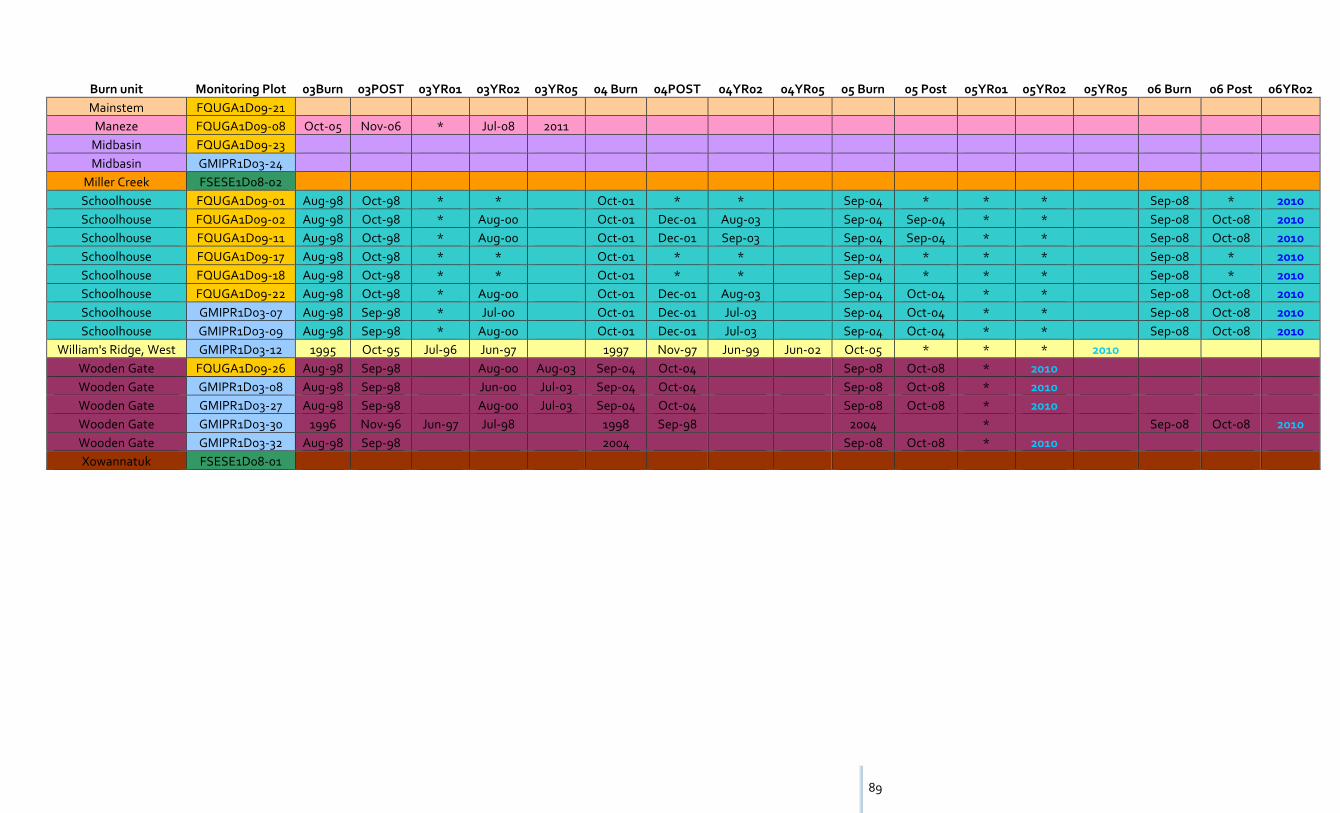
89
Burn unit Monitoring Plot 03Burn 03POST 03YR01 03YR02 03YR05 04 Burn 04POST 04YR02 04YR05 05 Burn 05 Post 05YR01 05YR02 05YR05 06 Burn 06 Post 06YR02
Mainstem FQUGA1D09-21
Maneze FQUGA1D09-08 Oct-05 Nov-06 * Jul-08 2011
Midbasin FQUGA1D09-23
Midbasin GMIPR1D03-24
Miller Creek FSESE1D08-02
Schoolhouse FQUGA1D09-01 Aug-98 Oct-98 * * Oct-01 * * Sep-04 * * * Sep-08 * 2010
Schoolhouse FQUGA1D09-02 Aug-98 Oct-98 * Aug-00 Oct-01 Dec-01 Aug-03 Sep-04 Sep-04 * * Sep-08 Oct-08 2010
Schoolhouse FQUGA1D09-11 Aug-98 Oct-98 * Aug-00 Oct-01 Dec-01 Sep-03 Sep-04 Sep-04 * * Sep-08 Oct-08 2010
Schoolhouse FQUGA1D09-17 Aug-98 Oct-98 * * Oct-01 * * Sep-04 * * * Sep-08 * 2010
Schoolhouse FQUGA1D09-18 Aug-98 Oct-98 * * Oct-01 * * Sep-04 * * * Sep-08 * 2010
Schoolhouse FQUGA1D09-22 Aug-98 Oct-98 * Aug-00 Oct-01 Dec-01 Aug-03 Sep-04 Oct-04 * * Sep-08 Oct-08 2010
Schoolhouse GMIPR1D03-07 Aug-98 Sep-98 * Jul-00 Oct-01 Dec-01 Jul-03 Sep-04 Oct-04 * * Sep-08 Oct-08 2010
Schoolhouse GMIPR1D03-09 Aug-98 Sep-98 * Aug-00 Oct-01 Dec-01 Jul-03 Sep-04 Oct-04 * * Sep-08 Oct-08 2010
William's Ridge, West GMIPR1D03-12 1995 Oct-95 Jul-96 Jun-97 1997 Nov-97 Jun-99 Jun-02 Oct-05 * * * 2010
Wooden Gate FQUGA1D09-26 Aug-98 Sep-98 Aug-00 Aug-03 Sep-04 Oct-04 Sep-08 Oct-08 * 2010
Wooden Gate GMIPR1D03-08 Aug-98 Sep-98 Jun-00 Jul-03 Sep-04 Oct-04 Sep-08 Oct-08 * 2010
Wooden Gate GMIPR1D03-27 Aug-98 Sep-98 Aug-00 Jul-03 Sep-04 Oct-04 Sep-08 Oct-08 * 2010
Wooden Gate GMIPR1D03-30 1996 Nov-96 Jun-97 Jul-98 1998 Sep-98 2004 * Sep-08 Oct-08 2010
Wooden Gate GMIPR1D03-32 Aug-98 Sep-98 2004 Sep-08 Oct-08 * 2010
Xowannatuk FSESE1D08-01
90
G. BALD HILLS “FIR PLOTS” METHODOLOGY
Purpose
To assess whether we are meeting our fire management objectives with respect to killing small
(≤ 3’ tall) Douglas-fir (Pseudotsuga menziesii var. menziesii) and grand fir (Abies grandis), hereafter
referred to as “small fir,” in prairies and oak woodlands of the Bald Hills. Plot design will enable
rapid assessment of fire effects on targeted small fir populations.
Early-Season Units Fire Management Objectives
In oak woodlands with conifer encroachment, reduce density of live small fir by ≥ 70% within two
years of the burn.
In open grassland, reduce density of live small fir by ≥ 80% within two years of the burn.
Late-Season Units Fire Management Objectives
In oak woodlands with conifer encroachment, reduce density of live small fir by ≥ 50% within two
years of the burn.
In open grassland, reduce density of live small fir by ≥ 80% within two years of the burn.
Fire Effects Monitoring Objective
Measure density of live small fir individuals with a sufficient sample size to be 80% confident of
detecting a change (50%, 70%, or 80%, depending on the fire management objective). Accept a
20% chance of saying a change occurred when it in fact did not, and accept a 20% chance of
detecting no change when a true population change did occur.
Monitoring Design
Fir plots are classified by vegetation community and burn prescription in order to assess fire
management objectives. The different types of fir plots are as follows:
1. Open Grassland (FIRG)
2. Oak Woodland Early (FIROE)
91
3. Oak Woodland Late (FIROL)
The “Open Grassland” vegetation community includes the interface between oak woodlands and
grasslands, as long as canopy cover over the plot is < 40%. Oak woodland fir plots should be
located under canopy cover of ≥ 40%.
At least one plot will be installed in each burn unit to measure each relevant fire management
objective. Fire effects monitoring objectives will be assessed at the program level; for each fire
management objective, plots across all burn units will be lumped to assess whether minimum plot
numbers have been reached.
Plots are short-term in nature; they will be removed after the two year post-burn sampling event.
If minimum sample size has not been reached before a unit re-burns, new plots will be established
within the unit that target live small fir populations.
Fir Plot Design
1. Plot Distribution and Placement
Plot locations will be randomly selected within areas of known live small fir populations. The
number of plots installed in each burn unit depends on the number of potential plot sites, the size
of the burn unit, and the workload of the Fire Effects Team. In large units (> 250 acres), the
installation of three plots per fire management objective is ideal. Installation of one plot per fire
management objective in small units (< 100 acres) is acceptable.
Each burn unit will be surveyed for potential plot sites and these sites will be marked with a GPS
unit. Plot sites will be randomly selected from the potential site pool.
2. Plot Protocols
Each fir plot will be marked with a GPS unit (PDOP < 5). Maps will be created of fir plot locations
within each burn unit; no detailed directions to each plot need to be written. Since finding rebar
can be problematic in the Bald Hills, designate one nearby reference feature and write good
directions (e.g., measure distance with a measuring tape) from the plot to this reference feature.
Mark the reference feature with a GPS unit and take a photo of the reference feature if it will help
locate the plot in the future.
Each fir plot is a 100 m2 rectangle, 5 m x 20 m in dimension. At each randomly selected fir plot
location, orient the plot to capture the maximum number of small fir. Mark all four plot corners
with rebar, and wrap a measuring tape around the rebar to demark the plot. When installing rebar

92
stakes, keep in mind that the project is short-term in nature; ensure that rebar stakes are secure,
but able to be removed at a later time. Starting at 0° (north) and working clockwise, designate the
plot stakes A, B, C, and D. Mark each plot with a brass racetrack tag with the plot name (e.g.,
FIRG01) and Rx Fire, and attach this tag to the “A” stake. Take one digital photo from the stake
with the view that best represents the plot and record this on the datasheet. Record the azimuth
along the long axis of the plot.
Record site conditions for each plot:
℘ UTM coordinates at “A” stake (NAD83)
℘ Slope (hill)
℘ Aspect
℘ Proximity to forest edge (meters)
℘ Evidence of mechanical thinning
Within the plot, enumerate live small firs. Use a sampling rod with height marks to determine if
the firs are ≤ 3’ tall. Use of a counter may facilitate sampling efforts.
Collect data on pre-burn canopy cover using a moosehorn densitometer at A, B, C, and D stakes.
If it is safe to do so, collect plot-specific during-burn data on fire weather and behavior and record
appropriate parameters (e.g., flame length, rate of spread, flame zone depth, wind speed).
Sample each fir plot pre-burn (within a year of ignition), immediately post-burn (within 2 weeks to
2 months after the burn), and two years post-burn. At the post-burn visits, enumerate live small
firs. Take digital photographs at the post-burn visits (mimic the pre-burn photos), but do not
sample post-burn canopy cover. Remove all burned plots after the two year post-burn sampling
event; retain plots only if they did not experience any fire. If plots do not burn, record this and re-
sample the plot within one year of the next prescribed fire.
Plot Rejection Criteria:
℘ Plot located within 50 meters of another fir plot
℘ Plot located within 25 meters of a perennial stream and/or riparian vegetation present
℘ Plot located in area of anomalous fuels (e.g., Himalayan blackberry patch, slash)
℘ Plot located within 25 meters of areas with known cultural resources
℘ Plot located within 25 meters of a road, trail, fireline, or structure

93
Figure 8. Fir Plot diagram.
Data Management
Data will be collected and managed by the Fire Effects Monitoring Team. Data will be entered into
a customized Excel spreadsheet (S:\team\shdata\Fire\Fire Effects Team\Parks\REDW\Fir plot
stuff\Fir Plots Data Entry.xls) and analyzed by the Fire Ecologist. Results of data analysis will be
made available to Redwood Fire and Resource Management staff and will be reported in unit burn
plans and Fire Ecology program annual results.

94
I. BALD HILLS OAK WOODLAND (FQUGA1D09) CANOPY COVER PROTOCOL
FMH Densiometer Protocol
The purpose of adding this extra protocol to standard FMH forest plot protocols is to help directly
measure the specific fire management objective to not reduce overall oak woodland canopy cover by ≥
10% 2 years post-burn, as measured from original pre-burn levels. To facilitate measuring this objective
densitometer readings will be taken at all FMH forest plots within the Redwood National and State Parks
Oak Woodland (FQUGA1D09) Monitoring Type.
Using a GRS densitometer (also known as a ‘Moosehorn’ densitometer), readings will be taken at 30
points within a forest FMH plot along the P1-P2 line and the 0P-50P line. Readings will be taken at the 2,
4, 6, 8, 12, 14, 16 and 18m points along the P1-P2 line. Readings will also be taken at the 4, 6, 8, 10, 12,
14, 16, 18, 20, 22, 24, 26, 28, 30, 32, 34, 36, 38, 40, 42, 44, 46m points along the 0P-50P line. This
protocol will be read preburn and two year post burn.
If any canopy is seen through the densitometer it is a hit (yes), if no canopy is seen it is a miss (no).
FIGURE 1. DIAGRAM OF POINTS WHERE DENSIOMETER READINGS
ARE TAKEN IN STANDARD FMH FOREST PLOT, NOT TO SCALE.
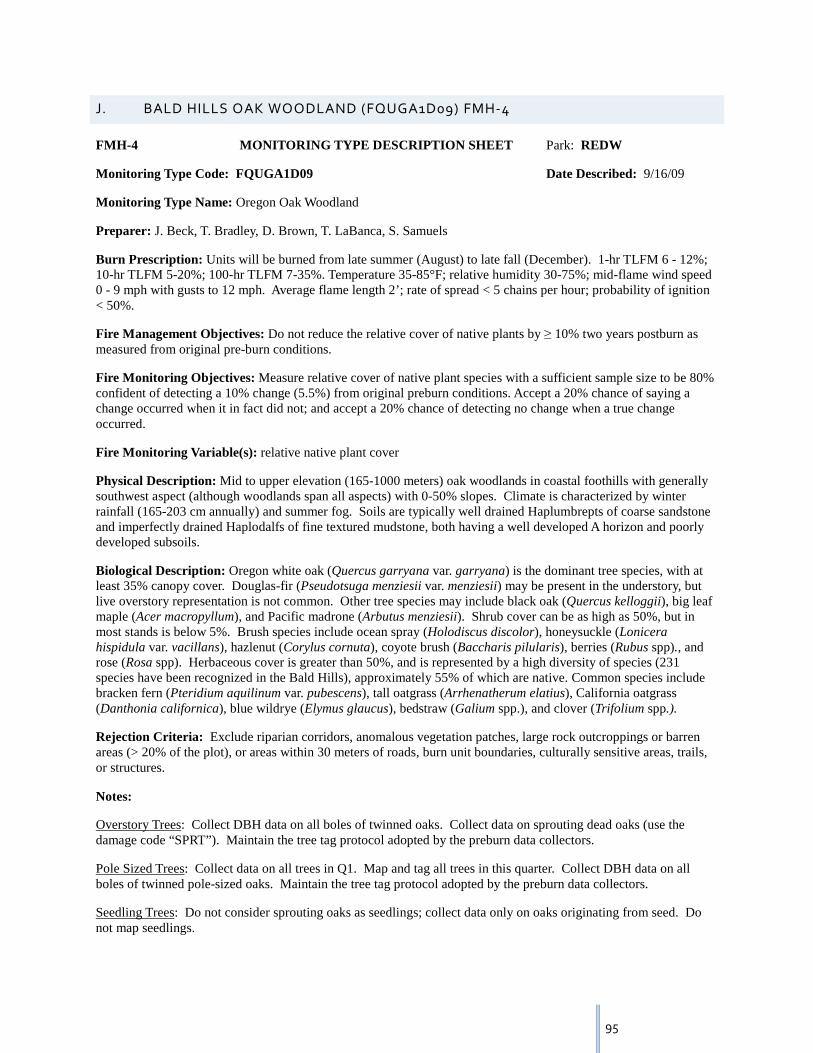
95
J. BALD HILLS OAK WOODLAND (FQUGA1D09) FMH-4
FMH-4 MONITORING TYPE DESCRIPTION SHEET Park: REDW
Monitoring Type Code: FQUGA1D09 Date Described: 9/16/09
Monitoring Type Name: Oregon Oak Woodland
Preparer: J. Beck, T. Bradley, D. Brown, T. LaBanca, S. Samuels
Burn Prescription: Units will be burned from late summer (August) to late fall (December). 1-hr TLFM 6 - 12%; 10-hr TLFM 5-20%; 100-hr TLFM 7-35%. Temperature 35-85°F; relative humidity 30-75%; mid-flame wind speed 0 - 9 mph with gusts to 12 mph. Average flame length 2’; rate of spread < 5 chains per hour; probability of ignition < 50%.
Fire Management Objectives: Do not reduce the relative cover of native plants by ≥ 10% two years postburn as measured from original pre-burn conditions.
Fire Monitoring Objectives: Measure relative cover of native plant species with a sufficient sample size to be 80% confident of detecting a 10% change (5.5%) from original preburn conditions. Accept a 20% chance of saying a change occurred when it in fact did not; and accept a 20% chance of detecting no change when a true change occurred.
Fire Monitoring Variable(s): relative native plant cover
Physical Description: Mid to upper elevation (165-1000 meters) oak woodlands in coastal foothills with generally southwest aspect (although woodlands span all aspects) with 0-50% slopes. Climate is characterized by winter rainfall (165-203 cm annually) and summer fog. Soils are typically well drained Haplumbrepts of coarse sandstone and imperfectly drained Haplodalfs of fine textured mudstone, both having a well developed A horizon and poorly developed subsoils.
Biological Description: Oregon white oak (Quercus garryana var. garryana) is the dominant tree species, with at least 35% canopy cover. Douglas-fir (Pseudotsuga menziesii var. menziesii) may be present in the understory, but live overstory representation is not common. Other tree species may include black oak (Quercus kelloggii), big leaf maple (Acer macropyllum), and Pacific madrone (Arbutus menziesii). Shrub cover can be as high as 50%, but in most stands is below 5%. Brush species include ocean spray (Holodiscus discolor), honeysuckle (Lonicera hispidula var. vacillans), hazlenut (Corylus cornuta), coyote brush (Baccharis pilularis), berries (Rubus spp)., and rose (Rosa spp). Herbaceous cover is greater than 50%, and is represented by a high diversity of species (231 species have been recognized in the Bald Hills), approximately 55% of which are native. Common species include bracken fern (Pteridium aquilinum var. pubescens), tall oatgrass (Arrhenatherum elatius), California oatgrass (Danthonia californica), blue wildrye (Elymus glaucus), bedstraw (Galium spp.), and clover (Trifolium spp.).
Rejection Criteria: Exclude riparian corridors, anomalous vegetation patches, large rock outcroppings or barren areas (> 20% of the plot), or areas within 30 meters of roads, burn unit boundaries, culturally sensitive areas, trails, or structures.
Notes:
Overstory Trees: Collect DBH data on all boles of twinned oaks. Collect data on sprouting dead oaks (use the damage code “SPRT”). Maintain the tree tag protocol adopted by the preburn data collectors.
Pole Sized Trees: Collect data on all trees in Q1. Map and tag all trees in this quarter. Collect DBH data on all boles of twinned pole-sized oaks. Maintain the tree tag protocol adopted by the preburn data collectors.
Seedling Trees: Do not consider sprouting oaks as seedlings; collect data only on oaks originating from seed. Do not map seedlings.

96
Herbaceous Transect: Originally vegetation was sampled along two 50-m long transects (Q4-Q1 and Q3-Q2). This was deemed excessive in 1998 and vegetation sampling was limited to one 30 m transect along Q4-Q1. Additionally, the presence of plant species within 5 meters on either side of the vegetation transect used to be recorded. In 2008, this was discontinued and only exotic plants of concern were recorded in this 10 meter belt.
Shrub Density Belt: Recorded in one 10 meter wide belt on the inside of the plot along the 30 meter long Q4-Q1 transect. Do not collect data for clonal shrub species or poison oak (Toxicodendron diversilobum). Note: As of 2008, shrub belt data collection has been suspended.
Fuel Transects: Continue to read 4 standard Brown’s transects. Note whether vegetation is present or not at each point.
Burn Severity: Collect along fuels transects.
Photos: Take copies of PRE, 01YR01, and 01YR02 photos in the field and replicate the same shots for all other reads. Ensure new photos repeat the photo sequence and are of good quality.
Unknown Plant Species: Document any unknown species by collecting voucher specimens when possible. Do not collect plants within 5 meters of the plot. If it is impossible to collect a voucher specimen, photograph or sketch the plant. Try to gather as much information as possible about the plant: family, annual/perennial, native/exotic, lifeform, etc.). For data entry into the FFI database, utilize generic unknown codes (e.g., “LILIA” for unknown Liliaceae) in the species list before making up new unknown codes.
Sampling Schedule: Read plots on this schedule: preburn, immediately postburn, two years postburn, five years postburn, and every subsequent five years postburn. Do not sample the plots one year postburn (YR01).
Canopy Cover: Collect a total of 30 canopy cover readings with a Moosehorn densiometer at the following points along the P1 – P2 line: 2, 4, 6, 8, 12, 14, 16, 18 m; and at the following points along the 0P – 50P line: 4, 6, 8, 10, 12, 14, 16, 18, 20, 22, 24, 26, 28, 30, 32, 34, 36, 38, 40, 42, 44, 46m. Collect these data immediately before the burn and two years postburn.
Fuel Model: This monitoring type was determined to be a fuel model 09 during early monitoring efforts in the 1990s. To maintain consistency with plot names on plot folders, tags, slides, photos, in the FFI database, etc., this fuel model will remain unchanged, even though for purposes of fire behavior modeling, fuel model 08 is currently used in prescribed fire planning and fire behavior modeling in the oak woodlands.

97
FMH-4 PLOT PROTOCOLS
GENERAL PROTOCOLS YES
(X)
NO
(X)
YES
(X)
NO
(X)
Preburn Control Plots X Herb Height X
Herbaceous Density X Abbreviated Tags X
OP/Origin Buried X Crown Intercept X
Voucher Specimens X Herb. Fuel Load X
Stereo Photography X Brush Individuals X
Shrub Density Belt: Currently suspended! Do not collect.
10 m wide, 30 m long, along Q4-Q1—no clonal species, no TODI
Stakes Installed: 17
Herbaceous Data Collected at: 30 m along Q4-Q1
Burn Duff Moisture X Flame Zone Depth X
Postburn Herbaceous Data X Herb. Fuel Load X
100 Pt. Burn Severity X Collect severity data along fuels transects
FOREST PLOT PROTOCOLS YES
(X)
NO
(X)
YES
(X)
NO
(X)
Overstory Area sampled: 50 x 20 m Quarters Sampled: Q1-Q4
Tree Damage X Crown Position X
Dead Tree Damage SPRT only
X Dead Crown Position X
Pole-size Area Sampled: 25 x 10 m
Quarters Sampled: Q1
Height X Poles Tagged X
Seedling Area Sampled: 5 x 10 m
Quarters Sampled: Subset of Q1
Height X Seedlings Mapped X
Fuel Load Sampling Plane Length: 50’ Fuel Continuity/Opt X
Aerial Fuel Load/Opt X 1/10/100 hour fuels sampled at 6/6/12/50/50’
Canopy Cover 30 points X
Postburn Char Height X Mortality X

98
K. BALD HILLS MIXED PRAIRIE (GMIPR1D03) FMH-4
FMH-4 MONITORING TYPE DESCRIPTION SHEET Park: REDW
Monitoring Type Code: GMIPR1D03 Date Described: 9/16/09
Monitoring Type Name: Bald Hills Mixed Prairie
Preparer: J. Beck, D. Brown, T. La Banca
Burn Prescription: Units will be burned from late summer (August) to late fall (December). 1-hr TLFM 5 - 12%; 10-hr TLFM 5-20%; 100-hr TLFM 7-35%. Temperature 35-85°F; relative humidity 22-75%; mid-flame wind speed 0 - 9 mph with gusts to 12 mph. Average flame length 2 – 27’; rate of spread 3 - 60 chains per hour; probability of ignition < 50%.
Fire Management Objective: Do not reduce the relative cover of native plants by ≥ 10% two years postburn as measured from original preburn conditions.
Fire Monitoring Objectives: Measure relative cover of native plant species with a sufficient sample size to be 80% confident of detecting a 10% change (5.5%) from original preburn conditions. Accept a 20% chance of saying a change occurred when it in fact did not; and accept a 20% chance of detecting no change when a true change occurred.
Fire Monitoring Variable(s): relative native plant cover
Physical Description: Mid to upper elevation (165-950 meters) prairie balds of coastal foothills. Generally southwest aspect of moderate to steep slopes. Precipitation ranges from 165-203 cm annually, characterized by winter rainfall and substantial summer fog. Soils typically well drained Xerumbrepts of coarse sandstone and imperfectly drained Haploxeralfs of fine textured mudstone, both having well developed A-horizons and poorly developed subsoils.
Biological Description: Area dominated by annual and winter dormant perennial grasses and forbs, 60-75% cover, including tall oatgrass (Arrhenatherus elatius), sweet vernal grass (Anthoxanthum odoratum), blue wildrye (Elymus glaucus), California oat grass (Danthonia californica), and other grass species dominating; forbs include sheep sorrel (Rumex acetocella), English plantain (Plantago lanceolata), clover (Trifolium spp.), flax (Linum bienne), and lilies (Brodiaea spp., Dichelostemma spp., Triteleia spp.); occasional bare soil up to 15%.
Rejection Criteria: Exclude riparian corridors, anomalous vegetation patches, large rock outcroppings or barren areas (> 20% of the plot), or areas within 30 meters of roads, burn unit boundaries, culturally sensitive areas, trails, or structures.
Notes:
Herbaceous Transect: The presence of plant species within 5 meters on either side of the vegetation transect used to be recorded. In 2008, this was discontinued and only exotic plants of concern were recorded in this 10 meter belt.
Unknown Plant Species: Document any unknown species by collecting voucher specimens when possible. Do not collect plants within 5 meters of the plot. If it is impossible to collect a voucher specimen, photograph or sketch the plant. Try to gather as much information as possible about the plant: family, annual/perennial, native/exotic, lifeform, etc.). For data entry into the FFI database, utilize generic unknown codes (e.g., “LILIA” for unknown Liliaceae) in the species list before making up new unknown codes.
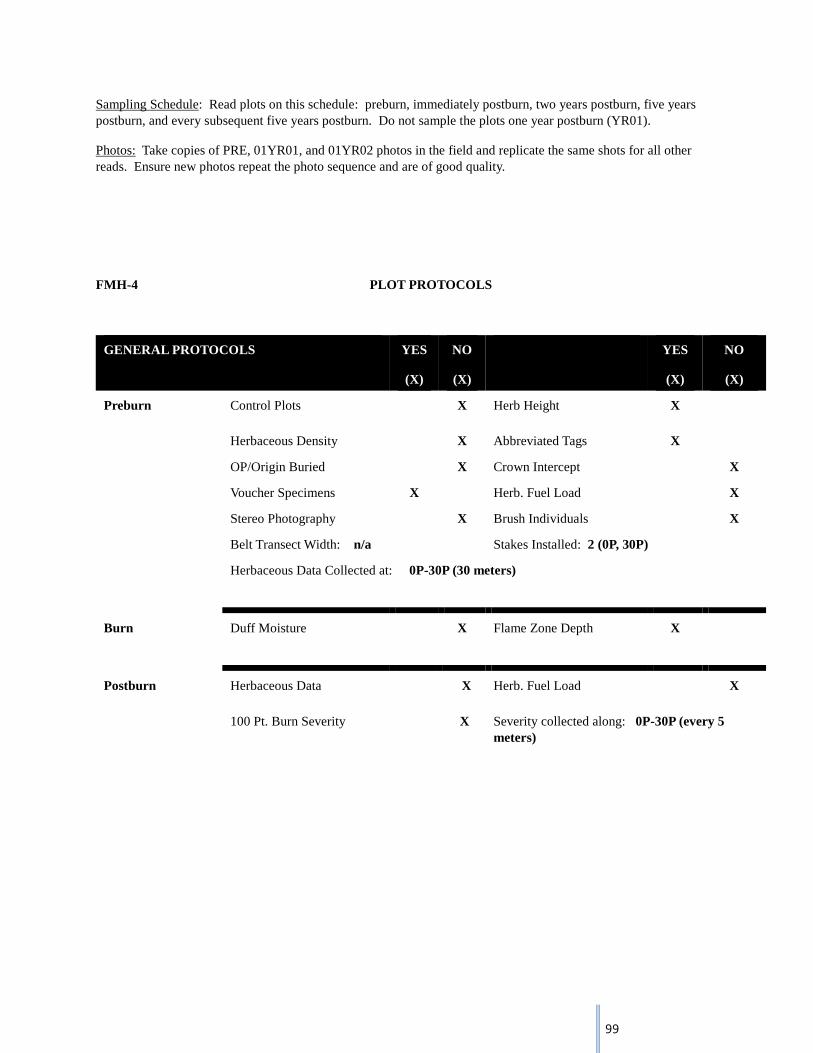
99
Sampling Schedule: Read plots on this schedule: preburn, immediately postburn, two years postburn, five years postburn, and every subsequent five years postburn. Do not sample the plots one year postburn (YR01).
Photos: Take copies of PRE, 01YR01, and 01YR02 photos in the field and replicate the same shots for all other reads. Ensure new photos repeat the photo sequence and are of good quality.
FMH-4 PLOT PROTOCOLS
GENERAL PROTOCOLS YES
(X)
NO
(X)
YES
(X)
NO
(X)
Preburn Control Plots X Herb Height X
Herbaceous Density X Abbreviated Tags X
OP/Origin Buried X Crown Intercept X
Voucher Specimens X Herb. Fuel Load X
Stereo Photography X Brush Individuals X
Belt Transect Width: n/a Stakes Installed: 2 (0P, 30P)
Herbaceous Data Collected at: 0P-30P (30 meters)
Burn Duff Moisture X Flame Zone Depth X
Postburn Herbaceous Data X Herb. Fuel Load X
100 Pt. Burn Severity X Severity collected along: 0P-30P (every 5 meters)

100
L. FEMO REPORT TEMPLATE
RX FIRE NAME
Redwood National Park
Date
Name, Position [FEMO or FEMO(t)], REDW Fire Effects
PROJECT OVERVIEW
This section should include project acreage, boundaries, elevations, description of the fuel models located within
the unit, and any other information that may be helpful. The burn plan and/or IAP will be very helpful while
writing this section.
PROJECT OBJECTIVES
These can be found either in the IAP or in the burn plan.
PROJECT RESOURCES
Include all resources assigned to the incident, their role, and location if possible.
SUMMARY OF BURN OPERATIONS
TEST BURN
Important information should include location, time, weather conditions, fire behavior, and general observations.
IGNITION PATTERN
Please include an ignition chronology with as much detail as possible. The number and type of igniters, a
timeline, and any holding issues should be addressed here. If there are multiple days of ignitions, please split this
section out for each day.
WEATHER SUMMARY
Include burn prescription, spot weather forecast info and accuracy, prior precipitation information, fuel moisture
information, ERC and BI for previous and actual burn days, seasonal information (e.g., dry year? wet year? normal
year?), and any other useful weather information here. Please also include the highs and lows for temperature,
RH, pertinent wind information, and general sky observations. If there are multiple days of ignitions, please

101
separate this section out by date. The actual weather observation data sheets should be cut and pasted into this
document as an appendix.
FIRE BEHAVIOR SUMMARY
This section should describe the fire behavior observed on the fire throughout the day. Please avoid taking fire
behavior observations directly on the fire lines where igniters are lighting. If there are multiple days of ignitions,
please separate this section out by date. Include a few pictures of the fire behavior observed. The actual fire
behavior observation data sheets should be cut and pasted into this document as an appendix.
SMOKE SUMMARY
Include a chronology of smoke movement and dispersal throughout the burn. If there are multiple days of
ignitions, please separate this section out by date. Include a picture of the smoke column and/or dispersal.
Reference the Smoke Management Plan for the burn and address whether the smoke management strategy was
effective or not. The actual smoke observation data sheet should be cut and pasted into this document as an
appendix.
FIRE EFFECTS SUMMARY
If there are any permanent FMH plots, photopoints, or non-permanent plots (Fir Plots) within the project
boundaries, please discuss them here. If safety allows, try to collect fire behavior data from actual plot locations
during burning. Also, if possible, conduct immediate postburn sampling after combustion has finished. If possible,
discuss whether immediate post burn objectives were achieved (some objectives may be more long term and will
cannot be assessed within the time frame of this report). Discuss each objective separately and in detail. Include
a few preburn and postburn plot photos here, percent of the unit burned, fire severity, and future monitoring that
will be conducted in this unit (if there are plots – what is the sampling schedule).
COMMENTS
Present overall thoughts on how burn went from a FEMO perspective and incorporate comments from AAR into
this section. Please try to end on a positive note (even if the burn escaped there must be some positive
comment).
102
FIRE WEATHER OBSERVATION FORM
FIRE NAME: DATE: OBSERVERS:
TIME LOCATION
ELE
VA
TIO
N
AS
PE
CT
DR
Y B
ULB
WE
T B
ULB
RE
LAT
IVE
HU
MID
ITY
WIN
D S
PE
ED
(GU
ST
S)
WIN
D
DIR
EC
TIO
N
% C
LOU
D
CO
VE
R
% S
HA
DIN
G
FIN
E D
EA
D
FU
ELM
OIS
TU
RE
PR
OB
. O
F
IGN
ITIO
N
COMMENTS (PRECIP, FIRE BEHAVIOR,
SMOKE, ETC)
MAX TEMP: MIN RH: MIN TEMP: MAX RH:
TIME OF MAX TEMP: TIME OF MIN RH: TIME OF MIN TEMP: TIME OF MAX RH:

103
FIRE BEHAVIOR OBSERVATION FORM
FIRE NAME: DATE: OBSERVERS:
TIME LOCATION
ELE
VA
TIO
N
FUEL
TYPE SLO
PE
AS
PE
CT
FIRE TYPE
(circle one)
RA
TE
OF
SP
RE
AD
: ���� CH/HR
���� FT/MIN
���� FT/HR
FLA
ME
LEN
GT
H
FLA
ME
HE
IGH
T
FLA
ME
ZO
NE
DE
PT
H
COMMENTS
B H F
B H F
B H F
B H F
B H F
B H F
B H F
B H F
B H F
B H F
B H F
B H F
B H F
B H F
B H F
104
SMOKE OBSERVATION FORM
FIRE NAME: OBSERVERS:
DATE TIME OBSERVER LOCATION AND
ELEVATION
ELEVATION OF
COLUMN ABOVE
GROUND
COLUMN
DIRECTION
APPROX. ELEVATION OF
INVERSION LAYER ABOVE
GROUND
OTHER OBSERVATIONS*
*visibility, type, volume, character, color, plume type: