Appendix K - semspub.epa.gov · (upgradient/upstream) locations. The method used to perform this...
244
Appendix K L I L flR30i658
-
Upload
truongliem -
Category
Documents
-
view
275 -
download
0
Transcript of Appendix K - semspub.epa.gov · (upgradient/upstream) locations. The method used to perform this...

Appendix K
L
IL
flR30i658
I
LAPPENDIX K
-Ji ...... .... " "STATISTICAL ANALYSIS - STUDENT'S t-TEST
ii
0985B
3R30I659
APPENDIX K
STATISTICAL ANALYSIS - STUDENT'S t-TEST
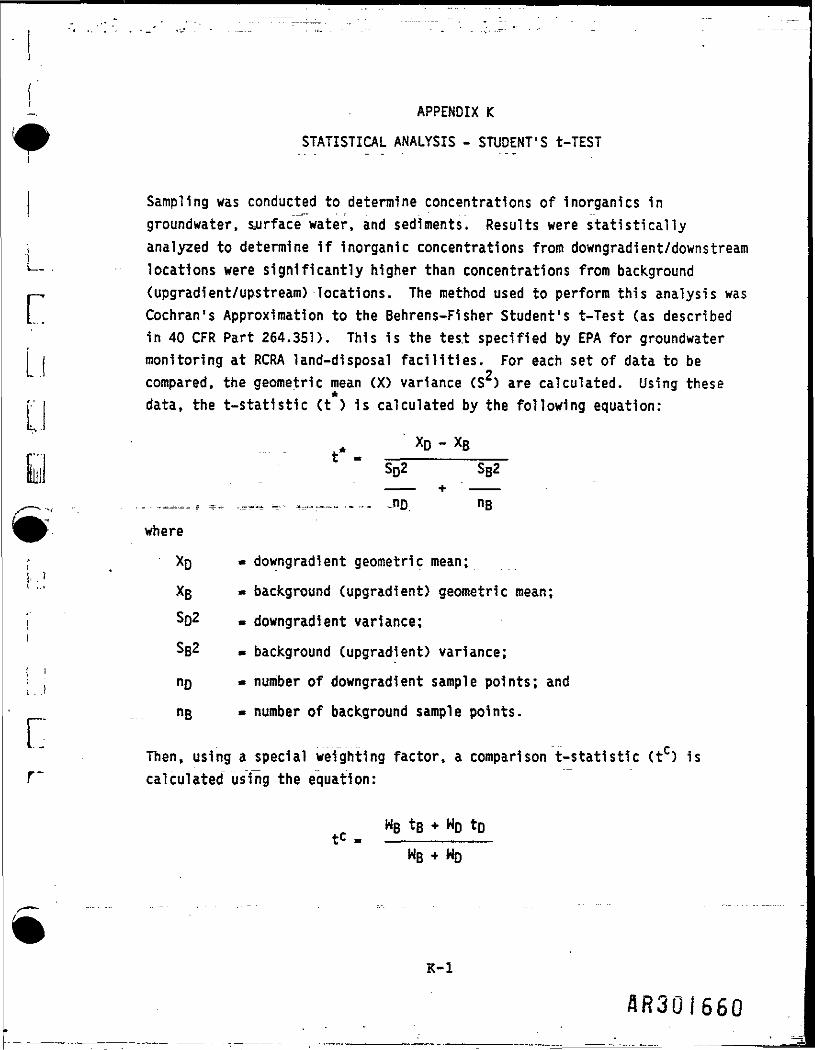
Sampling was conducted to determine concentrations of Inorganics 1ngroundwater. surface water, and sediments. Results were statistically
; analyzed to determine If inorganic concentrations from downgradient/downstream*— locations were significantly higher than concentrations from background
(upgradient/upstream) locations. The method used to perform this analysis wasCochran's Approximation to the Behrens-Fisher Student's t-Test (as describedin 40 CFR Part 264.351). This is the test specified by ERA for groundwater
r
r;
monitoring at RCRA land-disposal facilities. For each set of data to be2compared, the geometric mean (X) variance (S ) are calculated. Using th<
data, the t-statistic Ct ) 1s calculated by the following equation:
t*. S02 SB2
where
XD « downgradient geometric mean;
XB * background (upgradient) geometric mean;
So2 m downgradient variance;
$B2 - background (upgradient) variance;
ng « number of downgradient sample points; and
HB - number of background sample points.
Then, using a special weighting factor, a comparison t-statistic Ctc) iscalculated using the equation:
WB ts + HO toWB + WD
K-l
flR301660
where
Wg - background weighting factor (sB2/nB);HO • downgradient weighting factor (sD2/nj));
TB « t-value with n -l degree of freedom; andTO m t-value with no-1 degree of freedom.i
* rIf the resulting t value Is greater than or equal to the t value, thedowngradient concentration Is significantly greater than the upgradient
* rconcentration. If t is less than t , there is no significant differencein the concentrations.
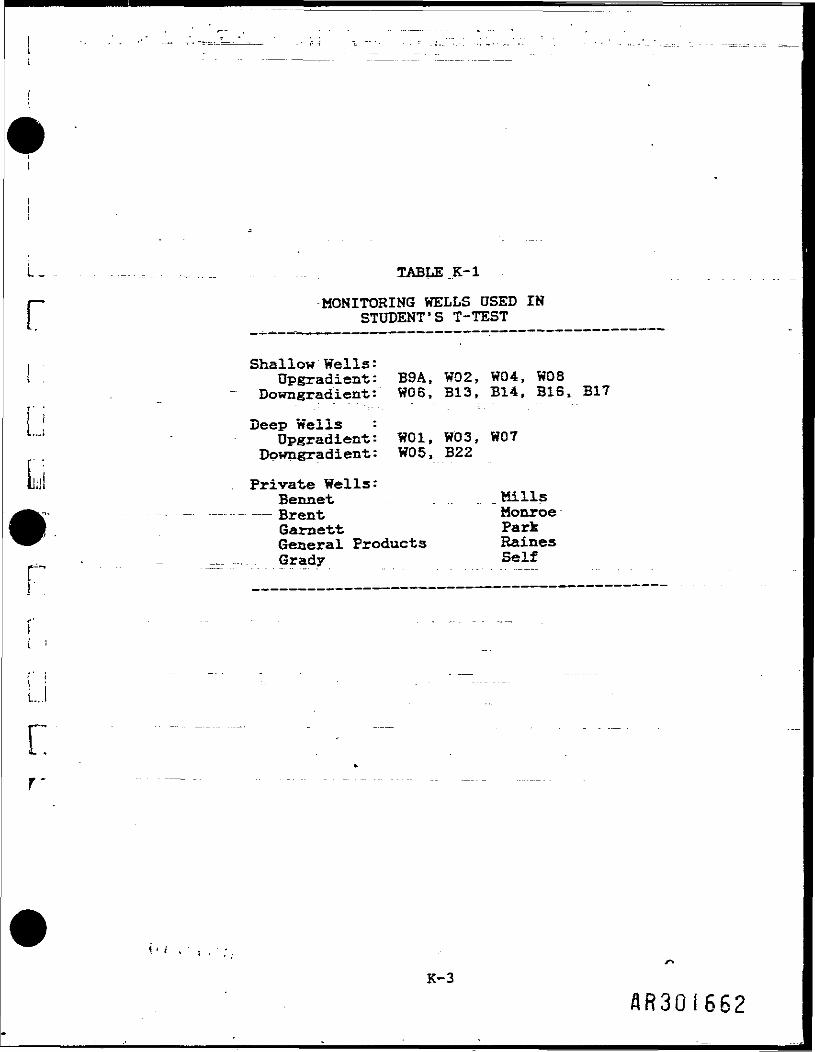
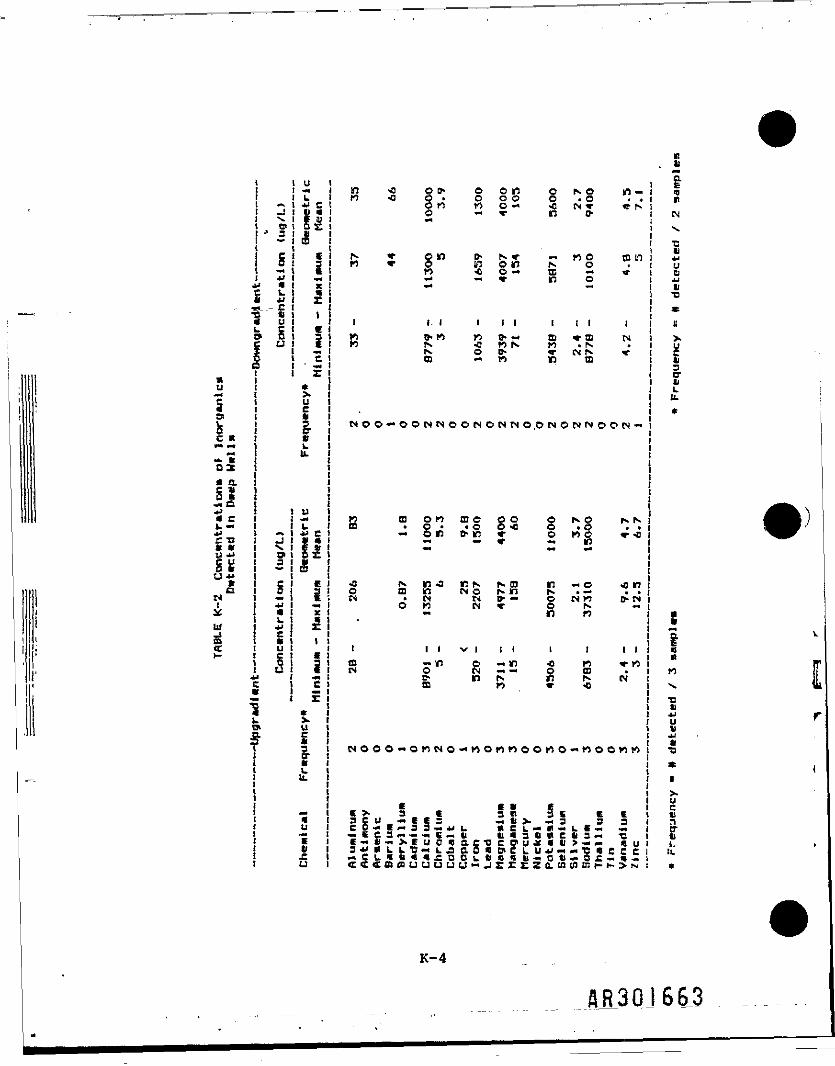
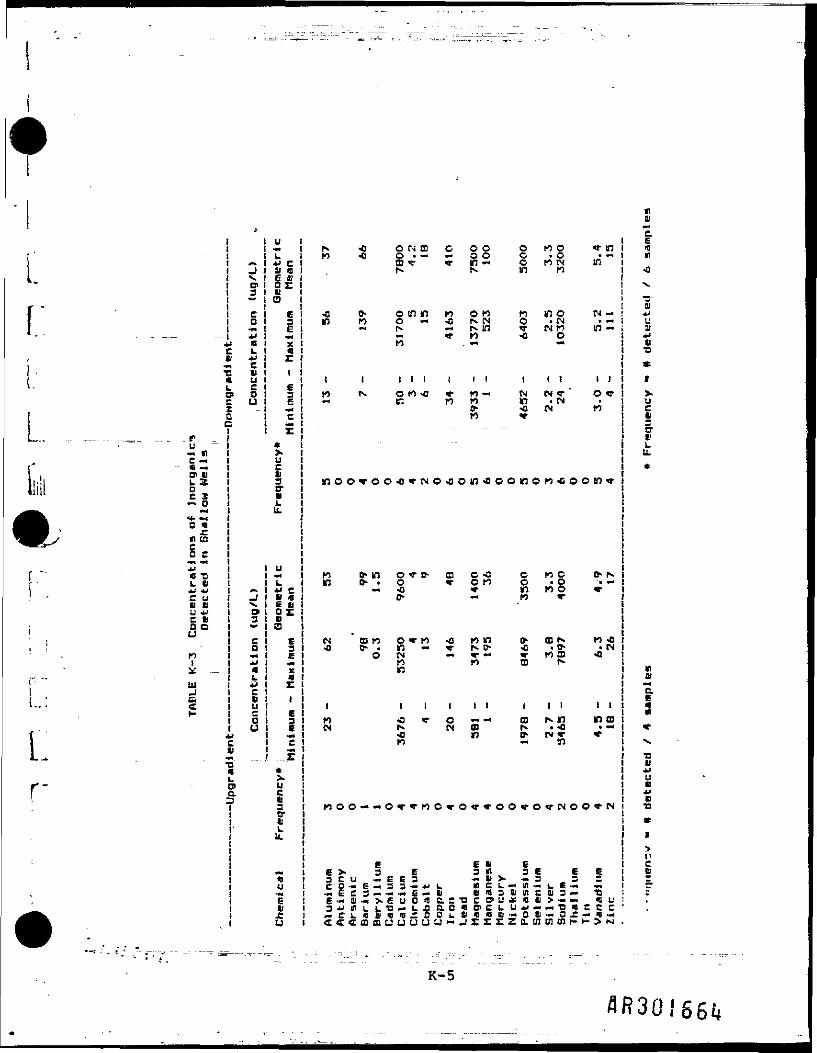
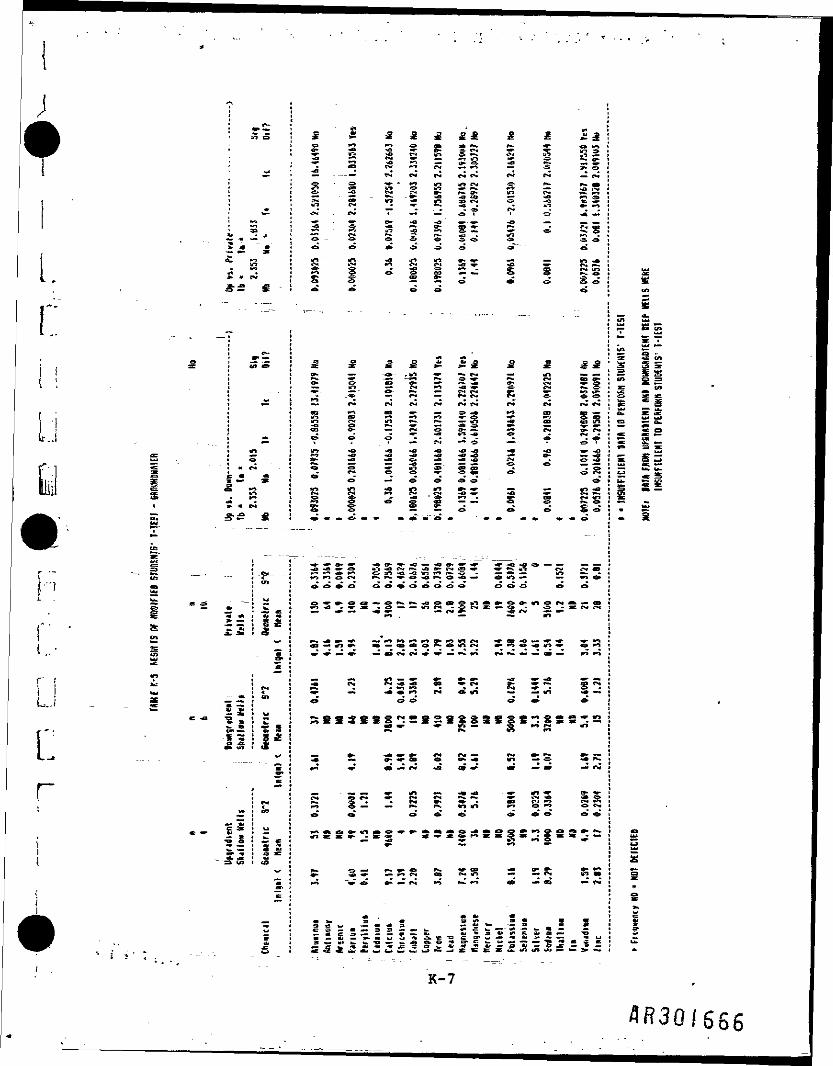
Groundwater .sampling was conducted at 7 upgradient, 7 downgradient, and 10residential wells (Table K-l). Samples were collected from monitoring wellsin both deep and shallow aquifers. Monitoring wells with a screened intervalof approximately 8-24 feet were classified as shallow, and wells with ascreened Interval of approximately 40-71.5 feet were classified as deep. Theresidential wells were considered to be shallow. Tables K-2, K-3, and K-4present frequency of detection, range, and geometric mean of Inorganic samplesfrom deep wells, shallow wells, and residential (private) wells,respectively. When calculating the geometric mean, one-half of the CLPdetection limit was used for nondetected samples. Two separate analyses wereperformed on shallow groundwater data: (1) downgradient versus background(upgradient) and (2) residential versus background (upgradient).
A minimum of three monitoring wells was considered necessary to produce validstatistical results; therefore, the differences between upgradient anddowngradient deep well concentrations could not be analyzed because data fromonly two downgradient deep wells were available.
Results of the t-test Indicate that for most of the inorganics there 1s nosignificant difference between downgradient or residential well data andbackground well data. In Table )C-5, the two inorganics that were detecteddowngradient at significantly higher concentrations are Iron and magnesium.This table also shows that in residential wells, two Inorganics (barium andvanadium) were present at significantly higher concentrations.
K-2
L- - - = = - . . = _.. ,... .... TABLE K-l
r
r
MONITORING WELLS USED INSTUDENT'S T-TEST
I Shallow Wells:{ Upgradient: B9A, W02, W04, W08
Downgradient: W06, B13, B14, BIS, B17
! Deep Wells :" Upgradient: W01, W03, WOT
Downgradient: W05, B22
id . Private Wells:Bennet . .. .. .Mills
—- - — Brent MonroeGarnett ParkGeneral Products RainesGrady Self
K-3
flR30I662
uA_JV.B*» 5-"
§-«*1 **+J «•I b•n~ a5 u9 Qisr
Vu<Mf.IIsisC It»• •*M
M. ft
02* 0.C II
3« c*Jc T:ft w
"1N13£111E•9a:B
.
^t
.
.1
3
LJkJ
§B0
*h
Ucft1eLU.
U
A_JV.O)^
•p*4J•L*Jeucu
k4JIf£
I
*X» y36TftuT
1iu'Eitru
I
C
•MX*£'
|— ic£
c*fc
fEE•«X«ric1tr
n <o o cf*o noVI
ft ; |nv<*•
i t iW Ih W
IVa
NOO—OONNO
M CD O WCD * o >— on
•mt
o a nw - MO M
*••
1 1 1a «. nf* O
to
wooo^onwo
cEX 3 C3 C U «• C C 3c g - 1^3 a - 4J-.SC3---K-«-i->.eu6«a-uf l L L t r ^ L j« C L « f t a * £ occccetauuuu
o o0 0w o
^ ^n o-o 5•* f
, ,
S Ro o-— n
8
n
,
s
OOn
NIBn
0)Vn
OWONNO.ONO
me o• o o** ^
IfJ N NNO NN D-W T
v | i
S =n N
-non
•
Copper
Iron
Lead
Magnesia
o•fl
§
)n
MOO
Manganea
Mercury
Nickel
§o*•
inoon
i-0oIfJ<r
100
e
Pot ass in
Selenium
B. II
iso n-.0 • .Qk
« c m no •o
t 1 IV CD NN N Vm
N IN O O W —
^§ ^tM C 4T 4M^
VI
- o 4 nN W O IN^ **r)
( i io .N P4
-fO OOM (0
E EL • 3 S'1 5-5 « c c e— O £ - « *tf) in f- *- > is!
rN
•ouuDIttl
eui3ITbL(L
*
ft
1«
Mv.T3IIUII
•a*«uc11na-uEL*
I
K-4
SR3Q 166.3
i.I
L.t
Lr
J
fJv.Ol3
Ca•*•*i*J VC Lft **-t C•D Vc uL CO> Oi uQB
P. _U« flC -.0 —D> Ui-3Oc 3M oM
*4- -«O «cr mD Cw **JJC 7L V.U 4J —C U _Ift U v.U 4J OC II 3U
on -*i *tK — «
L.in &«i ca V« uH C
SU
c«— .«L.o>f
11
u^-w CSi <0e BorutD
€p,XqrtEg<Cr
*XuE3er*u.
u—If c§ fl€ CSEB13E3Ej-ari
i,c
...E^>kucft3B-IIUU.
••eu••i6ft£U
rv <a o t N m o o ow o o . — — o oO w « «N r-
<} e- o i n t n n o win n o — -o rv N— N — N in- «r K)n . «
t 1 1 1 I t 1 !w tv o n ^ i w M —« v. to no-n
"
noovoooq-NOooinooo
n O'ln o«ro> m o-an cf . o «r o M— -c *0* —
•ts on own -o wn4) & . ft — V N B-
O N - T —n nn
i i i i i in o e o — -«« N N 053 nn
noo — **o*-vno»o«*oo
E E ftE X 3 E 3 «3 C U — E g 3 ~<I1XC O — e - * 3 3 — *JL M 1 C L M•~gC3-.--I-.iJ U * 3 11£ . « a i - > - c u a t ! a c -a c o- u *3-^tflL LT!— L ^ a O ^ O C L U— C L « B i « q r o O i . f t < a > a B i - «CCCfflffiUULIUU-jrZEZ
o n o w no .0 • —o n r* inin n
M n o N -o .N . ««• N r> in -•0 0
i i i i iw « «• ' o «•n . N•jj « «*
non^cootn^-
one B- NO * O i "n n o *•M <r
C* 03 N M -0* . 9- • N*• M ffl •<!O N
I I I 1 1CD r- n IOCDN . O . —ff- N » *— n
»Q«-NOOVN
E3 E E E— 3 33* •« u E «* -Ul C U 3 — 13« u > — « c u*i««B*necoai-.ar-« —Q.tnmmt-t->Nj
r1!
"c.Gt!1)
•0v,_034JUIt*>tlTJ*
1XU£
ft
S-fLtt.*
*SI•4
&£flIt
*
•vTJII4JUft4J1)13*1>I'CB)3*;,
K-5
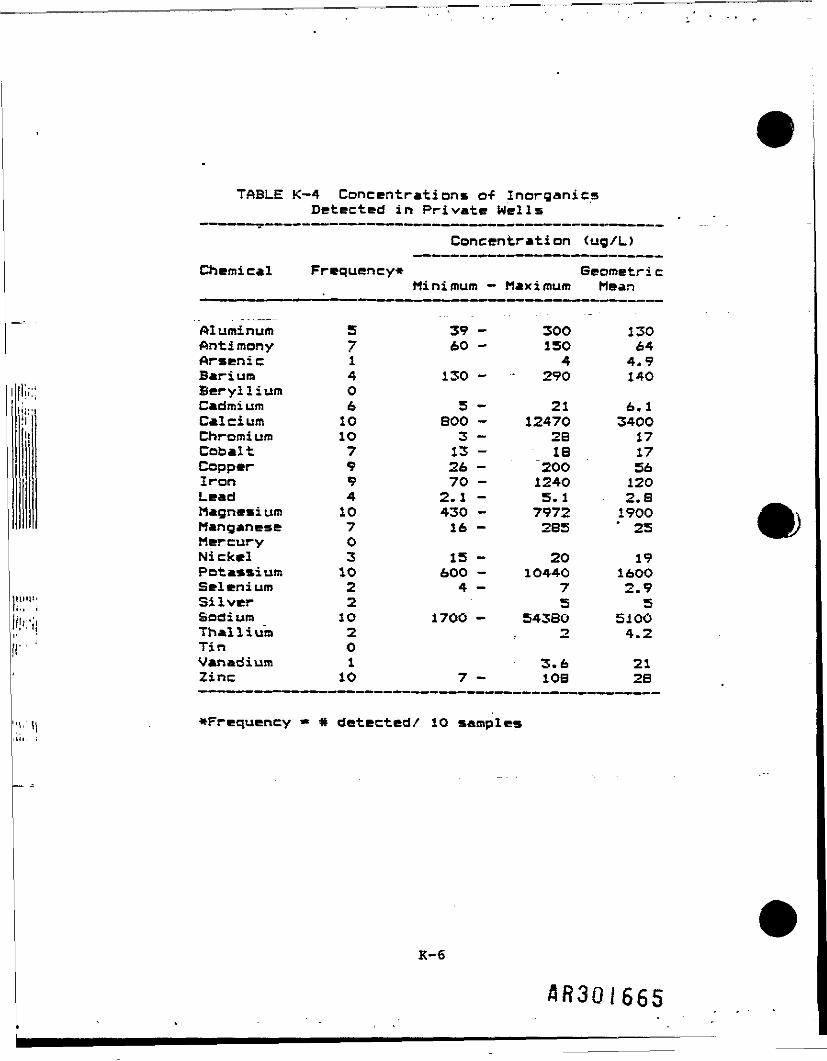
TABLE K-4 Concentrations o-f InorganicsDetected in Private Wells
Concentration <ug/L>
Chemical Frequency* GeometricMinimum — Maximum Mean
Aluminum 5 39 - 3OO 130Antimony 7 60 - ISO 64Arsenic 1 4 4.9Barium 4 130 - " 290 14OBeryllium OCadmium 6 5 - 21 6.1Calcium 1O BOO - 12470 340OChromium 1O 3 - 2B 17Cobalt 7 13 - - IB 17Copper 9 26 - 20O 56Iron 9 70 - 124O 120Lead 4 2.1 - 5.1 2.8Magnesium 1O 430 - 7972 190OManganese 7 16 - 285 " 25Mercury ONickel 3 15 - 2O 19Potassium 1O 6OO - 1O44O 16OOSelenium 2 4 - 7 2.9Silver 2 S 5Sodium 1O 17OO - 543SO 510OThallium 2 2 4.2Tin OVanadium 1 3.6 21Zinc 1O 7 - JOB 28
*Frequency • # detected/ 1O samples
K-6
flR30/665
I.r
cr
££
ft E u-9 & tf*i ^ *»w *--ir —— «a*r> ^ t** n v f«*i a- id <*« •*.j ea « -o jn 33 r ^ --3 ^
_» —I * - - " ^ - 3 s ri *- *^<%« es. i -* *. ^ , i ^ ^
a -a *« ^- ^ eo -«r r** - r+^V l i ^ ^ ^ ^ l S A B ^- «* *^
O ^ & O <=> i9 O "" " Cb
£ £
"" ' 5 £
a s .« ' a = _; 8 § Kg
_ —, f 1 « . v » » < B > -e » ^1^ r* f * * - ^ - ^ o B ^ c « * f c ^ r "
_ v « ^ « > i o r « < a b i n — — wiL . J S _ - . . . -
li »
£ S£ =
S E34U flK *"-- *fc U-^ «st S£
K-7
^301666
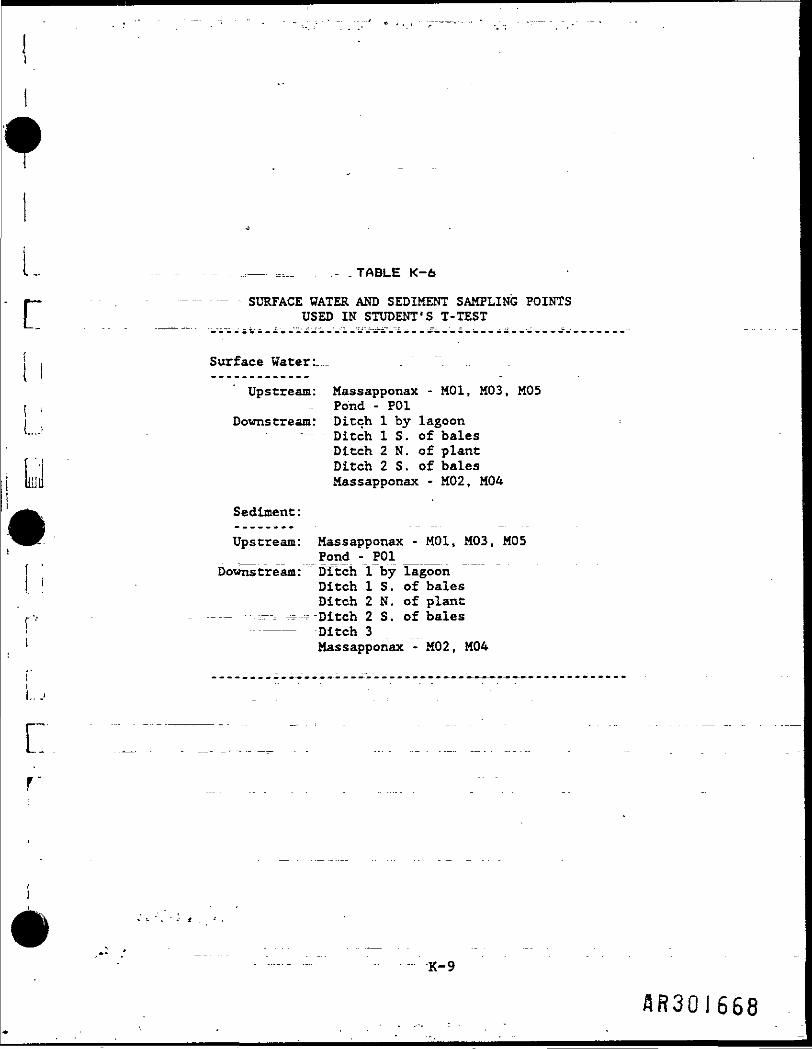
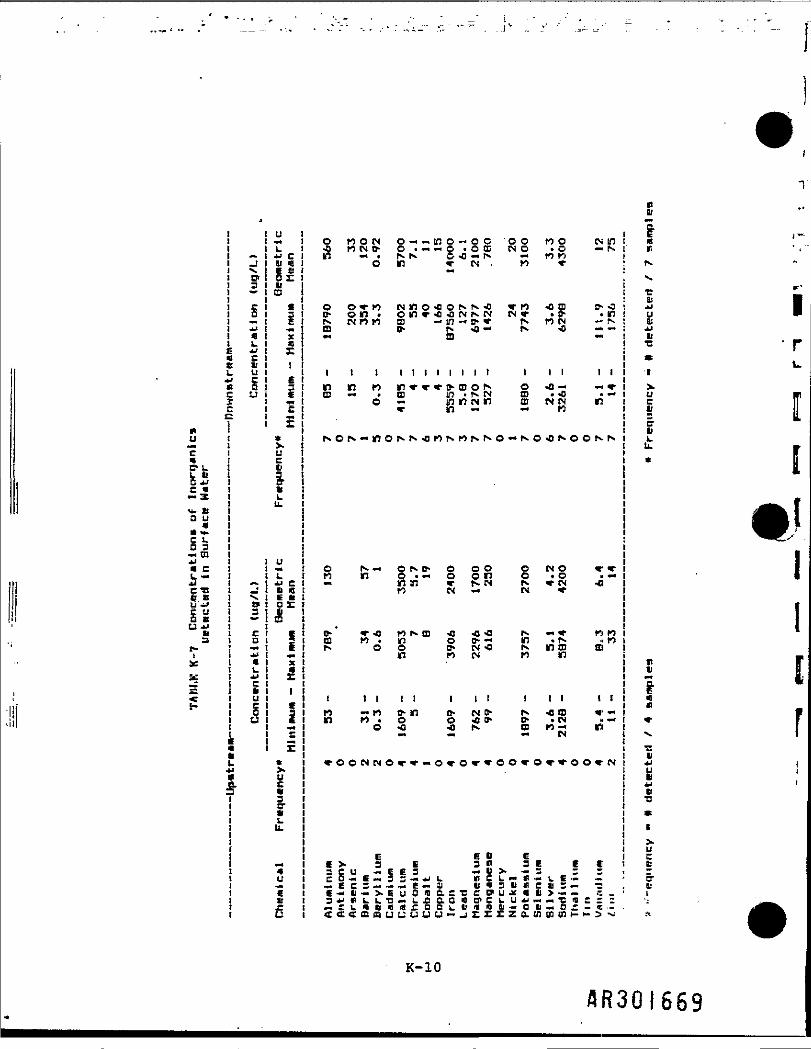
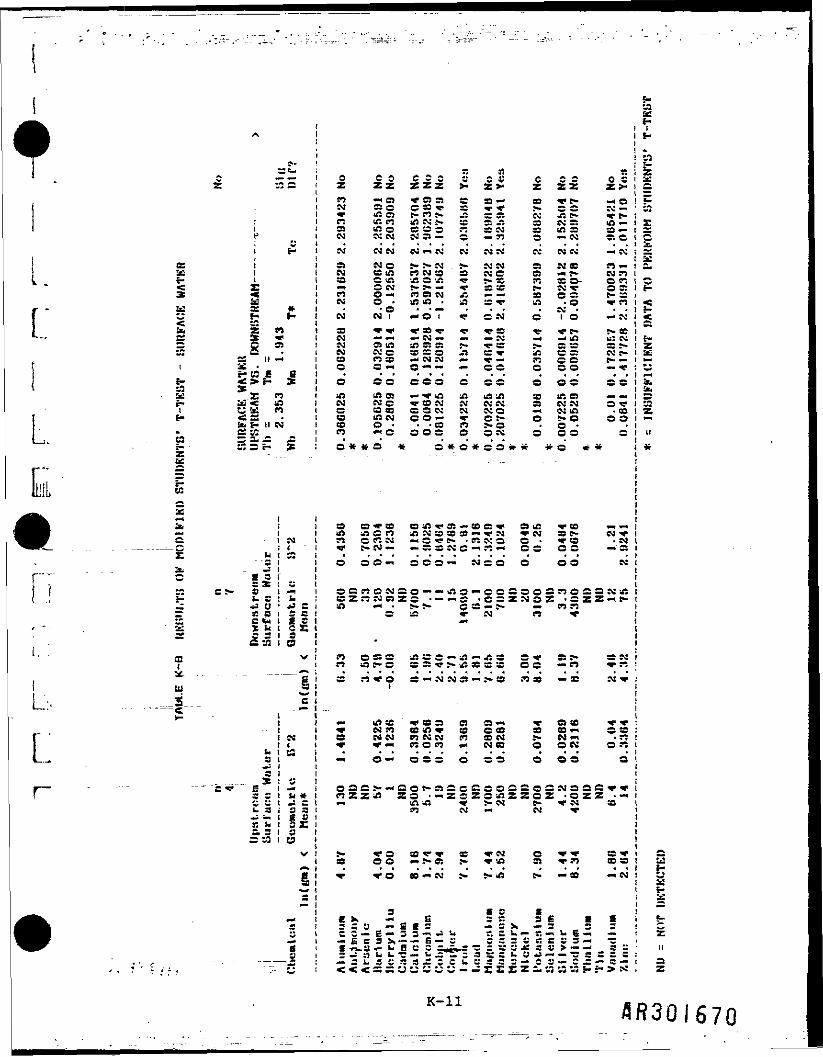
Surface water sampling was conducted at four upstream and seven downstreamlocations (Table K-6). Sampling results are summarized in Table K-7. Resultsof the t-test analysis, presented in Table K-8, indicate that threeinorganics, iron, manganese, and zinc, are present at significantly higherconcentrations in the downstream locations.
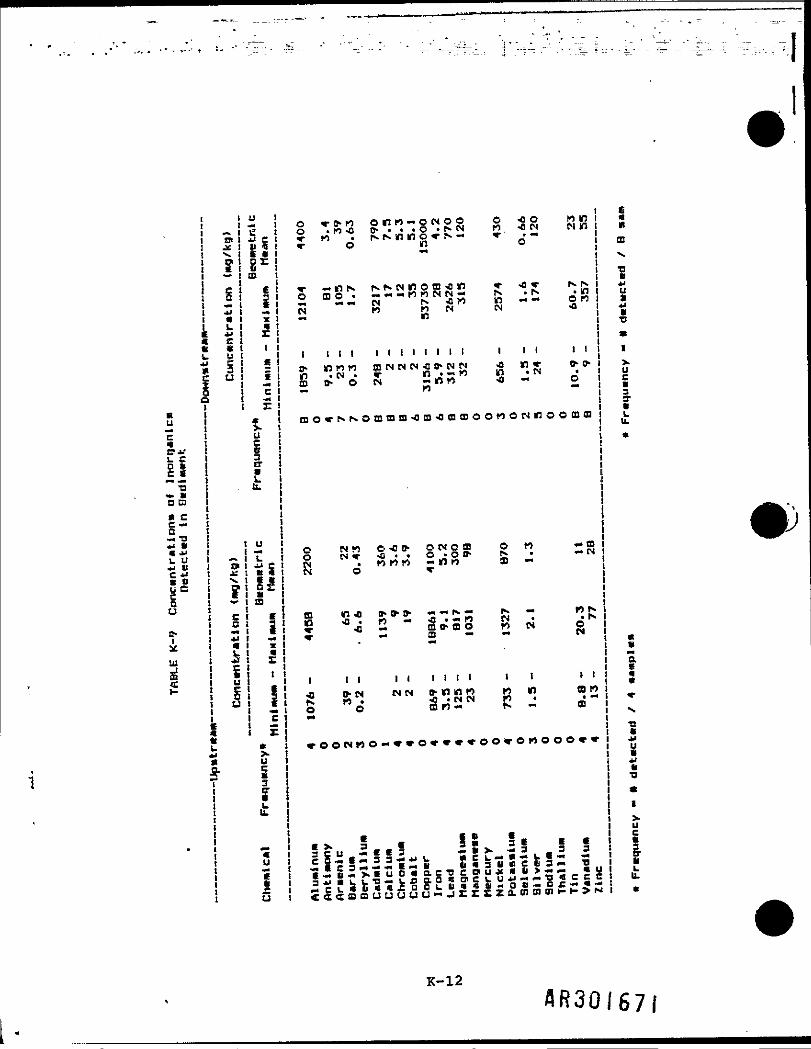
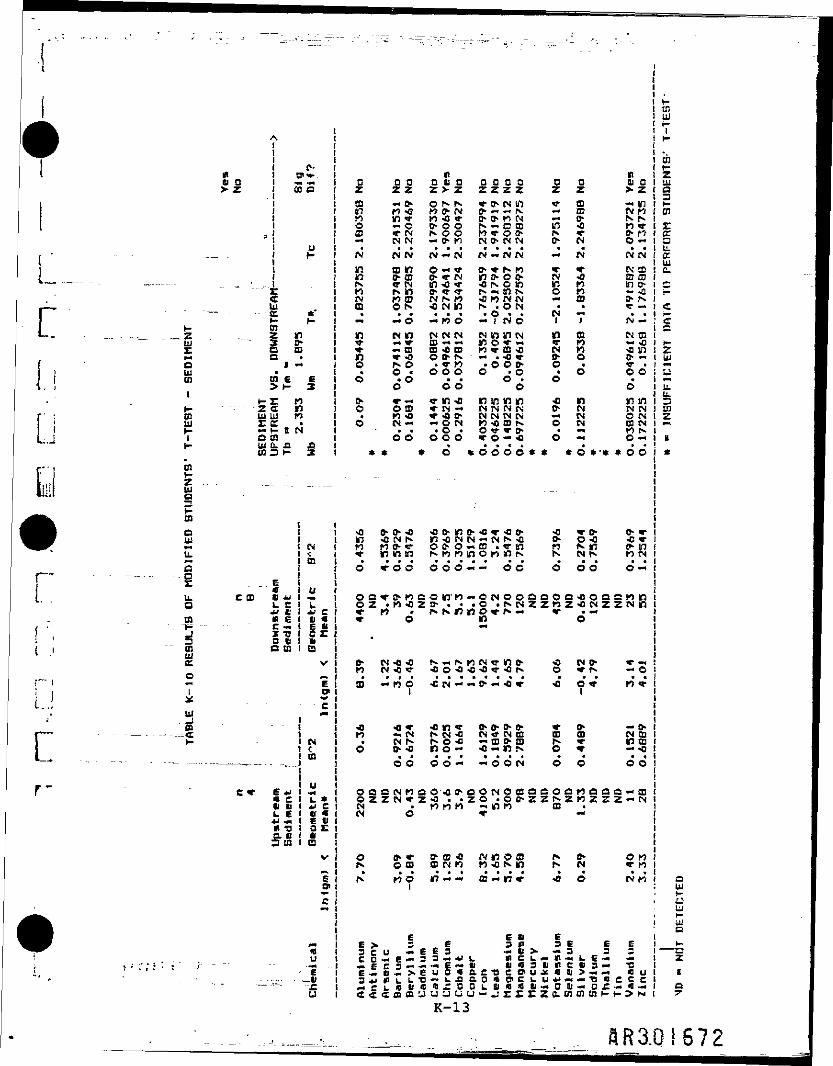
jSampling for Inorganics in sediments was conducted at four upstream and eightdownstream locations. Sampling results are summarized in Table K-9. Analysisof sediment sampling results indicates that for most inorganics, there is nosignificant difference between downstream and upstream concentrations. t-Testresults presented in Table K-10 show that chromium and vanadium were detecteddownstream at significantly higher concentrations.
REGRESSION ANALYSIS
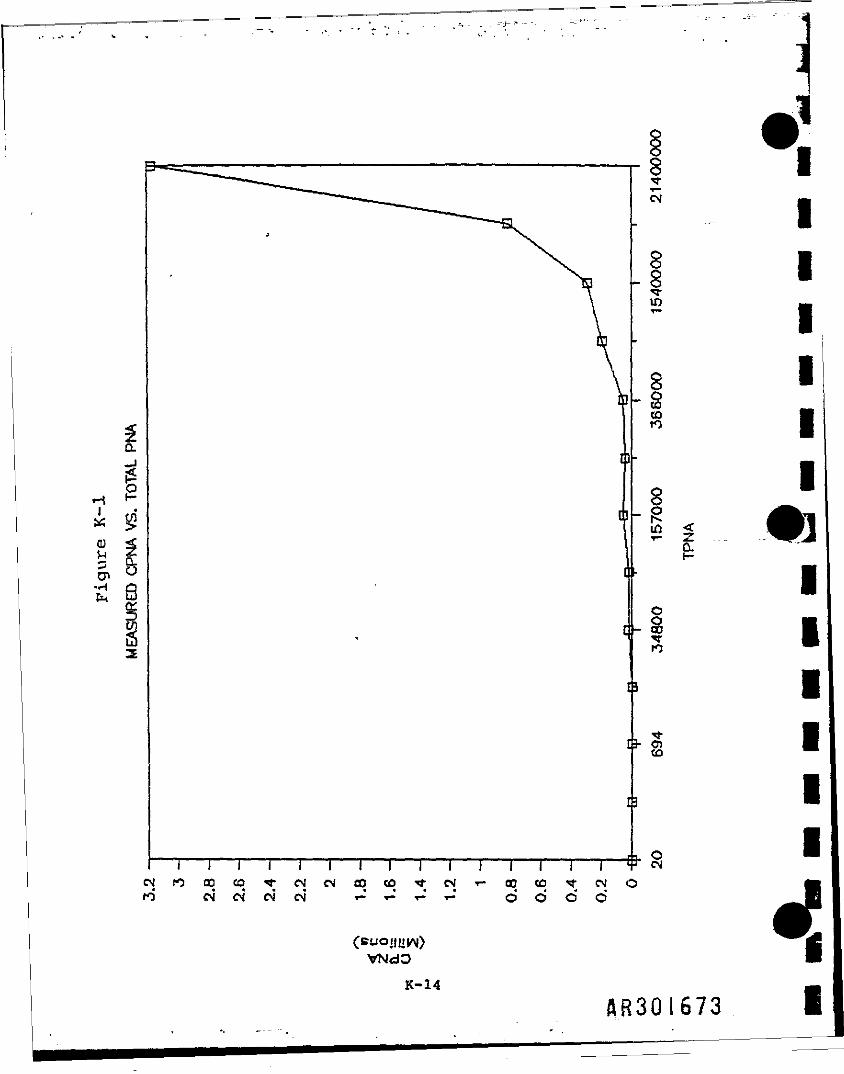
A regression analysis was performed to determine the relationship between theconcentration of carcinogenic polynuclear aromatic hydrocarbons (CPMAs) andtht concentration of total polynuclear aromatic hydrocarbons (TPNAs) In alimited data set. The resulting regression equation was then used to predictCPHA concentrations based on measured TPNA concentrations from a larger diUset. In this data set, TPNAs were sampled at both surface and subsurface soildepths, making it possible to predict both overall and surface concentrationof CPNAs.
For a data set consisting of 13 samples, the measured CPNA concentration*plotted as a function of measured TPNA concentrations (see Figure K-T>.Because this graph showed an exponential slope, a logarithmic tr*n$for»»t1o»was ustd. Using a Lotus II software package on the IBH-XT person*! cowtte*the regression equation of the logs of these data was determined to bey « 0.915092X - 0.27938, where 0.915092 is the regression coefficient (t»eslope of tnt line) and -0.27938 is the y-1ntercept. The regressioncoefficient Is calculated by the equation
I xy
K-8
flR30!667
Ifr
— ,,__ .- _ TABLE K-6
SURFACE WATER AND SEDIMENT SAMPLING POINTSUSED IN STUDENT'S T-TEST
Surface Water:_
Upstream: Massapponax - M01, M03, M05- Pond - P01
Downstream: Ditch 1 by lagoonDitch 1 S. of balesDitch 2 N. of plantDitch 2 S. of balesMassapponax - M02, M04
Sediment:
Upstream: Massapponax - HOI, M03, M05_ __Pqnd -_P01 _ _
Downstream: Ditch 1 by lagoonDitch 1 S. of balesDitch 2 N. of plant
.— -, ,-~ Ditch 2 S. of bales——— Ditch 3
Massapponax - M02, H04
1,,.'
rr
K-9
flR301668
i111•*1\\t
ftu"cnB1 U
C *«™ X
a u*c 0 3— m1« ci. —*jC 3e Bg .i*i Bu -w£3
T*ag^W
4_
'
_-JO»3
i_ •*jQL.
i -W1 E' IT
Uj CB D: ur
**.^*N.93•*^O.hi•L.
1Up
u••k.jnh
uL•w C91 mE StQZvQ
f
j-MXQ
£1E|"H44
E•XUc§itLu.
u— «L.JJ C11 «t IID £tisE|X
I
1
C1Cr
*Xuc*3ff•U.
«44U
"5u
O MOW Q-H-^nO — OC^ MCM^ O IHV^Q *O^n •>«* r^ r^ c -o •" f**on «• rj .••
o o*-w w n o o p N N Oi> on* onv4i4)rvr>>.Nfs NDM O — in -* t> fD i> r* 41 **w Q)
1 1 1 t 1 1 1 1 1 1 t
n in w n***'i>*cDONOJ -* » ffl in • N No — to r? N n«• n —
r x O N ^ n O N N O M N t O N N O
O N *• Of«.O' O OOn n o • - o o r— n n * N NtO 0 *4
•
^ r *o to 0 *o *o 0a to . n o o* —^ o o o- N -on M N
i t i l l l i tM " " M f f - n t > N f rn n • o o 41 1>o -o 3 N
»fOONNO«rw — O^-OW^O
i f S* X 3 E 3 f fc3CU - i C 3 «UXCO— S— 35— *JU K)CL— lei — .-— i-aj v«3e - - 6 - x g u o " B a c - n c D » uD * J # L L . T 3 — L i i a O ' B D* C UM = i . « B « e r a D k . t r i i i a a i<£C<ffisuuuuu»_>rr£
o o no EN inwo »o — s— MMM «•
^r po *o Q ff* W » .0- .10
fv M N — Nfx. <} . — •9H
i l l 1 1
o -o — « *•OWN in— M
**NO«o^oONr''
O N O «• *O .0 . —K * W -0N *
r«- *< * « wn - N -toN n m EDM ^
1 1 1 I Ifs, 41 01 V •"O1 . W « •*o n - * inS "N "
o^-o^-^-ooeN
E3 C E C
- "» - L C •- 3It VI C U 3 •» T•1! 4 ll > •« i— 1_U *J - « « (B C = Z- o t - o r - t -zo.tncn(ni-»-:> -^
eBl"aEeK«"s.
r3JyEJ4JUJ
^
IXuc112c*i)L.U.*
ruIcB
*^
II
U•I••o«1Xueu5.0!L
!*
I
r
K-10
AR3QI669
1fl.L" Sw<
.Xlc:
Lk
tafiC
A£*-
2 tarf
•__ ———
I3C
:i: cl E-iiiX
*£5z n§ * v
ss.
SC 11-4•£ •£*• C3 E &^ r; £ <£** . r ^** -•C "•3U < tACJ &• fS•sabb &• tl CNSf «£S 3- — Si" S r* .E
0Zeow»PtS3N'MAC«JiS•4enNNaCJ?jCMCOC
»oiACMCcoCOr?•
0*
C 0zz— : nSSC<A aif. n(A CN CM
•f 1
M NNOCC 1AC tAO NO -»O •
- O
» **4 W
S3 tAN C^ £OC p pOC.A 9)CM Ca coin No •t~> o•
* 0 *
e s czzz* CS SIc » «•t- n ?*iA CM }•e ss oNSJ —
* * b
CJ •-• OJS- !•* Nn N a.A O .A•» *» Mn CJ cjin IA •t • mm
r* O t
*P CO V— SNJ —iff) ss dCC £ O.•* C*J I*JO — -' * 4ce c
— •" iAv to ccs a ccCO —• • o000
*c *
n>"«— ;^£c«cs:*_a>.AlA
f*P•PB
•>.
.1«
i«~p
C'ANrjno
t0 *
f.V V
a —a ssSI J«a N— ?ik *NNre MP« Ca us__ — •a . rC N« s— .N
a vv ""CO• tc oiA .ACM C>CK Qc r-f-OOKCO* »
czaNaaO«53SIt-ain•c%••«..nJ*!OoCOjj«OO
# *
A n
ZZV C*
Jl (""SN; s:in a•• CO, tN N
M EC^ I*-ao-o f-• o"l O•CT-— tA
CC StCOa oocif. S)N .NCM in*• oo •o ac *
r.o cz >•— oN —V P-lA —a —st e
,, ,— 1\;n —o i":a s:v n« ,— Nt- ec~ •*CM P*t*~ *~— v
v •
a co va oc
*
iE-
fe3Ca.CJg
rP5*.:s*5*f_.5~*i*ZEtkMi;ik.*,~£3Z
u*
I Ut • -J .
t;ij .N
Ur ***I ^*- -s i-3 1
BO 'S E i v
C S1" SJ **k S k•>3 O * «t* 5s a i e a§5
5c 3 i a& OT i ev
§ . _ . ._ . — -
e
N<fc. c3a
. .._ * '-c * g —S C fct *C 3 as£3 a3 «3 C3
v
Sr"
r*Sy_•B
_. _. ._ - —— ——— . i*f •
catArj*O
cts.A
nn™
•»esp•"•
Q
n
>.s^
g2cs3<
CO V CO CO <A ^ 0> *iACfl iflNCOCOSDC t*l fJ •* S <f P~^«— —craiNcsa o —i a c o —
CrtON — O"*" *irtOZ777JS1ZC > — «-<
*H •[«••* Ja — *.f
•O-SS <AvO"-fl4iS?-C S S£ !^ tA,-3*O S " M N S)
1
usjfi *eo» SJOJ !*J CO iA "-F CDN CM P3 Ci N n*~i man *-i< • . - , .o — oca o
£3C*"*«<Ootl*^ScZZ^ ZO • -Z C
n e5
* a a v cO O — f* C! J-* o »' — ey >
a5 y *- € E —C— B— 3 3-, - i-£ C 3 >» — -t i T S^ ^i >u ^ ™ «. J^^MiH3 ^ 2 C ^ * r 9 ^ w C W<<S — UCCUU —
to c; *n .>: a• r; ^Jiao
*• C OP c ~CO •• I*-r\j
— A a3 a «•— >• (O
»-«C COa CMN 03
pC 0
cooZ C %A-*
> (%Jv Xlt rfs
s c— bn z*< a™ • a s£ £
C* ^ !-zz:
a usV CMO >C Co
a a oZ ?J O»
p»
— 00n 3
^S3*•OO*
O £ OzzoN
O
t
•^ LJT
U — K3 w «w J^ 31" a tSrzil
^* CD w 33 t CJ •r co -No c « stO O N
£ rj a £ a x -A•z. ' c z z-« i>-fl ?3^
3s r- a N— n » n— 1C .M »
SI 33 •* »60 *** C 52CM ^ p r?ON OR< • io a 5 a
CMO a c « «z -a z z •->^
* * ts **>n e a— to « cj
e • •3 ^ .•«* k> fr «* —C -V 3 — ITV p^ M *^ •? «T "" S = = =S3 S M ? P > X
£|£Mt—t—5-2jj
az
5R30I670
I
1
+]KU
CmC*.*I_ CO BC S•4 _.at•o*» ftQ CD* C
ntratic
tectcd
ft By cgU
s-15£UI
C
•
u•* £d *1 CJC U <Q•v. EDf gr— EI
£ E5 I4J -*« X1. *•w Ee« iu
. S 1: u f', •**i 1 Ci i ~<i r
>»u£g
E?•L
. It.
U
"S -we.K ft «^ i jf i£*• a€ «O 2«d «« XU «nuC E
1n r*u t*< X* u» c^ ft
3E7
t
*<U
1
1 U
1o rit-n onn — ONOO o 410 n in io «n-o O * ' « » O ' ^ N n 4ipi Mm^- M . N P- n n o r» — »• .—«• o n o—
T ••• n N NNiNnoo^n <• -a «• Kr^o no • *• •" -« ro to N N « N «N . n-. — — N -S. 41 n n *•» -• onN M 10 CN N -3•* n
i iii i i i i i i i i i i < iii> nnw mw.NiN4i.>wN <i n «• o* IT-m .«.*• n.-»n n -Nm i > o M -nn -a ~* o— n <-
movrvKammm4icD4iaa)Oonor4inoo..aai
§NM O-CO* 0 N O OJ O M —03IN V 41 .« O • O l> N. • —INI N . t o M M — n n n «
N O T
ta «4i mo-fl**-! ««r*.— r s - « «?*•to 4i « M — 4j . *• n w . « r-.T 41 — m 0» ffl O MM PV — JB — -• N••
1 II 1 1 1 I I 1 11 II-a O-N NN o-nnn n n tonv n. -o • IN IN n» •-•O O OJlO*" N'-. <D«M
«*OOWWO-»«'O«'W*«'OO«rOMOOO.»'W
EX i • IS *E EK3CU - * C 3 -. B x ^ D 3 3C§— *--«33—J+»U f C L — «--uE— —-Ic3^-.-.-E-^U 5«3U.flCt3.- -QE - . B - « x « u o - i a e < D c o ' u J £ * i . > — — «u3-u * w i. — -- fi g.o«gici.u*j-*^-'a«ccc^ i C l , * - U « « £ 3 O L . U i * S I « Q . U - . Q £ - « * —«acoauuauu«Jtrtza.cnaii.ni-i->Ki
E«BCDX
TJD4JU
*lft^
*
1
>Ucft3CfftLU.*
•ft••|-m**x•e•jjuftjjft•D*1XU1trftLU.*
K—12
AR30I67I
Lr .2LU
Oui
1C
.-1 I*"
-N
ffb o> Z
J>-0"*.3 O
u
" "•"::<cUJ
- • " fll *t— 1—HJz n1 o*O IDD
1
tn € e>. _ 4I— .£
HE n- --: zc nui u nEG* •— 1- B No tnW3 K il
ifflinKJoCD-*
NininfstoIMffiVI
n*nod0"od
*
fl 0z zw* £hto <cn -. o,N ININ N{BinEh CD«T Mis nM (D• *
V« O
wn„ CDNOO *• OoV •*o ton 4i01 —• •o o
*
oQ B] az >- zO fs. fsn Et* tN(0 4J TD* o O?*• O O— t> MN — INO-*t> «• rjin 4) -rIN N n4i N nm • •— MOtN W NQJ V4 V4
ffi 4) D• *T MOOO
• •oov tn 4t* 41 0*— O IN• O *OOO
* d
o azz^ c^tp* ~*0* 0*N -*N Ef-N «0* »n t>4t Nfv •«4i n• d- t
0 0zzW Ift«-i Nn wg ffi
N NW INN n0 tf££n r*.IN INO N* »NO
CM inn Nin oM «r
X®o
in inN NN CMn 4iO *^*o
* d d
•jf- 4
m 4io?«°o >onnIN NIN IN0) N.V 0-— 41do*
I^>•<MinN0-v-l
*•wtoo•••
INIn•NOd410-M
O*
O*
QZ03mo-•o•f
*IN*41nnffl.v*
1
ffl(Onod
nININCM*"•*4
* d *
n0)>••Pi[*»n0*O
0zinf*.«•to—
IN NttIBm•.ChtNfj4
41«<rO*
OinINO(
O•» * d
sso-4iN>•,w
tn4)inio
nENcsfV
—
d
tninit-tnt-zwQ=1HcnraL.a:tuc.f~Hcr—
e>-z*•uIt.IkuizK*
r u. cma01"H - „.01utroiuat
ee u e•u tc es-5o ua to
E +>fi C11 5L. E4J —• -a3 in
- .... .
INtn
uIcII «E ft0 EftQv
1C*
(•
INtn
u•M
k **« CV «E tlSE
1 0v
e»c
**u"E~ru
41nTd
ooVV
oM*
ID
41nd
ooININ
OIS
N
E3C13•4C
t> th 4)41 N Nn o* «•n n nwoo
a* a- nz • n 4jw «o
M O 41IN 4t «•-no
•0 *— INN Nf> .0
0 0
o a IN nZ ZN «T
d
t> *o a>noi
EX 3c u -D — E —•>• tJ -n X*l P U LC L * *>X & & Si
41noNo
e oZ a-
(V
41
4!
41f
fvno
0 OZ 41to
fl-atn
E E3 3,., »«.|E U•o ~<C QU U
tr no-41 IN N0-0 —n n m00-
*rn —« « «N n n
— r>. MO 41 41P4 -* —
n *IN 41O 41O —O -
41 0- OtO M
to oEM nM OH
E— *•* UE **/ Ifo « aL a ar 0 ou u u
41 V 415 . «•o M n- o
O IN 0O . NO isnv*
N -r inO ,}. o
£h «« 4i
O- 0- 0*N N— O 0*4t-n-0 O
O N OO • O- in n
wn on 41 isto — n
E3tnti
C -Q C0 « O>L Bl fi- J E
0-41Kl
C
O Q ONZZ
0-
.4.
0-mtoisIN
maco- zz
Sn*•
tiSxC L. —fi 3 IIC" U *C L U* t —CEZ
-0 «r 0-0* O 41n N nN N Nd do
o a 4t oM Z 41 N•r • —o
41 IN Oo » r.41 d*l
* t>to oN WO ** •
O 0
o on QtsznzCD ••M
IS 0*is Nt •
41 O
E3 E— 3Id — L €It C U 3« ai > —4J -. -. -Bo ai - Da. 01 m tn
0"4tnd
a fi nZ ZN
^—n
..Nn— .d
oa —Z 2-
O
;nts*
nn
„o*
t>CQCD
d
CDN
tonIN M
E €3 3•M VI— -o"« e c£ - «K t- .>
uc•-«h»i
uUJt-uUJQ
t-— cZIQ7
K-13
ftR3.QIS72
F
IIIIII•jIIIIII
VNdO
K-14
AR3QI673
wherex - deviation of a data point (x) from the geometric mean (X); and
y - deviation of a data point (y) from the geometric mean (Y).
The y-intercept 1s calculated by substituting the means (X and Y) Into theequation and solving for b:
_ . o.^lx + br
Qi
L
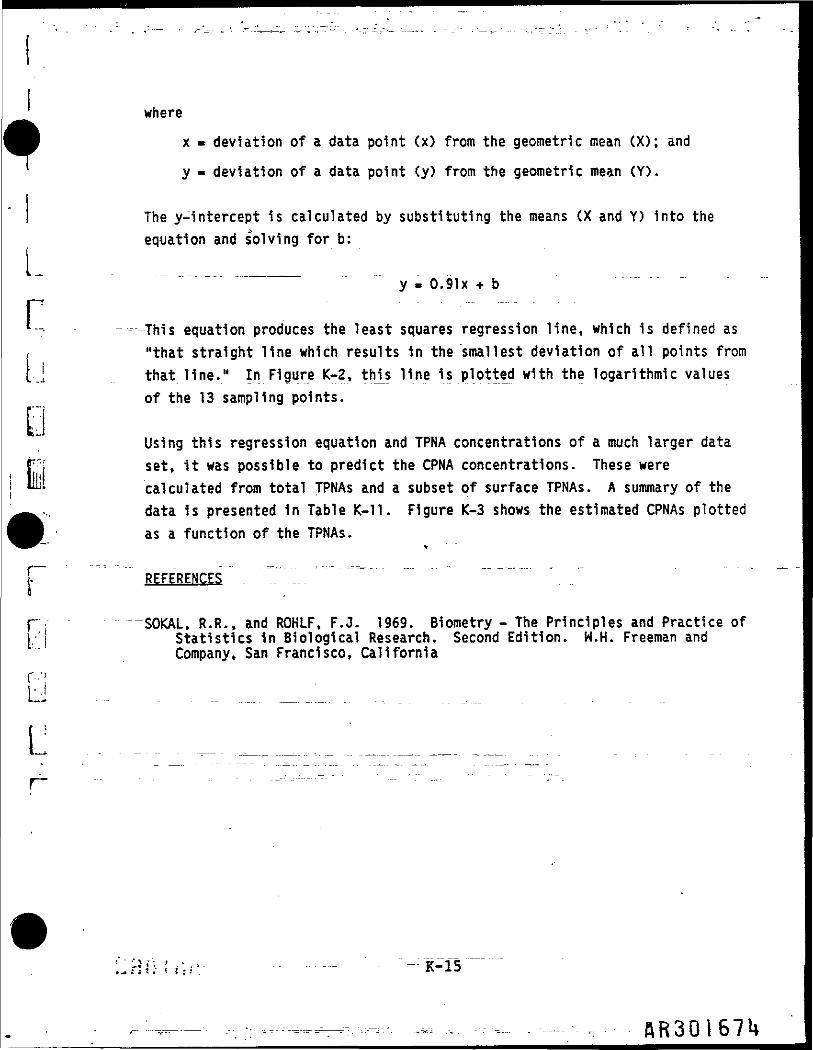
This equation produces the least squares regression line, which 1s defined as"that straight line which results In the smallest deviation of all points fromthat line." In Figure K-2, this line Is plotted with the logarithmic valuesof the 13 sampling points.
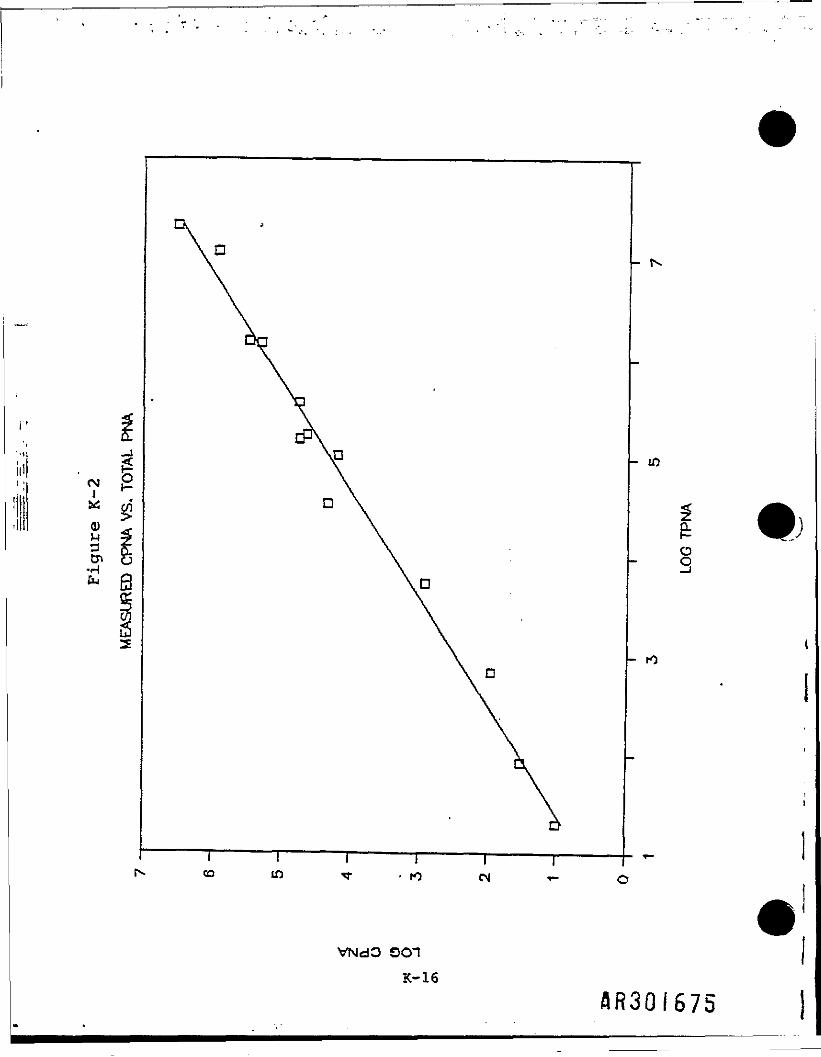
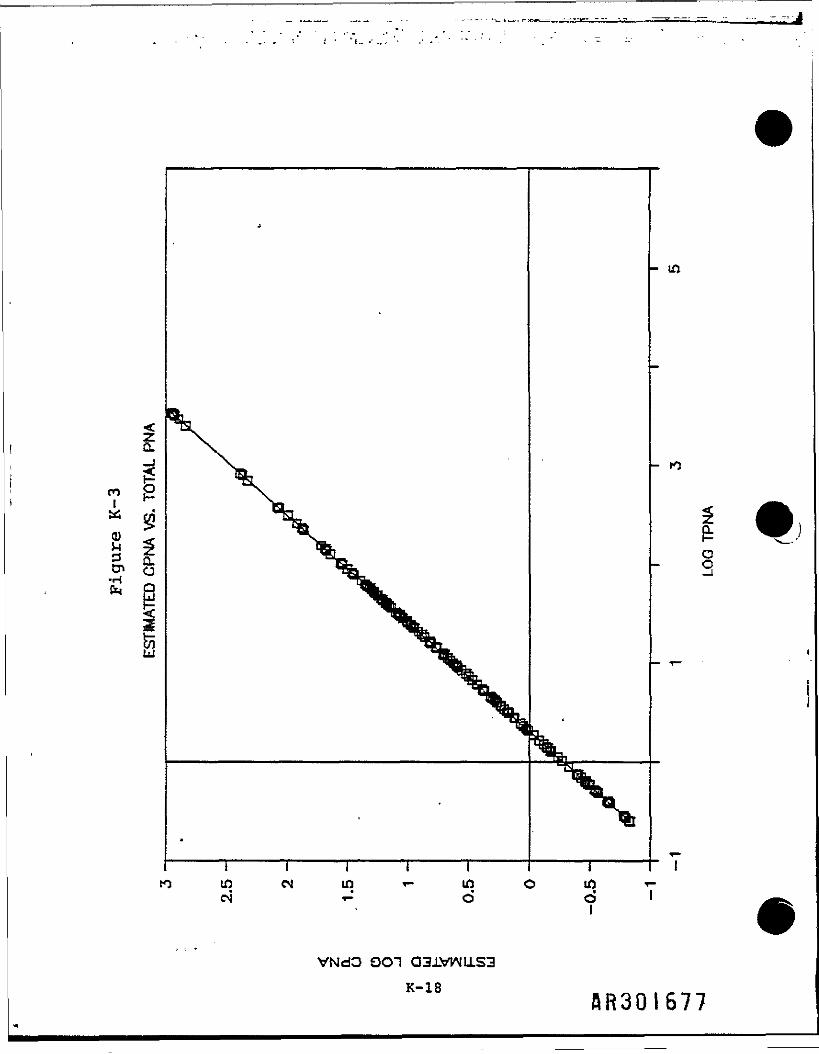
Using this regression equation and TPNA concentrations of a much larger dataset, 1t was possible to predict the CPNA concentrations. These werecalculated from total TPNAs and a subset of surface TPNAs. A summary of thedata Is presented In Table K-ll. Figure K-3 shows the estimated CPNAs plottedas a function of the TPNAs.
fr REFERENCES . "."_..."
p -$OKAL, R.R., and ROKLF, F.3. 1969. Biometry - The Principles and Practice of[ ) Statistics 1n Biological Research. Second Edition. W.H. Freeman and
Company, San Francisco, California
K-15
fiR30l67U
g
ns * \ £ W)
CO LO
co
VNdO OO1
K-16
flR30(675
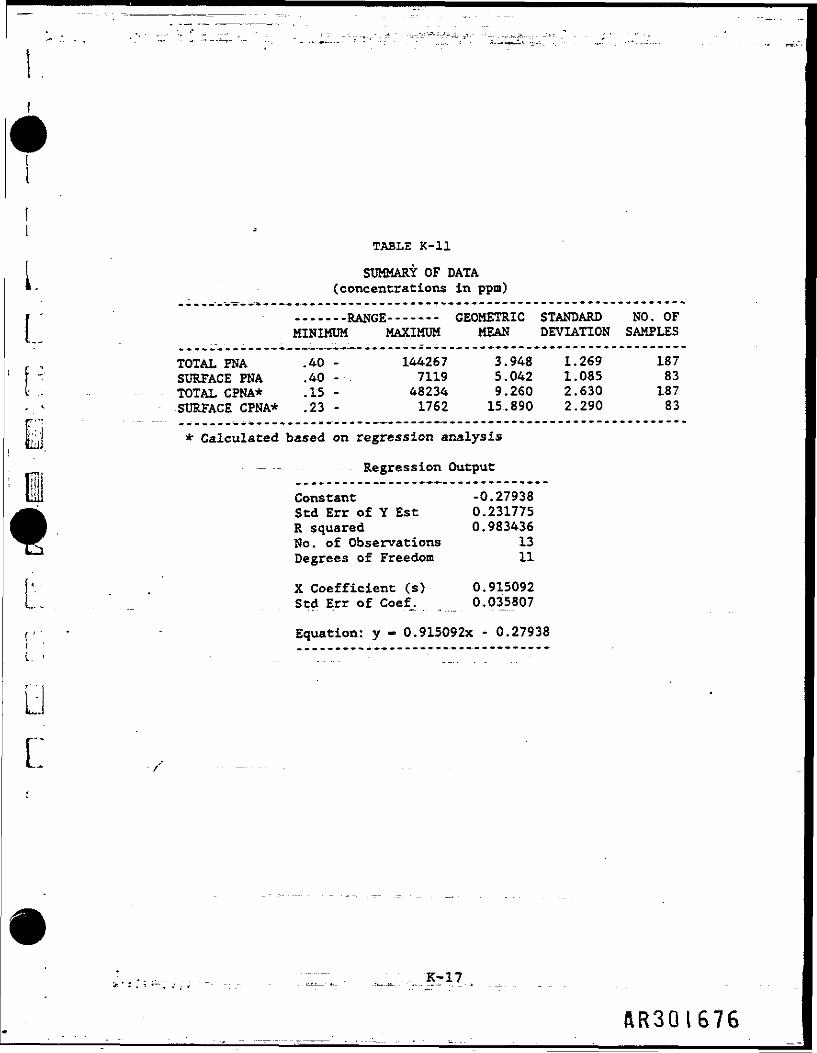
TABLE K-ll
SUMMARY OF DATA(concentrations in ppm)
E :
...i...RANGE--——— GEOMETRIC STANDARD NO. OFMINIMUM MAXIMUM MEAN DEVIATION SAMPLES
TOTAL PNA .40 - 144267 3.948 1.269 187SURFACE PNA .40 - 7119 5.042 1.085 83TOTAL CPNA* .15 • 48234 9.260 2.630 187SURFACE CPNA* .23 - 1762 15-.890 2.290 83
hj * Calculated based on regression analysis
— -— - - Regression Output
Constant -0.27938Std Err of Y Est 0.231775R squared 0.983436No. of Observations 13Degrees of Freedom 11
[V . X Coefficient (s) 0.915092L. Std Err of Coef. 0.035807
f ••• • Equation: y - 0.915092x - 0.27938i ' ...__...._..,.__.........— ......_..1. - . . . . . . .
Lr
Kr17 .±
SR3Q1676
&Q
VNdO OO"1 CI3.LWJLLS3
K-18SR30I677
L
L
L
Appendix L
1R30I678

L
APPENDIX t
SURFACE-WATER EXPOSURE MODEL
f '
0985B
4R30J679
_.
APPENDIX L
SURFACE WATER EXPOSURE MODEL
INTRODUCTIONi
In order to assess the potential Impacts from contaminated soils andgroundwater at the L.A. Clarke site on aquatic life and those who may consumefish from the Massaponax Creek, a simple screening model was developed. Themodel develops a relationship between contaminant levels 1n soils andgroundwater at the site and average annual surface water concentrations in theMassaponax Creek at a point downstream of the site. The model is used in twodifferent modes. In the first mode, the soil and groundwater contaminantconcentrations detected during the RI are input to the model, and the averageannual surfacejrfater concentration 1s estimated. The surface waterconcentration is used to assess the risk to aquatic life and to thoseIndividuals consuming fish from the creek under a no-action remedialalternative. In the second mode, surface water concentrations that areprotective of aquatic life (I.e., corresponding to no risk) are Input to themodel and corresponding soil concentrations are back calculated. Thisprovides a risk-based cleanup standard for on-s1te soils.
Surface water concentrations consist of two components: (1) dissolved and(2) suspended. Assessment of risk to aquatic life requires that the totalconcentrations (dissolved plus suspended) be estimated. At the L.A. Clarkesite, there are two pathways contributing to dissolved concentrations in thecreek: surface runoff and groundwater recharge. Soil erosion Is the onlypathway contributing to the suspended portion of the surface waterconcentrations.
Surface water concentrations are estiroateTTbr the three indicator chemicals:benzene, carcinogenic polynuclear aromatlcs (CPNAs), and total polynucleararomatlcs (TPNAs).
L-l
SR30168G
The model development proceeds as follows:1. A water balance calculation 1s used to apportion the annual rainfall
at the site among surface runoff, Infiltration, andevapotranspiration.
2. The dissolved contaminant loading rate 1s calculated using thesurface runoff and infiltration rates calculated in step (1) andassuming^ equilibrium partitioning of contaminants between soil and
- water.
3. The suspended contaminant loading rate 1s calculated using theuniversal soil loss equation.
4. The loading rates are summed together and then divided by the totalsurface water flow rate in the Massaponax to produce an annualaverage concentration.
5. The second mode of the model Is used by developing suspended anddissolved loading rates based on data generated during the RI.
6. Protective concentrations are Input to the model and risk-basedcleanup levels 1n soils are developed.
HATER BAIANCE
The total annual rainfall at the site was partitioned using the water balanceequation:
P - E + R + I
where •P m total annual rainfall (In/yr);
E » evapotranspiration (1n/yr);
R « runoff (1n/yr); andI • recharge to groundwater (1n/yr).
Total annual rainfall (P) was given as 41.4 in/yr (Weston 1985).Evapotranspiration (E) was estimated as 31 1n/yr (Geraghty et ai. 1973).Runoff (R) was then estimated using a variation of the U.S. Soil ConservationService curve number equation method developed by Stewart et all. (1976 asreported 1n Hills et al. 1985). The curve number equation Is widely used forestimating runoff from Individual storms. The curve number describes thehydrologic condition of the land surface, Including cover, soil management.
L-2
.flR30i68J
L
L
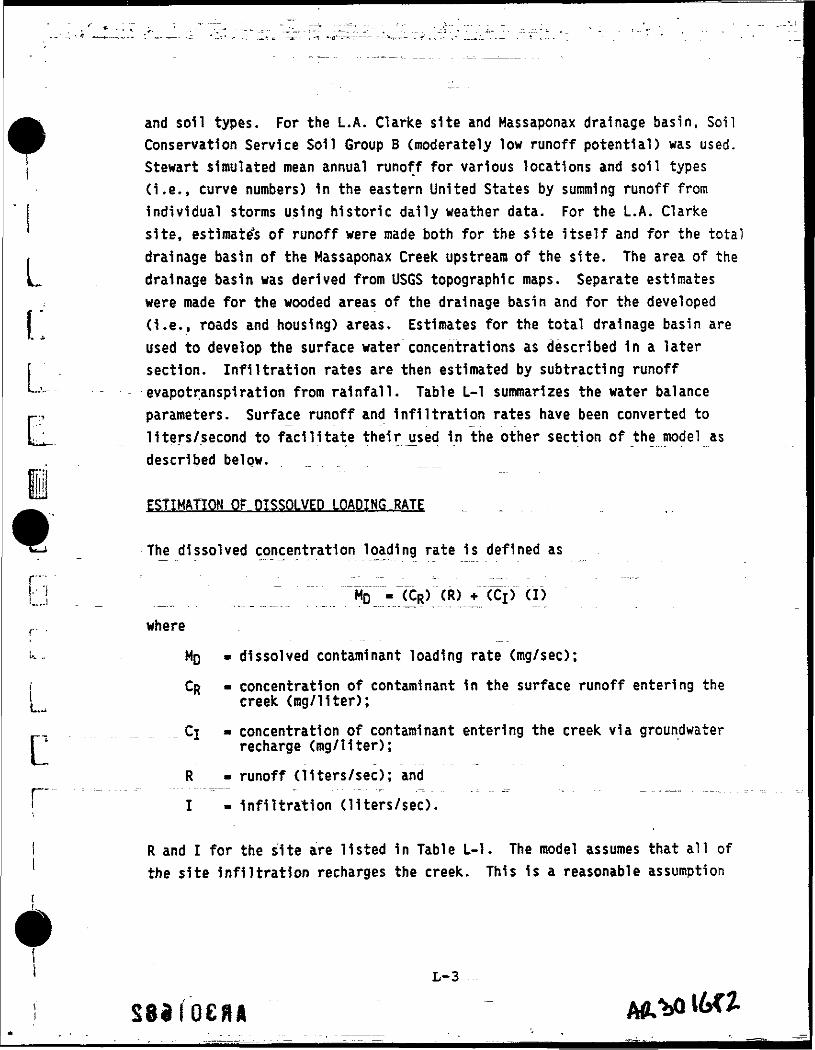
and soil types. For the L.A. Clarke site and Massaponax drainage basin, SoilConservation Service Soil Group B (moderately low runoff potential) was used.Stewart simulated mean annual runoff for various locations and soil types(i.e., curve numbers) 1n the eastern United States by summing runoff fromIndividual storms using historic daily weather data. For the L.A. Clarkesite, estimate's of runoff were made both for the site itself and for the totaldrainage basin of the Massaponax Creek upstream of the site. The area of thedrainage basin was derived from USGS topographic maps. Separate estimateswere made for the wooded areas of the drainage basin and for the developed(I.e., roads and housing) areas. Estimates for the total drainage basin areused to develop the surface water concentrations as described in a latersection. Infiltration rates are then estimated by subtracting runoffevapotranspiration from rainfall. Table L-l summarizes the water balanceparameters. Surface runoff and Infiltration rates have been converted toliters/second to facilitate their used 1n the other section of the model asdescribed below.
ESTIMATION OF DISSOLVED LOADING RATE
The dissolved concentration loading rate 1s defined as
r . where* - Mg » dissolved contaminant loading rate (mg/sec);j CR - concentration of contaminant in the surface runoff entering the1 creek (nig/liter);\+++±
.._ Cj - concentration of contaminant entering the creek via groundwaterrecharge (mg/Hter);C
R - runoff (liters/sec); andi I - Infiltration (liters/sec).
R and I for the site are listed 1n Table L-l. The model assumes that all ofthe site Infiltration recharges the creek. This Is a reasonable assumption
L-3
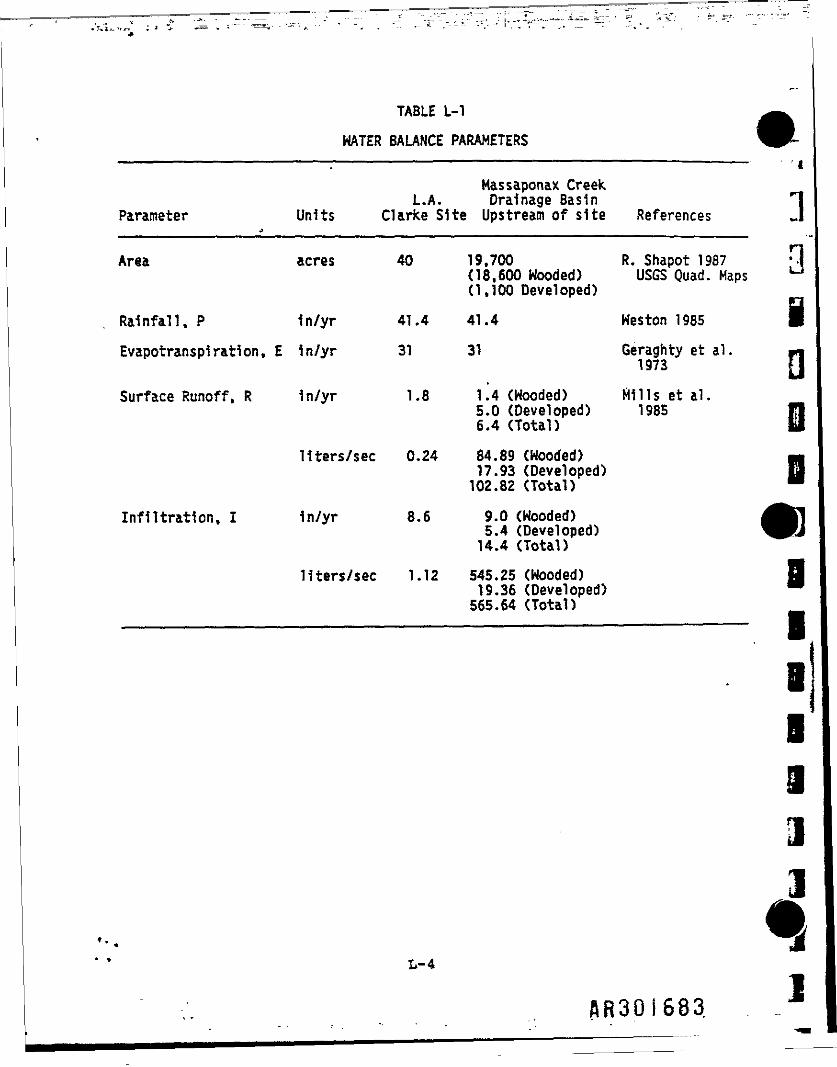
TABLE L-1
WATER BALANCE PARAMETERS
Massaponax CreekL.A. Drainage Basin
Parameter Units Clarke Site Upstream of site References
Area acres 40
Rainfall, P 1n/yr 41.4Evapotranspiration, E in/yr 31
Surface Runoff, R 1n/yr 1.8
liters/sec 0.24
Infiltration, I 1n/yr 8.6
liters/sec 1.12
19,700 R. Shapot 1987(18,600 Wooded) USGS Quad. Maps(1,100 Developed)
41.4 Weston 1985
31 Geraghty et al.1973
1.'4 (Wooded) Hills et ai.5.0 (Developed) 19856.4 (Total)84.89 (Wooded)17.93 (Developed)102.82 (Total)
9.0 (Wooded)5.4 (Developed)
14.4 (Total)545.25 (Wooded)19.36 (Developed)565.64 (Total) •
L-4
AR30I683

Hi:
*
*
given that the shallow depth to groundwater and the clay layer below the siteInhibit any downward migration of infiltration.
The concentration terms CR and C, are derived as follows. For benzene,CR is assumed;to be zero because no benzene was detected In soils. Cj istaken as the mean and maximum values of benzene detected in downgradientmonitoring wells at the site (47 and 150 jig/liter, respectively). For theCPNAs and TPNAs, the loading rate concentrations are derived from soilconcentrations as follows:
CR - c:where
CSOIL • concentration of CPNAs or TPNAs 1n the on-site soils (mg/kg);and
KD - soil -water equilibrium partition coefficient (ml/g).
In order to simplify the calculations, it is assumed that the loadingconcentrations for surface runoff and Infiltration are equal. Since the meanconcentrations of PNAs In surface soils are roughly equal to the meanconcentration for all soil samples (see Appendix K), this 1s a reasonablesimplification. The average and plausible maximum case values for CR andCj are 4 mg/kg and 50 mg/kg for CPNA and 9 Big/kg and 1,800 mg/kg for TPNAs.corresponding to the geometric mean of the soil samples and the 951 upperconfidence limit concentration, respectively.
The partition coefficient 1s defined as
.__..... Kdwhere
KQC - the organic carbon partition coefficient (ml/g); andfoe " tne fraction of organic carbon in the soil, assumed to be 0.0005
(0.05%) for the L.A. Clarke site based on the median value oftotal organic carbon analyses of soil samples.
K for the TPNAs was determined using a weighted average of theconcehtratTons of the 13 PNAs "detected in the nine soil and sediment samples.
L-5
* r r - : i u - _ - • - . - 3R30I68I*
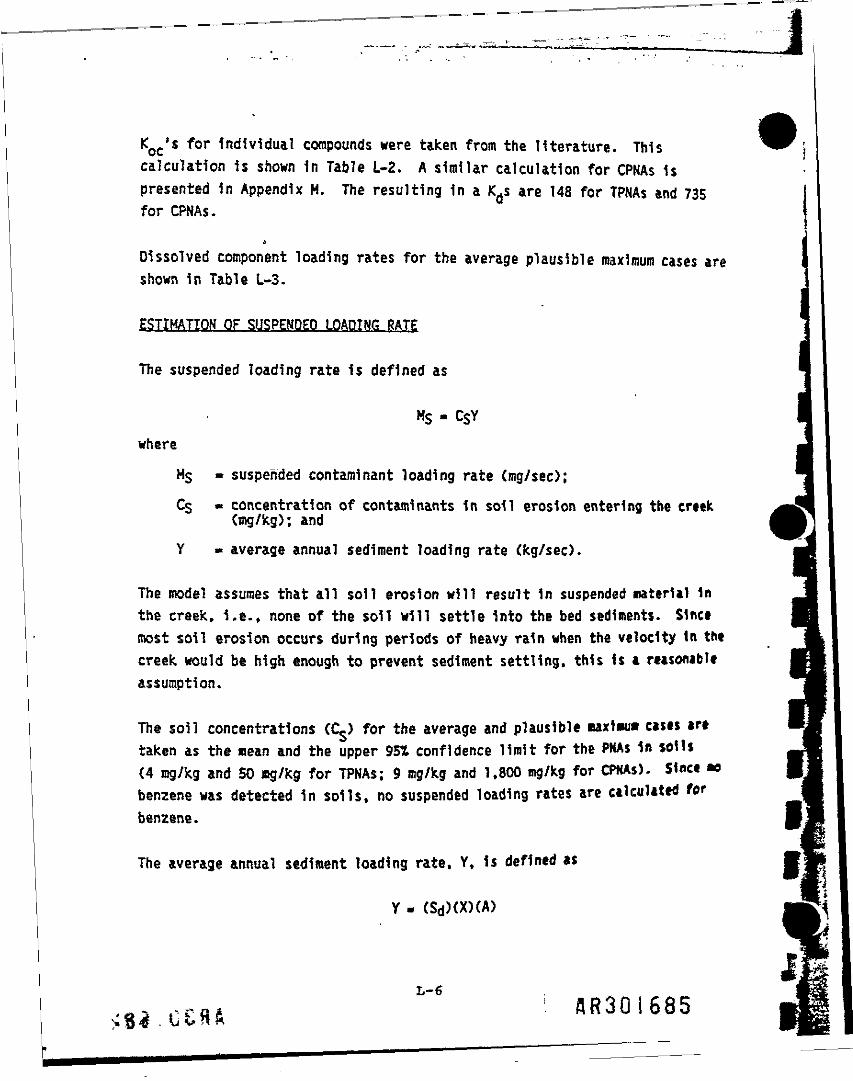
KOC'S for individual compounds were taken from the literature. Thiscalculation is shown in Table L-2. A similar calculation for CPNAs ispresented in Appendix M. The resulting 1n a Kds are 148 for TPNAs and 735for CPNAs.
3
Dissolved component loading rates for the average plausible maximum cases areshown in Table L-3.
ESTI TION OF SUSPENDED LOADING RATE
The suspended loading rate is defined as
MS - CSYwhere
MS » suspended contaminant loading rate (mg/sec);C$ - concentration of contaminants in soil erosion entering the creek
(mg/kg); and
Y » average annual sediment loading rate (kg/sec).
The model assumes that all soil erosion will result in suspended naterial inthe crtek, i.e., none of the soil will settle into the bed sediments. Sincemost soil erosion occurs during periods of heavy rain when the velocity in thecreek would be high enough to prevent sediment settling, this is a reasonableassumption.
The soil concentrations (C ) for the average and plausible naxiwm cases ar*taken as the mean and the upper 951 confidence limit for the PNAs in soils(4 mg/kg and 50 fig/kg for TPNAs; 9 mg/kg and 1,800 mg/kg for CPNAs). Siflct «obenzene was detected in soils, no suspended loading rates are calculated forbenzene.
The average annual sediment loading rate, Y, is defined as
~miY - (Sd)(X)(A) |m£

L.7
i:
..
iM O.
UlC£ -J
CM «
Ul U. M
eo ° z<: z ot- O ft
||Ul CJ0 g
— . ...
uo
o1—
eno
o
iCMO
O
•ye
*
CM
£
10CMU
<oCM
a.
ISsssSi•— «— en f CM
^ F—
in r*. T- *- t-« o. mo o o o o o o
ec to CM <*tO in C C3 CO * U3
- CM « w in « -»
CM en[ l l l to l r^
1 l E 1 r- 1 0>
o i l i •— l P-CM en CM
o en i co o o oCM eo •— en
CO
«gg|SS|
101 t en CM *•«• 1 5
CM -*
O 1 O O O O Oto o o o o oto «— m *o in CM
fi CM •— co «0 i— in
iiiiiil^ ^ CM CM en en
CM
* a» a»» c c cw t2 i- f c"» j; c *> c o
^ •— eo eo CM CMtn ^ co c^ enCM «M er» O o
CM
CM CM"-T in CM O &
O O O 0 0 O
»—.— .— en inin c in in o to cp•"" D in CM r.— •— •— CMen
•- «M O
I r--1 W ! o t
CO
l r- m i in tfi•—CM CM
1 p- 1 1 1 COro CM
i e r- its t l<o r in
r tf) to 1 Ot cotO tO r— CM CM
10 min to <0 l CM F*
o o 1 I o lCM en >
eo o l 1 r>- ICM CM
So o l o lo in en
^
co> ^ atI- C Cdt ^ at atc » Q. .e j= -
u * -o c c« t. i. A <a*- >. en O of O, CM I- M I.** 41 --* •— 3 •- 3IB 4» •— ' O 1*- g <*-O in O C O 5 OM >| N O> N V) Ne i- c TS c «- e
meoo*
c...3U
toen•
13
ene•5•ooc.
£ 2
t **eo *>
CM 2 H
• I •«*•»
. 8 <3^? O *"*-* x yo1 CO 0
> C7> M< CM W01 "U) 3S-o o
£ (rt
L-7
flR30i686
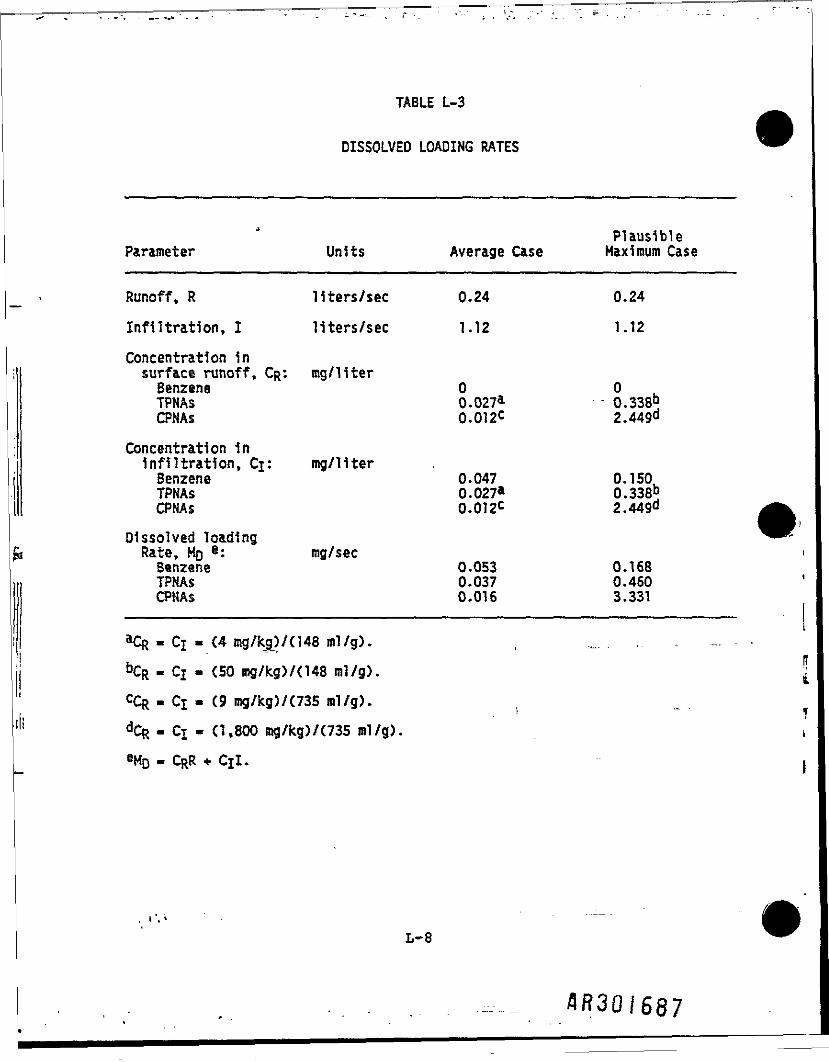
TABLE L-3
DISSOLVED LOADING RATES
Parameter
Runoff, R
Infiltration,
Units
liters/secI liters/sec
Concentration insurface runoff, CR: mg/literBenzeneTPNAsCPNAs
ConcentrationInfiltrationSenzeneTPNAsCPNAs
in, Cj: mg/11ter
Dissolved loadingRate, HO g: mg/secBenzeneTPNAsCPNAs
•Cfc.Cj.C4 mg/kg)/(148 ml/g).
Average Case
0.241.12
00.027a0.012C
0.0470.027a0.012C
0.0530.0370.016
PlausibleMaximum Case
0.24
1.12
0.338b2.449d
0.150L0.338b2.449d ^
0.1680.4603.331
&CR - Ci « (SO mg/kg)/(148 ml/g).
CCR - Ci - (9
dCR- Cj - (1,
mg/kg)/ (735 ml/g).
800 mg/kg)/(735 ral/g)., ^ • i
i
L-8
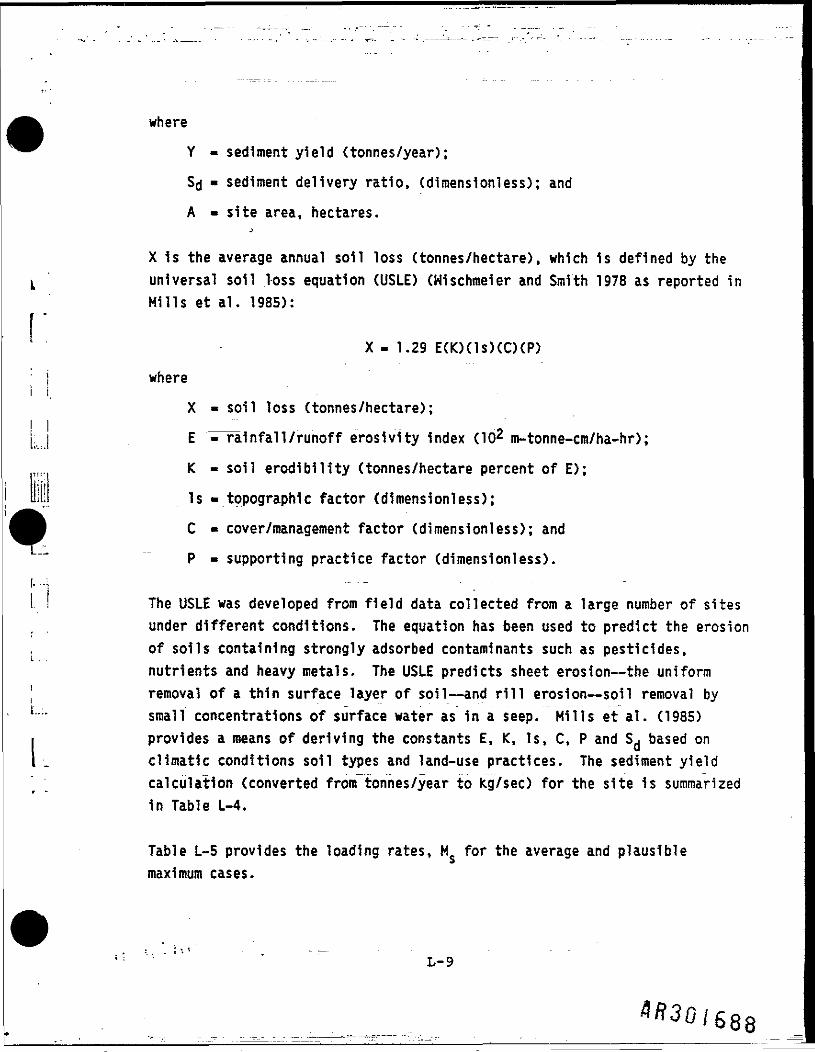
where
Y - sediment yield (tonnes/year);
Sd » sediment delivery ratio, (dlraenslonless); andA - site area, hectares.
^X Is the average annual soil loss (tonnes/hectare), which 1s defined by theuniversal soil loss equation (USLE) (Wischmeier and Smith 1978 as reported inMills et al. 1985):
X - 1.29 E(K)(ls)(C)(P)
where
X - soil loss (tonnes/hectare);
E ^"rainfall/runoff eroslvity index (102 m-tonne-cm/ha-hr);
K - soil erodibility (tonnes/hectare percent of E);
Is "topographic factor (dimensionless);C » cover/management factor (dimensionless); andP « supporting practice factor (dimensionless).
The USLE was developed from field data collected from a large number of sitesunder different conditions. The equation has been used to predict the erosionof soils containing strongly adsorbed contaminants such as pesticides,nutrients and heavy metals. The USLE predicts sheet erosion—the uniformremoval of a thin surface layer of soil—and rill erosion—soil removal bysmall concentrations of surface water as in a seep. Mills et ai. (1985)provides a means of deriving the constants E, K, Is, C, P and Sj based onclimatic conditions soil types and land-use practices. The sediment yieldcalculation (converted from tonnes/year to kg/sec) for the site 1s summarizedin Table L-4.
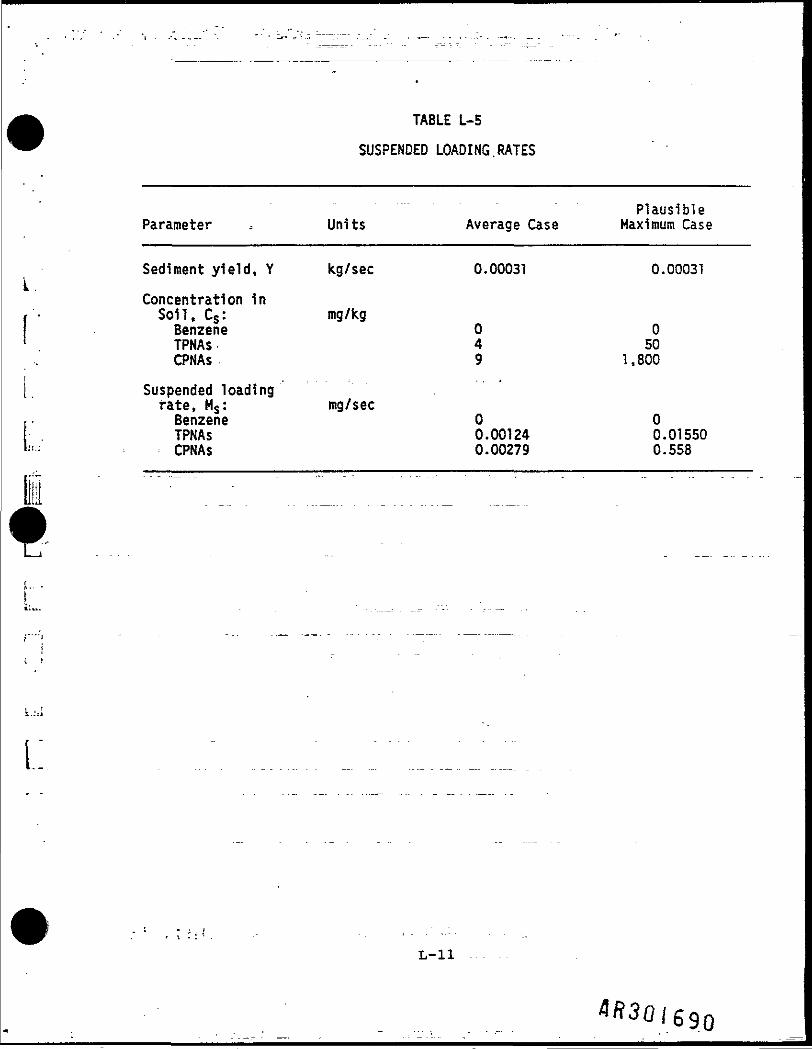
Table L-5 provides the loading rates, M for the average and plausiblemaximum cases.
L-9
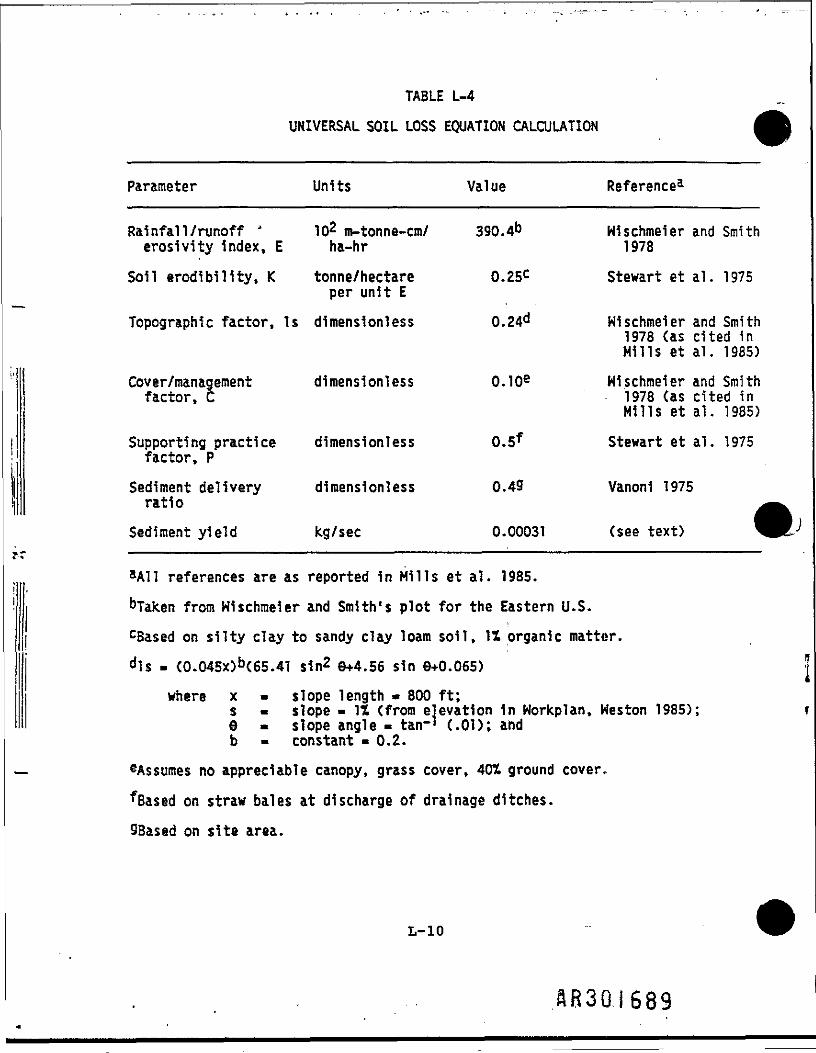
TABLE L-4
UNIVERSAL SOIL LOSS EQUATION CALCULATION
Parameter
Rainfall /runoff 'erosivity index, E
Soil erodibillty, K
Units
TO2 m-tonne-cm/ha-hr
tonne/hectareper unit E
Topographic factor, Is dimensionless
Cover/managementfactor, C
Supporting practicefactor, P
Sediment deliveryratio
Sediment yield
dimensionless
dimensionless
dimensionless
kg/sec
aAll references are as reported in Mills&Taken from Wischmeier and Smith's plot
cBased on sllty claydls - (0.045*>b(65.41
where x -se -b -
to sandy clay loam
Value
390.4&
0.25C
0.24d
0.10®
0.5*
0.49
0.00031
et al. 1985.
for the Eastern U.S.
Referencea
Wischmeier1978
Stewart et
Wischmeier1978 (asMills et
Wischmeier1978 (asMills et
Stewart et
and Smith
al. 1975
and Smithcited inal. 1985)
and Smithcited inal. 1985)
al. 1975
Vanoni 1975I
(see text) !
soil, IX organic matter.
sin2 6+4.56 sin e+0.065)
slope length « 800 ft;slope - 11 (from elevation 1n Workplan,slope angle - tan-' (.01); andconstant • 0.2.
Weston 1985)*
^Assumes no appreciable canopy, grass cover, 401 ground cover,
fBased on straw bales at discharge of drainage ditches.SBased on site area.
L-10
AB30.I689
i:
TABLE L-5
SUSPENDED LOADING RATES
PlausibleParameter , Units Average Case Maximum Case
Sediment yield, Y kg/sec 0.00031 0.00031
Concentration inSoil, Cs: mg/kgBenzene 0 0TPNAs 4 50CPNAs 9 1,800
Suspended loadingrate, Ms: mg/secBenzene 0 0TPNAs 0.00124 0.01550CPNAs 0.00279 0.558
L-ll
ESTIMATION OF SURFACE WATER CONCENTRATION
The average annual concentration of benzene and PNAs 1n the Massaponax Creekdue to discharges from the L.A. Clarke site is given as follows
C - (Ms + MD)/Qwhere
C » average annual total concentration (mg/11ter);
Ms - suspended loading rate (mg/sec);
MO - dissolved loading rate (mg/sec); andQ « total flow rate for the basin upstream of the site (liters/sec).
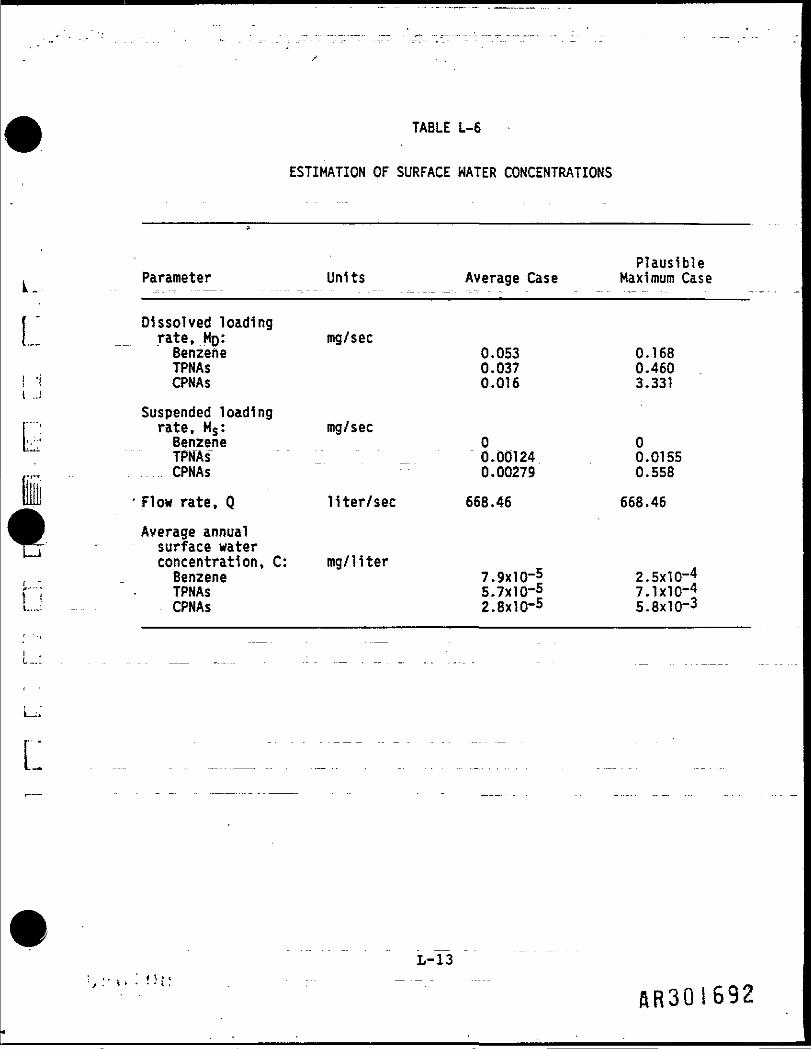
The loading rates, M and MD, were derived in the previous sections, theflow rate Is derived by adding the flow rates for surface runoff andinfiltration given in Table L-1. Table L-6 shows the concentrations derivedfrom the model. The model assumes that the contaminants entering the creekare conservative, i.e., that they will not be affected by such mechanisms asvolatilization, photolysis, or bi©degradation. For the PNA's, which arerelatively high molecular weight, low volatility compounds, this Is areasonable assumption. The model, however, probably overestimates thedownstream concentration of benzene, since volatilization is an Important fatemechanism for benzene 1n surface water.
MODEL CALIBRATION USING RI DATA
As a check on the order-of-magnltude validity of the model, the loading rates,M and M-, can be calculated using the data from the samples of surfacewater and sediment. The suspended loading rate 1n this case is defined asfollows:
MO - (Csw) (Qsite>where
Csw « geometric mean and maximum concentration of PNAs 1n the surfacewater samples (mg/11ter); and
L-12 r\r\"*
flR30i69!
L
E
t;
TABLE L-6
ESTIMATION OF SURFACE WATER CONCENTRATIONS
PlausibleParameter Units Average Case Maximum Case
Dissolved loadingrate, MQ: mg/secBenzene 0.053 0.168TPNAs 0.037 0.460CPNAs 0.016 3.331
Suspended loadingfate, Ms: mg/secBenzene 0 0TPNAs" _ 0.00124 0.0155CPNAs 0.00279 0.558
' Flow rate, Q liter/sec 668.46 668.46
Average annualsurface waterconcentration, C: mg/literBenzene 7.9x10~5 2.5xlO-4TPNAs 5.7x10⁻⁵ 7.1X10⁻⁴CPNAs 2.8x10⁻⁵ 5.8x10⁻³
L-13
ftR301692
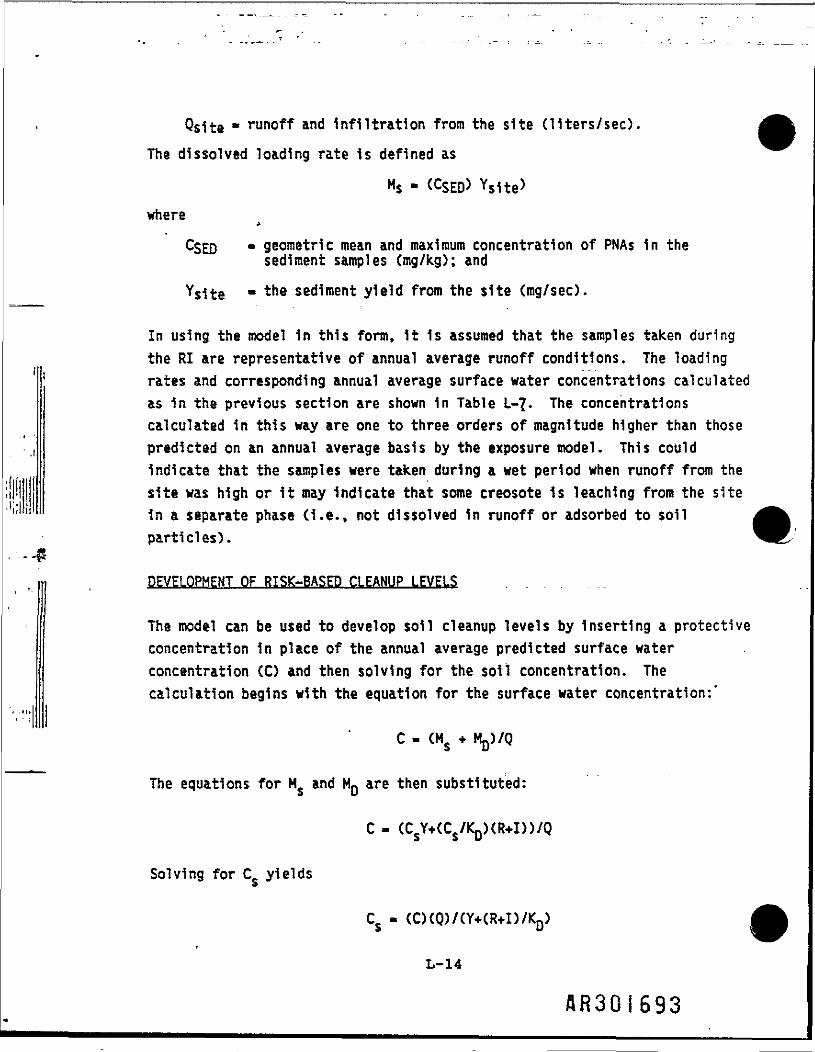
Qsite * runoff and infiltration from the site (liters/sec).The dissolved loading rate is defined as
Ms - (C$ED> YSite>where
CSED " Qeometric mean and maximum concentration of PNAs in thesediment samples (mg/kg); and
Ysite " tne sediment yield from the site (mg/sec).
In using the model in this form, It 1s assumed that the samples taken duringthe RI are representative of annual average runoff conditions. The loadingrates and corresponding annual average surface water concentrations calculatedas in the previous section are shown 1n Table L-7- The concentrationscalculated in this way are one to three orders of magnitude higher than thosepredicted on an annual average basis by the exposure model. This couldindicate that the samples were taken during a wet period when runoff from thesite was high or it may indicate that some creosote 1s leaching from the sitein a separate phase (i.e., not dissolved In runoff or adsorbed to soilparticles).
DEVELOPMENT OF RISK-BASED CLEANUP LEVELS
The model can be used to develop soil cleanup levels by Inserting a protectiveconcentration In place of the annual average predicted surface waterconcentration (C) and then solving for the soil concentration. Thecalculation begins with the equation for the surface water concentration:"
C - (Ms + MD)/Q
The equations for M and MD are then substituted:
C« (CSY+(CS/KD)(R+I))/Q
Solving for C. yields»
L-14
flR3QI693
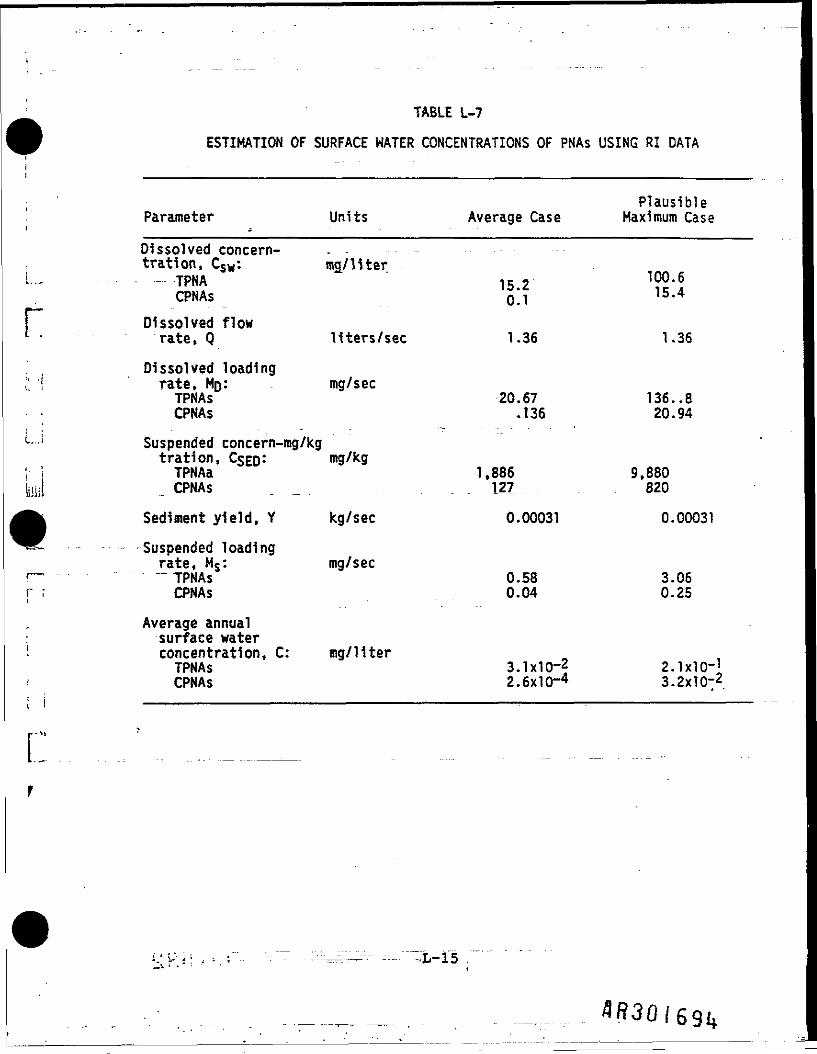
TABLE L-7
ESTIMATION OF SURFACE WATER CONCENTRATIONS OF PNAs USING RI DATA
L.,
r
rf
Parameter jDissolved concern-tration, Csw:-- TPNA
CPNAs
Dissolved flowrate, 0
Dissolved loadingrate, MO*.TPNAsCPNAs
Suspended concern-mg/kgtration, C$ED:TPNAaCPNAs
Sediment yield, YSuspended loadingrate, Ms:^ TPNAs
CPNAs
Average annualsurface waterconcentration, C:TPNAsCPNAs
Units
mg/ liter
liters/sec
mg/sec
mg/kg
kg/sec
mg/sec
mg/ liter
Average Case
15.20.1
1.36
20.67.136
1,886127
0.00031
0.580.04
S.lxlO-22.6xlO~4
PlausibleMaximum Case
100.615.4
1.36
136. .820.94
9,880820
0.00031
3.060.25
2-lxlO-13.2X10⁻²
substituting the values for Q, Y, R, I and KD derived previously yields
Cs - C/(1.42x10"5)
The protective surface water concentration for freshwater aquatic life, asdiscussed in the^ report text, range from 5 to 100 ng/Hter for TPNAs.Substituting these values for C in the above equation yields a range ofprotective soil concentrations of 352 mg/kg to 7,037 mg/kg.
REFERENCES
CALLAHAN, M.A., SLIHAK.M.W., GABEL.N.W., MAY, C.P., FOWLER, G.F., FREED, J.R..OENNINGS, P., DUFREE.R.L., WHITMORE, F.C., MAESTRI, B., MAHEY, W.R.,HOLT, B.R., and GOULD, C. 1979. Water-Related Environmental Fate of 129Priority Pollutants. 2 volumes. Office of Water Planning and Standards,Environmental Protection Agency, Washington, D.C. EPA 440/4-79-029a,b
GERAGHTY, J.J., MILLER. D.W., VAN DERLEEDEN, F., and TROLSE, F.L. 1973.Hater Atlas of the United States. Water Information Center, PortWashington, New York
MILLS, W.B., PORCELLA, D.B.. UNGS, M.J., GHERINI, S.A., SUMMERS, K.V., MOK, L.,RUPP, G.L., and BOWIE, G.L.' 1985. Water Quality Assessment: AScreening Procedure for Toxic and Conventional Pollutants. September1985. EPA 600/6-85/002a
RADDING, S.B., et al . 1976. The Environmental Fate of Selected PolynuclearAromatic Hydrocarbons. EPA 560/5-75-009
SHAPOT, R. 1987. Roy F. Weston, Inc., personal communications
VANONI, V.A. (ed.). 1975. Sedimentation Engineering. American Society ofCivil Engineers, New York
VERSCHUEREN, K. 1983. Handbook of Environmental Data on Organic Chemicals.Van Nostrand Reinhold Co., New York
L-16
AR30I695
r
Li
U
cr
WESTON. 1985. Work Plan for the Remedial Investigation/Feasibility Studyfor the L.A. Clarke Site
L-17
I
1II Appendix MIIItIIII1
JR30I697
Lr
D
APPENDIX M
GOJNDWATER CONTAMINANT TRANSPORT MODEL
0985B
flR30!698
Lrii:
r
APPENDIX M
GROUNDWATER CONTAMINANT TRANSPORT MODEL
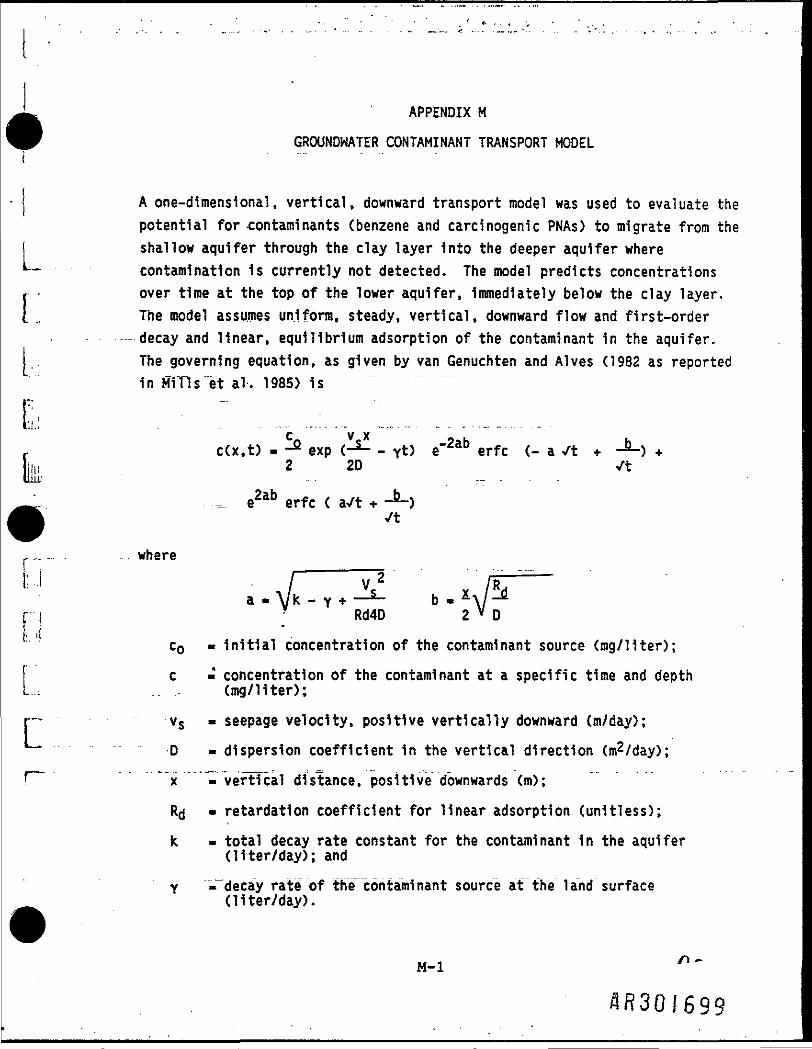
A one-dimensional, vertical, downward transport model was used to evaluate thepotential for contaminants (benzene and carcinogenic PNAs) to migrate from theshallow aquifer through the clay layer Into the deeper aquifer wherecontamination is currently not detected. The model predicts concentrationsover time at the top of the lower aquifer, immediately below the clay layer.The model assumes uniform, steady, vertical, downward flow and first-orderdecay and linear, equilibrium adsorption of the contaminant in the aquifer.The governing equation, as given by van Genuchten and Alves (1982 as reported1n MiTls et al. 1985) 1"s
C V Xc(x,t) - -°- exp C-5- - Yt) e'2ab erfc (- a /t
j i l tliiir '_ e2ab +
/t
where
2 2D /t...
firfc
V • \i• Rd4D 2 v D
c0 • initial concentration of the contaminant source (mg/Hter);
c • concentration of the contaminant at a specific time and depth(mg/Hter);
vs « seepage velocity, positive vertically downward (m/day);D - dispersion coefficient in the vertical direction (m2/day);
- vertical distance, positive downwards (m);
• retardation coefficient for linear adsorption (unitless);- total decay rate constant for the contaminant in the aquifer(liter/day); anddecay rate of the contaminant source at the land surface(liter/day).
M-l
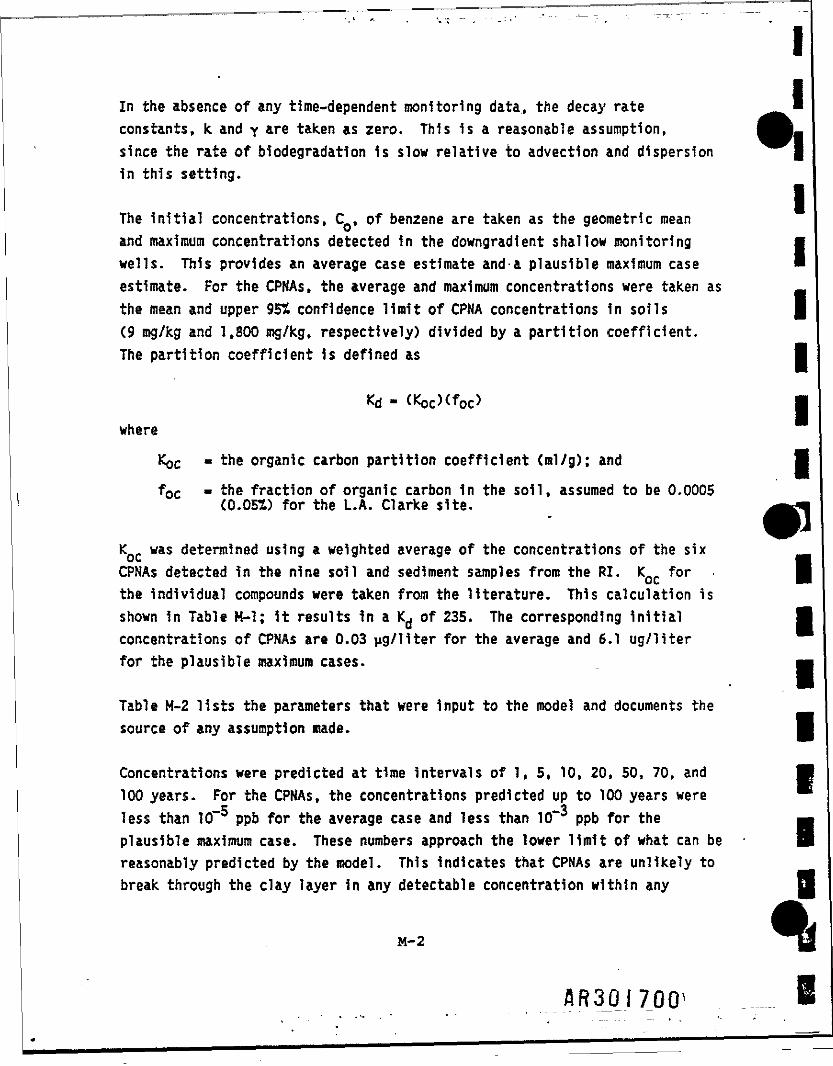
IIn the absence of any time-dependent monitoring data, the decay rate ^^^constants, k and y are taken as zero. This Is a reasonable assumption, ^B_since the rate of biodegradatlon 1s slow relative to advectlon and dispersion |in this setting.
The initial concentrations, C , of benzene are taken as the geometric meanand maximum concentrations detected in the downgradient shallow monitoring •wells. This provides an average case estimate and-a plausible maximum case »estimate. For the CPNAs, the average and maximum concentrations were taken as _the mean and upper 95% confidence limit of CPNA concentrations In soils |(9 mg/kg and 1,800 mg/kg, respectively) divided by a partition coefficient.The partition coefficient is defined as I
where ithe organic carbon partition coefficient (ml/g); and I
foc - the fraction of organic carbon 1n the soil, assumed to be 0.0005(0.051) for the L.A. Clarke site.
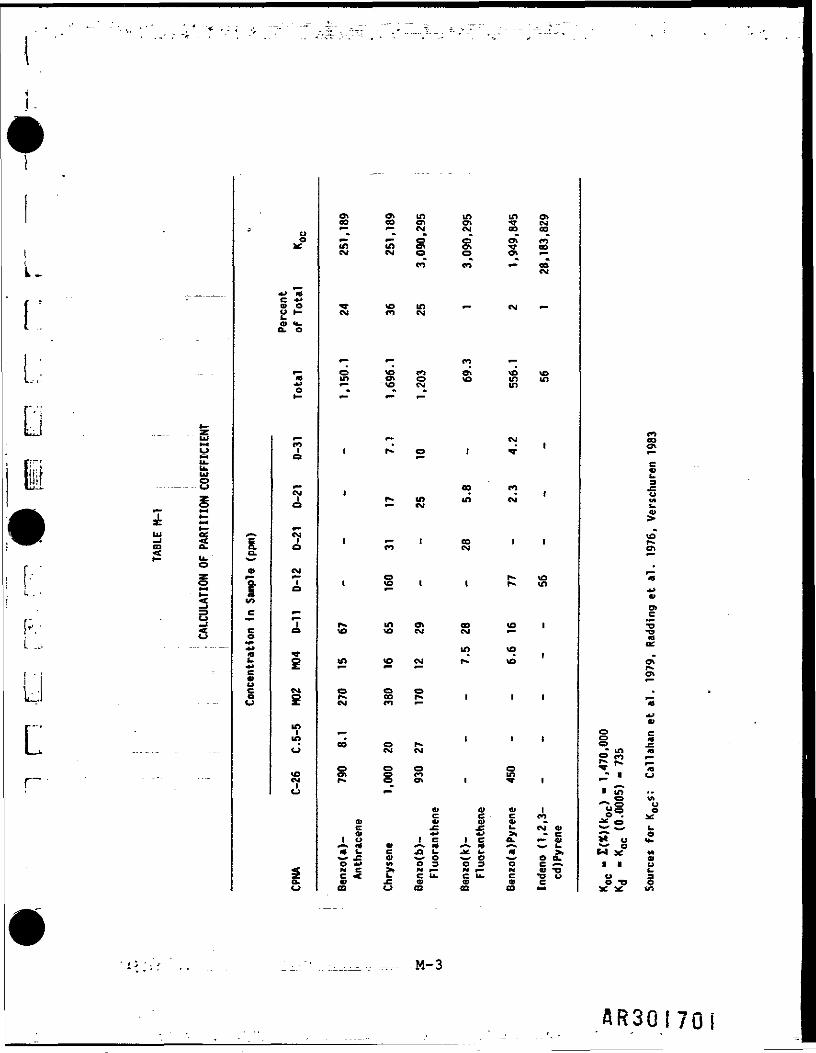
K was determined using a weighted average of the concentrations of the sixCPNAs detected in the nine soil and sediment samples from the RI. K forthe individual compounds were taken from the literature. This calculation isshown in Table M-7; It results in a Kd of 235. The corresponding Initial •concentrations of CPNAs are 0.03 |ig/1iter for the average and 6.1 ug/literfor the plausible maximum cases. mm
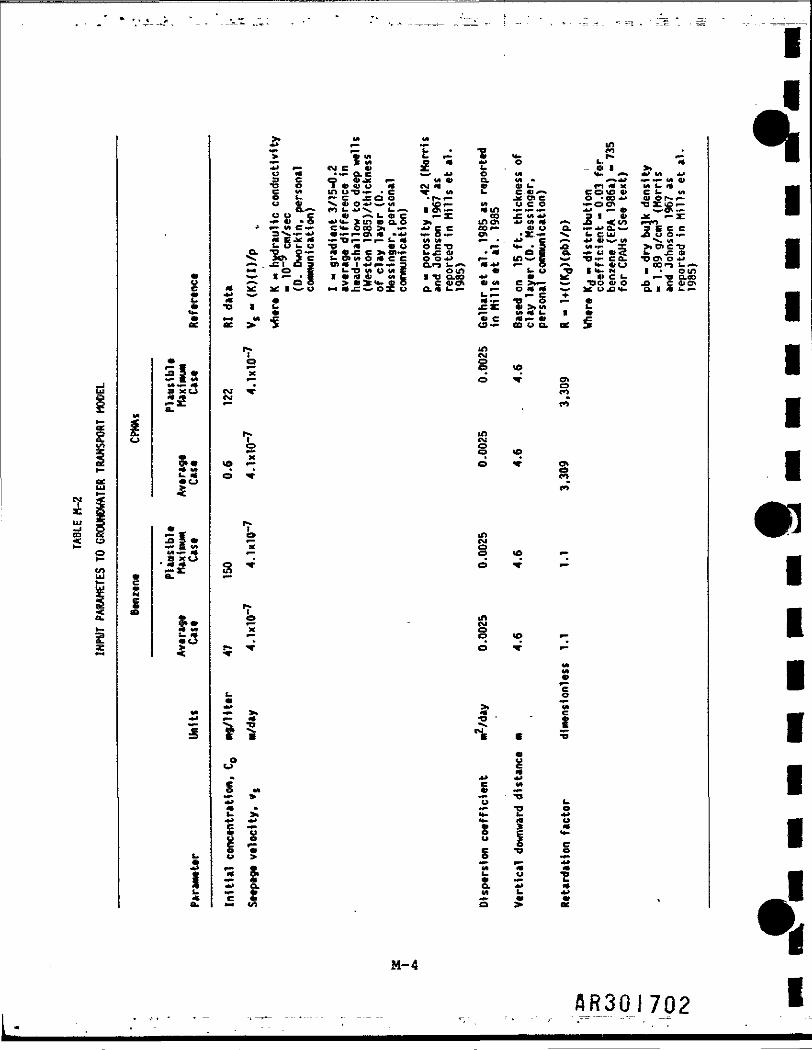
Table M-2 lists the parameters that were input to the model and documents thesource of any assumption made. •
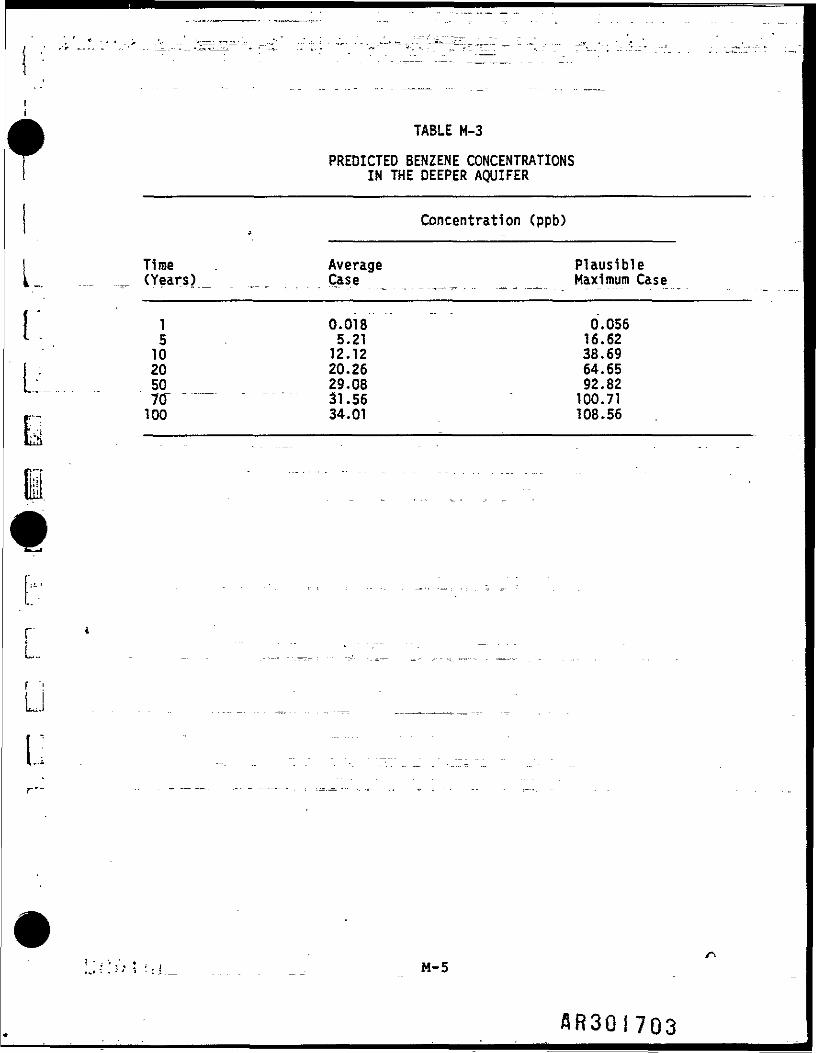
Concentrations were predicted at time Intervals of 1, 5, 10, 20. 50, 70, and t§100 years. For the CPNAs, the concentrations predicted up to 100 years were *
E 3less than 10 ppb for the average case and less than 10 * ppb for the mmplausible maximum case. These numbers approach the lower limit of what can bereasonably predicted by the model. This indicates that CPNAs are unlikely tobreak through the clay layer in any detectable concentration within any
M-2
flR30(700
LcL;Q - ...
Ht*M
lii.f is1 W gILr— .w- --- - —— -- -- U
3£. mm L. L h.4
A * E^F - §^ m a.<*" £r * z0T Lh-p-tu . , - r
e5L ...
f •
Lc!"•• • •" . " "
0o
** 15W 0
n. o
•£o1—
Ia.*"*0f-
f•Dc
oIBk.e
o
COi
CMt
a
2CMnt49
»—A
£CM£mm
toCM
fytC>
ci d in m tn o>CO CO OV C7i T CM•— " — C M CM CO 6Of~ ^ cs c Ok eoin in en S ^ coCM CM O O O. f—
eo <o * coCM
^ to in •— CM «—ey eo CM
t—— •—— <V) .——
in ov o vo in m•— to CM in-" -" ^
•— CMi r«^ o i v '
i » "7 ,f» in in <M.— CM
1 • — I C O I Ieo CM
o r»* toi J£ ' ' r-- in
r* tn ov co <o ltO tO CM CM •—
tn totn to CM r* to
o o or » c o r * . i i iCM eo •—
5 0 r. ' ' 'CM C\J
o* c.* co mr» o o» i -vi
at a» a* tc e c eoQ> At Q> 41 »c -e f i- CM «Q) *» *" >» • C^o j^c j^e at *-S
*# ^ C .XI - L> >V .>>. . ^ V ^ O --* O -..«' O flo>-»> M 03 o 3 o e-^C < •••* ? C C C -DWV i^Z v 1O w Cm u oa oa cs *-
eoCOO*
c«3rj(A
>
Oen
m^fft
0*D)C•5QC.
»Ok
"3
2 =g M•m «o eo .—
^T t w
o M^^ CO UXC3 OV • ^f
•Jf >" «rf 1."? "^-" OW « Ma>I I uU 3O T5 0
M-3
fiR30i7Qi
i
< o
4fr
ct**-BC
3 1 •3*ae tj«~* 3Ca.
•* M«- «*
^
w
S s *«•** p V>
5£"x<3a!
£••V t-1- •*^
I
...•1a.
> t M Mfc _ ,f f— i. • -D> f M t. I— * U--•- 5 M o <« *» o•w r- CM e o» £ i.o «•» * > o. e «-* •** P Ms e o 9jc i— M tt ct M«•o o • • w w r t CMM v a» L.e M in OT)M- • e ^ M L. c *i— »O t- *••• C .CO Q -f-«— ..« B) CU ® ^^ 9 O ' ^ M <O ~ M U C Oa.—, eo »- jj -x. ... — i 5 «- win .*..».«.oo e «» ^. i- c t— .c c o f M * »•.— n-o •*•*<*- Jt 10 «» o. o >* mm ** o» *3 ^ ••* >f 4v ••• F~ cs j*v • ^ **• o * ot • y .BAE.X* -^T»f— •— i— ...i* MM *- • ** c
- _t ° t w "^ • * S° ec"° *;; "*"«§^v £c^ $ c ^ Gt v> o <4 c ci o s ^~ in p* E—— .C1Q3 O) 4 1 4-« 1— •«- 3 Q.I-3 1- —— <• *» <— O•*« os U T I M U M C otn * i- w^^ K ~ *€ I V M A ? V^v 1 T3 f*- Q 4^ •— > Q o > * s <*- ® o c a> i?» VIA e >»—
« ^ ^£ I - U l-l 1* — ' O I L> G.l*i_.- t— 0 l« •«
T S I I - - f i c w > > M• f - M t . l l .*-« «» f o e AI— »«c > * o-*- as o t...
r» »nt CMO 0**• & *oX•- O V
CM 1
*~
p*. «n1 CM**• o toXts •— o r
o in•— CMx o•— o to
g * * V
e int— - CMx o•— o to
5 V o W
u-t- >* •«^.3* *"*1 ^ "fc «
O u
H C M«*• > *•• • Tl*» U
2 >> *JZ Tg«. * >0 g S I
I "i g "°
? S " iMM O >
M-4
CL^
^
**»-*^Qf
S•*••ae
Oi^«
ieo
^
•
eo
|TJ
L.OU«*-eo
«*ee
ineoI*- .—t» <«- e • >>«h- <-» *» «rt 4J
So to w c u vi-co ** at 6r— t—• •OO* TJSC^t—J** 1 *~ * J* .— Z
« V) r* eO_T >a.- 3 G c c... c: ut ja u oi-** €»•>•* M "V U)M«- z >, en C-DTJ"- CO- TJ CTi 0 4J
1- *O BOO i.— »I «*- M i • otnvet- •— T> acoaeuAM- a. i •* i- —£
8R.ini 7H9
^ •FBT
iiii•i•iiii•Jwti
I -
>I
L
L.
rLf '!ui;
TABLE M-3
PREDICTED BENZENE CONCENTRATIONSIN THE DEEPER AQUIFER
Concentration (ppb)
Time Average Plausible(Years) Case Maximum Case
1 0.018 0.0565 5.21 16.6210 12.12 38.6920 20.26 64.6550 29.08 92.8270 31.56 100.71100 34.01 108.56
M-5
flR30!703
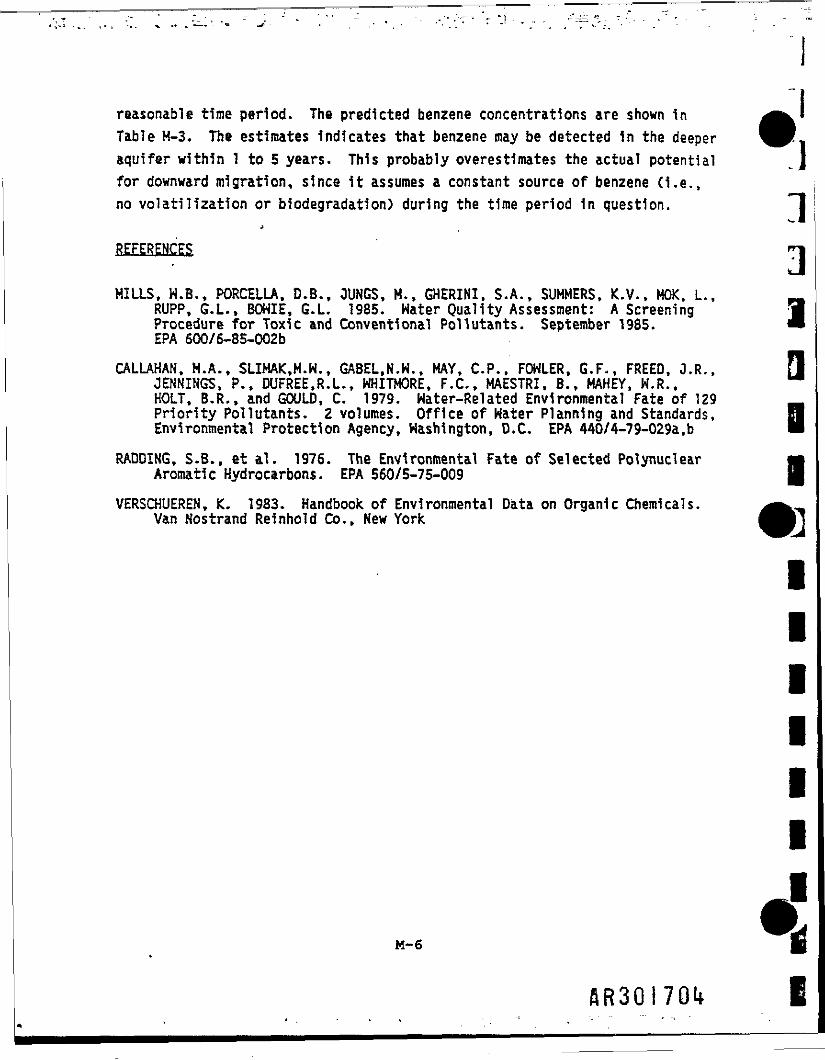
reasonable time period. The predicted benzene concentrations are shown inTable H-3. The estimates Indicates that benzene may be detected in the deeperaquifer within 1 to 5 years. This probably overestimates the actual potentialfor downward migration, since It assumes a constant source of benzene (i.e.,no volatilization or faiodegradation) during the time period in question.
jREFERENCES
HILLS, W.B., PORCELLA. D.B., OUNGS, M., GHERINI. S.A., SUMMERS, K.V., MOK, L..RUPP, G.L., BOWIE, G.L. 1985. Water Quality Assessment: A ScreeningProcedure for Toxic and Conventional Pollutants. September 1985.EPA 600/6-85-002b
CALLAHAN, H.A., SLIMAK.M.W., GABEL.N.W., MAY, C.P., FOWLER, G.F., FREED, J.R..JENNINGS, P., DUFREE.R.L., WHITMORE, F.C., MAESTRI, B., MAHEY, W.R..HOLT, B.R., and GOULD, C. 1979. Water-Related Environmental Fate of 129Priority Pollutants. 2 volumes. Office of Water Planning and Standards,Environmental Protection Agency, Washington, D.C. EPA 440/4-79-029a,b
RADDING, S.B., et al. 1976. The Environmental Fate of Selected PolynuclearAromatic Hydrocarbons. EPA 560/5-75-009
VERSCHUEREN, K. 1983. Handbook of Environmental Data on Organic Chemicals.Van Nostrand Reinhold Co., New York
iiiiii
»R30I701»
LL Appendix N11 . •0
0
4S.30/705
i
l.
1
BENZENE
INTRODUCTION
Benzene is a volatile, colorless, flammable liquid aromatic hydrocarbon thathas a very characteristic odor. It is a chemical intermediate in thesynthesis of compounds such as styrene, synthetic rubber, and phenol, and itis used as an additive to gasoline to increase the octane.
PHARMACOKINETICS
L. Benzene is readily absorbed into the body v1a_1ng_estion and inhalation (EPA1985a). Dermal absorption is somewhat slower (EPA 1985a). It is stored inthe bone marrow, liver, and body fat (EPA 1985b). Elimination of benzeneoccurs via exhalation of unchanged benzene through the lungs or by metabolismin the liver to urinary metabolites (EPA 1985a). Conjugated phenolicmetabolites of benzene (e.g., phenol, catechol , hydroquinone) appear in theurine mainly as etheral sulphates and glucuronides (IARC 1982).
QUALITATIVE DESCRIPTION OF HEALTH EFFECTS
CARCINOGENICITY
Many case studies have described a causal relationship between exposure tobenzene (concentrations unspecified) by inhalation (either alone or incombination with other chemicals) and leukemia in humans (IARC 1982). Mostcases were acute myelogenous leukemia, although some were monocytic,erythroblastic, or lymphocytic (IARC 1982). A series of epidemiologicalstudies, both cohort and case-control, showed statistically significantassociations between leukemia and occupational exposure (concentrationunspecified) to benzene (EPA 1984a). These results have been replicated in anumber of countries and in different industries (IARC 1982).
N-l
AR30I707
APPENDIX N
TOXICITy. PROFILES OF SELECTED CHEMICALS
0985B
Benzene produced both solid tumors and leukemias in Sprague-Dawley ratsadministered benzene by gavage at doses of 50 or 250 mg/kg, 4 to 5 days a weekfor 52 weeks and observed for lifetime (EPA 1984a).
MUTAGENICITY
Benzene does not induce, gene mutations in bacterial systems (IARC 1982). Ithas not been found to be a point mutagen in mammalian cells; however, benzenedid Induce cytogenetic abnormalities 1n mammalian cells in vitro (chromosomalaberrations and slster-chromatid exchanges) (IARC 1982). Several studies mdemonstrated that benzene exposure of experimental animals in vivo leads to *~tht induction of chromosomal aberrations in bone marrow cells (IARC 1982). «-There 1s a clear correlation between exposure (concentration unspecified) to Hi)benzene and the appearance of chromosomal aberrations in the bone marrow and _in peripheral lymphocytes of individuals exposed to high levels of benzene |[(more than 100 ppm) (IARC 1982).
TERATOGENICITY/REPRODUCTIVE EFFECTS
Inhalation experiments conducted in rats, mice, guinea pigs, and rabbitssuggest that benzene (exposure concentrations unspecified) 1s not teratogenicat doses that are fetotoxic and embryolethal (IARC 1982). It 1s a potentInhibitor of growth in utero (EPA 1985b).
Animal experiments in rats, guinea pigs, and rabbits suggest that exposures(concentrations unspecified) to benzene vapors may damage the testls (IARC1982).
ACUTE/CHRONIC EFFECTS
The oral LDgQ values of reagent-grade benzene in male Sprague-Dawley ratsare reported to range from 0.93 g/kg bw to 4.9 g/kg bw (IARC 1982). An oralLD5Q of 5.6 g/kg bw was reported in male Hi star rats (IARC 1982).
N-2
flR30J708
r
The toxic effects of benzene vapors in humans and other animals Includecentral nervous system effects, hematological effects, and effects on theImmune system (EPA 1985a).
In humans, acute exposures to high levels of benzene vapors (20,000 ppm)produce central nervous system effects that Include dizziness, giddiness,exhilaration, nausea, vomiting, headache, drowsiness, staggering, loss ofbalance, narcosis, coma, and death (NAS 1976). Death 1s usually the result ofrespiratory or cardiac failure (NAS 1976). In experimental animals, acuteexposures to high (unspecified) concentrations of benzene vapors causesdepression of the central nervous system (EPA 1985c).
Chronic human exposure to benzene vapors (exposure concentration unspecified)can cause a continuum of changes in the circulatory formed blood elements andbone marrow precursors (EPA 1985a). Leucopenia^thrombocytopenia, anemia, orcombinations of these may occur (IARC 1982). At early stages of such blooddyscrasias, these effects appear to be reversible (IARC 1982). Exposure forlonger periods of time may lead to pancytopenia, which results from bonemarrow toxidty and is considered to be an Irreversible stage of the disease(IARC 1982). Numerous case reports and surveys of workers have suggested anassociation between chronic Inhalation exposure to benzene and aplasticanemia. Aplastic anemia 1s a relatively severe form of pancytopenia, and ischaracterized by a marked diminution 1n bone marrow cellularity (EPA 1980).
Leucopenia is the most commonly observed effect of chronic benzeneintoxication (exposure concentrations unspecified) in laboratory animals (EPA1985a).
C Immune system depression by benzene is well known. Depression of serumantibodies (IgG and IgA) in benzene workers (exposure concentrationunspecified) has been reported (EPA 1985b). In addition, it has beendemonstrated that administration of benzene to mice in vivo Inhibits thefunction of B- and T-lymphocytes in vitro (IARC 1982). These observations, aswell as the well-known ability of benzene to depress leucocytes, may explainwhy benzene-exposed Individuals readily succumb to infection and the terminalevent in severe benzene toxicity is often overwhelming infection (IARC 1982).
N-3
IQUANTITATIVE DESCRIPTION OF HEALTH EFFECTS ^t
Applying EPA's criteria for evaluating the overall weight of evidence of
Icardnogenicity to humans (EPA 1984b), benzene has been classified by EPA(1984a) in Group A—Human Carcinogen. This category Indicates that there 1ssufficient evidence from epldemiological studies to support a causal _association between an agent and cancer (EPA 19845). |
The EPA Carcinogen Assessment Group (CAG) has calculated Inhalation and oral Icarcinogenic potency factors for benzene. Both were derived from humanepidemiological studies In which significantly Increased incidences of •leukemia were observed for workers exposed to benzene principally by ™inhalation (EPA 1984a). The inhalation potency is 2.6xlO~2 (mg/kg/day)"1, •and the oral potency is 5.2x10~2 (mg/kg/day)"1 (EPA 1984a). The Iconcentration 1n drinking water corresponding to a 10"6 excess lifetime _cancer risk 1s 0.7 ug/11ter. . |
EPA (1985d) promulgated a final drinking water maximum contaminant level goal(MCLG) of zero because benzene 1s a human carcinogen. A drinking watermaximum contaminant level (MCL) of 5 ug/liter has been proposed (EPA 1985e). •MCLGs consider only health effects whereas MCLs consider analytical chemistry, •treatability, occurrence, and health effects, but attempt to approach the MCLG.
N-4
•
The EPA Office of Drinking Hater developed a ten-day health advisory (HA) of _233 ug/l1ter for children (EPA 19855). The HA was based on an Inhalation |study 1n which 103 mg/m3 caused depressed white blood cell counts within 2weeks. A dose of 96 mg/m3 had no effect after 2 weeks (EPA 19855). Health Madvisories for longer exposure periods were not developed because of thepotent carcinogenic response of benzene (EPA 1985b). •
IThe American Conference of Governmental Industrial Hygienlsts (ACGIH 1986) hasrecommended a time-weighted average threshold limit value of 10 ppm(approximately 30 mg/m ) for occupational exposure to benzene. It was also _specified that benzene should not be employed when substitute materials are ,_|available.
1flR30/7)0 I
TOXICITY TO AQUATIC LIFE
No criterion for benzene has been established or proposed by EPA forprotection of freshwater aquatic life. EPA findings indicate that adverseeffects may occur.at concentrations as low as 5,300 ug/liter, based on a studyusing juvenile rainbow trout (Salmo oairdneri). and would occur at lowerconcentrations among species that are more sensitive than those tested (EPA1980).
Acute toxicity data are available for one Invertebrate and six vertebratespecies (EPA 1980, Slooff et al. 1983). Species average LC5Q values rangefrom 17,000 ug/11ter for rainbow trout to 390,000 ug/liter for the mosquitofish Gambusia affinis. No adequate chronic values are available. In an earlylife stage test on rainbow trout a 4-day post-hatch LC5Q value of 8,250ug/liter was reported (Birge et al. 1979). A 50% reduction 1n cell numbers ofthe freshwater alga Chlorella vulaaris was reported at a concentration of525,000 ug/Hter (EPA 1980).
There are insufficient data to calculate a protective concentration forbenzene based on EPA's ambient water quality methodology. However, aprotective concentration was estimated using an alternative methodology basedprimarily on approaches used by EPA and by the Michigan Department ofEnvironmental Resources (MDNR).
Based on the lowest average acute value of 17,000 ug/liter, a genericacute-chronic ratio of 45, and a safety factor of 5 (recommended by MDNR 1984when the data base Includes a rainbow trout value), a protective concentrationof 76 ug7liter 1s calculated.
SUMMARY OF BENZENE CRITERIA
EPA carcinogen classification Group AOral carcinogenic potency factor 5.2xlO~2 (mg/kg/day)-1Inhalation carcinogenic potency factor 2.6x10⁻² (mg/kg/day)-1
'.- N ; 5 ni. N~5
88301711

J
I
Final MCLG 0Proposed MCL 5 ug/HterTen-day HA (child) 233 ug/literDrinking water concentration cor-
responding to 10~6 excess life-time cancer risk . 0.7 ug/liter
REFERENCES
AMERICAN CONFERENCE OF GOVERNMENTAL INDUSTRIAL HYGIENISTS (ACGIH). 1986. •Documentation of Threshold Limit Values and Biological Exposure Indices. B5th id. Cincinnati, Ohio
BIRGE, W.J., BLACK, J.A., HUDSON, J.E., and BRUSER, D.M. 1979. Embryo-larval Btoxicity tests with organic compounds. In Marking, L.L., and K1merle, •R.A., eds. Aquatic Toxicology. American Society for Testing andMaterials, ASTM STP 677. Pp. 131-147 •
ENVIRONMENTAL PROTECTION AGENCY (EPA). 1980. Ambient Water Quality Criteriafor Benzene. Office of Water Regulations and Standards, Criteria and mStandard Division, Washington, D.C. October 1980. EPA 440/5-80-018. BPB81-117293 •
ENVIRONMENTAL PROTECTION AGENCY (EPA). 1984a. Health Effects Assessment forBenzene. Environmental Criteria and Assessment Office. Cincinnati,Ohio. September 1984. EPA 540/1-86-037
ENVIRONMENTAL PROTECTION AGENCY (EPA). 1984b. Proposed guidelines for |carcinogen risk assessment; request for comments. Fed. Reg.49:46294-46301 (November 23, 1984) _
ENVIRONMENTAL PROTECTION AGENCY (EPA). 1985a. Drinking Water Criteria •Document for Benzene (Final Draft). Office of Drinking Water,Washington, D.C. April 1985 •
ENVIRONMENTAL PROTECTION AGENCY (EPA). 1985b. Draft Health Advisory forBenzene. Office of Drinking Water, Washington, D.C. September 30, 1985 •
ENVIRONMENTAL PROTECTION AGENCY (EPA). 1985c. Drinking Water Criteria *Document for Hexachlorobenzene. Environmental Criteria and AssessmentOffice, Cincinnati, Ohio. ECAO-CIN-424. (Final Draft) B
ENVIRONMENTAL PROTECTION AGENCY (EPA). 1985d. National primary drinkingwater regulations; volatile synthetic organic chemicals, final rule. •Fed. Reg. 50:46880-46901 (November 13, 1985) B
ENVIRONMENTAL PROTECTION AGENCY (EPA). 1985e. National primary drinking _water regulations, volatile synthetic organic chemicals, proposed Brulemaking. Fed. Reg. 50:46902-46933 (November 13, 1985) *****
N-6
AR3QI712
I.r
INTERNATIONAL AGENCY FOR RESEARCH ON CANCER (IARC). 1982. IARC Monographs onthe Evaluation of the Carcinogenic Risk of Chemicals to Humans. Volume27: Some Aromatic Amines, Anthraquinones and Nitroso Compounds, andInorganic Fluorides Used 1n Drinking-Water and Dental Preparations.World Health Organization, Lyon, France
NATIONAL ACADEMY OF SCIENCE (NAS). 1976. Health Effects of Benzene: AReview Committee on Toxicology, Assembly of Life Sciences. NationalResearch Council, Washington, D.C.
SLOOFF, W., CANTON, J.H., and HERMENS, J.L.M. 1983. Comparison of thesusceptibility of 22 freshwater species to 15 chemical compounds. I.Subacute toxicity tests. Aquatic Toxicology 4:113-128
cr
N-7
/5R30I7I3
POLYCYCLIC AROMATIC HYDROCARBONS
INTRODUCTION
Polycyclic aromatic hydrocarbons (PAHs) are a diverse class of compoundsconsisting of two or more fused aromatic rings. They are formed duringthe incomplete combustion of materials containing carbon and hydrogenand are ubiquitous in the modern environment. PAHs are commonly foundas constituents of coal tar, soots, vehicular exhausts, cigarettte smoke,certain petroleum products, road tar, mineral oils, creosote, and manycooked foods.
i.A number of reviews have been prepared on the toxicology of the PAHs.The Environmental Protection Agency (EPA) prepared an Ambient Water QualityCriteria Document on the general class of polynuclear aromatic hydrocarbons(EPA 1980a) and also prepared Criteria Documents on several specific PAHs,including acenaphthene, fluoranthene, and naphthalene (EPA 1980b-d).More recently, EPA (1984a-f) prepared Health Effects Assessments for PAHsas a class, for coal tars, and for the individual compounds benzo(a)pyrene(B(a)P), naphthalene, phenanthrene, and pyrene. In addition to the EPA Tdocuments, Santodonato et al. (1981) prepared a review and risk assessmentof polynuclear aromatic hydrocarbons, and the International Agency for jr-Research on Cancer (IARC) reviewed the toxicity and carcinogenicity of IL.a large number of individual PAHs and PAH-containing mixtures (IARC 1973, _..,1983, 1984, 1985). U
QUALITATIVE DESCRIPTION OF HEALTH EFFECTS ^]
Acute effects from direct contact with PAHs and related materials are *1limited primarily to phototoxicity. Phototoxicity is caused by exposureto a toxic substance followed by exposure to sunlight. The primary effects 1are dermatitis—skin reddening, itching, and burning. NIOSH (1977) reviewed -»the phototoxic effects of exposure to coal tar and found that phototoxicity .can result from a single 90-minute exposure to a 1% solution of coal tar.
flR30i7il»
r
These dermatoses usually disappear when contact with the sensitizer iseliminated.
The polycyclic aromatic hydrocarbons have been shown to cause cytotoxicityin rapidly proliferating cells throughout the body, with the hematopoieticsystem, lymphoid system, and testes frequently noted as targets (Santodonato
I et al. 1981). This effect appears to be due to inhibition of DNA replicationby the PAHs. Destruction of the sebaceous glands, hyperkeratosis, hyperplasia,and ulceration have been observed in mouse skin following dermal applicationof the carcinogenic PAHs, with the degree of induced morphological changesappearing to correlate with the carcinogenic activity. However, it doesnot seem that this dermal toxicity is necessary or sufficient for carcino-genesis (Santodonato et al. 1981). It should be noted that similar typesof dermatitis have been observed in workers exposed to such PAH-containingmaterials as coal tar and mineral oil. The carcinogenic PAHs have alsobeen shown to have an immunosuppressive effect in animals. Again, itis not clear what relationship, if any, this immunosuppression has withcarcinogenesis.
Some of the noncarcinogenic PAHs have been shown to cause systemic toxicity,but these effects are generally seen only at rather high doses (Santodonatoet al. 1981). For example, slight morphological changes in the liversand kidneys of rats have been reported following oral administration ofacenaphthene. Oral administration of naphthalene to rabbits has resultedin cataract formation.
Nonneoplastic lesions are seen in animals exposed to the more potent carcino-genic PAHs only after exposure to levels well above those required toelicit a carcinogenic response. Consequently, carcinogenicity is thetoxic effect of greatest public health concern following exposure to materialscontaining carcinogenic PAHs. A number of the PAHs have been shown tobe potent carcinogens, producing tumors both at the site of applicationand systemically, in several different animal species, when administeredby any of a number of routes. For example, Rigdon and Neal (1969) reportedgastric tumors, pulmonary adenomas and leukemias in mice fed B(a)P, and
, . ..,.; N-9
SR30I7I5
intratracheal instillation of a number of PAHs has been shown to causelung tumors in both mice and hamsters (Santodonato et al. 1981). In addition,IARC (1984, 1985) have noted that occupational exposure to coal soot,coal tar and pitch, coal tar fumes, and some impure mineral oils causescancer in humans at several sites, including the skin, and concluded thatthere is sufficient^evidence that soots, tars, and some mineral oils arecarcinogenic in humans. Fractionation procedures have demonstrated thatthe PAHs are the carcinogenic agents in coal tar.
JQUANTITATIVE DESCRIPTION OF HEALTH EFFECTS k"
Not all PAHs have been demonstrated to be carcinogenic in animals, and »•*»'some carcinogenic PAHs are clearly more potent than others (IARC 1983). mrA number of factors have been shown to influence the relative carcinogenic liiipotencies of the PAHs. These include planarity of the molecule, cellularabsorption, binding affinity, the presence or absence of a particular 11molecular structure, and the'electron configuration of the molecule (Dippleet al. 1984, Frierson et al. 1986). In addition, genetic differencesin the exposed animals, particularly in their ability to produce arylhydrocarbon hydroxylase (AHH), have been shown to influence carcinogenicpotency. Finally, the PAHs are not ultimate carcinogens but must be metabo-lized before they become biologically activated. A complete descriptionof the complex metabolism of these compounds is beyond the scope of thisreport, but a detailed review of the factors influencing the carcinogeni-cityof the PAHs and metabolism of these compounds can be found in Dipple et al.(1984), Santodonato et al. (1981), and Frierson et al. (1986). For purposesof risk assessment, it is sufficient to note that the potencies of differentPAHs vary over a wide range and that a number of factors, including factorsspecific to the chemical, the host animal, and the circumstances of exposure,affect carcinogenic potency.
For practical purposes, the PAHs are often separated into two categories,the "carcinogenic" and the "noncarcinogenic" PAHs. This is a somewhatmisleading categorization as many of the "noncarcinogenic" PAHs have beenshown to have some, albeit weak, carcinogenic activity, or to act as promoters
N-10
flR30!7!6
LC
or cocarcinogens. A more accurate designation would be to differentiatebetween potent carcinogens, weak carcinogens, and noncarcinogens. Anotherfactor complicating the assessment of risks posed by the PAHs is thatthey do not occur alone in nature, but occur as complex mixtures containingnumerous PAHs of varying carcinogenic potencies. The potential interactionsof the individual PAHs present as components of these mixtures must beaddressed in attempting to quantify the carcinogenic risks posed by exposureto the mixtures.
The approach adopted by EPA (1980a, 1984a) as the basis for risk assessmentis to apply a carcinogenic potency factor calculated from assays on B(a)Pto the subclass of carcinogenic PAHs within the mixture that is to beassessed. This approach involves three assumptions: (1) that all carcino-genic PAHs have the same potency as B(a)P; (2) that their effects areadditive; and (3) that the noncarcinogenic PAHs do not contribute to thecarcinogenic effects of the mixture. Although there is limited empiricalevidence to support assumptions (2) and (3), assumption (1) may lead tolarge overestimates of risk because B(a)P is one of the most potent carcinogensamong the PAHs and is usually present only in a small percentage of the
r total mixture.r
' EPA (1980a, 1984a) calculated a value of 11.5 (mg/kg/day)"1 as the carcino-' ' genie potency factor (upper bound on lifetime risk) for oral exposure
to the carcinogenic PAHs, based on the study of Neal and Rigdon (1967): '; in which oral administration of B(a)P led to forestomach tumors in mice.
EPA (1984a) calculated a cancer potency factor for inhalation of B(a)Pj " based on the study of Thyssen et al. (1981 as cited in EPA 1984a). This*•— assay evaluated the production of respiratory tract tumors in hamsters
*t
•— using B(a)P at concentrations of 2.2-9.5 mg/m . The linearized multistage' i! model yielded a carcinogenic potency factor of 6.11 (mg/kg/day) .t
i EPA's Carcinogen Assessment Group has not reported a risk assessment fordermal exposure to the carcinogenic PAHs. Santodonato et al. (1981) performed
irisk assessments for both dermal and oral exposure and indicated thatB(a)P was more potent when applied dermally than when administered orally.
N-ll
AR30I7I7
A number of factors may account, for this difference in relative potencyand a complete derivation of a dermal potency factor is beyond the scopeof this profile. ' J
In addition to quantification of the effects of individual PAHs, EPA developed Ja cancer potency factor for inhalation of coal tar pitch volatiles (EPA1984b). This study evaluated epidemiological data from exposure of coke -Ioven workers to between 0 and greater than 700 mg/m -month coal tar vapors.The equivalent incremental risk calculated from the study was 3.2 (mg/kg/day)"1. 9Coal tar pitch volatiles were classified in Group A—Human Carcinogen.
IARC (1983) in reviewing the carcinogenicity of the PAHs, indicated those »•for which there was sufficient, limited, inadequate, or adequate negative ._evidence of carcinogenicity (Table 1). The more potent carcinogens are ||almost certainly included within the group for which sufficient evidenceof carcinogenicity is available. B
TOXICITY TO AQUATIC LIFE
The most important route of PAH uptake for aquatic organisms is via contami- mmnated water. In contrast, direct accumulation of PAHs for sediments does ™not appear to be an Important exposure route (Neff 1985). Whereas exposure ._throughout the food chain may also be important, the information required |to evaluate this route of exposure for higher aquatic organisms and animalsis often difficult to obtain. •
PAHs can be acutely toxic to many aquatic organisms, including amphipods, Hcopepods, polychaete worms, grass shrimp, and sheepshead minnow. PAHsmay bind to membrane surfaces, and as a result, disrupt membrane organization, •increase cell permeability, and interfere with membrane-associated enzyme Bsystems (Neff 1985). The acute toxicity of PAHs, with a molecular weight _range from naphthalene (128) to fluoranthene (202), generally increases Bwith increasing molecular weight. Significant mortality can result todifferent species from naphthalene exposures at concentrations ranging nfrom 2.4 mg/liter to concentrations of 150 mg/liter (Neff 1985, EPA 19SOd).
N-12
fiR30.7l8
L
L:r
For phenanthrene, the 96-hour LCgg for mosquito fish is estimated at 150mg/liter (Neff 1985). LCgg values for fluoranthene have been estimatedto range from 4 mg/liter to 325 mg/liter (EPA 1980c). Exposures to 1 mg/literbenzo(a)pyrene for six months resulted in B7% mortality among bluegill(EPA 1980a). »
Chronic PAH exposures may produce sublethal effects detrimental to thelong-term survival of an organism and may result in mutations and cancer.Adverse sublethal effects have been reprted at PAH concentrations of approxi-mately 5-100 ug/liter in some aquatic organisms. The effects of naphthaleneexpsures at levels of 2 ug/liter and greater to the mummichog fish haveresulted in gill hyperplasia and hemorrhages, increases in respirationrate, and osmoregulatory imbalance (Neff 1979, 1985). Chronic PAH exposuresmay cause disease of the liver, kidney, and gills, including liver neoplasms,in bottom-dwelling fish (Malins et al. 1984). PAHs can be metabolizedby many aquatic animals into more polar, water-soluble metabolites thatcan be excreted. Although this metabolic enzyme system has been shownto detoxify some organic chemicals, it may transform PAHs into metabolitesthat are highly toxic, mutagenic, or carcinogenic to the host animal.
r. Although PAH-induced cancer has not specifically been identified in fish,1 cellular changes that have been observed include tail necrosis and tumor-r;" like lesions, fin erosion, and skin lesions (Lech and Bend 1980, Malins- et al. 1984, Neff 1985).f • •i | .
U . .. _.
N-13
/JR30I7I9
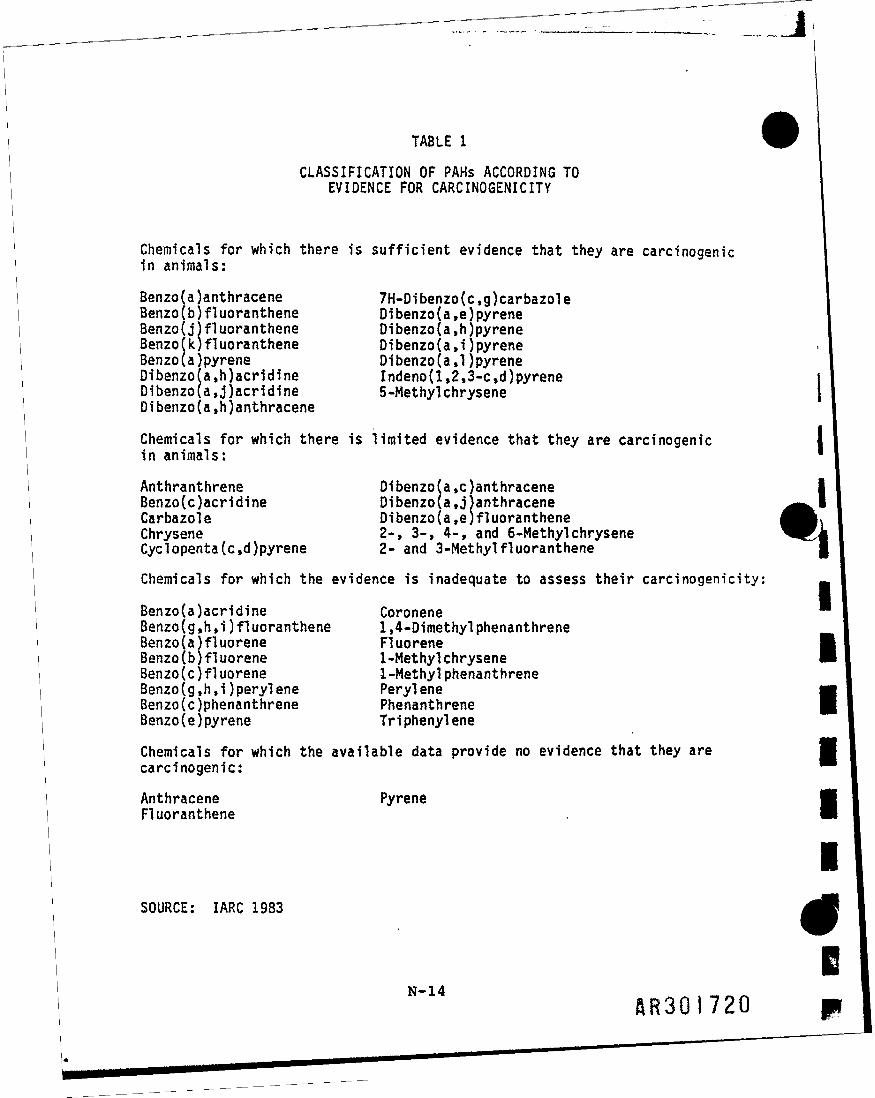
TABLE 1
CLASSIFICATION OF PAHs ACCORDING TOEVIDENCE FOR CARCINOGENICITY
Chemicals for which there is sufficient evidence that they are carcinogenicin animals:
Benzo(a)anthracene 7H-Dibenzo(c,g)carbazoleBenzo(b)fluoranthene Dibenzo(a,e)pyreneBenzo (j ) f 1 uoranthene Dibenzo (a ,h jpy reneBenzo(k)fluoranthene Dibenzo (a, ijpyreneBenzo(a)pyrene Dibenzo (a, ijpyreneDibenzo(a,h)acridine Indeno(l,2,3-c,d)pyreneDibenzo(a,j)acridine 5-MethylchryseneDibenzo(a,h)anthracene
Chemicals for which there is limited evidence that they are carcinogenicin animals:
Anthranthrene Dibenzo (a, cBenzo(c)acridine Dibenzo(a,jCarbazole Dibenzo(a,e
anthraceneanthracenefl uoranthene
Chrysene 2-, 3-, 4-, and 6-MethylchryseneCyc1openta(c,d)pyrene 2- and 3-Methylfluoranthene
Chemicals for which the evidence is inadequate to assess their carcinogenicity:
Benzo(a)acridine CoroneneBenzofg,h,i)fluoranthene 1,4-DimethylphenanthreneBenzo(a)fluorene FluoreneBenzo(b)fluorene 1-MethylchryseneBenzo(c)fluorene 1-MethylphenanthreneBenzo(g,h,i)perylene PeryleneBenzo(cjphenanthrene PhenanthreneBenzo(e)pyrene TriphenyleneChemicals for which the available data provide no evidence that they arecarcinogenic:
Anthracene PyreneFluoranthene
SOURCE: IARC 1983
N~" BR30I720
IREFERENCES
DIPPLE, A., MOSCHEL, R.C., and BIGGER, C.A.H. 1984. Polynuclear aromaticcarcinogens. In Searle, C.E. ed. Chemical Carcinogens-Second edition.ACS Monograph 182. American Chemical Society. Washington, D.C.
ENVIRONMENTAL PROTECTION AGENCY (EPA). 1980a. Ambient Water QualityCriteria for Polynuclear Aromatic Hydrocarbons. Office of Water
i Regulations and Standards, Washington D.C. October 1980. EPA 440/5-80-L- 069
ENVIRONMENTAL PROTECTION AGENCY (EPA). 1980b. Ambient Water QualityCriteria for Acenaphthene. Office of Water Regulations and Standards,Washington, D.C. October 1980. EPA 440/5-80-015f
| ENVIRONMENTAL PROTECTION AGENCY (EPA). 1980c. Ambient Water Qualityt— Criteria Document for Fluoranthene. Office of Water Regulations
and Standards. Washington, D.C. October 1980. EPA 440/5-80-049u ENVIRONMENTAL PROTECTION AGENCY (EPA). 1980d. Ambient Water QualityCriteria for Naphthalene. Office of Water Regulations and Standards.Washington, D.C. October 1980. EPA 440/5-80-059
ENVIRONMENTAL PROTECTION AGENCY (EPA). 1984a. Health Effects Assessmentfor Polycyclic Aromatic Hydrocarbons (PAH). Environmental Criteriaand Assessment Office, Cincinnati, Ohio. September 1984. EPA 540/1-86-013
ENVIRONMENTAL PROTECTION AGENCY (EPA). 19845. Health Effects Assessmentfor Coal Tars. Environmental Criteria and Assessment Office, Cincinnati,Ohio. September 1984. EPA 540/1-86-024
ENVIRONMENTAL PROTECTION AGENCY (EPA). 1984c. Health Effects Assessmentfor Benzo(a)pyrene. Environmental Criteria and Assessment Office,Cincinnati, Ohio. September 1984. EPA 540/1-86-022
ENVIRONMENTAL PROTECTION AGENCY (EPA). 1984d. Health Effects Assessmentfor Naphthalene. Environmental Criteria and Assessment Office, Cincinatti,Ohio. September 1984. EPA 540/1-86-014
ENVIRONMENTAL PROTECTION AGENCY (EPA). 1984e. Health Effects 'Assessmentfor Phenanthrene. Environmental Criteria and Assessment Office,Cincinnati, Ohio. September 1984. EPA 540/1-86-029
ENVIRONMENTAL PROTECTION AGENCY (EPA). 1984f. Health Effects Assessmentfor Pyrene. Environmental Criteria and Assessment Office, Cincinnati,Ohio. September 1984. EPA 540/1-86-030
FRIERSON, M.R., KLOPMAN, G., and ROSENKRANZ, H.S. 1986. Structure-activityrelationships (SARs) among mutagens and carcinogens: A Review.Environ. Mutagen. 8:283-327
N-15
flR30j/2f
INTERNATIONAL AGENCY FOR RESEARCH ON CANCER (IARC). 1973. IARC Monographson the Evaluation of Carcinogenic Risk of Chemicals to Humans. Volume3. Certain Polycyclic Aromatic Hydrocarbons and Heterocyclic Compounds.World Health Organization, Lyon, France
INTERNATIONAL AGENCY FOR RESEARCH ON CANCER (IARC). 1983. IARC Monographson the Evaluation of the Carcinogenic Risk of Chemicals to Humans.Vol. 32: Polynuclear Aromatic Compounds; Part 1, Chemical, Environmental,and Experimental Data. World Health Organization, Lyon, France
INTERNATIONAL AGENCY FOR RESEARCH ON CANCER (IARC). 1984. IARC Monographson the Evaluation of the Carcinogenic Risk of Chemicals to Humans. —Volume 33: Polynuclear Aromatic Compounds, Part 2, Carbon Blacks,Mineral Oils and Some Nitroarenes. World Health Organization, Lyon, -France
INTERNATIONAL AGENCY FOR RESEARCH ON CANCER (IARC). 1985. IARC Monographs H,on the Evaluation of the Carcinogenic Risk of Chemicals to Humans.Volume 35: Polynuclear Aromatic Compounds, Part 4, Bitumens, Coal-tar <*>and Derived Products, Shale-oils, and Soots. World Health Organization, i^Lyon, France
LECH, J.J., and BEND, J.R. 1980. Relationship between biotransformation |j[and the toxicity and fate of xenobiotic chemicals in fish. Environ. *•Health Perspect. 34:115-131
MALINS, D.C., McCAIN, B.B., BROWN, D.W., CHAN, S., MYERS, M.S., LANDAHL,J.T., PROHASKA, P.G., FRIEDMAN, A.J., RHODES, L.C., BURROWS, D.G.,GRONLUND, W.D., and HODGINS, H.D. 1984. Chemical pollutants in ,»sediments and diseases in bottom-dwelling fish in Puget Sound, Washington. *,Environ. Sci. Technol. 18:705-713 aL
NATIONAL INSTITUTE FOR OCCUPATIONAL SAFETY AND HEALTH (NIOSH). 1977. ffCriteria for a Recommended Standard-Occupational Exposure to Coal LTar Products. Washington, D.C. DHEW (NIOSH) 78-107
fT'fNEAL, J. and RIGDON, R.H. 1967. Gastric tumors in mice fed benzo(a)pyrene: ^
A quantitative study. Tex. Rep. Biol. Med. 25:553-557
NEFF, J.M. 1979. Polycyclic Aromatic Hydrocarbons in the Aquatic Environment:Sources, Fates and Biological Effects. Applied Science PublishersLtd., London •
NEFF, J.M. 1985. Polycyclic Aromatic Hydrocarbons. Chapter 14. InRand, G.M., and Petrocelli, S.R., eds. Fundamentals of Aquatic Toxicology:methods and Applications. Hemisphere Publishing Corp., Washington,D.C.
RIGDON, R., and NEAL, J. 1969. Relationship of leukemia to lung andstomach tumors in mice fed benzo(a)pyrene. Proc. Soc. Exp. Biol. Med.130:146-148
N"16 AR30I722

L-
r
LCr
SANTODONATO, J., HOWARD, P., and BASU, D. 1981. Health and ecologicalassessment of polynuclear aromatic hydrocarbons. J. Environ. Pathol.Toxicol. 5:1-364
THYSSEN, J., ALTHOFF, J., KIMMERLE, G., and MOHR, U. 1981. Inhalationstudies with benzo(a)pyrene in Syrian golden hamsters. J. Nat!.Cancer Inst. 66:575-577
N-17
III Appendix OIII*
II1iIJ
AR30I721*
I1
I
IE
[!1j
APPENDIX 0
SUMMARY OF CALCULATIONS USED TO ESTIMATE CONTAMINANT INTAKES
r\«-. _
0985B
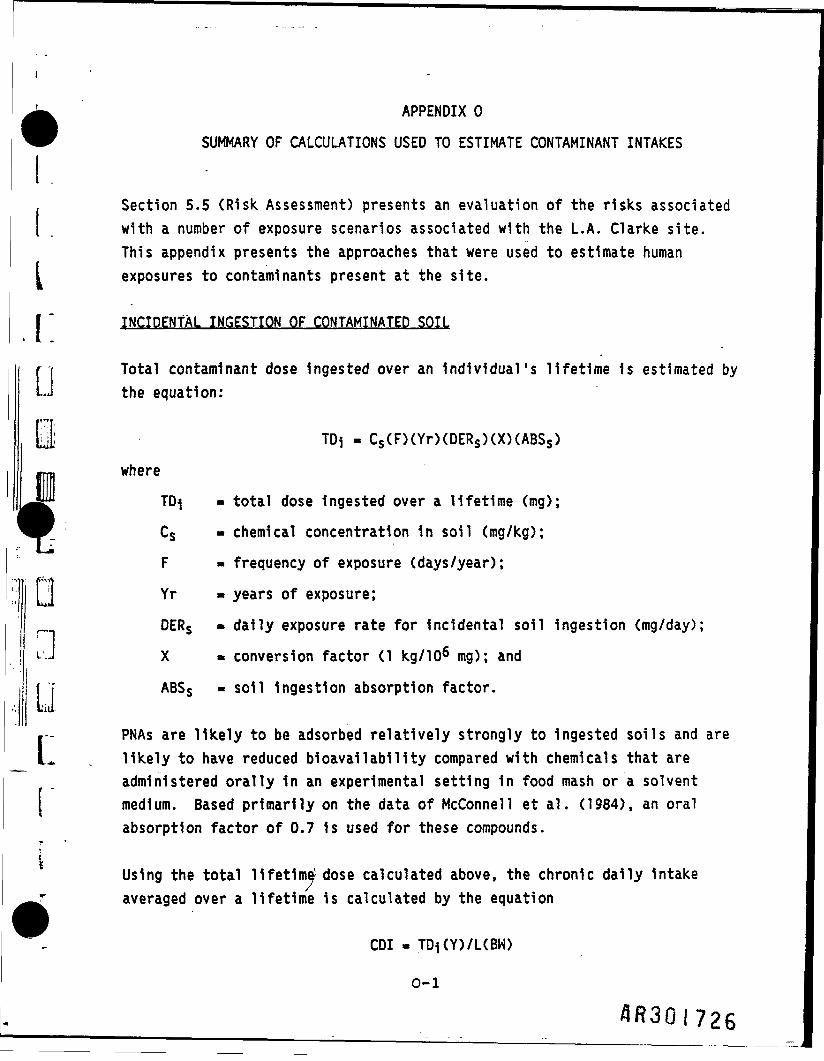
APPENDIX 0
SUMMARY OF CALCULATIONS USED TO ESTIMATE CONTAMINANT INTAKES
, Section 5.5 (Risk Assessment) presents an evaluation of the risks associated[ . with a number of exposure scenarios associated with the L.A. Clarke site.
This appendix presents the approaches that were used to estimate humani exposures to contaminants present at the site.
I.U
a
c
INCIDENTAL INGESTION OF CONTAMINATED SOIL
Total contaminant dose ingested over an individual's lifetime 1s estimated bythe equation:
- Cs(F)(Yr)(DERs)(X)(ABSs)
whereTD^ - total dose Ingested over a lifetime (mg);
Cs - chemical concentration in soil (mg/kg);
F - frequency of exposure (days/year);Yr - years of exposure;DERS » dally exposure rate for incidental soil ingestion (mg/day);
X « conversion factor (1 kg/10^ mg); and
ABSS - soil Ingestion absorption factor.
PNAs are Hkely to be adsorbed relatively strongly to ingested soils and arelikely to have reduced bioavai lability compared with chemicals that areadministered orally in an experimental setting in food mash or a solventmedium. Based primarily on the data of McConnell et al. (1984), an oralabsorption factor of 0.7 is used for these compounds.
Using the total lifetime' dose calculated above, the chronic dally Intakeaveraged over a lifetime is calculated by the equation
CDI - TD (Y)/L(BW)
0-1
flR3QI726
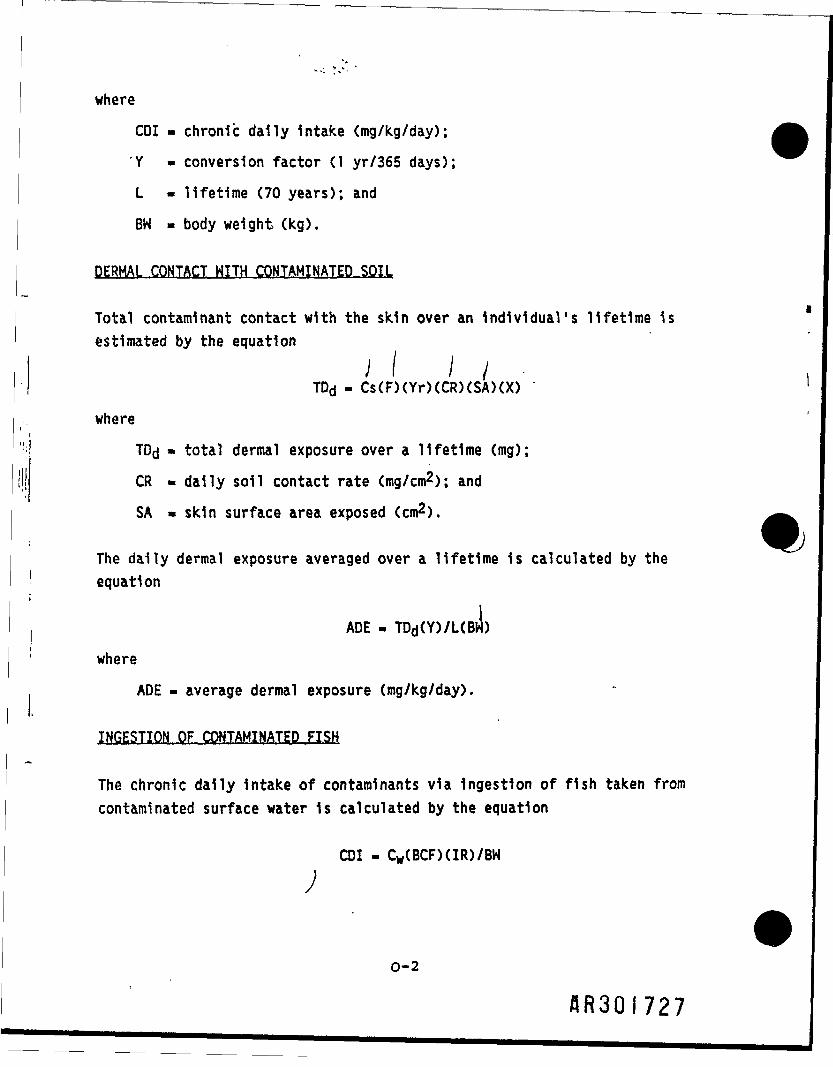
whereCDI - chronic daily Intake (mg/kg/day);
'Y - conversion factor (1 yr/365 days);
L - lifetime (70 years); andBW - body weight (kg).
DERMAL CONTACT WITH CONTAMINATED SOIL
Total contaminant contact with the skin over an Individual's lifetime isestimated by the equation
i I I iTDd - Cs(F)(Yr)(CR)(SA)(X)
whereTDd * total dermal exposure over a lifetime (mg);CR - dally soil contact rate (mg/cm2); andSA « skin surface area exposed (cm2).
The dally dermal exposure averaged over a lifetime 1s calculated by theequation
IW)ADE - TDd(Y)/L(BI
whereADE - average dermal exposure (mg/kg/day).
INGESTION OF CONTAMINATED FISH
The chronic dally intake of contaminants via Ingestion of fish taken fromcontaminated surface water Is calculated by the equation
CDI - CW(BCF)(IR)/BW
0-2
BR30I727
1, where
t
Cw - chemical concentration in surface water (mg/liter);R BCF - bioconcentration factor (Uter/kg); and
i
fI
IR » fish Ingestion rate (kg/day).^
REFERENCE
MCCONNELL, E.E. LUCIER, G.W., RUMBAUGH, R.C., ALBRO, P.W., HARVAN, D.J.,HASS, J.R., and HARRIS, M.W. 1984. Dioxin in soil: Bioavailabilityafter Ingestion by rats and guinea pigs. Science 223:1077-1079
0-3
flR30i728
I1
II* Appendix PI
11
("Il..I
^30/729
IK.tt
f?:r
APPENDIX P
") RESULTS OF GEOPHYSICAL SURVEY OF THE L. A. CLARKESITE, SPOTSYLYANIA COUNTY, VIRGINIA
AR30i730
L
Section No. Appendix PRevision No. 1Date: 10/16/87Page: 1 of 18
APPENDIX P
RESULTS OF GEOPHYSICAL SURVEY OF THEL_ L. A. CLARKE SITE, SPOTSYLVANIA COUNTY, VIRGINIA
[ P.I INTRODUCTION
, i This appendix documents the activities, procedures, and results of thegeophysical investigation conducted at the L. A. Clarke Wood Treatment
i j Facility in Fredericksburg, Virginia (see Figure P-l for location). Theil-* geophysical investigation, accomplished by a two-man geophysical crewy f r o m Roy F. Weston, Inc. (WESTON), West Chester, Pennsylvania, commenced
on January 21, 1985 and continued for a total of 4 days. The two geo-physical techniques initially proposed in the scope of work (electromag-netic ground conductivity and ground penetrating radar) were utilized toverify the locations of subsurface anomalies identified in an earlier
r j study of the L.A. Clarke site were indicative of contaminant sources, andto determine the existence and extent of migration of contaminated
j groundwater plume(s) originating from such sources. WESTON conductedI this activity early in the project in order to enhance subsurface infor-r mation from existing site borings and to optimize the placement of thet jt .i proposed monitor wells and soil borings, relative to any identified sour-
ces of contamination.
P.2 PRESURVEY ACTIVITIES
The following presurvey activities were performed:
• Establishment of survey grid - As a means of ground surface con-trol, relative to detected subsurface anomalies, a survey grid wasestablished across the site. The grid was established on 100-footcenters using an optical level and stadia rod, and marked withwooden stakes. Figure P-2 depicts the location and boundaries ofthe survey grid corresponding to the site.
*•* flR30i73l0985B
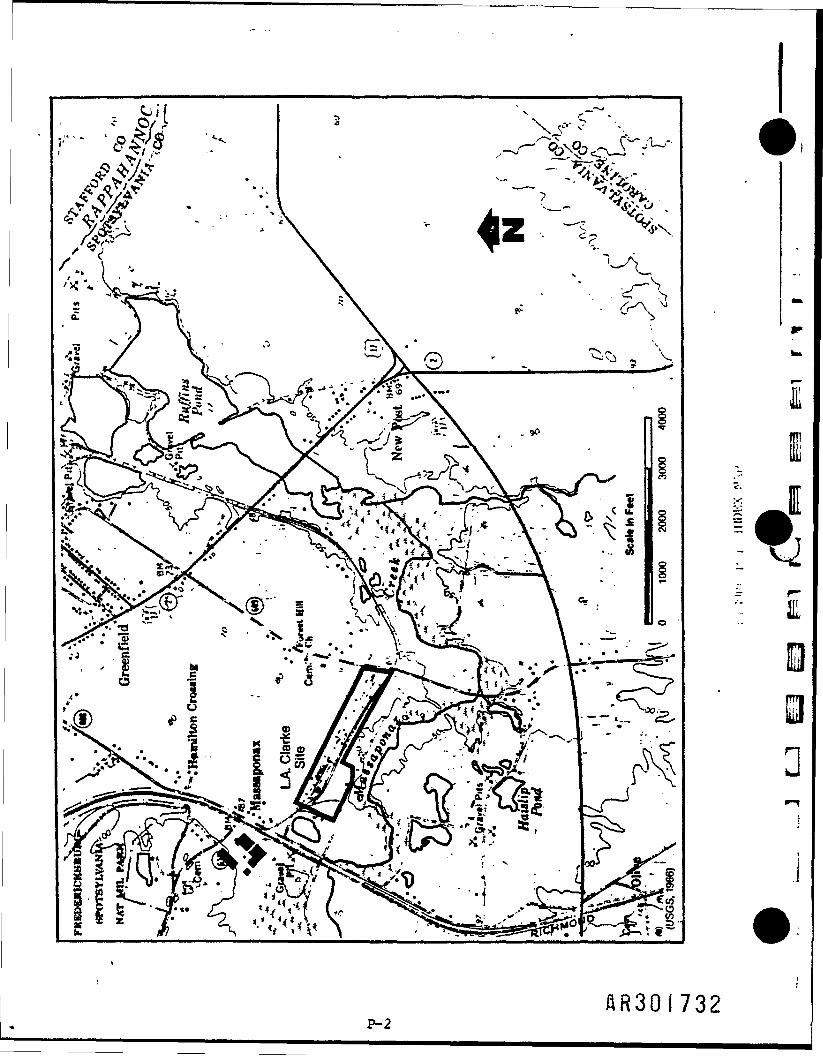
1
t
BR30I732P-2
Section No. Appendix PRevision No. 1Date: 10/16/87Page: 4 of 18
y
r"i.r.'' i
Figure P-2.
Survey Grid
P-30985B ,
AR30I733
Section No. Appendix PRevision No. 1Date: 10/16/87Page: 4 of 18
• Establishment of base station - To compensate for instrumentationdrift and to assist in equipment calibration, a base station wasestablished and monitored. The base station was located in thewooded area on the eastern border of the site across Route 619.Measurements of EM conductivity were taken at the base station at Bthe beginning and end of each survey day. *~
Instrumentation drift was negligible throughout the survey period, thus, ^corrections to the raw field data were deemed unnecessary. .~kP.3 GEOPHYSICAL SURVEY METHODOLOGY
———————————————————————— fILP.3.1 Electromagnetic Conductivity
«]_...._.._._ ___..__. - ... _ . _ _ „ . . ___.-„ ..__ - _ . _ _ _ _ _ _ _ __wa 100-foot by 100-foot control grid (Figure p-2) using a Geonics EM 34-3 ^terrain conductivity meter. In general, this technique provided a mea- "-sure of electrical conductivity, in millimhos per meter (mmhos/m) for the __given volume and types of earth materials underlying the site. The nomi- jynal depth of penetration is governed by the spacing and orientation ofthe instrument's receiver and transmitter coils in conjunction with the |ijelectrical properties of the underlying soils.
mTerrain conductivity measurements were taken at the L. A. Clarke site at157 numbered grid nodes using a 10-meter separation between the receiver "1and transmitter coils. A tabulation of the terrain conductivity values 'is presented in Appendix A. For a given node location EM terrain con- \ductivity values were obtained using both horizontal dipole (both coils !perpendicular to the ground surface) and vertical dipole orientations(both coils parallel to the ground surface). The horizontal dipole con- Iducfcivity measurements emphasize the near surface earth material, whilethe vertical dipole measurements accentuate deeper materials. Thus, typi-
flR30S73l*0985B
Section No. Appendix PRevision No. 1Date: 10/16/87Page: 5 of 18
cal exploration depths for the 10-meter coil separation in the horizontaland vertical dipole nodes were approximately 7.5 and 15 meters, respect-ively. The conductivity value resulting from the instrument was a com-posite, representing the combined effects of the thickness of the soil,the depth, and the specific conductance of the materials.
P.3.2 Ground Penetrating Radar
The ground penetrating radar (GPR) survey was conducted at the L. A.Clarke facility using a Geophysical Survey System, Inc. GSSI SIRS Model4800-P ground penetrating radar unit. Briefly stated, GPR is an impulseradar system that provides a continuous profile of subsurface conditionsby radiating electromagnetic pulses into the earth and displaying thereflections from surface and subsurface interfaces on a graphic recorder.
f"" The transmitted pulse travels through the medium until it encounters anf" •* interface (i.e., a change or discontinuity in electrical properties suchr as a soil, geological boundary, or an imbedded object (such as a drum,i..... boulder, etc.). Once the pulse reaches the interface, a portion of the
signal is reflected and the remaining portion continues through ther l
i \ interface. The reflected pulse is collected by the antenna transceiver,and it is this signal that is recorded as data on a "real time" graphic
*••*« •
i radar profile. A typical example of a radar profile is exhibited inFigure P-3.
f"From site-to-site, variability in the electrical properties of the under-lying materials require that- a "site-specific" depth calibration of theradar unit be performed. To calibrate the system either the dielectricconstant (E ) of the survey medium, or the depth to a particular objector interface must be known. Calibration of the radar system was per-formed at the L. A. Clarke site using a two-step operation. The initial
P-5
09856 HR30I735
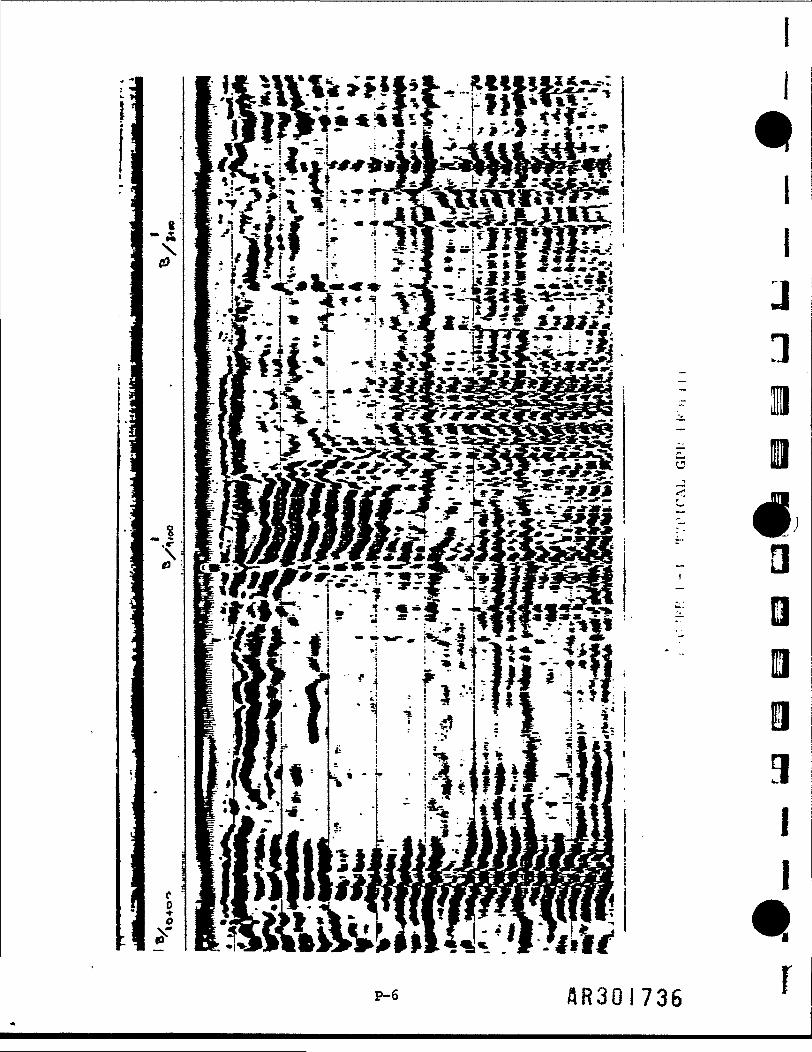
I-* « '-~fi«ft 1, 1-111 "7 K»**?IHTT ' I(S3
.1>
c0
rl ? -if a* !r *i •-r« «.J.»«.«.f
?ia/ ^
u
3II
AR30I736
Section No. Appendix PRevision No. 1Date: 10/16/87Page: 7 of 18
calibration was calculated using a dielectric constant (E ) of 6.0nanoseconds (ns foot), based on on-site soil and moisture conditions (wetclayey silty sands). Next, for quality assurance purposes, calibration
i. -.traverses were run over a drainage culvert (located.north of the process
p" building) at a known depth of approximately 4 feet. From this calibrationprocedure a signal travel time and vertical depth scale of 100 ns or 16
1 feet, respectively, were determined. The calibration profile is depictedi- J in Figure P-4. Subsequent to calibrating the system, traverses were
conducted over the areas of concern.uJ
Surveying was accomplished by traversing the survey area with the GPRantenna along each grid line. The identification number of each tra-verse, and the direction in which it was run were recorded. The productof the GPR survey was a series of real-time graphic subsurface profiles.The data were standardized by affixing location marks on each profile atthe associated grid intersection. Upon completion of the survey the datawere transported back to WESTON for interpretation and final analysis.
Analysis of the GPR survey data involved the interpretation of eachprofile individually and then comparing the results collectively. Theinterpretation process had two objectives:
r • Applying specific knowledge of signature densities and geometricconfigurations to the identification of pipes, trenches, soil
f structures, discontinuities, and subsurface disturbances.
• Identifying trends and conditions by comparing standard profilesto one another. This process identified soil interfaces, buriedutilities, and groundwater data.
The GPR profiles produced as a result of this survey exhibited high resolution, clearly defining disturbed subsoils and highlighting character-
•' istic signatures of discrete objects beneath the site.
0985B
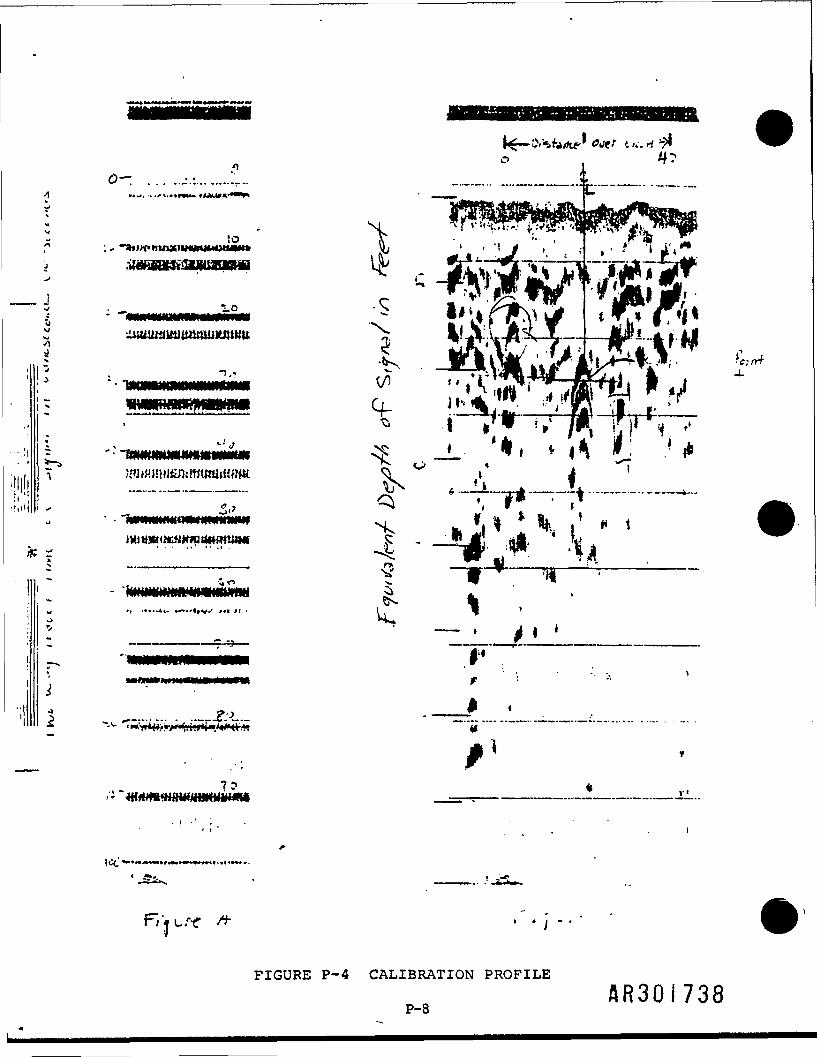
i-O
/r
iKv
—*——"ITE """""———"T "', r* • i'Q'» * "• '
'i
' •
1 -vzv+a&s "-=£•
FIGURE P-4 CALIBRATION PROFILEflR30i738
P-8

r
Section No. Appendix PRevision No. 1Date: 10/16/87Page: 9 of 18
Upon incorporating the results from both surveys it was then possible toconfirm or discount previously suspect areas.
p.4 RESULTS OF GEOPHYSICAL SITE INVESTIGATION
Both the EM conductivity and GPR surveys produced results that requiredindividual analyses. The interpretations of the data were enhanced bycomparing the results of each method. The inherent limitations of anysingle technique of remote sensing can be lessened by cross-referencingtwo or more geophysical techniques. The subsections that follow describethe results of the geophysical survey.
P.4.1 Geophysical Survey Analysis
P.4.1.1 EM Conductivity
*' ' WESTON used a Radian CPS-1 computer graphic contour plotting system tor construct the EM conductivity contour solutions. Multiple solutions weret . generated using a "complete data set" (all conductivity values obtained, in the field) and a "partial data set" (illuminating conductivity values[ obtained within close proximity to cultural features). The resulting
plots exhibited only minor variations, thus indicating little or noeffect in the complete data set from cultural interferences. Therefore,using the complete (higher density) data set presented in Appendix A, ahigher resolution plot was generated. A qualitative examination of thecontour plots was performed, and structural trends and discontinuitieswere noted.
The conductivity of subsoils may be altered by the release of organicsand/or heavy metals, the displacement of the normal soil moisture, or byan accumulation of a substance at the water table.
p-9 AR30I7390985B
Section No. Appendix PRevision No. 1Date: 10/16/87Page: 10 of 18 !
- ri
Conductivity values obtained at the L. A. Clarke site ranged from a mini-mum of 31 mmhos/m to,a maximum of 300+ mmhos in/around the processfacility. Background values ranged from 30 to 70 mmhos/fa. Historicaldata on the wastewater chemistry indicated that the increased soilconductivities were attributable to higher concentrations of polar H(conductive) materials (metals and salt compounds), i.e., associated withthe creosote operation rather than the polynuclear aromatic hydrocarbons H(PNAs) associated with the wood treatment process. PNAs are basicallynonpolar and therefore, nonconductive. ip
The isopleth plot of horizontal dipole EM conductivities is shown in Fig-ure P-5. The plot depicts three major positive anomalies in the northernportion of the site adjacent to the process facility and treated lumberstockpile. (Anomalous areas to the north (above y - 800) are computergenerated.) These anomalies are located proximate to x, y gridcoordinates 200, 700; 680, 680; and 900, 700, respectively. Theconductivity values associated with these anomalies range from highs of250 to 275 mmhos/m to lows of 100 mmhos/ni. The high conductivities and flassociated steep gradients adjacent to the process facility characterize ""localized sources. These sources are likely to be associated with the mucontaminants bound in the subsoils and/or in solution in the groundwater. LI
Soils in this area are visibly contaminated both at the surface and at Jjdepth. The higher two of these three anomalies are located immediatelybeneath the pressurized creosote vats and the rail lines that serviced -Ithe treated wood from them. The lower of the three anomalies is locatedbeneath the area where fresh "clean" lumber is milled. 1
A fourth major positive anomaly was encountered around coordinate x » •1,500 and y « 800, the location of a concentration of ferrous sources
p-io09858 AR30171*0
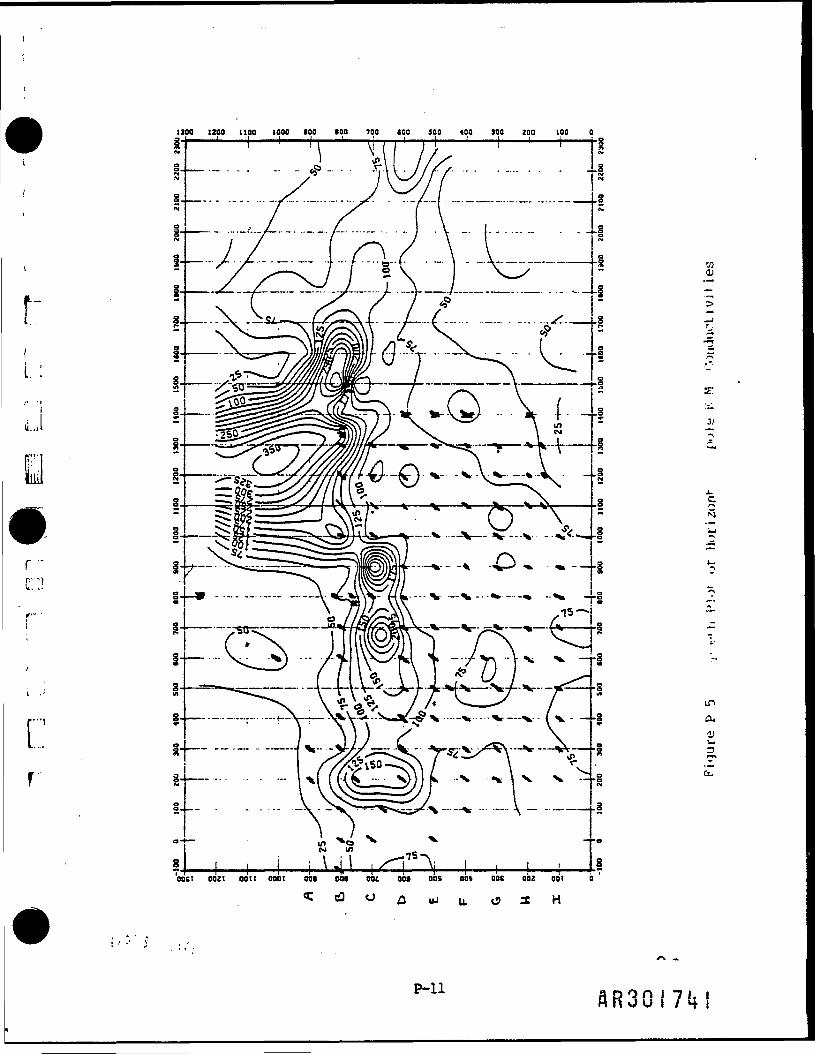
ij
r •
1300 1200 1100 tOOO 100 tOO 700 100 500 400 300 200 100 0
0011 OOZI 00 It 0001 00* OOf OOt 001 DOS 00. DOS 002 001 0
UJ01
__
/-iN
C,. : : =WT:\: :v:
P"n

Section No. Appendix PRevision No. 1Date: 10/16/87Page: 12 of 18
(scrap iron and vehicles) on the ground surface. Conductivities south ofthe process area are slightly above the background range of 30 to 70mmhos/ta.
The downgradient position of the area in relation to on-site anomalousareas suggests a contaminant-related phenomenon/ however/ the increasecould just as well be due to the shallow depth of the water table, anincrease in the clay content of the local soils, and/or increased totaldissolved solids due to groundwater residence time.
P.4.1.2 Ground Penetrating Radar
Ground penetrating radar was conducted in the areas north and east of theprocess facility. In addition/ a single traverse was run south of thefacility along the road parallel to the y » 600 line from x * 0 to x =2/400 feet. An interpretive map of the subsurface/ as surveyed by theGPR/ is shown in Figure P-6. Several areas of disturbed subsoils wereencountered throughout the study areas. These disturbances ranged indepth from 0 to approximately 10 feet. These disturbed subsoils areexhibited as dense interfaces on the radar profile typically character-istic of high conductivity materials. These findings support the resultsof the EM conductivity survey. Four discrete signatures were detected onthe radar profiles/ indicating the locations of subsurface utilities. Noevidence of a suspected subsurface concrete structure was revealed in theGPR findings. However/ during the geophysical reconnaissance survey aconcrete foundation was observed at coordinates 675, 850. It is sus-pected that these concrete remenants demote the location of the concretepit.
P.5 CONCLUSIONS
The EM conductivity surveys conducted at the L. A. Clarke site revealed •several areas of highly conductive subsoils and/or groundwater. Highdensity data obtained in the field provided high resolution resalts} Q { 7 {, p
P-12

._.
I ..
r
: - . - - - - - • FIGURE p - 6
P-130985B ftR30 171*3
Section No. Appendix PRevision No. 1Date: 10/16/87Page: 14 of 18
locating very localized conductive sources and delineating a possiblebroad plume boundary.
The ground penetrating radar findings indicated areas of altered subsoilsand located several buried culverts and utilities.
Based on these findings and historical information about the facility, itis believed that the localized contaminants are products of leaks aroundthe operation facility and leaching of the treated lumber stockpiles.
P.6 RECOMMENDATIONS
WESTON recommends that these results be confirmed by establishing backhoetest pits in the areas exhibiting soil disturbances. In addition, pro-posed soil borings and monitor wells should be ideally located relativeto these findings.
P-14
0985B AR30I7H

lliil
Section No. Appendix PRevision No. 1Date: 10/16/87Page: 15 of 18
Table P-l
Grid Coordinates and Terrain Conductivity[_ Values Recorded at the L.A. Clarke Site
1 • X Y Zi Z2
!• Ii 1 -100.0 ttdO.O 3b.O bb.u
0.0 i>00.0 ' 7<*.0 bJ.U0.0 700.0 69.0 30U.U
: 0.0 500.0 41.0 =>*...100.0 41.0.0 75.0 51.>;100.0 500.0 63.0 t!4.o100.0 670.0 63.0 94.uIOO.U 800.0 48.0 66.0200.0 100.0 78.0 40.u200.0 200.0 61.0 42.02oO.O 3oO.O 69.0 6 / • u200.0 400.0 70.0 59.1;
f— 200.0 bl'0.0 66.0 100.u[" 200.0 '600.0 170.0 /.O1 200.0 /46.0 165.0 300.0
200.0 900.0 37.0 34.0! 300.0 loo.O 78.0 66.u' 300.0 200.0 88.0 54.u
300.0 300.0 71.0 56.0' 300.0 *+uO.O 60.0 6c.u( i 300.0 SOO.O 77.0 110.o
300.0 600.0 94.0 80.ur- - 400.0 100.0 6b.O 50.0J fOO.O 200.0 81.0 ?=>.u
-*00.0 JUU.O b/.O /i.ot+00.0 *»-.! 0.0 90.0 h / .';4v'U.O ±>uO.O 79.0 S4.uHUO.O 600.0 125.U «*o.o
jOO.O euw.O 41.0 b'i.O300.0 i*y-y.o 34.0 4C.o300.0 luO.O 74.0 b»*.0ta— • ' | rt j.* I 1 ' I W \ ll ^"\ <(* 11
buO.O 3ii0.o 56.0 IbO.O' • . ' - . . bOO.O HOU.O 59.0 l4b.O
" " ' ' 500.0 «+bo.O 63.0 /«:.'oSOO.O 500.0 100.0 79.0
_________ 500.0____DOO.O ' IbO.O_____40. ~j
flR30!745
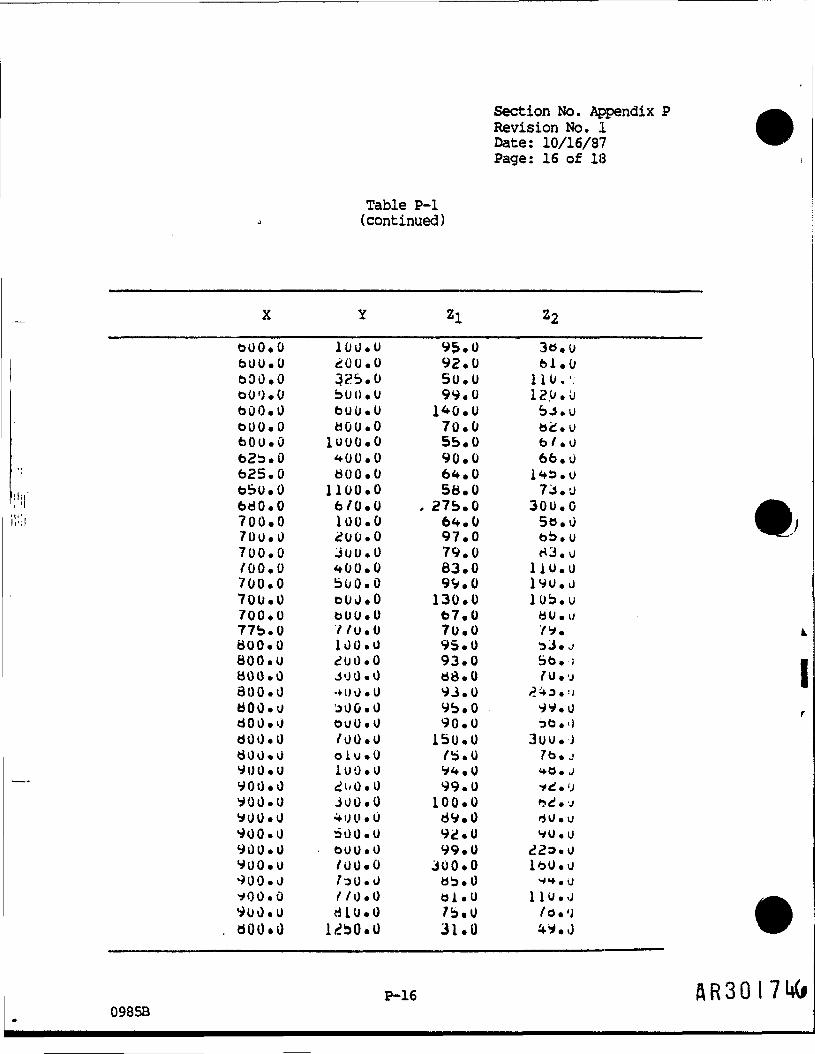
Section No. Appendix PRevision No. 1Date: 10/16/87Page: 16 of 18
Table P-l(continued)
X Y Zi Z2
000.0 100.0 95.0 30.0600.0 200.0 92.0 61.0600.0 3.25.0 50.0 110,',000.0 500.0 99.0 12.0.0600.0 600.0 140.0 bJ.U600.0 600.0 70.0 62.u600.0 1000.0 55.0 6/.062b.O 400.0 90.0 66.0625.0 600.0 64.0 143.o650.0 1100.0 58.0 73.u680.0 6/0.0 , 275.0 300.0700.0 100.0 64.0 50.0700.0 200.0 97.0 65.0700.0 300.0 79.0 83.u/OO.O 400.0 83.0 110.0700.0 500.0 99.0 190.0700.0 oOO.O 130.0 105.u700.0 bOO.O 67.0 ttO.u775.0 7/0.0 70.0 79.800.0 UO.O 95.0 53.j800.0 200.0 93.0 56.;800.0 300.0 68.0 /O.'j300.0 -MJO.O 93.0 -?*3.<J800.0 300.0 95.0 99.0800.01 OuO.O 90.0 so.*)600.0 /UO.O 150.0 300.J800.0 oiu.O /5.0 76.j900.0 loO.O 94.0 *a.j900.0 2(»0.0 99.0 vd,<j900.0 JOO.O 100.0 2.j900.0 4UU.O 89.0 fiO.u900.0 500.0 92.0 s>0.u900.0 000.0 99.0 229.0900.0 /OO.O 300.0 160.0900.0 /oO.O 65.0 ^«*.u*QO.O //O.O 01.0 110.0900.0 dlO.O 75.0 /o.'jdOO»0 lidbO.U 31.U ^V.J
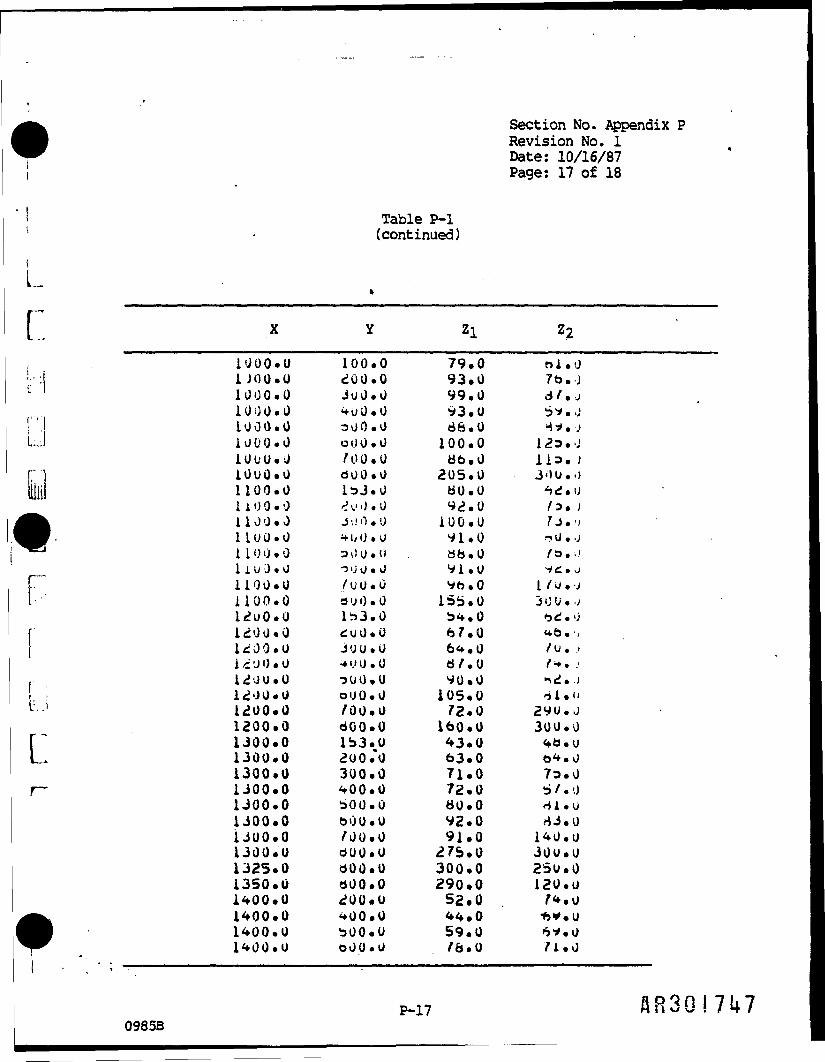
L
r
Section No. Appendix PRevision No. 1Date: 10/16/87Page: 17 of 18
Table P-l(continued)
X Y Zi Z2
1000.0 100.0 79.0 nl.-J1JOO.O 200.0 93.0 76.J1000.0 JoO.O 99.0 d/.j1000.0 HoO.O 93.0 b*..,'1000.0 aoO.O 86.0 4*.Ji000.0 oOO.O 100.0 123.0iOl'O. J /OO.O 86.0 113. )1000.0 dOO.O 205.0 30U.O1100.0 133.0 80.0 ^>d.\)UOO.O '0.0 92.0 /3. )IIOO.J Ji.'H.O 100.0 /J.'/1100.0 4f 0 0 • 0 91.0 r»0..jI 100.0 300.0 S6.0 /o.i>liUJ.O TJU.O 91.0 •* £ • j1100.0 /UO.O *6.0 l/u.J1100.0 3'JO.O 155.0 300..;12uO.O Ib3.0 b4.0 *>*.<)
f 1200.0 .<uO.O 67.0 **6.;[ 12JO.O 300.0 6<f.O /u. ..
i>'JO.O -*UO.O 6/.0 /**. .•f 1200.0 300.0 VO.O »>2. Ji, ; 12<JO.O oOO.O 105.0 4l.!i11 1200.0 700.0 72.0 290.j
1200.0 800.0 160.0 300.0P 1300.0 153.0 43.0 46.uL 1300.0 200.*0 63.0 e>4.o
1300.0 300.0 71.0 73.0r~ 1300.0 400.0 72.0 5/.0
1300.0 300.0 80.0 41.u1300.0 600.0 92.0 83.01300.0 700.0 91.0 140.01300.0 dUO.O 275.0 300.01325.0 600.0 300.0 250.01350.0 400.0 290.0 120.01400.0 200.0 52.0 . 74.u1400.0 400.0 44.0 -61*. 01400.0 bOO.O 59.0 6*.01400.0 000.0 76.0 71.0

Section No. Appendix PRevision No. 1Date: 10/16/87Page: 18 of 18
Table P-l(continued)
Z2
1<»00.0 /uu.O 135.0i*»OU.U 300*0 155.0 109.01500.0 175.0 36.0 3o.O13'JO.O JOO.O 61.0 63.01300.0 3')0.0 61.0 1/u.u1300.0 oOQ.O 81.0 iti.O1500.0 700.0 82.0 Ma.o IIbOO.O /oo.O 9tt.O /J.u I1300.0 8UO.O 300.0 300.01500.0 10'JO.O 42.0 40.0 n1600.0 100.0 63.0 61.0 '{loOO.O 200.0 44.0 53.0 L1600.0 300.0 46.0 74.0loOO.O 300.0 68.0 77.01000.0 t>00.0 79.0 -ib.'jloOO.O /jU.O 92.0 I'-iO.OloOO.O *00.0 62.0 O/.O1000.0 oOO.O 300.0 300.U1/00.0 bOO.O <+a.O Ss.O1/00.0 6UO.O 76.0 tfO.O1/00.0 /OO.O 92.0 90,01000.0 300.0 62.0 53.UloUU.U ouO.O 86.0 /^.Oi'JOo.J /OO.O 110.0 -a^.UlOUU.O 030.0 /9.0 113.01900.0 300.0 62.0 /O.O1900.'J 000.0 68.0 72.0
o /OO.O 115.0 P30.Uj -0.0 /4.0 ~*y. >
<iO'j;i.u 3.0 oj.O '*ci.-J200U.0 oOO.O 91.0 HO..J2000.0 /')(). 0 93.0 2.02oi)ij.o i<+i,'.0 73.0 -»i.-J210'J.J t>^3.u O3.0 */.0210J.O 000.0 90.0 1^0.02100.0 /OO.O 60.0 Id3.0210J.O //O.O /O.O MJ.O2100.0 030.0 65.0 oef.u22 OJ..J 3iiu.O 69.0 /O.'J220J.O oOO.O 145.0 l^o.O2200.0 700.0 58.0 125.02200.0 770.0 57.0 8O.O
•__________2300.0____800.0_____67.0____133.0_________
HR30I7U8
I,p
1IJ Appendix Q1I
11111
:''i'-t ;..,

APPENDIX Q
GEOTECHNICAL RESULTS
1LrU
0985B 88301750
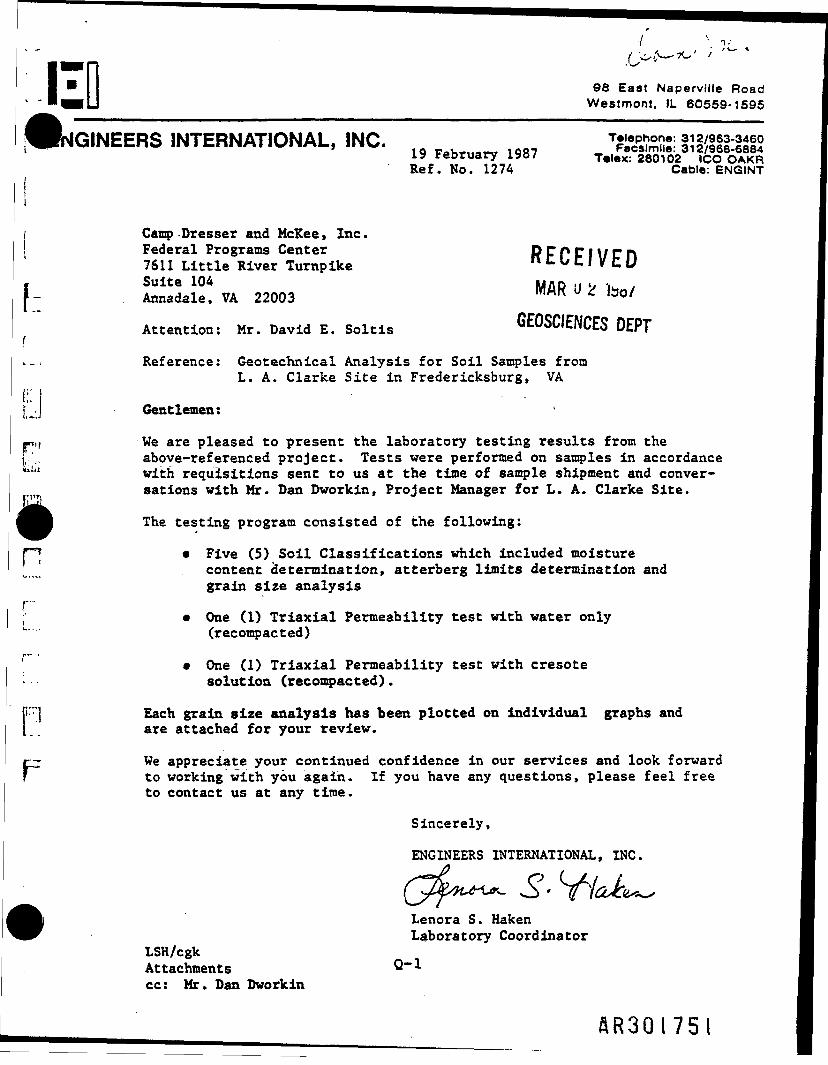
98 East Naperville RoadWestmont, IL 60559-1595
IGINEERS INTERNATIONAL, INC. rfi§S%£-19 February 1987 T-*SlSoiRef. No. 1274 Cable: ENGINT
Camp-Dresser and McKee, Inc.Federal Programs Center P F P F I \7 C n7611 Little River Turnpike •» t O C I V t USuite 104 i*nD ,, .. ..Annadale, VA 22003 MAR J * Ii3o/
Attention: Mr. David E. Soltis GEOSCIENCES DEPT
>... Reference: Geotechnical Analysis for Soil Samples fromL. A. Clarke Site in Fredericksburg, VA
( • I[J Gentlemen: '
p,r We are pleased to present the laboratory testing results from thef.'., above-referenced project. Tests were performed on samples in accordancelllUj with requisitions sent to us at the time of sample shipment and conver-
sations with Mr. Dan Dworkin, Project Manager for L. A. Clarke Site.
The testing program consisted of the following:
• Five (5) Soil Classifications which included moisturecontent determination, atterberg limits determination andgrain size analysis
t—-
\ • One (1) Triaxial Permeability test with water only"""" (recompacted)
r • One (1) Triaxial Permeability test with cresote' solution (recompacted).
(""] Each grain size analysis has been plotted on Individual graphs andare attached for your review.
r- We appreciate your continued confidence in our services and look forwardF to working with you again. If you have any questions, please feel free
to contact us at any time.
Sincerely,
ENGINEERS INTERNATIONAL, INC.
Lenora S. HakenLaboratory Coordinator
LSH/cgkAttachments Q"1cc: Mr. Dan Dworkin
AR3Q175!
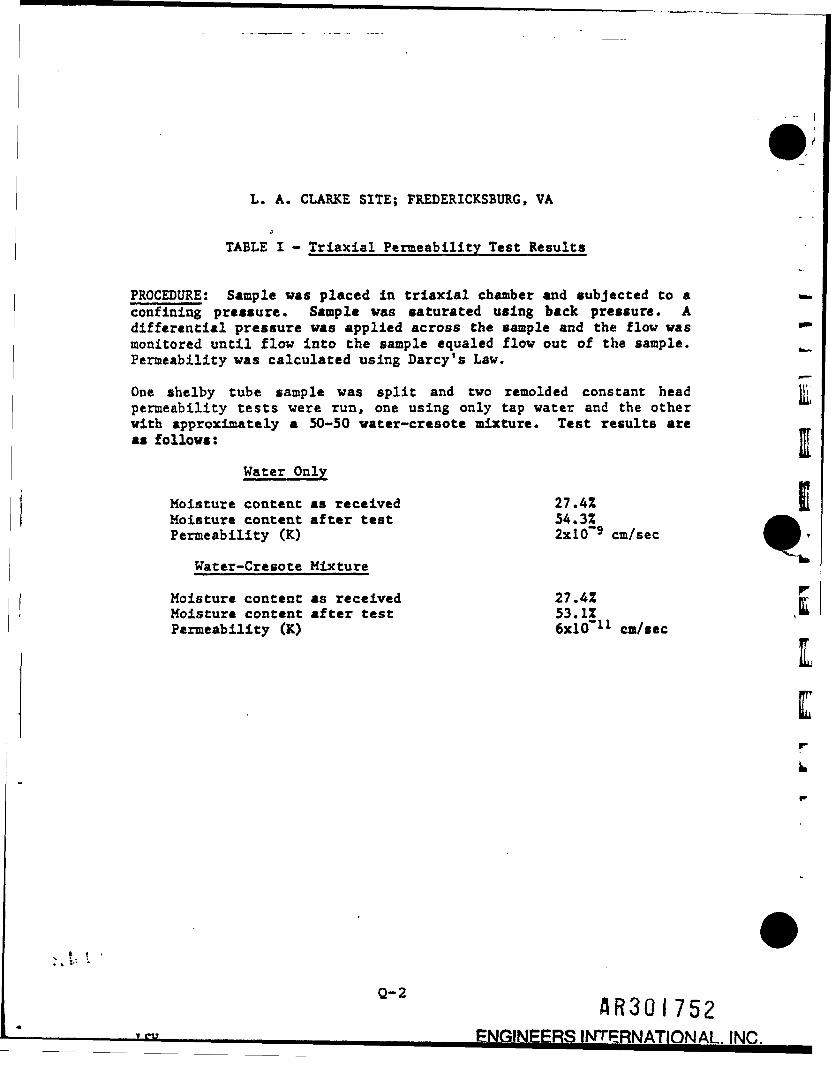
L. A. CLARKE SITE; FREDERICKSBURG, VA
TABLE I - Triaxial Permeability Test Results
PROCEDURE i Sample was placed in triaxial chamber and subjected to a M.confining pressure. Sample was saturated using back pressure. Adifferential pressure was applied across the sample and the flow was •*monitored until flow into the sample equaled flow out of the sample. ^_Permeability was calculated using Darcy's Law.
One shelby tube sample was split and two remolded constant head jl'ipermeability tests were run, one using only tap water and the otherwith approximately a 50-50 water-cresote mixture. Test results areas follows: ||
Water Only
Moisture content as received 27.42Moisture content after test 54.32Permeability (K) 2xlO~9 cm/sec
Water-Cresote Mixture
Moisture content as received 27.42Moisture content after test 53.12Permeability (K) 6x10~11 cm/tec
I[
JIR30I752INTERNATIONAL. IN(
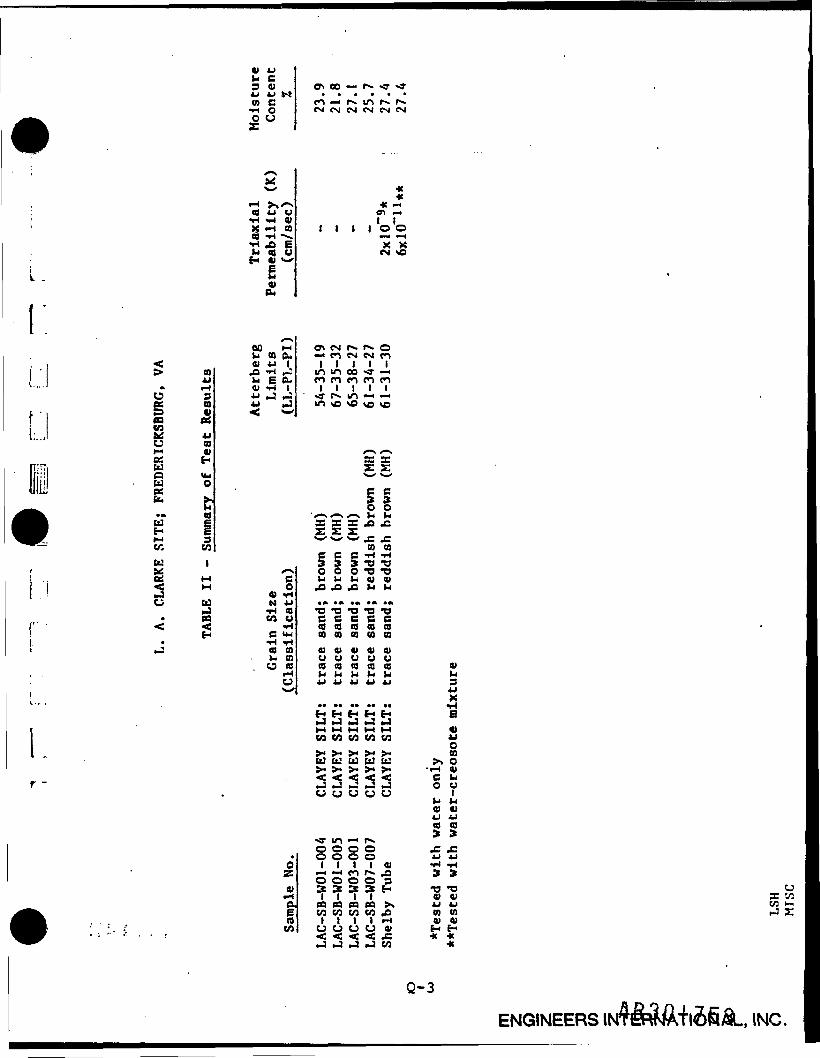
ti Cg D {jr, co •—«we co -- p» in•HO CM CM CM CM CMOCJ
X
• « * *« I Ito i i i t o ofci <0 cjH co «-'l- I
X XCM SO
i:> O
4J« «-<o see co
COI* 4Jcj al-i 4)e: HwQ vu(d OOS
**> 03
3
CU 4J ^
V iH t
e?\ CM r*. PS o-* CO CM CM COI I I I Iin in oo «3- —co co co co coI l I l i-a- p*. in «-« —•V D O O US
II'<—s •—>. V< (-1B SB X J3 .Cs s r»^««'«—• j;
CC CO GO O§e B -H -H.» 5 T3 TJ
O O O -O T)W Id t-i « «XI .0 4= H h
1-4 eM oU MMfi -H aea n u
a ah COU CD
•O "O *O T3 "Oe e e B c
at « « « «u u u u uto to to a a atU U }4 1-1 h b4J 4J U 4J 4J 3
4JX•• •• •• •• •• 4
SS S S S B»J «pJ .J *J *J1 M M M M M «
CO CO W CO CO WO
>4 >4 S- >< p- 0}U U U U W >. O>•>•>«><>- -i-i a»U CJ U U CJ
f(A
CO «5 *IT in — P*
§OOO X .COOO JJ 4JI I I I 4) f* -rt
ca pa aa to >, w *jeo w co co .a to wI I I I r-t CU CUCJ CJ CJ CJ W H H_J ,J _1 .J M *
.«£
Q-3
ENGINEERS I N t - - l y l , INC.
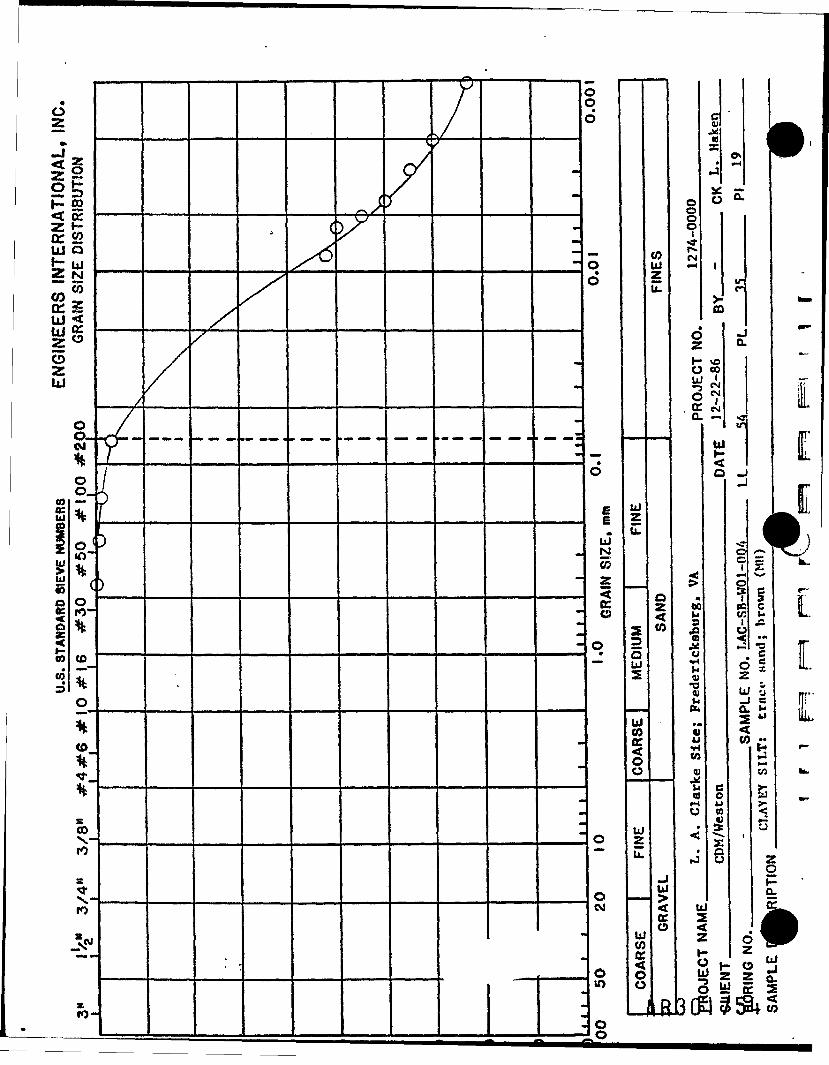
*OZ*
«fc_J<zoh-zccUJh-zCOcc111UJzozUl
COccwU>ig§1&0)CO=>
§§sK
COoUJNlCOSeeo
oO-
oo_
o (
o10-
(0~~^0
*_
s00tosN-tos~ ——
/y?;/
iS)
///
/
A
/
<
x<fS^^
r> X
x^
—— (
y
^/\/
---
--V
«•
O6
0o
—o
EiUNcr2••4BC
O—
0MM
OCM
OIT)
Oo
3>:>
••»0o
o
EgIUNCOZ
KO
O
0.MM
oCM
OIT)
uz
2
Ou2
__UJCOKOO
UJzn••••
COUJzLL
ozCO
u^Ko
b COARSE
0oo01CM
G01
S
JOv•
1
o S
1
m6z1- MOO eo
37tr d' a. -
560M
1•8•rt
01•o4)Ct4
,„
tl
•HtnvV4
f-4CJ
<J
ir
a
»3«r
Ul
0
eoCO
18
UJ2Z
0 hU) •0 (
_J
^ococc
I
d^-» r§'|u*1Mu D_J e
1 **tfl «
i
,Jv:j_wB5
ZoHo.i
o^Ul** C5 i= 25:
J a 2
I
I.
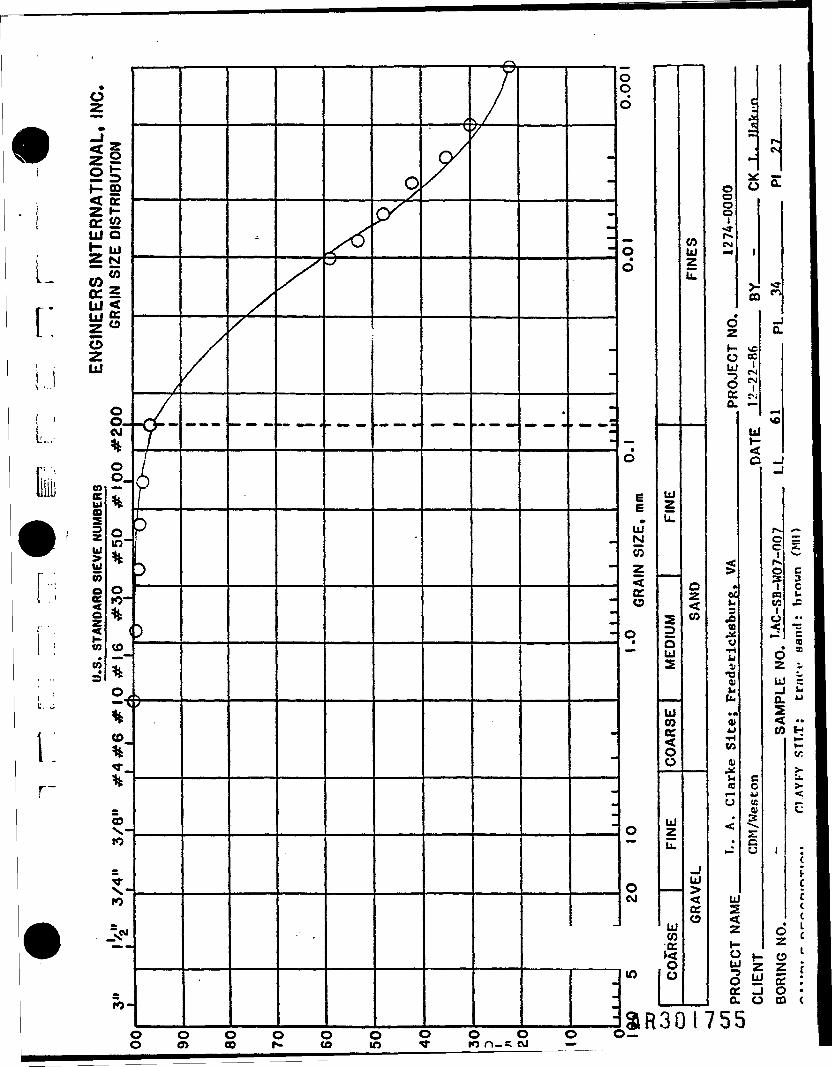
Ii
I
i\[
1
f
<
1 u.s. STANDARD SIEVE NUMBERS
ENGINEERS INTERNATIONAL. INC.
tIBUTION
CO5UJNCOzcco
oO-CM
O
o_
0_
co_
o— •<
»_
CDx.-
x-ro
s10-
<<
/fp
)
}
5 ——
/
*
x^^
9P/
- —— (/
•
—
-
-
*m
M
•
•
•
••
«f
-
Oqd
qd
o
eB
NCOZ
cr
o
o
0CM
to
»R3 O O O O O O O O O O H3 o c D f s . c o . o V K ) n - c C M —
Ulzu.
ou2
| COARSE
UlziL
COARSE
COUlzul
ozCO
UJ
o
Doni
iroT
MAwc
L.
A. Clarke Site: Frederlcksbure.
VA
PRO.IPHT Mn.
1274-0000
n IFMT
CDM/Weston
DATE
12-22-86 pv -
CK T..
lJr,.n
P.
a
CO
a.
«o
_-J
oc
ICOCA
CJ
Czu.«MIa<K
1
C2
• C: 2a
1 Cl CC
ccu.C
a33
;;£
t—
g
C
cfcctc> t
-1 i• •*> «1 (301755
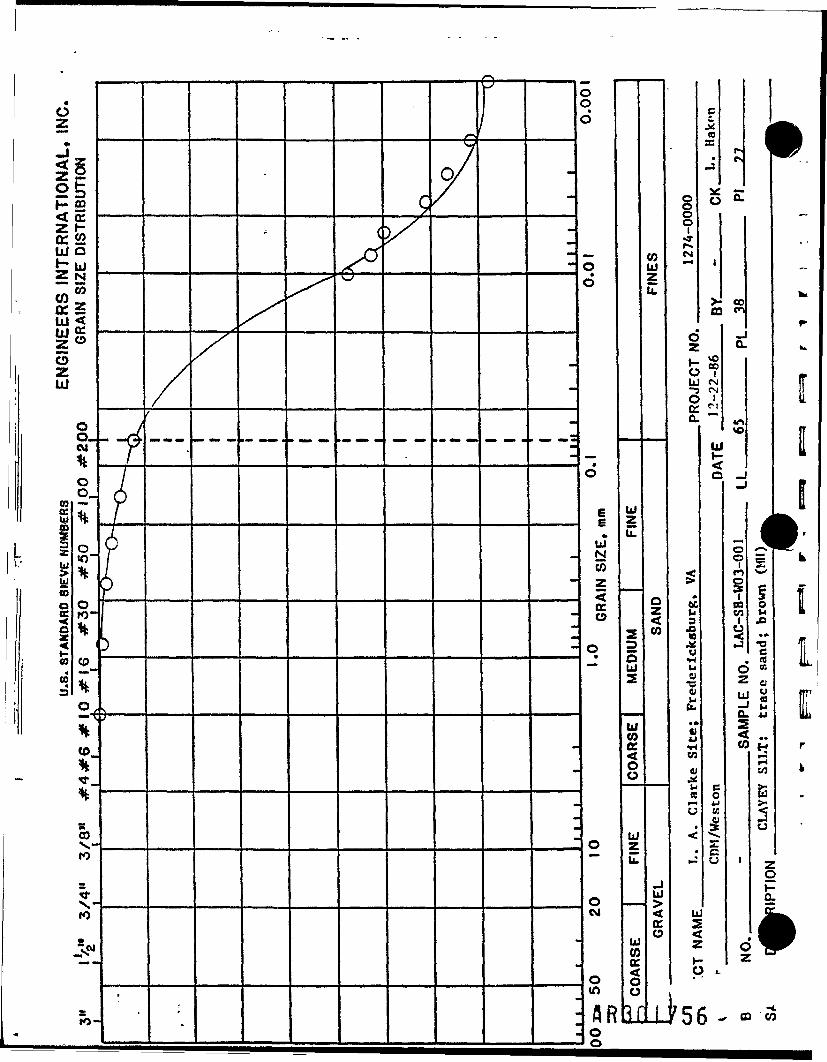
*OZ
1zccUlHZ
COocUlU)zozUl
COcc
IjJ
OJto
TANOARD
to*to*
m
co5UJNCOzcco
o0.CM
O
o_
oIO~
to«*•»*""
.
seoto
X-fO
s
-fff)
•
/-
,
x
;
^(xy
3 ——
••
-
-
-••
oqd
oo
o
gEUJNCOZ
cco
o
o
oCM
OIA
flRoo
Ulzu.
aoUJ2
| COARSE
UJzul
UlCOaoo3
COUJz\L
azCO
_lUl
cco
1
8o
CM
o
oUJ3cca.
s
ckaburg
Frederl
«TwCO
V
«
*
u2<2»-C
Hi
c
m
O
l
CD
\oco(MCM1fl
UJr-
Q
C
M/Westo
CJ
Ii
Ct
> t
»"> ^
CX
CL
00CO
Q.
VO
_J_J
O0co
(QCO
CzU.••
Q.2<V.
'
C2
, 0
<l
I•a
, su
i u! 2
1 *•*.H
iop-0.i
i CO
III

1
0
•
dzmONAL,
**.ZCCUl1-zCOccUlUlz0zUl
uOB
zUlUlto
TANDARD
toCO
~?
IBUTION
COOUJNCOzccC9
O0-CSl
OO.
5o_
1o_
co_
o
<o_
COx-to
s«•x-IO
io-
/r~ipD
}
•)
/
*
/'^
P-&-
\
/
r
^
-
.
••
•
oqd
oo
o
EEUp.••V2<QC
0
0
0CM
Oin
or\
DDD
O•O
•o
EEUJNCOZ
cco
0•
0M*
0CM
O
Ulzu.
23OUl2
UJCOcc<0o
UJzu.
UJCOcc<o
COUJziZ
ozCO
_JUl
cc
oo001p-CM
c0)
~*"*
Jc0
1
^
CMCO
E
inCD ^
dz•
O 00UJ 1-3 CM0
a
^
ec
•sCOu•r4t-l01•o01
£lfl«!"COou«u
<.
,_
*-'
_Q.
«£>
UJHC
Co4J10
.1^Co
UJ2Z
s
-
ir01
g1CCto1y•-
^
c3u
^^•Su..•oc
* ^JJOZ ;- . y~j ~CL w2< ..CO H
i
t-l•J~.
u;>2CJ
O
0.CCccr.
i =• O U': z n"in ~* ••• s? 5
o 3R30vocr.
757
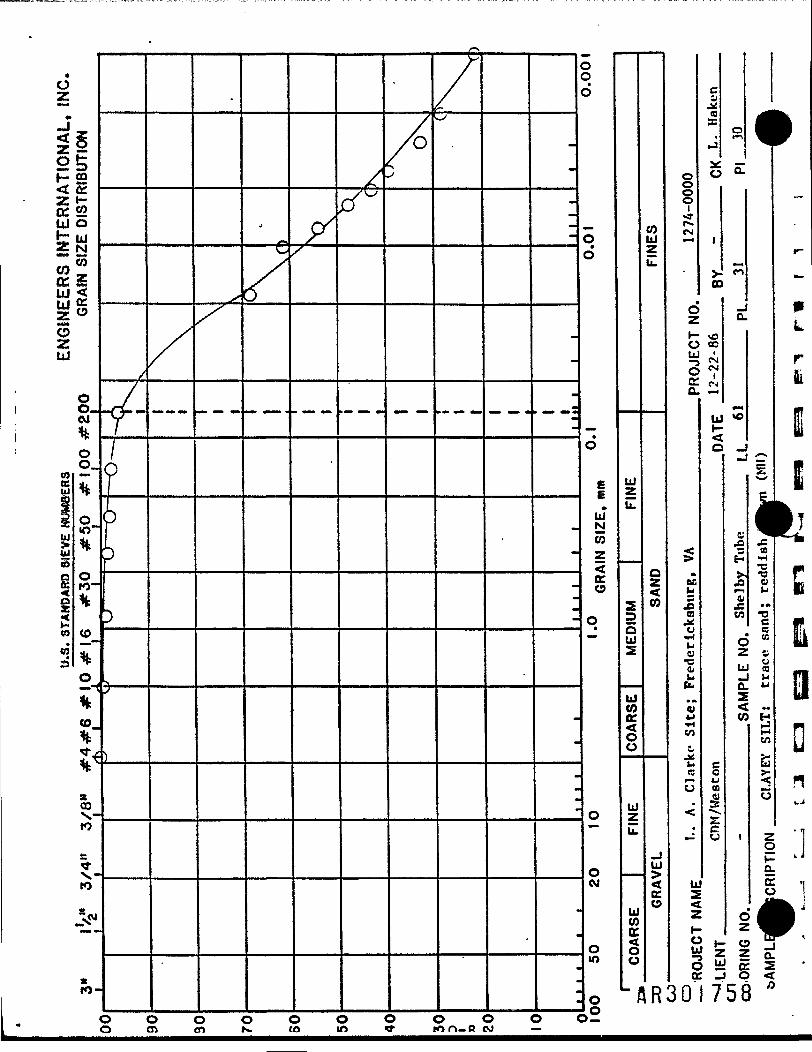
* --
— - -
—
u.s. STANDARD
SIEVE NUMBERS
ENGINEERS INTERNATIONAL,
INC.
MBUTION
p-cooUJN55£<tro
o0.CMHOo_5oo~%0to-%to_%°-<c?-$•¥sCOX-1»os<frx-eo
>.MM w-
X
10-
(1
//
p
)
) ——
i
x ^/
.>
v.-./xs Ad/N^ /
//
-
-
-
-
•
<•
Ml
Oo•o
o•0
•0
gEUJMCOZ<cco
o•
o
oCM
Om
OD O O O O O O O O O O —O m eo N. to m ^ »on— P ev —
UJzu.
TL3OUJ2
COARSE
UJz\L
UJCOcc<co
N
COUJzIII
oz<CO
-JUl><cc0
IR
IOJ °,D«,COTMAUC
'.-
A. Clarkf S
ite; Frederlcksburg.
VA
PROJFrr MO
1274-0000
1 -"-JllFMT
CDM/Weston
DATE
12-22-86 py -
CK L.
Haken
0*~\
QL
CO
^a.
*HVO
__j
c;
H
J3"3CO
4
CzLL^a2<K
C2
• C2! i
5E
1
/—»
§
4a•H•c•o0kl*••o
iil^1 k>«••sCO
z%CJ
cpa
1
f-
PL
rfii
I
rB
i
DnwJ
:iCC n0
t1i •> <
) "
r~
L
ERNEST F. FULLAM, INC.900 ALBANY SHAKER RD. • LATHAM, N.Y. 12110 • 518-785-5533
Accessories for Microscopy • Scientific Consultants
July 9, 1987.•
T ff u P A • • "est Ches{er, Mr. Jeffery W. GoodwinEARTH ENGINEERING & SCIENCES u-i i n i--
1 3401 Carlins Park Drive x JO'Baltimore, Maryland 21215 Received by
;.. i Project Mgmt.Ref: Your Purchase Order No. Letter 5/14/87-
j Ernest F. Fullara Inc. Report No. 2763
,--- Dear Jeff:
"^ Enclosed please find the EDS/XRD data obtained during examinationof the 2 clay specimens which were submitted for chemicalanalysis. I will send the raw data (XRD traces etc.) underseparate cover.
We have kept on file the samples and the XRD data for futurereference. Please call me if there are any questions about thereport or if you decide additional work is necessary.
I hope this information proves useful and look forward toproviding continued service.
Very Truly Yours,
ERNST F. FULLAM INC.
Thomas K. HareManagerConsulting Services
cc. Ralph Schapot
Q-9
AR301759
tRNEST F. FULLAM, INC.V irillllii C iillsult.iMls
••Hi \lll\\\ \H\klK Kl I • I MM \M N\ I .'I III
.&
EDS/XRD ANALYSIS OF TWO CLAY SAMPLES
FOR
EARTH ENGINEERING & SCIENCES
BALTIMORE, MARYLAND
JULY 8, 1987
Report No. 2763
0-11
^30/760
ERNEST F. FULLAM, INC.»w icMiilii C onMill.mis
•MKI \IU\SV MIXKIK Kl) • I \IM\\1 M 1JIIII
EDS/XRD ANALYSIS OF TWO CLAY SAMPLES
Two clay specimens designated LA CLARKE SITE B-12 and LA CLARKESITE B-13 were submitted for chemical analysis using energydispersive x-ray analysis (EDS) and x-ray diffraction (XRD)techniques. The purpose of the examination was to compare thecompositional data obtained from the two soil samples in an effortto determine chemical variations which may be attributed tocreosote conatmination.
SPECIMEN PREPARATION
Representative soil sample was taken from both specimens andground using a mortar and pestle. The ground sample was thenpacked into pyrolytic graphite crucibles and submitted for EDS andXRD analysis.
SEM/EDS ANALYSIS
The prepared sample mounts were inserted into the scanningelectron microscope (SEM) which is fitted with the EDS system. Thesamples were oriented to provide optimum conditions for x-rayanalysis. Figure One presents the EDS data obtained from both ofthe clay samples. Silicon, iron and aluminum concentrations werereported with traces of potassium, calcium, titanium, magnesiumand sulfur. The semi-quantitative compostion profiles indicatethat the LA CLARKE SITE B-13 sample contains slightly more siliconthan the LA CLARKE SITE B-12 sample. There is also a suggestion ofmagnesium-sulfur substitutions between the two samples; however,the small amounts reported for these elements makes it difficultto confirm.
The EDS technique using conventional silicon-lithium detectorsreports elements from atomic number 9 (fluorine) through 94(plutonium) as they apperar on The Periodic Table of Elements. Theintegral counts beneath the peaks are processed by amicro-computer to provide atomic and weight percents followingaccelerating voltage, sample geometry and Z (atomic number) A(absorbance) and F (fluorescence) corrections. The EDS data isused as a preliminary compostion report to expedite the XRDanalysis.
Q-12
AR30I76I
Lill:!
L
ERNEST F. FULLAM, INC.S< icniihi ( uiiMjIl.inls
SM-VMN Kl> • I MM-VM M l.'llll
XRD ANALYSIS
The prepared mounts were then subjected to x-ray diffractioninstrumentation. The specimens were subjected to copper k-alpharadiation with the XRD trace taken over,the Bragg reflection angleof 2 through 80 degrees two theta. The XRD system makes use of afocusing graphite . crystal diffracted beam monochromator toseparate even the most difficult reflections. The reported XRDinformation is presented in Figure Two.
It was evident during examination of the XRD traces that sample LACLARKE SITE B-13 held more free quartz than the LA CLARKE SITEB-12 sample. This information correlates with the observed siliconvariations reported during EDS analyses. In additon to quartz, the
|]{j indexed reflections measured from both clay samples indicatedconcentrations of halloysite and smectite with both hydrated andnon-hydrated phases reported. There were trace reflections whichwere not completely identified; the LA CLARKE SITE B-12 sampleproduced 6 to 8 unidentified reflections while the LA CLARKE SITEB-13 specimen held 3 to 4 unidentified peaks.
The XRD data is interfaced to a computer to enable identification.The hardcopy XRD trace exhibits the information supplied to thecomputer which implements the Peakfinder and Search-Matchprograms. The XRD data has been saved on disk file for futurereference.
CONCLUSIONS
f~ The EDS and XRD data provided indicates that the two clay samplesL are extremely close in chemical compositon. The quartz
concentrations did vary slightly between the samples; however,f— significant differences were not reported.
It is possible that the creosote content in a clay sample willaffect the degree of hydration. There is extensive work in thestructural analysis of clays currently in process. The JCPDSreferences in Figure Two are fairly recent additions to the file.The clay samples could also be treated with specific solutions ina sample preparation process to isolate particular compounds.
0-13
IKNISI I. IIIU AM. INC.S, l.-nlll" l i»"M.lUIII»
It is also possible to analyze specifically for creosote using wetchemical techniques. The organics are not readily distinquishedwhen x-ray diffraction instrumentation is used.
IERNEST F. FULLAM , INC.
Thomas KManagerConsulting Services
Report No. 2763EARTH ENGINEERING & SCIENCES
Q-14
AR30I763
"AS •r
'DM *WVTirW 'J 1S3NM3
(N
tn
IE[
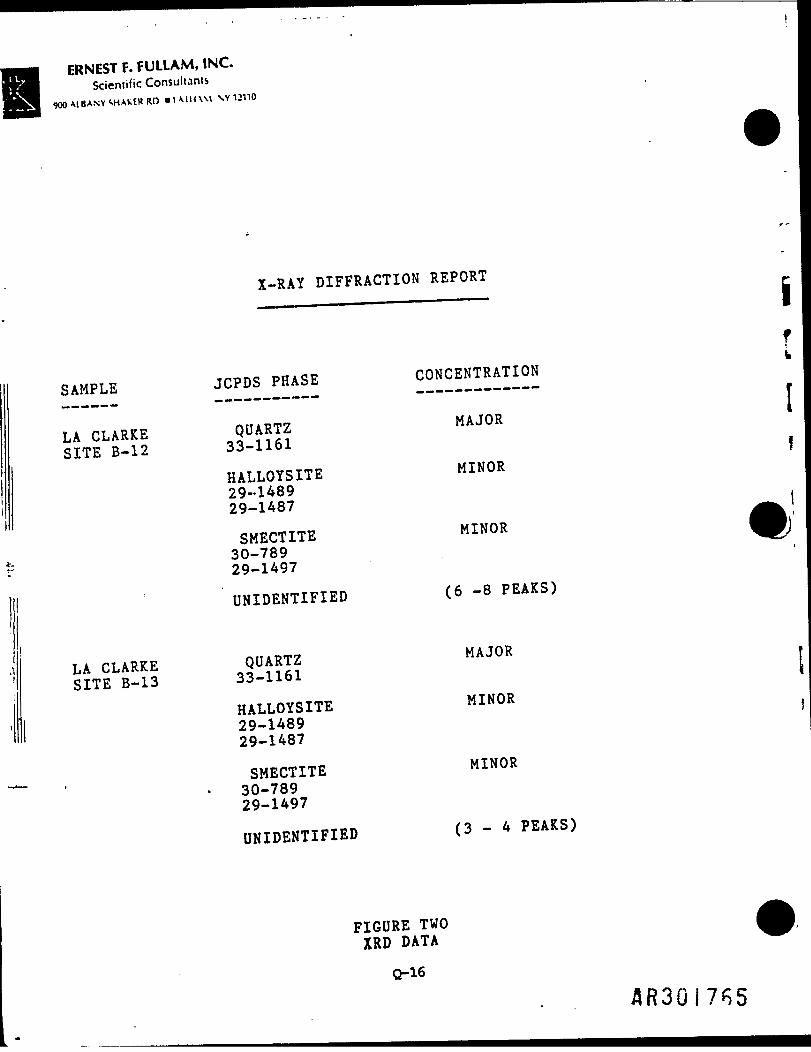
ERNEST F. FULLAM, INC.Scientific Consultants
900 -MBANY M-UkER RD • I \IIUM XV 12110
X-RAY DIFFRACTION REPORT
SAMPLE JCPDS PHASE CONCENTRATION
HALLOYSITE MINOR29-148929-1487SMECTITE MINOR30-78929-1497UNIDENTIFIED (6 -8 PEAKS)
LA CLARKE QUARTZ MAJORSITE B-13 33-1161
HALLOYSITE MINOR29-148929-1487
SMECTITE MINOR30-78929-1497
UNIDENTIFIED (3-4 PEAKS)
FIGURE TWOXRD DATA
s
LA CLARKE QUARTZ MAJOR- 33-1161
Q-16
AR3017R5
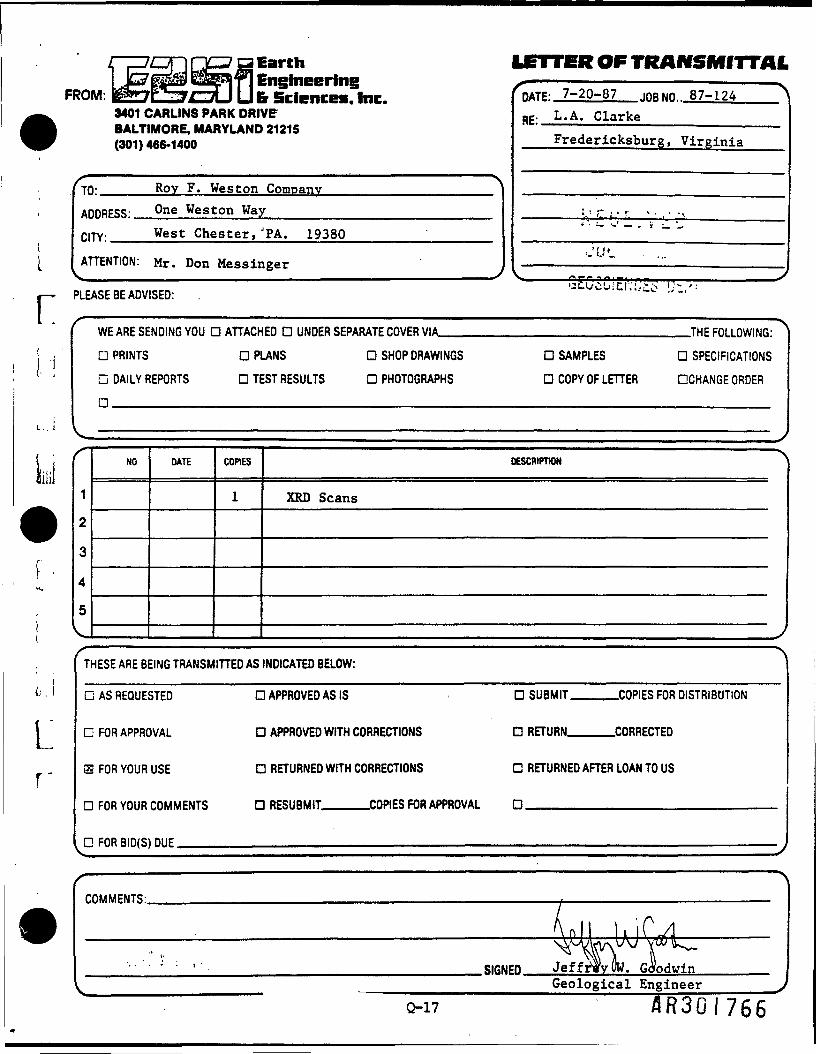
FROM: fe p T.C3U U ft Science*, hie3401 CARLINS PARK DRIVE
i Earth LETTER OF TRANSMfTTAI,Engineering
DC- L.A. ClarkeBALTIMORE, MARYLAND 21215(301) 466-1400
TO:_____Roy F. Weston CompanyADDRESS: One Weston WayCITY- West Chester, JPA. 19380
ATTENTION: Mr. Don Messinger
7-20-87 JORNO.. 87-124
Fredericksburg, Virginia
_i.
=.'!-•"-.
PLEASE BE ADVISED:
WE ARE SENDING YOU D ATTACHED D UNDER SEPARATE COVER VIA__________________________THE FOLLOWING:
D PRINTS D PLANS D SHOP DRAWINGS D SAMPLES D SPECIFICATIONSG DAILY REPORTS D TEST RESULTS D PHOTOGRAPHS D COPY OF LETTER DCHANGE ORDER
D__________________________________________________________________
12
3
4
5
NO DATE COPIES
1
DESCRIPTION
XRD Scans
THESE ARE BEING TRANSMITTED AS INDICATED BELOW:
DAS REQUESTED D APPROVED AS IS D SUBMIT____COPIES FOR DISTRIBUTION
G FOR APPROVAL D APPROVED WITH CORRECTIONS D RETURN_____CORRECTED
3 FOR YOUR USE D RETURNED WITH CORRECTIONS C RETURNED AFTER LOAN TO US
D FOR YOUR COMMENTS D RESUBMIT_____COPIES FOR APPROVAL D ______________________
G FOR BID(S) DUE _______——————————————————————————————————————————————————
COMMENTS:.
SIGNED JeffGeological Engineer
4R30I766
ERNEST F. FULLAM, INC.900 ALBANY SHAKER RD. • LATHAM, N.Y. 12110 • 518-785-5533
Accessories for Microscopy • Scientific Consultants
July 15, 1987
Mr. Jeff GoodwinEARTH ENGINEERING & SCIENCES3401 Carlins Park DriveBaltimore, Maryland 21215
Ref: Your Purchase Order No. Letter 5/14/87Ernest F. Fullara Inc. Report 2763
Dear Jeff:
Enclosed please find photocopies of the XRD scans,peakfinder and search-match programs used duringanalysis of your clay samples designated LA CLARKE SITEB-12 and LA CLARKE SITE B-13. I have the originals onfile for future reference. |
Please call me if there are any questions about thiswork or you feel there is a need for more testing. Ihope this information proves useful, and look forward toproviding continued service.
Very truly yours,
ERNEftT F. FULLAM INC.
Thomas K. HareManagerConsulting Services
Q-18
AR30J767

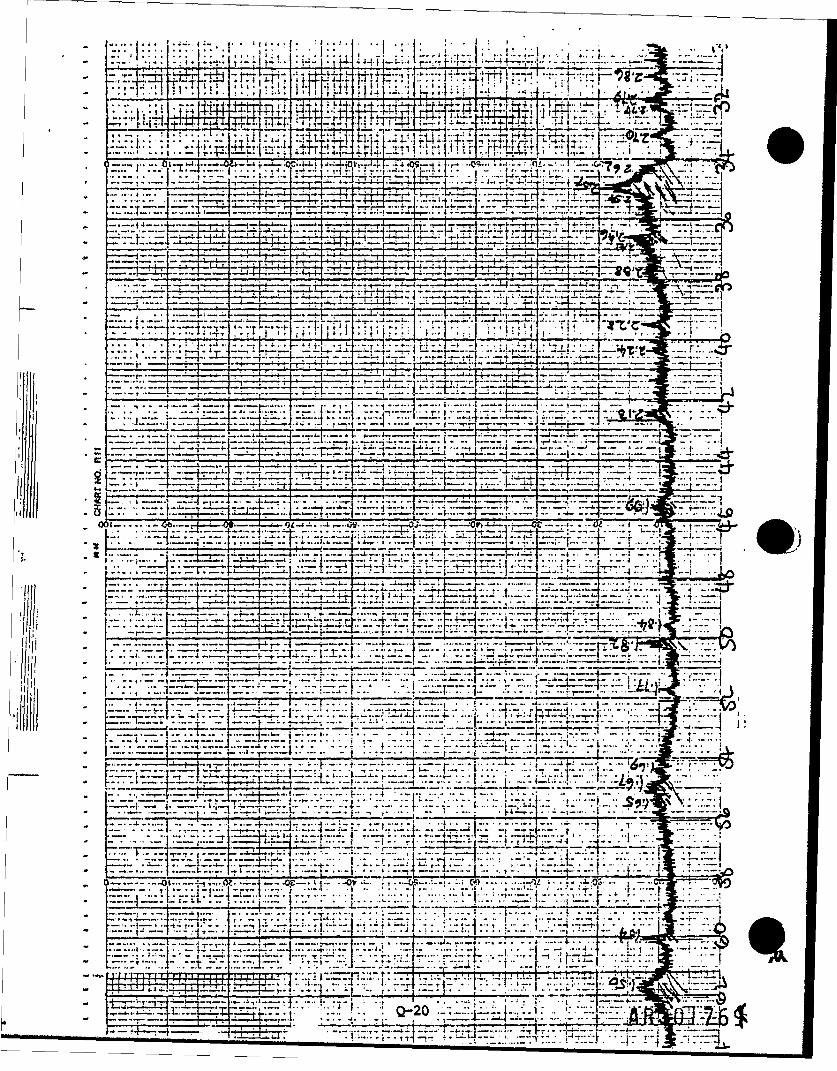
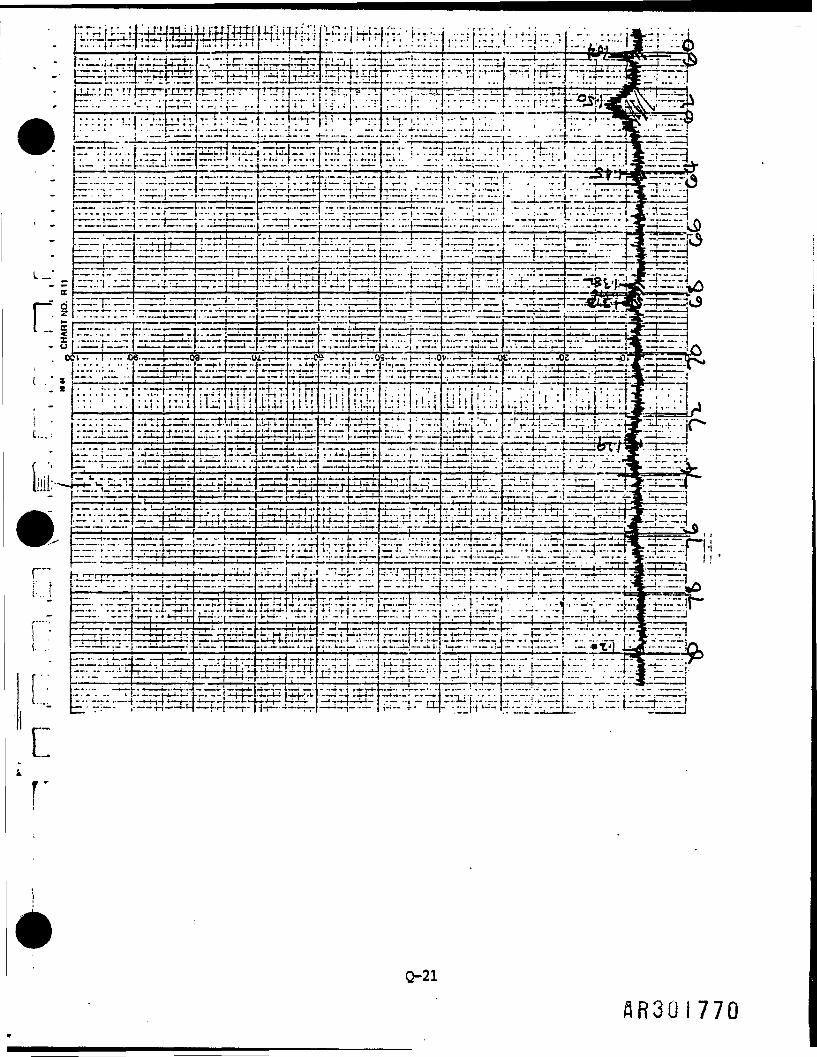
:-::ri—T <.:•••::••
EftiS-ar;
Cf"
Q-21
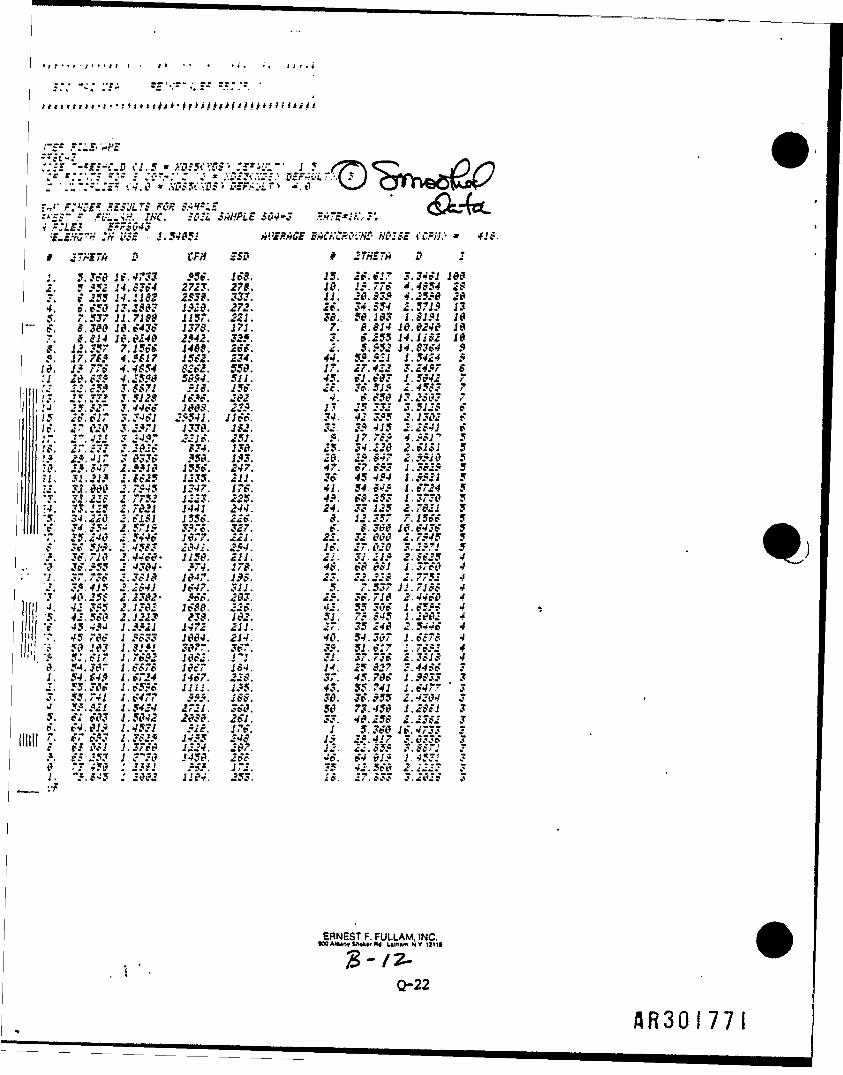
::"•• --sf.---r.ii ti.s * xaw-xs '• ?«;:••:•• i.?
F"'.1 *:«£••£* *SS'JLT$ PC'S SW-s.--•£5- f .n'ii. Wt*. SC--L SMPLE S64-3 •W-e-.'f.Vr.r .--"if-5 &FSG43l£.tHt~''i :ti i'fS • 1.54651 MIMCE BACr.'CKW:- HC-I8E <CPH:- * 418.# 2?rS7A S tFH fli- # 27HST* D 1i. 5.3f9 If, 4733 ,«5e. J«. J5. JP.P.'.' 5.?«VJ J«a*. S *!t H.S3S4 272?. 27§. 18. >*.tTS 4.4S54 SB.-. f MS H.lltS 2SS8. 5??. tl. 28. S3? 4.£Sf8 £64. e.eW JJ.lfff? J. t?. 272. 2*. 54. 5 5-* 5.57J5 J35. r.537 U.71S8 US'. 221. 3e. S8.1d3 1.8191 16g. §.?&& l».f43S 13?B. 171. 7. &.S14 16.f24f Jfl?. t.fl4 1&.&148 &42. 32?. ?. <?.255 14.US2 168. 1X.35? 7.1Se6 1488;. Zff. 2. S.?S2 14. $364 9f. tr.7f? 4.?$17 ISfS. 234. 44. Sf.fSt 1.5424 $19. If 7W 4.46S4 $3*2. SSP. 17. 27.422 3.£4f7 $tl if.fff 4.2!;?* 5SS4. Sll. 4S. fl.f»3 1.5642 7:i J.M5« 3,f&?l .'IS. 15f- if. 3f.51f £.45S3 7U. J5. 7?J 3.5128 lf.3f. Jf2 4. i.f5& 13.2S03 7N £5. fir y.446g 1868, 23?. J? 25332 3.512S f15 if. fir 3-34S1 2554L life. 34. 42 ?.*5 2.1382 fIf. t?-t2B 3:2?n 1338. 112. 32 3? 415 2.2641 f.',". 2". 422 3 24?T 221*. 251. ?. 17.TS* 4.?S1" 5IS. 2?. 13? 3.282f t34. 13». 25. 34.226 £.*1S1 5'.?. 2?.->ir 3 833f ?5S. 1$3. 26. 2?. 847 2.y?16 5•i?. J*.*-T 2.M19 15ff. 247. 47. f7.f?3 1.3*29 5?J. 31.21? 2.ff25 1235. 211. 3f 45494 l.*?21 5•2. ?J. 880 2.7*45 1347. 17S. 41. 54. $•>« l.f"24 5'3. 31.22S 2:7752 1223. 225. 4?. fS.253 1.3738 5\'4. 33.125 2.7621 1441 244. 24. 33.125 2.7821 5•5. 34.220 2.fifl 155S. 22 f, 8. 12.357 7.156e 5>" H.S54 2.571? 3*7$, 327. f. S.368 18.f43f 5'7. 35.240 2.544f 1877. 221. 22. 32800 2.7?45 5f 3* 51-?. 2.45S3 2341. 2?4. If. 27,820 3.2??1 5'f. 3f,719 2.44s8- 1158. ill. 21. 31.21? 2. If 25 4'9. 3f,?55 2 J384- ?74. 178. 48. fS 881 1.37fO 4•1. 37.73f 2.3318 18-17. 1?$. 23. 32.228 2.7752 4"2. 3?, 415 2.2841 If47. 311. 5. 7.53711.7188 4'3 40,251 2.2382- ?ff. 203. 2?. 3f.718 2.44fO 4J. 42 3*5 2.1382 If 88, 22f, 42. 55.3df I.f5?f 45. 42,5fQ 2.1223- 138. 182. 51, 7?. £45 1.2662 4
45 4?J l.??21 1472 211. 27. 35-248 2.544f 445 79f 1 ?833 1804. 214. 40. 54.307 l.fS7S 459 183 1.81?1 3977. 3S7. 3?. 51.f:7 <.7f?2 4
'.« 5:. fl" l,7f?2 18f'2. I'l. 31. 37.73f 2.3818 40. f-t.387 l.fgre 19f7 18-i. 14, i5 S3? 3.44Sf 31. 54. $4$ I,g724 14f7. 228. 37. 45.78f l.?833 32. ?5,38e l.ffff. llil. 1?5. 43. 55.741 I.f477 ' 33. tS.741 I.f4?7 ???. 188. 38. 3f.?55 2.4384 3^ 5f.?21 1.5424 2721. 3f8. 58 73.458 1.2811 35. fi f03 1.5842 2989. 2fl. 33. 49.258 2 2382 3f. *±.81? 1.4531 ?18. 17f 1 S.368 lg.4733 37. tr f?3 1.382? 14 ? 5 2*8 1? 2?. 417 3.0336 3c g! 981 1.3768 1224. 287. 12. *2.85? .8871 3?. ff 253 1.3~38 1450. 268 Jf. f4,vl? 1,453: 38 7- 4'58 '. 2ffl ?f?. 172. 75 42.5fS 2. -223 31. ~?.f'i! :,2$92 1194, 253, S8. 27.833 3.282f 3
ERNEST F. FULCAM. INC.« uinam fjv I2ti
Q-22
AR30I771
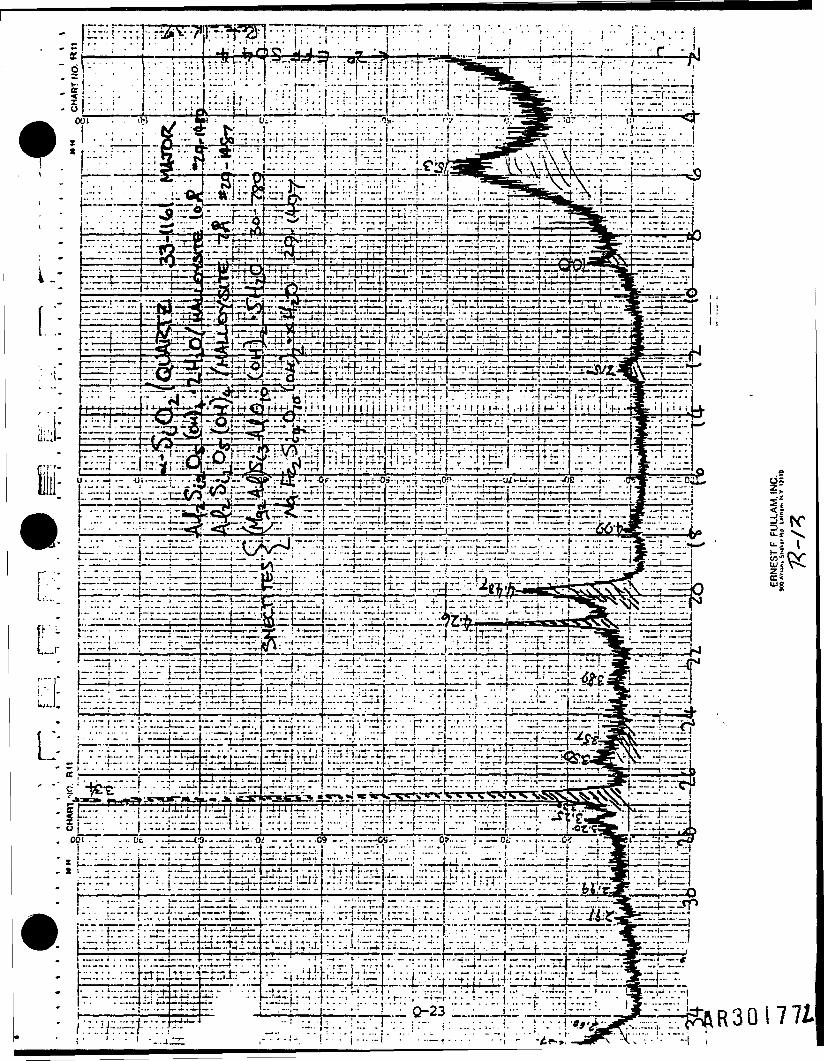
._:.-••" ..•°.'"-:t.:_..
^ • ..___• ..•_» . ..... ___.__^ . 1--V ——— • '.—•- -^-—-T- - -
U :
..-.. .. i.... j-.-ij.i 4 - j .- J . ...... - i ..... - .---I.. . , .. _ . _.; . ... • .._._._„
:"tz'(v'r.::.:-;.-c -:.. ":rr r:..:. T? ':•.::; ' r-(
.... .,._.— .——.—..-- •.:[•:--—trrtr
-: .-.: ,.. : t •;•. i.- r. .-.::'-• : '-" "—• , - • ' • . - : - . . . . . . . - . : . . . • - _ , . . . - .,--•-•-•.. '.••• i - - - - i • . »—1-.... • -i - -/e-»,:-- -
i.2:
R30l77i-I i
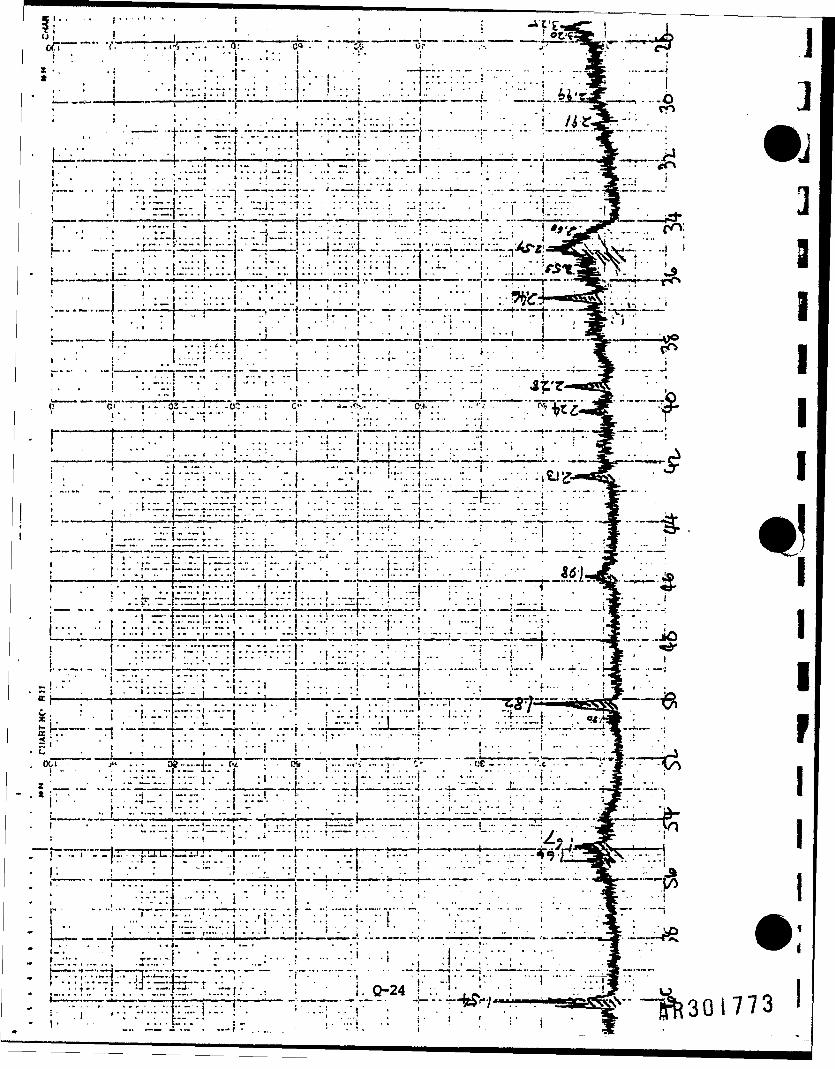
Xi" ' !'"_i______'.._______j*!3f . (. , . .;ij. ; ..- .- 0
' • • ' : • . . •, . , ,...„... ~. ., ,».}.... • •• ! i • • -1, , . , ! ...._• ._ __•_.• -4. — , — _,i/ . . . ;..:.::! :"- - .t-.-h.f-H.-:r-l.-::H
... °v
• 1 1
' ."'. ' ' "
.— .1
.... .-1 *-
r~---"i
'• • - . ? .. - . . , . - • . . -H•' i v . r - 5 ... i.:
' i '. '... ..... . . .._.
'-.-• --'-r - -.... i4-;-.-i-.-.
« i .
>W ... ......... .P . __ B. .
• : . . . " * : . . • .t
....—i
.. . , - *: i ! : i : :• :i.".r—r—-h———hrrrmr-:,:..J__.. J.ZI I . . . , - . , .
:--4--.1. • .';. '7 H-~r----l
-•••%•: - "<;?F' -
L...:.:
.5.: -1 :•_|——JJ————_j___iL_._; - __^. —^_1. — :..!::• i.;..-r:- ; - - t - .. •. . Ol,,_
..... i . | , . : . ..,
'I-...,
. _.... i « . . .. ................ .1
\ i !•*<..
. ... IT j i ~ :... . j . ,, .,—— I . '_ ..I , . . ! . . .
v.-^.,-.-•:, .-t. j.p:,:
I- • ;.;.:*.-..t—~-T H-I^mrjrT=«=mT
T_L_L_.-_!—:__. -.. __- ... .-.i ..... y a. . ..^••'.I :- ! I •' '
. _ i . . , .•-, : -I' :. :. ;
J
]I1I
L— ---i ^^I"! j ;.•.;•.- -." •..:::•.: j ;..; •.• . « • . • ; • . '• .; .:.. : . . - . , - ..-.-*: j^> ^| ibr-rr . ••'..•.-'- .-;——".""""[.v7-—•:-;:~---l-" W<
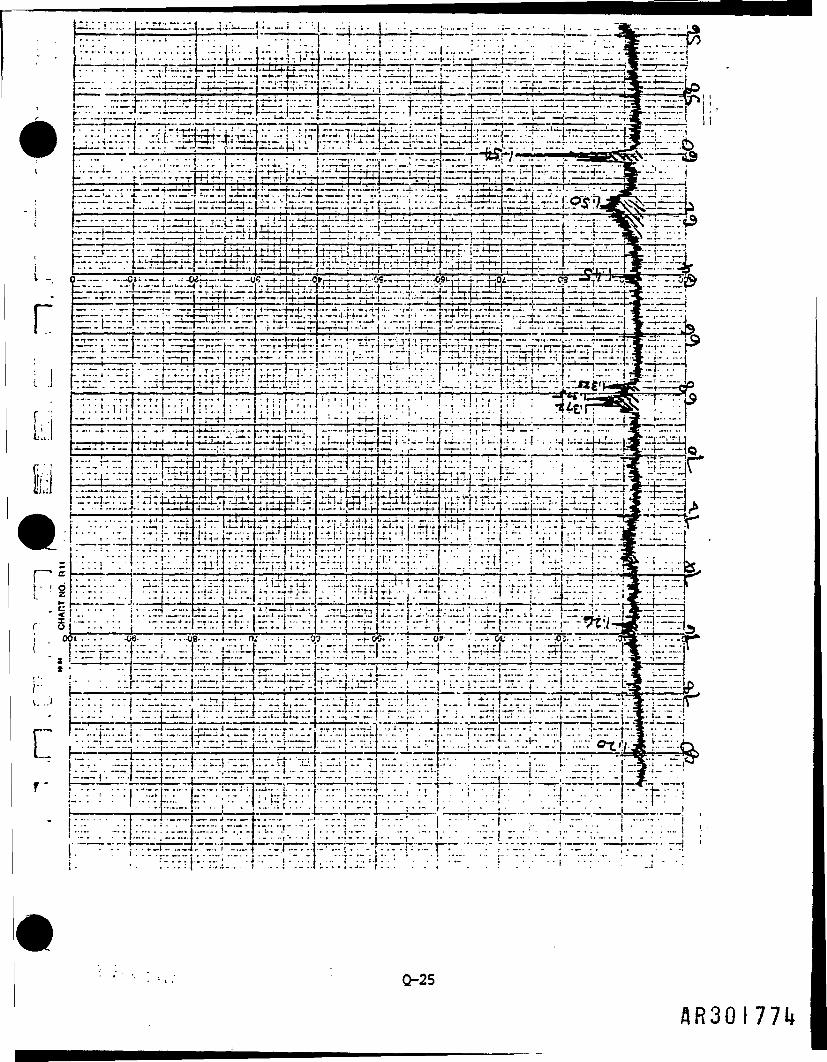
Q-25
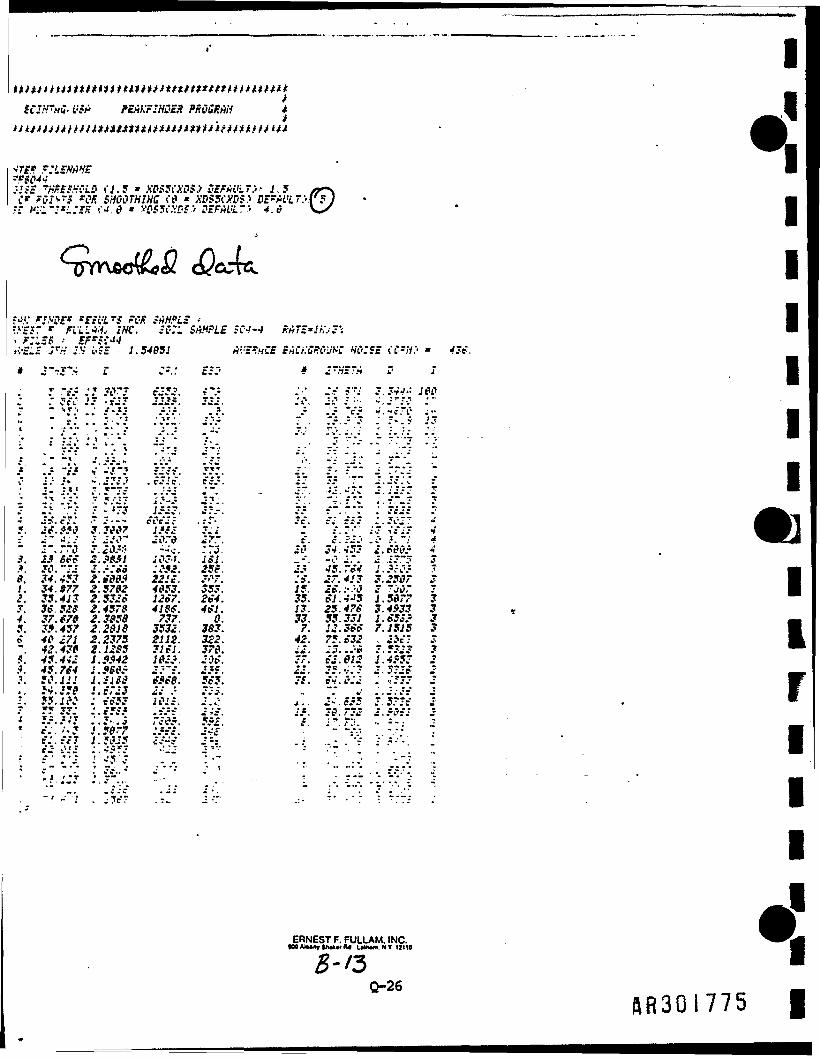
tFEMF-HDEH PittttM *
SH'dbTHIHG* <j* XD xW DE hr i'S,
*imT$LLW, INC. .s.":: SMPLE SC4-4-JfH :V i-lf 1.54051>."".•; r ;r.
565.55.1W»« TT 'iv.ro?t •» •*eV'.rV?'.-. <•'"C " * T
1 J I "T
Tit? .
.e. jo .- - v,-:•.-•.•.; .'.- "c.s -'.-c~«.-
cVcJ.-5, Jc
c. : JJ . C' •?. ~.;
jf 2$.fgff 2.?S?1 193't. 181. _-'. -0 _.".' J..:~~5. . _._. _ _.v 7 y jiv
34.977 2.5762_ 4853. 353. 15 26.:-'-335.413 2.5326 1267. 264. 35. 61.4 5 1.5877 336,528 2.4578 418f. 4fl. 13. 25.476 3.4933 337.678 2.3859 737. 0. 33. 55.331 l.fSS* 339.457 2.2818 5532. 383. 7. 12.3ff 7.1515 340271 2.2375 21 IS. 3£2. 42. 75.632 . He"42.436 2.1285 3161. 378. ii. 25..si45.442 1.9942 162?. 2-36. ". £2.61245.764 1.968? J-'V. 2?S.
39. 732
.4?~5'-T~-B
ERNEST F. FULLAM. INC.W9 AIW«r SliMW M LMMn. NT IIIIO
IJIIIII•JIIriiij
B- /3Q-26
flfi30!775
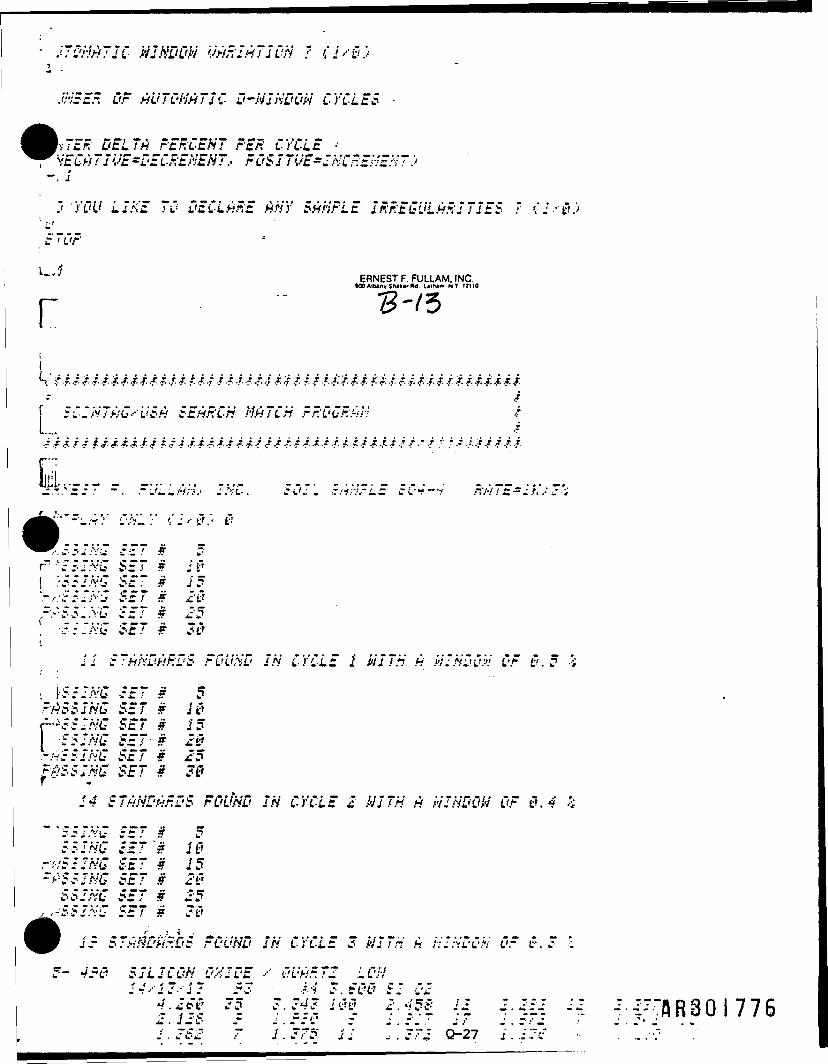
JHE-ER Or AUTOMATIC D-tilHDOti CYCLES •
v~En DELTA PERCENT FES CYCLE •vEGATIvE-DECREHENT.' POSI TvE=INCF.EHEHT)
." 'YOU LIKE TO DECLARE ANY SAMPLE IRREGULARITIES ?
if ~OP
i.// ERNEST F. FULLAM. INC.MO AIMnr Sni..r »«.. Lll»li» NT. 12110r
, ' f .£ j. 'j. .t. f. f. x. f .?..*.?. ,j. .f. / .?. .; .r. .f .t. .-; ,f. .;. j. j j. ?. ? i. .i. /. .?: .f. r. i: / f. j. j. .f. j. / ?. .i .f. / . /. f
5C~x~KG<-'tiSH SEARCH MATCH FZOCK*;1! •?. j .j ,j. .r ./ /. .?.£*..? ./ ./. .* .r .;' /. .« .? .f. ./ .f. .f. / .> .f .?. f j. .?. . J .r f. S . f .f. J. .f > / .* > f / •- •/ '£ f f •*• •?•
-•'. u"1 JT' -i .**:'_• -T-C .' iv to*r~ • • tr 5 .".Vb SET * ft*I ':SS!.*••£ 'SET * j'5'.-.'.• 55."A;J SET ff 2'£i(.r--55I.vL7 j£"~ y _?5. --i'HG 'SET w Jt'
.. SThtiDHF.L'S FOUfiD IH CYCLE 1 tilT.H A tiI.?J50v OF $.5 -r;
: \'S-IfvG SET # 5FASSIriG SET * 1&Sil&G SET 9 15SSIHG SET- ff 2$
.-t'-iSSI&G SET F J'5?&SSIHg SET & 30
*4 STANDARDS FOUND J'ri CYCLE _• .<VJ".V w ti!tiBOti OF $.4 'i~ ':?J.Vu SET # 5
S--1HG SET '? JiT'.->/5/JA;(7 SET i 15~S$SJti£ SET ff 20SSJtit SET ff 25IVZ SET £ J"
l.z STANDARDS FOUND IN CYCLE J MI7H A i'/I.'DOti OF O.Z 1
5- 4J?& SILICON OXIDE •••' &UART2 LOH
, . 7~J Q-27
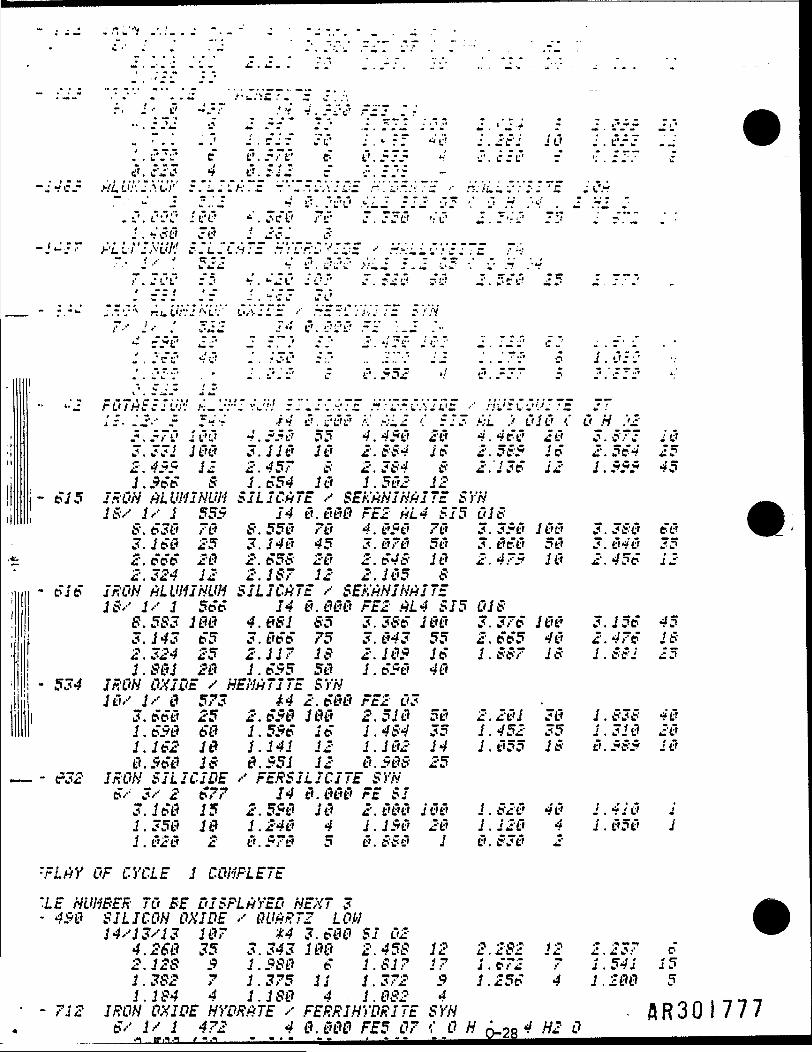
- :„•_• .• .• • . .._ .»• u :•;£ .• . - „-..•-.r. .'' f." ~57 .'« V. .-iv r_'~ ." r
•-.£-'..: •£ .:. .-r _ .-.• ..".fJJ j':"'? J.-'Jf' ." 2.855 JL"- "._!_ . ? J', rJjf 'SO :.-:5 *'c! 1.282 10 1. t'.-J __'vC'v.! c" C'••_'"*.! t7 8.575 T' -.".if ft1 r '"._T.r c
~14c5 ALL'r.'IXi'i' :."LI'IA~E -"''-.-.OXIDE r'.'D.-.:::~z ••• H:'iLLO':'SIrE IC'A• ' * • ' — C,. *? i* . 'L''L' *.'•'• - "." *~ ~ •' *" — '•».' " •* •
t . . . •. j ... • »m . *? C^ C' ^ C J *I C' . C*'
— f t, f ^.— r . ^""V ... ..— .__ . ... .y
-'.i/.T-r . • J.^Ji1 c 0.552 •/ i?.^~~ 5• c : ; .' -..*.__.• *t
'•'J POTASSIL'!'' . _ I-'.--'." vV.'V :-iI~s::TE HYDFOXIDE •••' HU^CO^ITE JTIS-•--?•" -; J 'T' •*« 8.088 K AL2 <' 5JJ >;L .> c"J(? '," c? . .''_••
5.570 100 4.558 55 4.458 28 4.468 28 3.873 183.331 188 3.118 18 2.884 16 2.585 16 2.564 252.455 12 2.457 8 2.384 8 2.'136 12 1.555 451.566 8 1.654 18 1.582 12
- 615 IRON ALUMINUM SILICATE / SEKANINAITE SYNIS/ 1/1 555 14 8.888 FE2 AL4 SI5 018
8.638 78 8.558 78 4.858 78 3.358 180 3.388 603.168 25 3.148 45 3.878 58 3.868 58 3.848 352.666 28 2.658 28 2.648 18 2.475 18 2.456 122.324 12 2.187 12 2.185 8
- 616 IRON ALUMINUM SILICATE / SEKANINAITE18/ I/ 1 566 14 8.888 FE2 AL4 815 018
8.583 188 4.881 85 3.386 188 3.376 188 3.156 453.143 65 3.866 75 3.843 55 2.665 48 2.476 182.324 25 2.117 18 2.185 16 1.887 18 1. 8S2 251.881 28 1.655 58 1.658 48
- 534 IRON OXIDE / HEMATITE SYN18/ 1/8 573 4-4 2.688 FE2 03
3.668 25 2.658 188 2.518 58 2.281 38 1.838 481.658 68 1.556 16 1.484 35 1.452 35 1.318 281.162 18 1.141 12 1.182 14 1.855 18 8.585 188.568 18 8.551 12 8.588 25
- 6-32 IRON SILICIDE / FERSILICITE SYN*'•• 3/ 2 677 14 8.888 FE SI
3.168 .5 2.558 18 2.888 188 1.828 48 1.418 11.358 18 1.248 4 •/•{5tJ 2& {.128 4 1.858 11.828 2 8.578 5 8.888 1 8.838 2
:FLAY OF CYCLE 1 COMPLETE'LE NUMBER TO BE DISPLAYED NEXT 3- 458 SILICON OXIDE / QUART? LOH
14/13/13 187 *4 3.688 SI 024.268 35 3.343 188 2.458 12 2.282 12 2.237 o2.128 5 1.588 6 1.817 17 1.672 7 1.541 151.382 7 1.375 11 1.372 5 1.256 4 1.288 51.184 4 1.188 4 1.882 4 n n . _ __
- 712 IRON OXIDE HYDRATE / FERRIHYDRITE SYN . flR30 1 7776/ I/ 1 472 4 8.888 FE5 07 ',' 0 H A_,B 4 H2 0
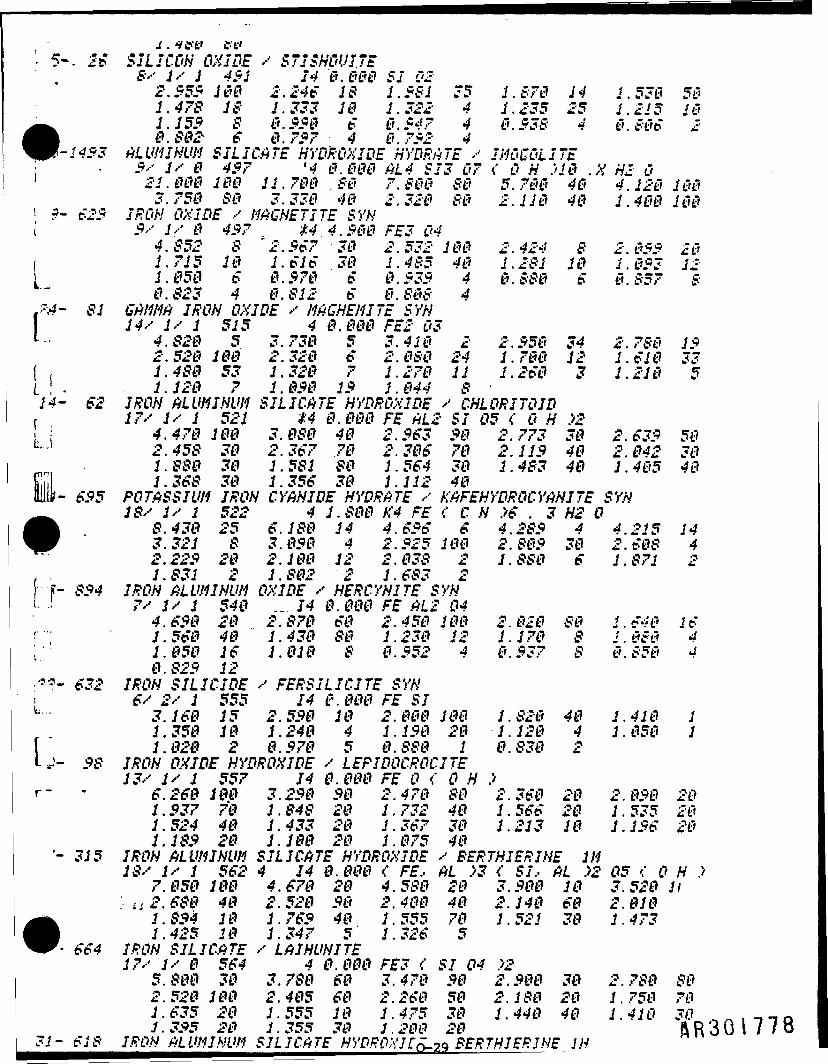
-.tffv fff5-, 2* SILICON OXIDE / S7ISHOVI7E
$/ I/ 1 451 14 8.888 SI 022.555 188 2.246 18 1.581 75 1.878 14 1.538 581.478 18 1.333 18 1.322 4 1.235 25 1.215 181.155 8 8.558 6 8.547 4 8.538 4 8 886 28.882 6 8.757 4 8.752 4
-1453 ALUMINUM SILICATE HYDROXIDE HYDRATE / IMOGOLITE5/ I/ 8 457 '4 8.888 AL4 SI3 07 C 0 H .''18 .X H2 0
1 21.800 188 11.780 88 7.888 88 5.788 48 4.128 1883.758 88 3.338 48 2.328 88 2.118 48 1.488188
i ?- 625 IRON OXIDE / MAGNETITE SYNI 5/ I/ 8 457 t t4 4.588 FE3 04
4.S52 8 '2.567 38 2.532 188 2.424 8 2.855 28I 1.715 18 1.616 38 1.485 48 1.281 18 1.853 12I 1.858 6 8.578 6 8.535 4 8.888 6 8.857 8
8.823 4 8.812 6 8.888 4S-4- 81 GAMMA IRON OXIDE / MAGHEMITE SYN
14/ I/ 1 515 4 8.888 FE2 031 4.828 5 3.738 5 3.418 2 2.558 34 2.788 15
2.528 188 2.328 6 2.888 24 1.788 12 1.618 33\ , 1.488 53 1.328 7 1.278 11 1.268 3 1.218 5i ! . 1.128 7 1.858 15 1.844 S '14- 62 IRON ALUMINUM SILICATE HYDROXIDE / CHLORITOID
f 17/ 1/1 521 *4 8.888 FE AL2 SI 05 (OH 12\ 4.478 188 3.888 48 2.563 58 2.773 38 2.635 58
kj 2.458 30 2.367 78 2.386 78 2.115 48 2.842 381.880 38 1.5S1 88 1.564 38 1.483 48 1.485 481.368 38 1.356 38 1.112 48
- 655 POTASSIUM IRON CYANIDE HYDRATE / MFEHYDROCYANITE SYNIS/ 1/1 522 4 1.888 K4 FE < C H :<6 . 3 H2 0
S.438 25 6.1S0 14 4.656 6 4.285 4 4.215 143.321 8 3.858 4 2.525 188 2.885 38 2.688 42.225 28 2.188 12 2.838 2 1. 8S8 6 1.871 2
, 1.831 2 1.S82 2 1.6S3 2f IT- 894 IRON ALUMINUM OXIDE / HERCYNITE SYNi. .! 7/ 1/1 548 14 8.888 FE AL2 04
4.658 28 2.878 68 2.458 188 2.828 88 1.648 16'•"- 1.568 48 1.438 $8 1.238 12 1.178 8 1.888 4; ' 1.850 16 1.818 8 8.552 4 8.537 8 8.858 4
8.825 12'**- 632 IRON SUICIDE / FERSILICITE SYNi 6/ 2/ 1 555 14 8.888 FE SIL - 3.168 15 2.550 18 2.808 188 1.828 48 1.418 1
1.358 18 1.248 4 1.158 28 1.128 4 1.858 11.828 2 8.578 5 8.888 1 8.838 2
J- 38 IRON OXIDE HYDROXIDE / LEPIDOCROCITE13/ 1/1 557 14 8.888 FE 0 C 0 H .>
6.268 108 3.238 38 2.478 88 2.368 28 2.838 281.537 78 1.84S 28 1.732 48 1.566 28 1.535 281.524 48 1.433 28 1.367 30 1.213 18 1.156 281.1 S3 28 1.188 28 1.875 48
'- 315 IRON ALUMINUM SILICATE HYDROXIDE / BERTH IERI HE 111IS/ 1/1 562 4 14 8.880 f FE.- AL .>5 < S/, AL .>2 05 < 0 H .>
7.850 188 4.678 20 4.588 28 3.388 18 3.528 H'.• £.68.8 48 2.528 38 2.408 48 2.148 68 2.818
1.834 18 1.763 48 1.555 78 1.521 38 1.4731.425 18 1.347 5 1.326 5
664 IRON SILICATE / LAIHUNITE17/ I/ 8 564 4 0.888 FE3 ( SI 04 .>_?
5.880 38 3.788 68 3.478 38 2.388 38 2.788 882.528 188 2.485 68 2.268 58 2.188 28 1.758 781.635 28 1.555 18 1.475 38 1.448 48 1.418 30 „,-,-, 0J. 335 28 J. 355 30 J. 200 20 R R 3 0 i 7 7 8
J- 6J8 IRON ALU.MJHUH SILICATE HYDROS IC . BERTHIER1HE 1H
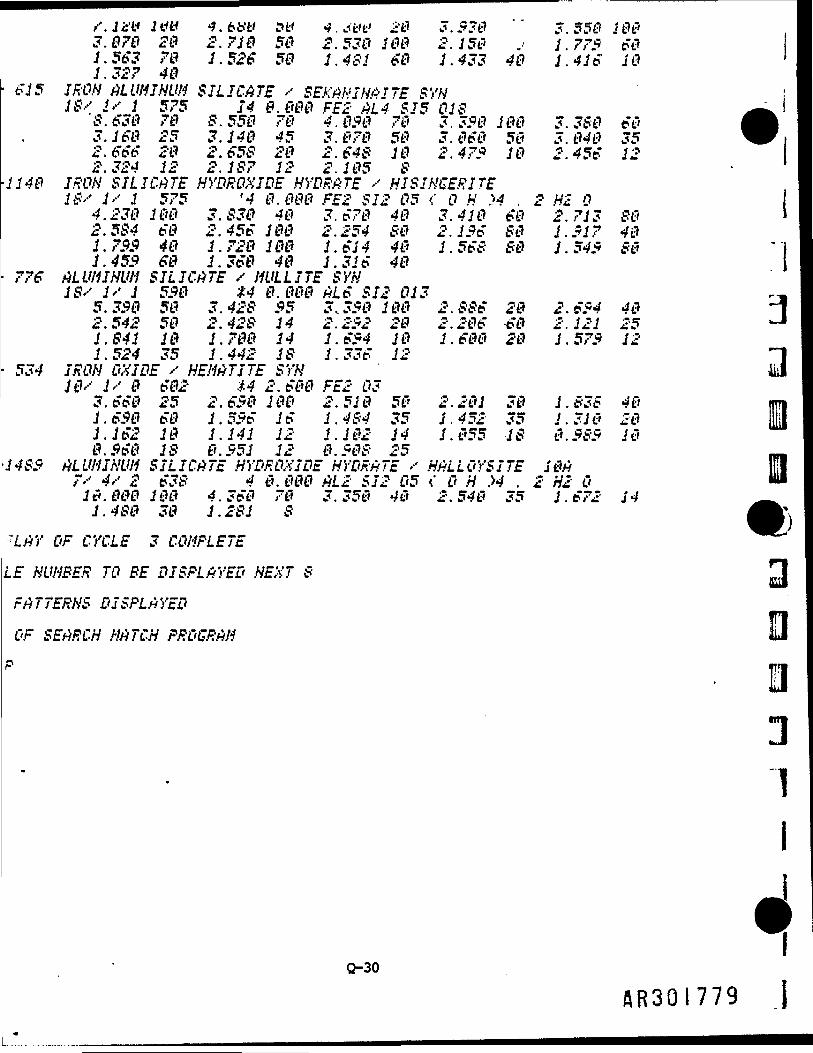
M-< 4..JW £0 3.538 " 3.558 1883.878 28 2.718 58 2.538 188 2.158 .> 1.773 681.563 78 1.526 58 1.481 68 1.433 48 1.416 181. 327 48
615 IRON ALUMINUM SILICATE / SEKAHINAI7E SYNIS/ I/ 1 575 14 0.888 FE2 AL4 SI5 01S
'8.638 78 8.558 78 4.858 78 3.338188 3.388 683.168 25 3.148 45 3.078 58 3.868 58 3.848 352.666 28 2.658 28 2.648 18 2.473 10 2.456 122.324 12 2.187 12 2.185 S
\-1148 IRON SILICATE HYDROXIDE HYDRATE / HI SINGER ITE18/ I/ 1 575 '4 8.888 FE2 SI2 05 f 0 H >4 . 2 H2 0
4.238 188 3.838 48 3.678 48 3.418 68 2.713 882.584 68 2.456 188 2.254 88 2.156 88 1.517 481.733 48 1.728 188 1.614 48 1.568 88 1.545 881.453 68 1.368 48 1.316 48
776 ALUMINUM SILICATE / MULLITE SYNIS/ 1/1 538 $4 8.888 AL6 SI2 013
5.338 58 3.428 35 3.358 188 2.886 28 2.654 482.542 58 2.428 14 2.252 28 2.286 68 2.121 251.841 18 1.788 14 1.654 18 1.688 28 1.575 121.524 35 1.442 IS 1.336 12
534 IRON OXIDE / HEMATITE SYN1&/ I/ 8 682 *4 2.688 FE2 03
3.668 25 2.658 188 2.518 58 2.281 38 1.838 481.638 68 1.556 16 1.484 35 1.452 35 1.318 281.162 18 1.141 12 1.182 14 1.855 18 8.585 188.368 18 8.551 12 8.588 25
1483 ALUMINUM SILICATE HYDROXIDE HYDRATE / HALLOYSITE 18A7/ 4/ 2 638 4 8.888 AL2 SI2 05 ( 0 H >4 . 2 H2 018.888 188 4.368 78 3.358 48 2.548 35 1.672 141.488 38 1.281 8
-LAY OF CYCLE 3 COMPLETE
If NUMBER TO BE DISPLAYED NEXT 8
PATTERNS DISPLAYED
OF SEARCH MATCH PROGRAM
IQ-30
AR3GI779 J
LL
tLCCI
Appendix R
flR30(780
APPENDIX R
SLUG TEST RESULTS
L
0985B
5R30I78I
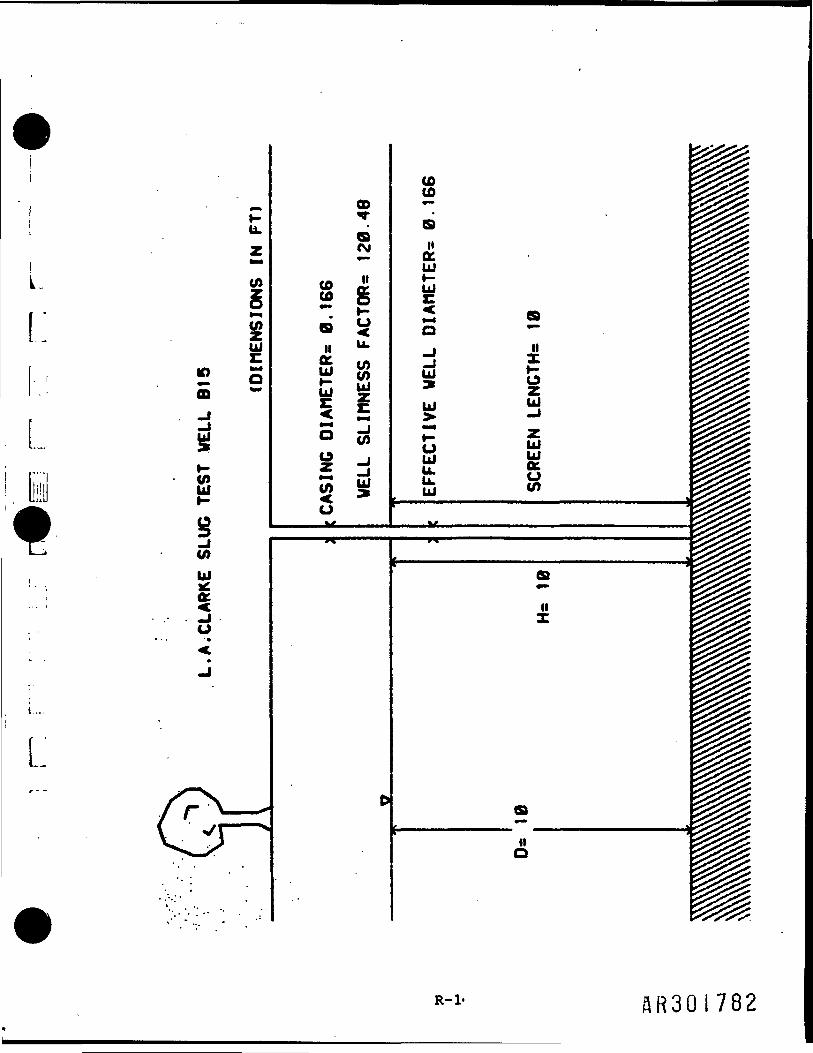
H-U.
I.I.
E 5
t
tnUJ
U)UJ
t....
L
CDT
<M
CO «JH? S^ 5II "•£ wtf CO.• UJUJ vC £
s 55 d2 ^u
f
COCO*•sIIo:UJi-LJ
O_JUJ
UJ
J—uUJu.u.
tv «
2II1-oUJ•J
UJUJcc
—————————————— J
h
anX
anQ
R-l- AR30I782
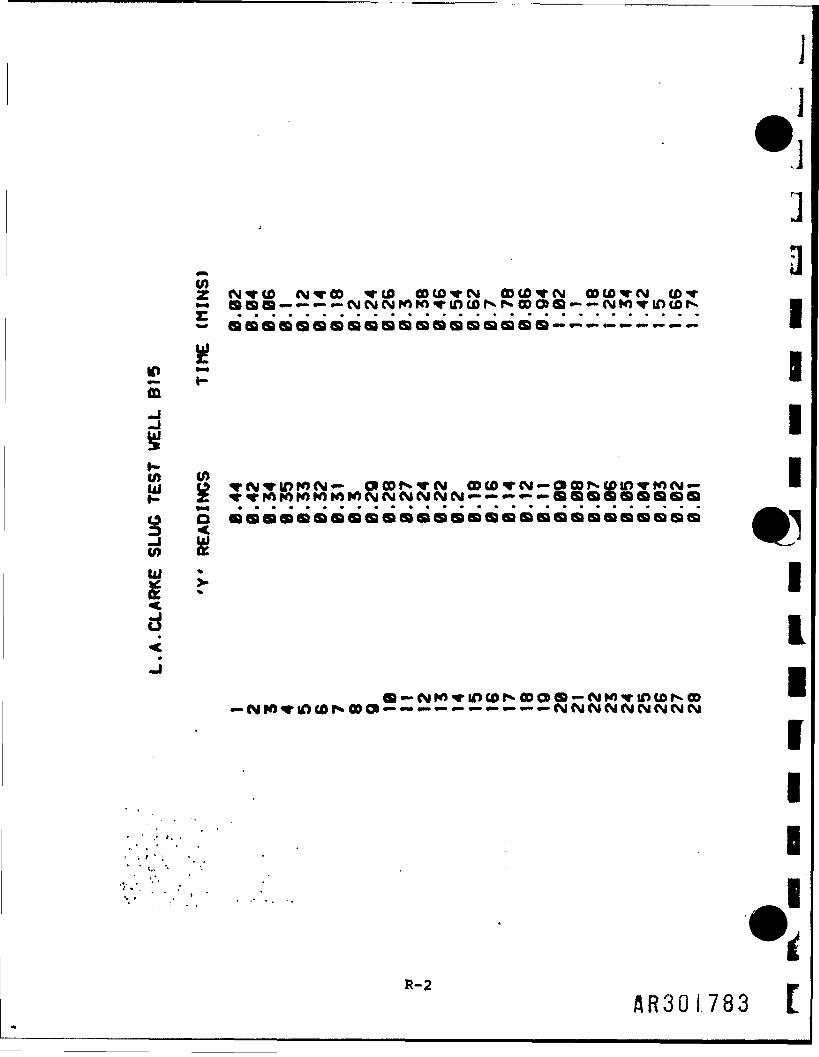
toZ <VHrtO (M^TOO Y(0 ODCO^rCM CD CO'T (VJ COtO-rtNJ CD^Tj-; ............................— aaaaaaaaasaaaaaaaaa — -- — ------------
E Pm
o aaaaaaaaaaaaaaaaaaaacaaaaasaa
u, ^%
um
<•
_J
R-2
J]!i]
i
Ito co I_j o "rtM'»i.OM<Mr'.-O»w.>-!rc>i_ODco<rcM — ojoor tpin!rK).N-- •
§to
I
I
I
I
'<
AR30I.783 [
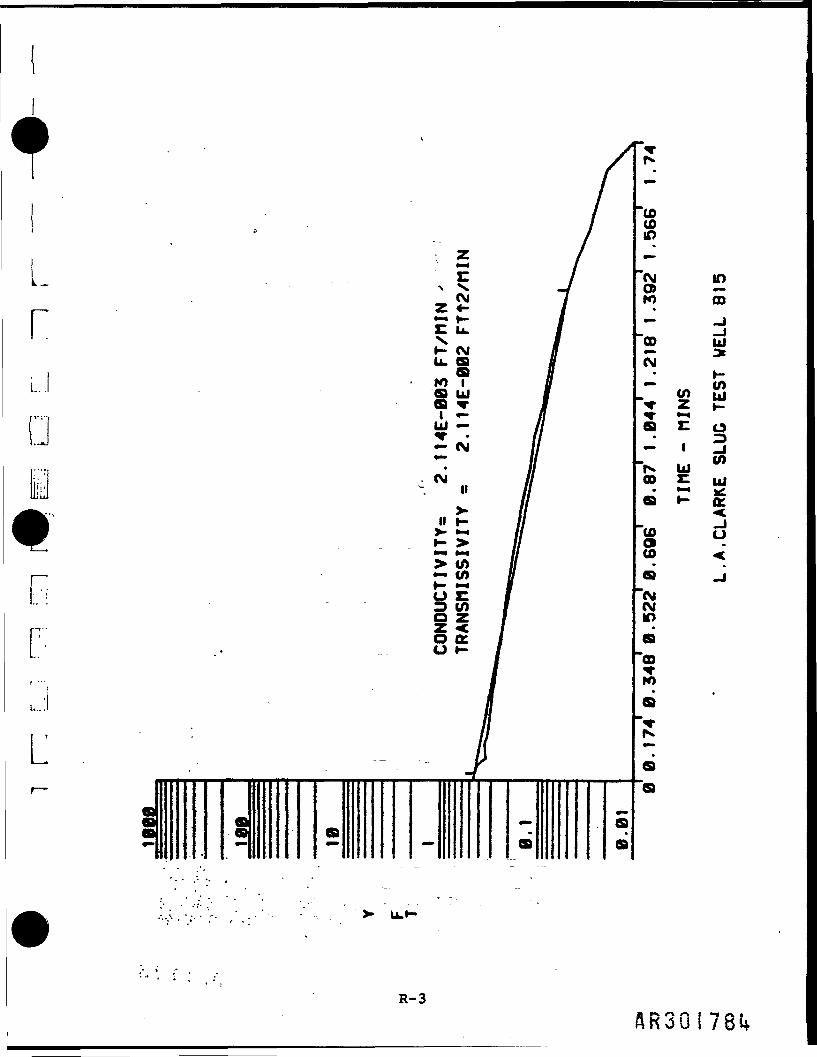
r
L.-.I
L
.s•~ a — *
~a
aa
a
(OtoIf)
M ino> —tO CD
"OD Ul
a ic o- - 3X ui w05 E uj. «-. ._,;a »- a
co
"M(Mto
o-rK)
»
a'-ris.
a
R-3
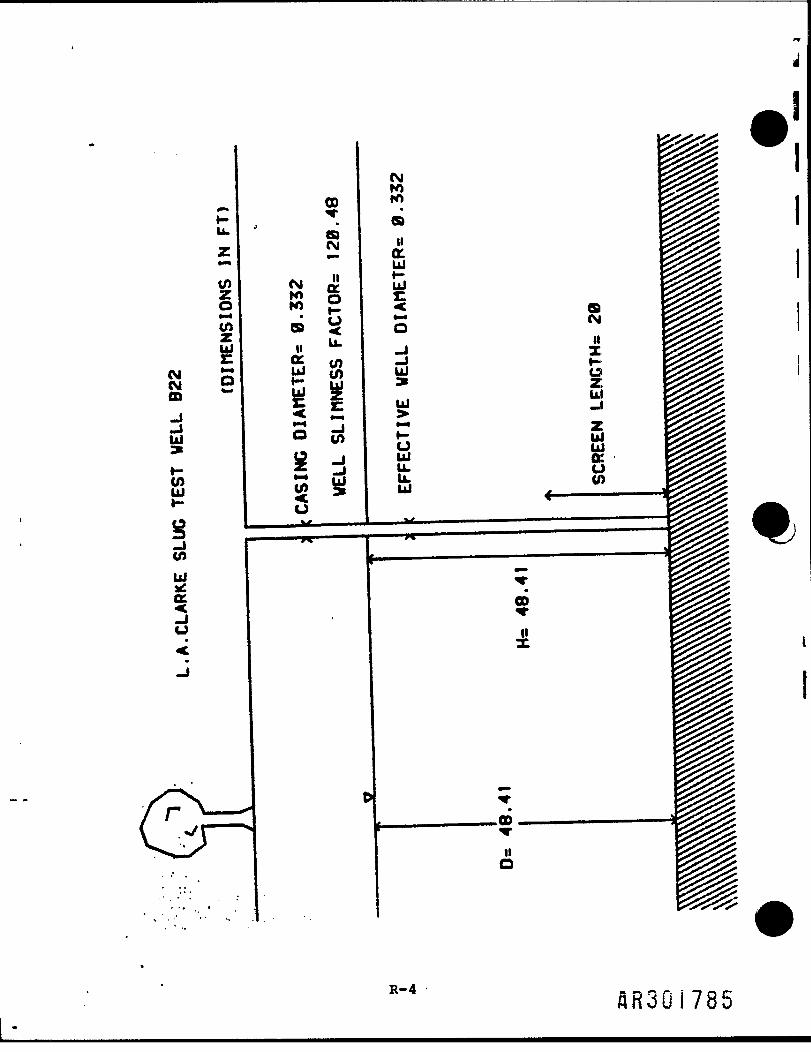
CMCMffi
£u.Z
j
*•*
SO•"•1toz
MK»H)*
aUJ II11 CC»-l 111o I-:
00r«a(SI— »
IIcto1-uu.totoUl
(SJfr f*rnroaIIctUlUJ
*_•0-JUJ
aMII
R"4 AR30I785
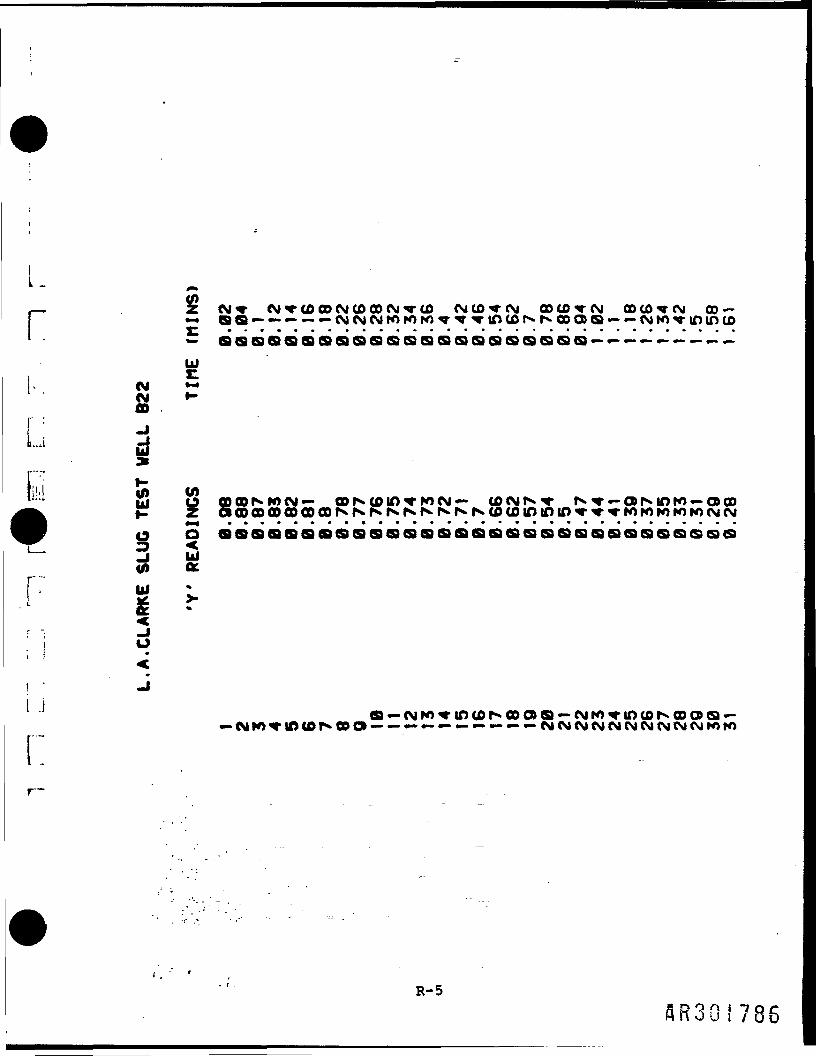
iL _
r
C
CM* CM <r co oo (Si co oo csi -r to (sito^rcg co co -r <si ooto^tst co
«. aaaaaaaaaaaaaaasassaaaUJ
CM *-•CM »-«D
u> toui o CD oo r» w (si — oo f^ co in K) CM — cocMt^^r rv-r — co r» in K) c» co»- z3i* S
d aaaaaaaaaaaaaaaaaaaaaaaaaaastsss
>•
o
Ja —rsiK)-rur>toi^coc»Q —CMCMfM(SI(MCMCMCM(Sl<SJN)ro
R-5
3R30!786
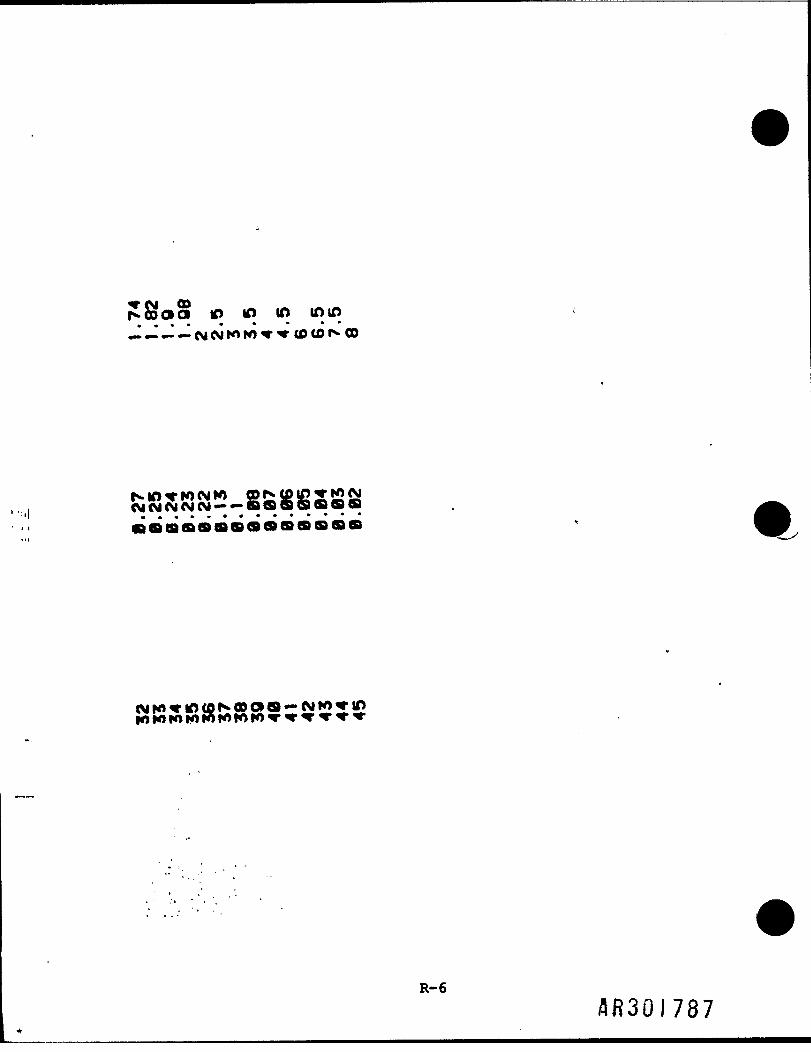
oaoioi ID to 10 in in
f". m-r w CM K> co r^ to in T w <MCMCMCMCMCM — —aaaaaaa
AR30I787
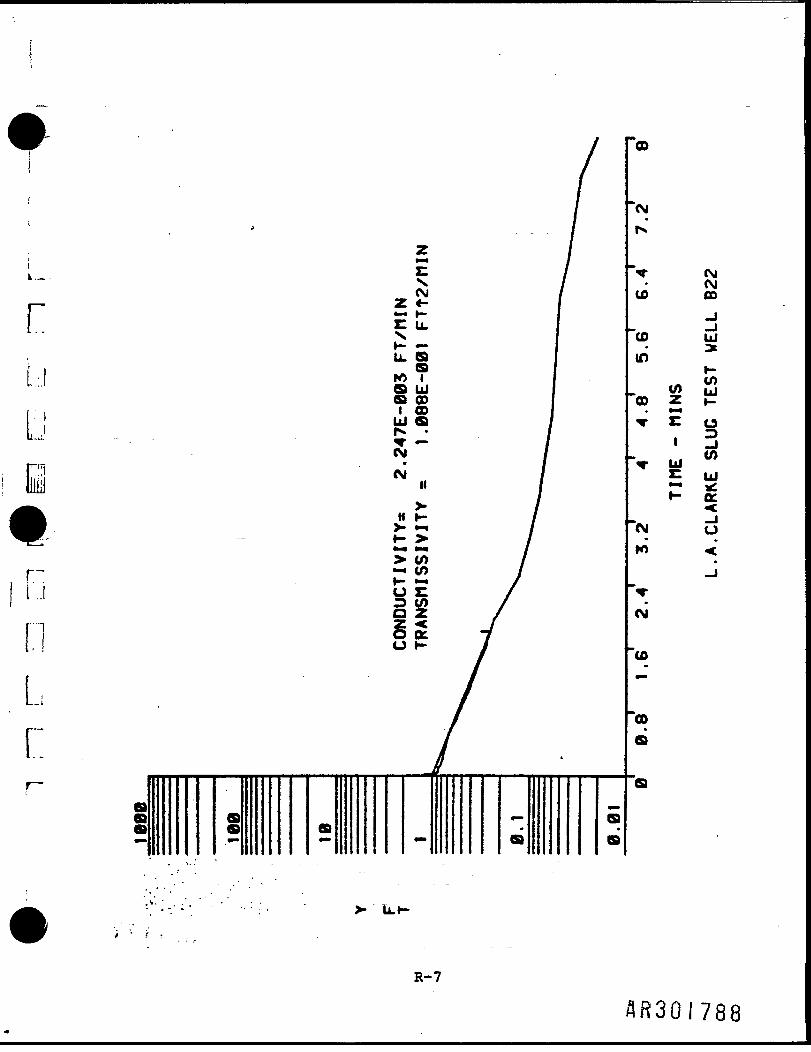
rLl
nL
R-7
AR30I788
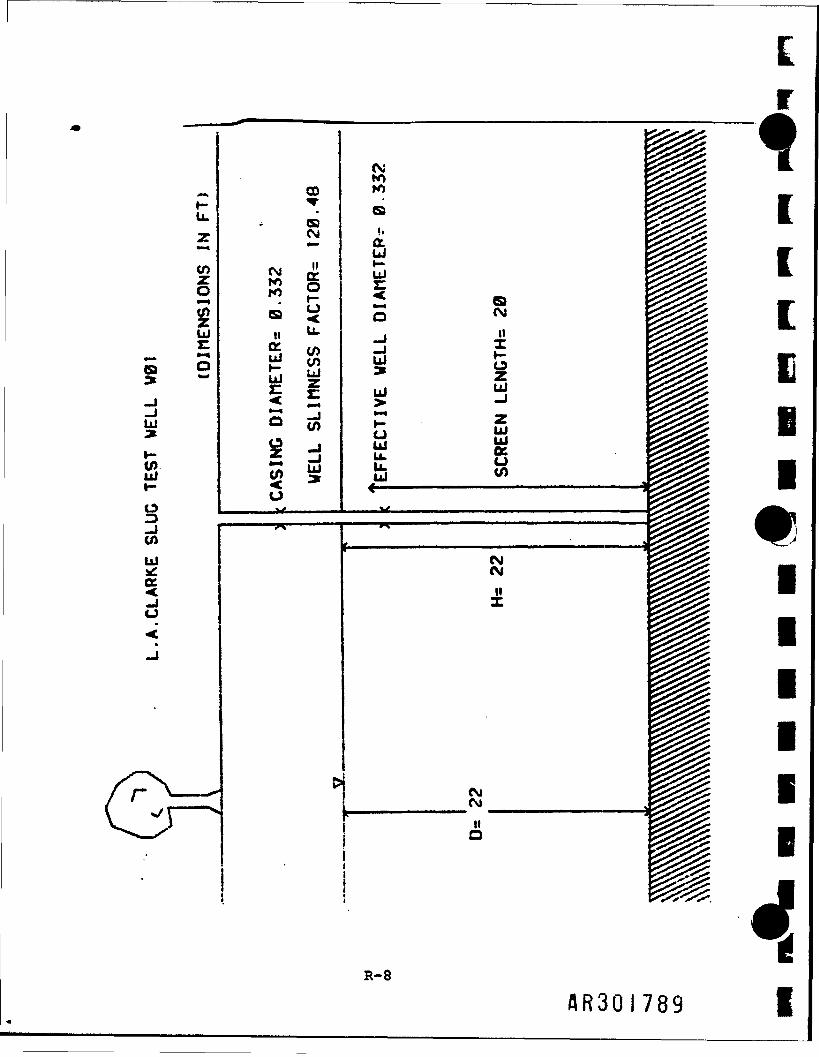
§
atoUl
essCO
a
an*
tos
_,.dtoi_
eg»
CMCM
CSI
t
4cLGe
ii
R-8
AR30I789
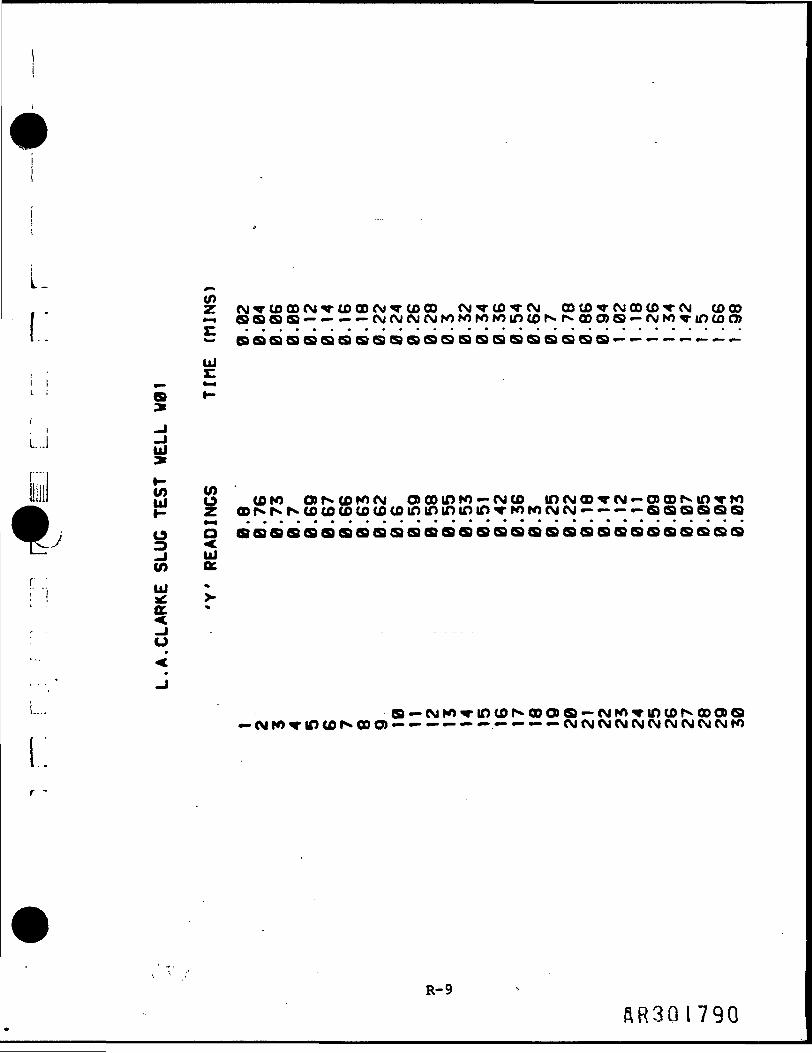
1.1
(rOZ CM <V CO 00 (SI T CO CO (Si T tO CD CSI-r(O-r(Sl GO (O V (SI CO CD T (SI ODCO_ Q S S CO •-— — — C\J fVI CSI CSI hO K) hO K) UT) CO r*« ( CO O) S — (NJ K)-r If) CO C7)— eaeaeacaseaseos ea e.sQeasGJSGasQQS —— — — — — — —UJ
u) Q coro OJt^coKxsi o> oo in w — CM to in CM co r CM — o» oo r* in -r ro
o o aaaaaaaaaaaaaaaaaaaaaaaaaaascaaJ D *to o.
oc._Ju
L(SICMfMCMfMCMCMCMCSICMK)
R-9
ftR3QI790
(O»
(SIM
CM —aa* •aa
—CMHI 10
R-10AR30I79I
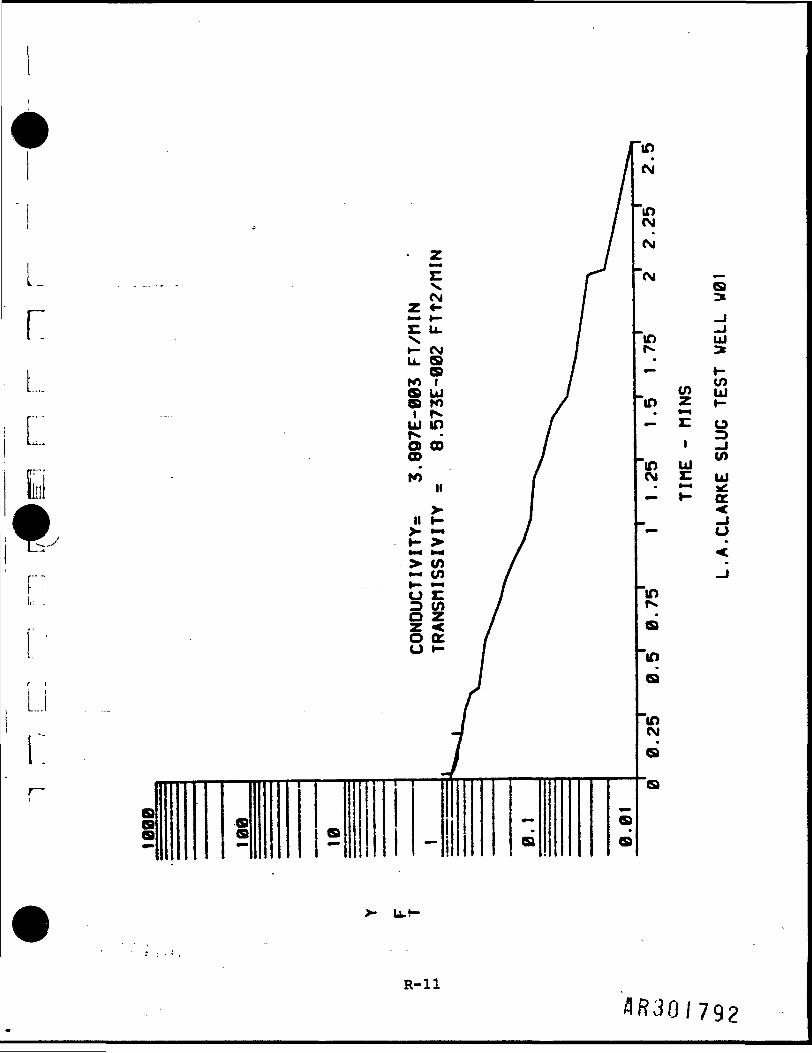
I
• zL . . . . ..... . 5
(SIr c u.Vt— (SIu. a
\ ro?!••••• S Uja K)IN , __uj in / -- z_ oEIIIt
N00
ro HII t->• **y t- >».— <-«> COi-< CO
U EO= go ccO »-
LI
aaa aa a
-I/a
aa
aa
ui*or
R-ll
^301792
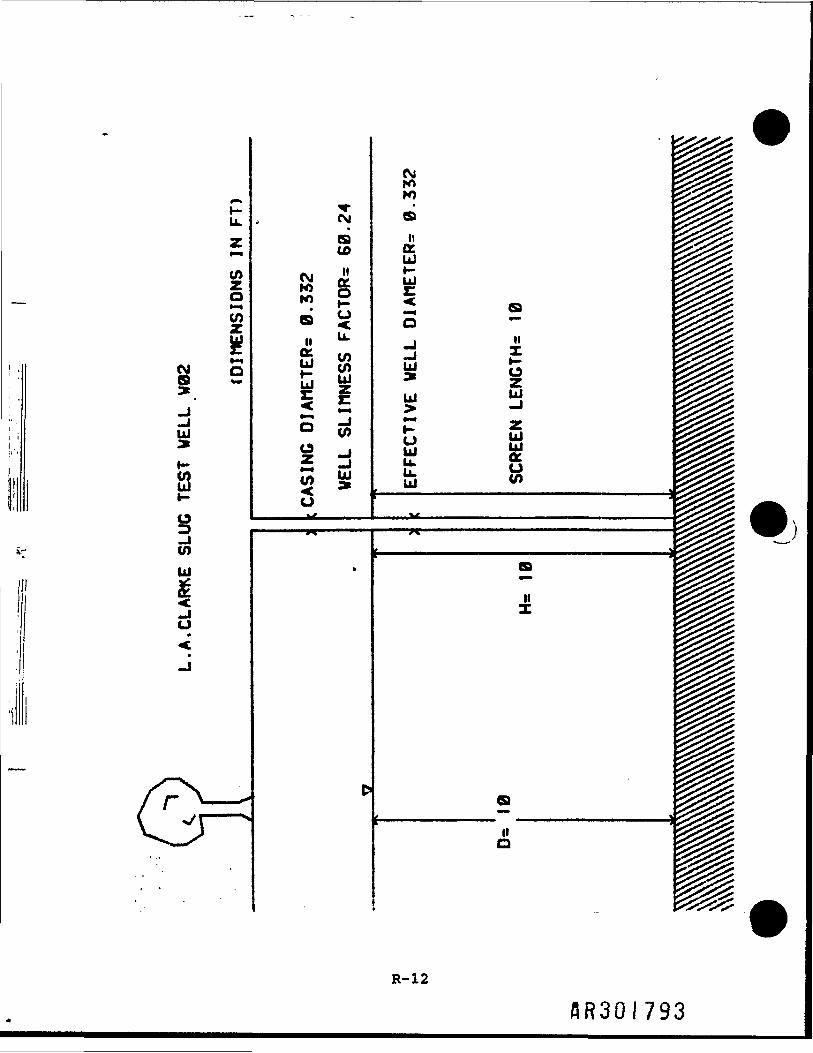
ot—•to
CM
COUJ
toUJccd
(SIato
CMK)K)
nccUJ
to
uu.totoui
to
Ul
an
-j *
(SJK)anccUJH-Ul
UJ
IIXo— z
ui wr zo «-Ju £.... uto
Ito
R-12
AR30I793
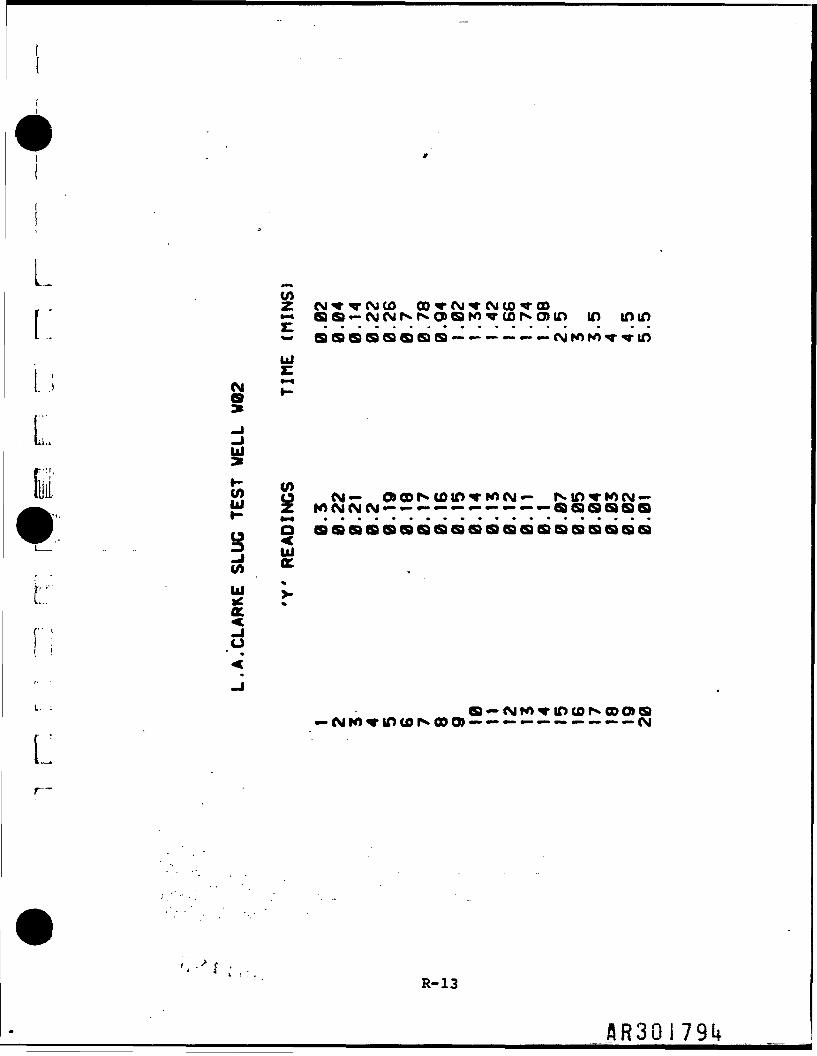
LL:
L
toZ CM^-TCMIO CO -T (M T (SI (O - COM aa — CM CM N r*» o> a w-r cor^o>in in in in»- aaaaaasa—— — —• — — (si K> K> r m
Lf::i'Illli co .% (si-CRCDrvi_)in«rK>(si— rN-in-rKicM-{_? z rocMCMcsi — — — — — — — «-• — — aaaaaa
a aaaaaaaaaaaaaaaaaaaa
u
a — CM K) *• in to r* co o> a—— — — — — — — — —CM
R-13
AR30I791*
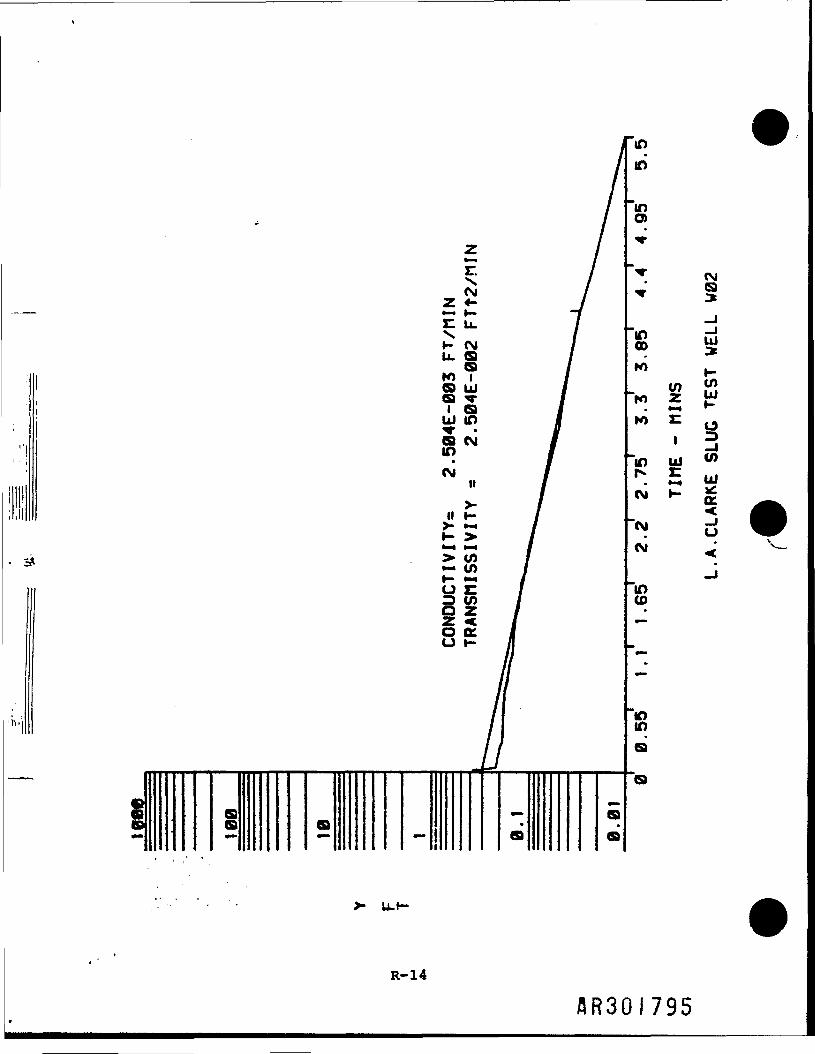
aa a ~~
•=•
-a
aa
a
ega
ui.*
toUJ
u-JtoUJor<_iu<
>- U-H-
R-14
AR30I795
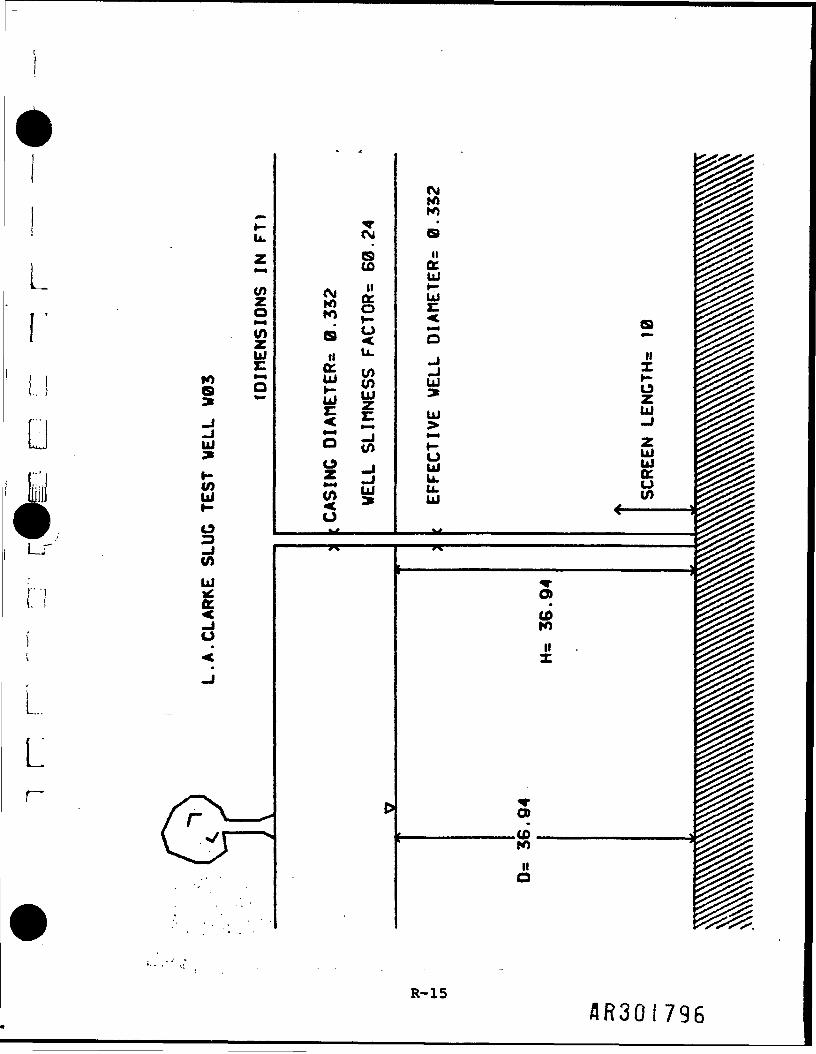
Lr
tootoUl
S o
UJ
toUJ
otoUJ
LL
(SiK)
anccUJI—UJ
0otou
-rCSJ
stoIIcco1—uu.totoUlz
to_l_JUJ
CMW>K)aC-UJUJ
0
UJ9Ul
uUlu.u.UJ
aitJEUl«JUJUJoruto
t \
f —————
oCOron
OJ•
ro 5nO
AR30I796
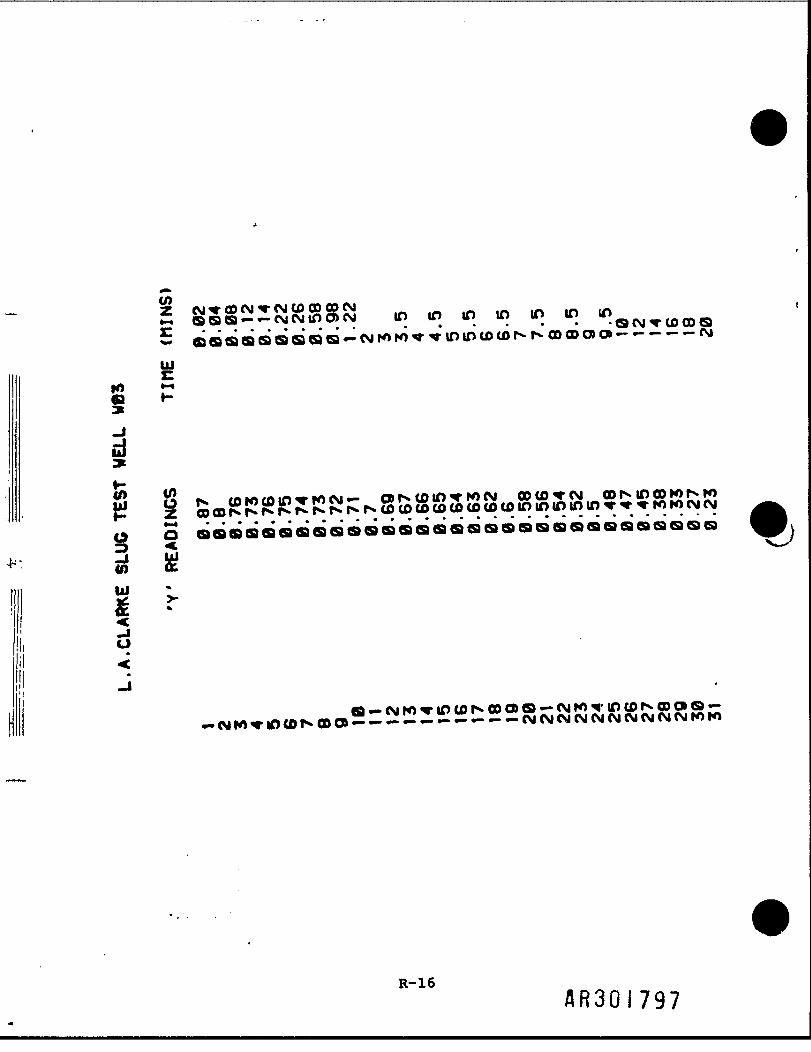
toZ CM «e 00 (M <«• (SI CO CD 00 (SI«-• cass — — cg(siino>CM in tn tn in in in inE .......... . . . . . . -aCMTtOCDG.*- aaaaaaaas —CMi^w^^inintotor^r^a>coo>a> —— — — — eg
§_l
ul y f* towcoto^-focM— o» r^ co tn T ro CM ooto^rcMf- z -50orv^N.^r.NN.s.r>.u)cocotoc^cococoiniototnio 'r*S
siUJI *u, ^
o
a — cMK)^riocoi*».ooc.Da ——— — — — — — — — —CMCMCMCMCMCMCMCMCMCMtOrO
R-16AR30I797
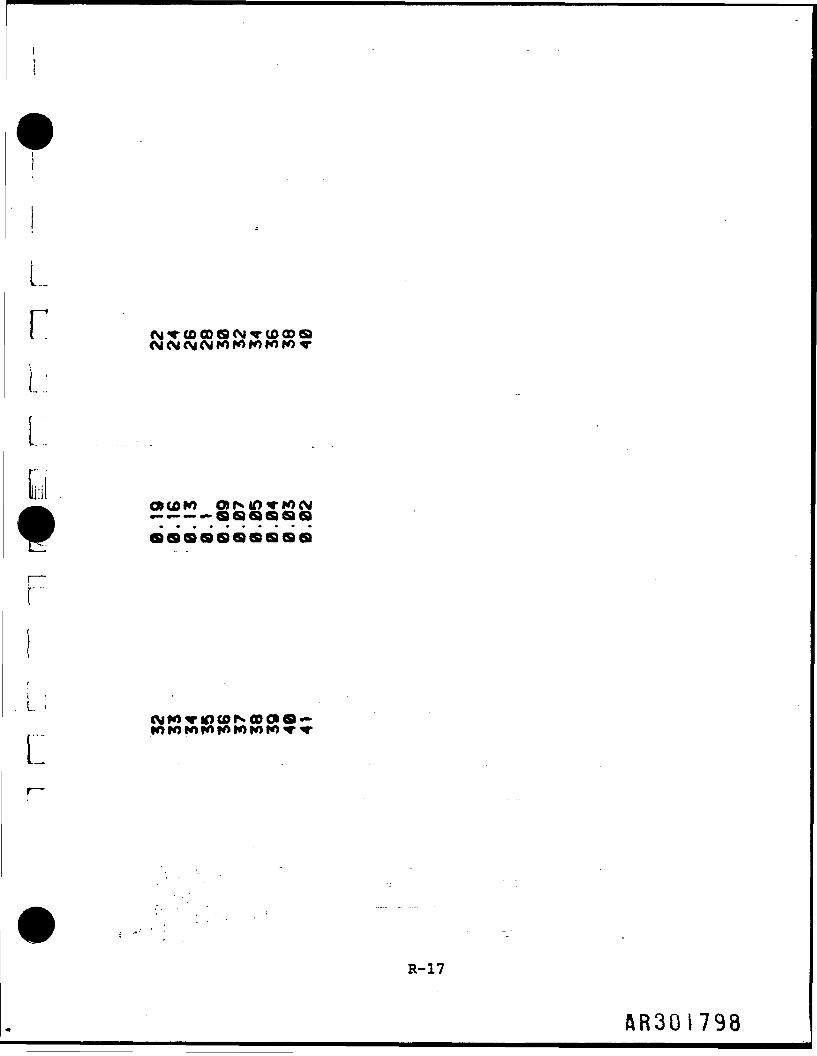
Lr (Si<rtoco8(Si<rtocDa
CMCMCMCMK>K»H)»OfO-r
r
tocoto o> r>. in-r K, CM.» _ _ s ea a s>a eaaaaaaaaaaa
L. i..... IO K) fOl*O >O IO M K)
R-17
AR30I798
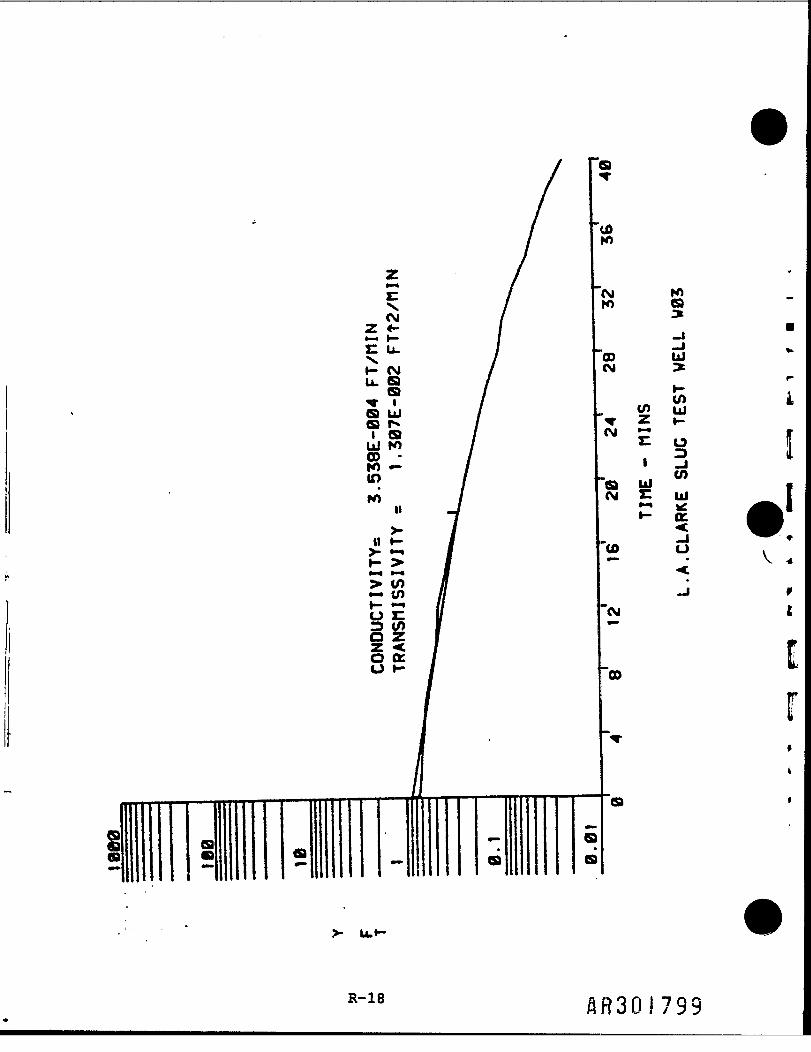
a
ui
toto ui-r z >-CM r
'CM
"00
aa•M»
a ^•a
aa
. 3•a ui(si r:
to o i— • V ^
Er
R-18 AR30I799
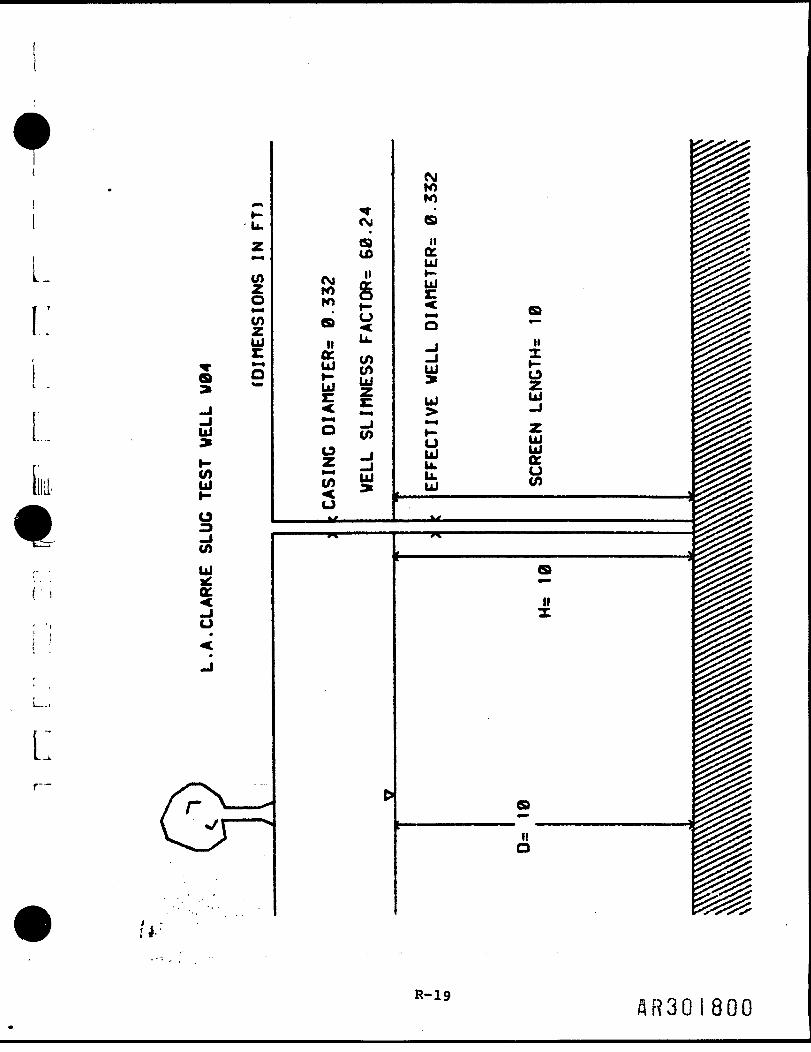
(MH)
u. <M ca
LztootoUl
UJ
toUJ" oo
(SIroanocUJ
toII
uu.toto
UJ g
tooo5 -jCO Ul
toUJklo:
ccUl
Ul
Ul
a
XI—oUJ "
oUJu.u.UJ
UJ
IIX
IIo
AR30I800
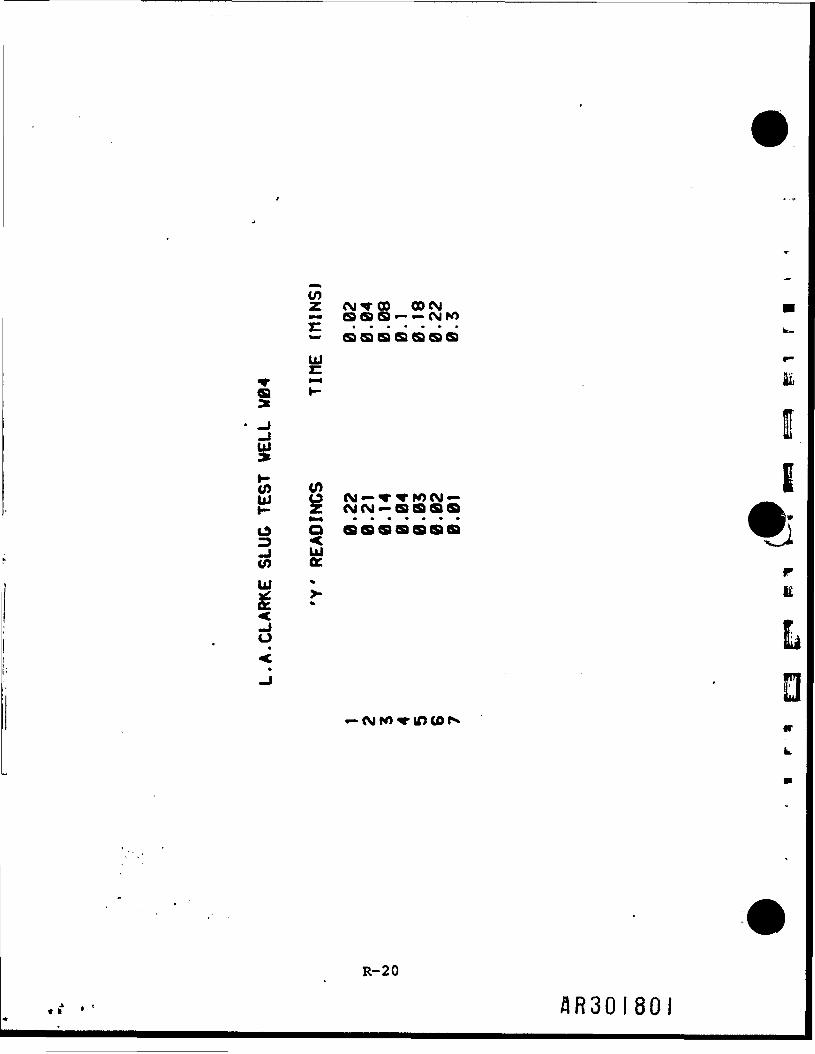
o
toZ (SI -CO CO
yj
to toUJ O CM —^•^•fOCM —t- z CMCM — aaaao o aaaaaaa3 2to oc
— CM fo -r to to rs-
II
_,
R-20
AR30I80I
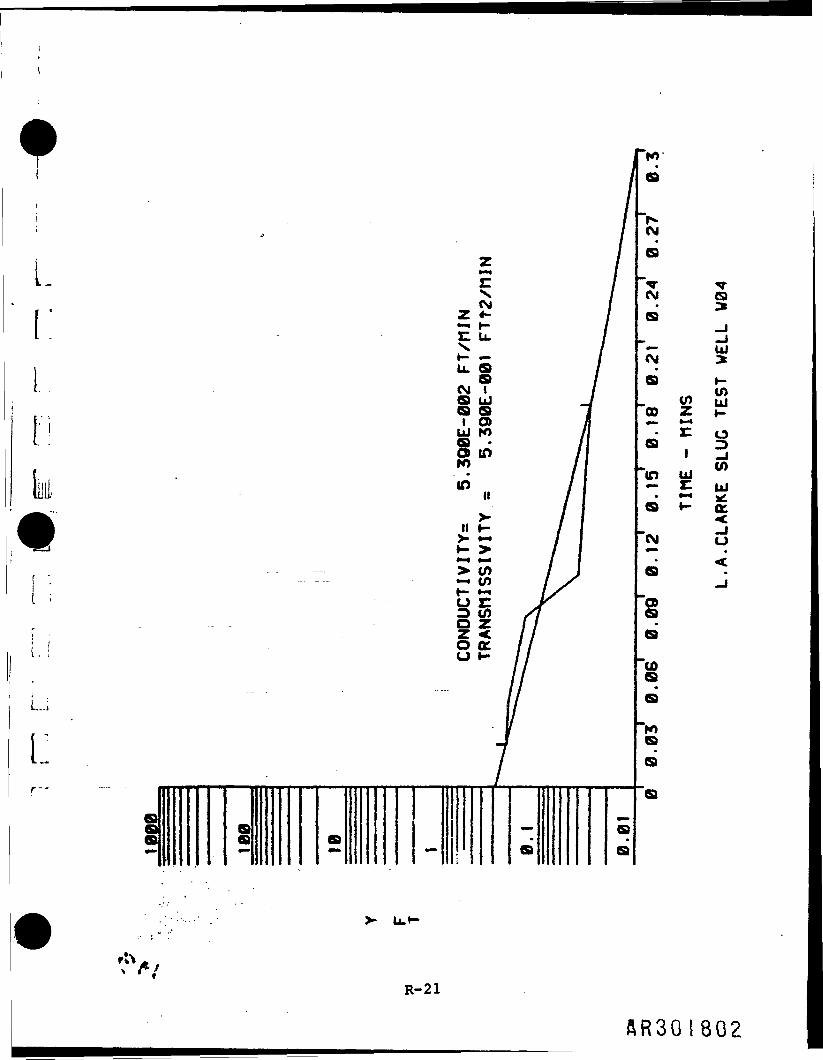
1
i:aa a •— i
.aa•
C3
Ul
COUl
O
toUJXLac
>- Lu»-
R-21
AR30I802
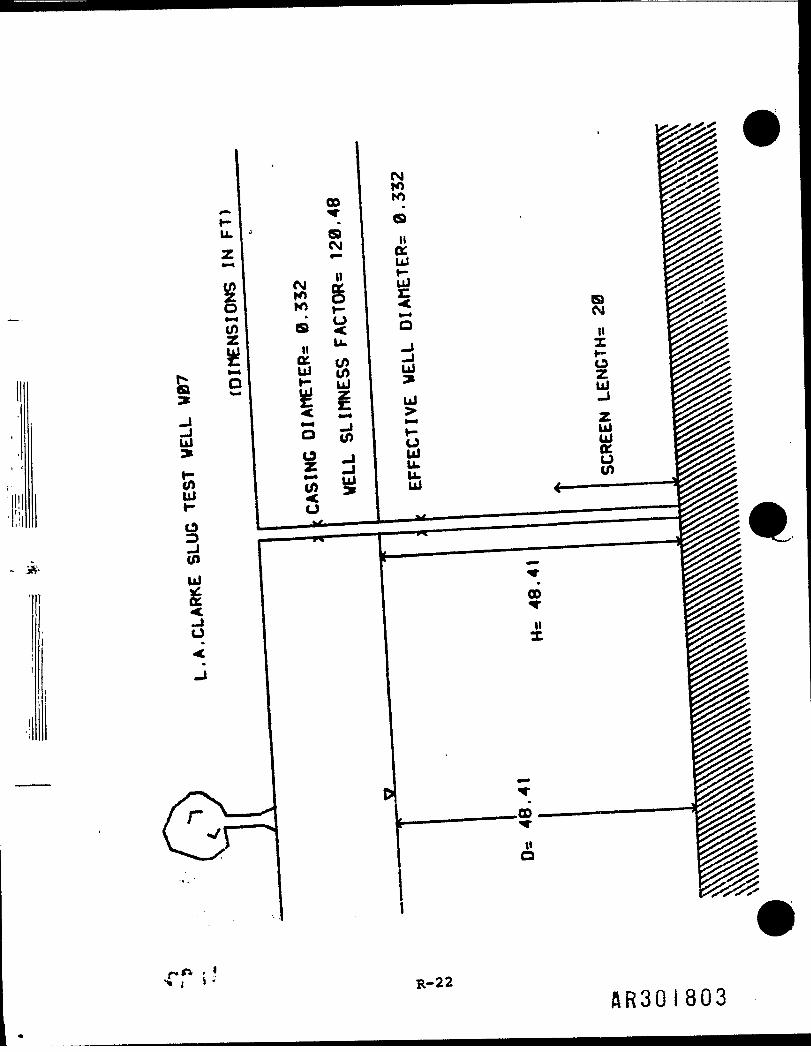
- j*.
AR30I803
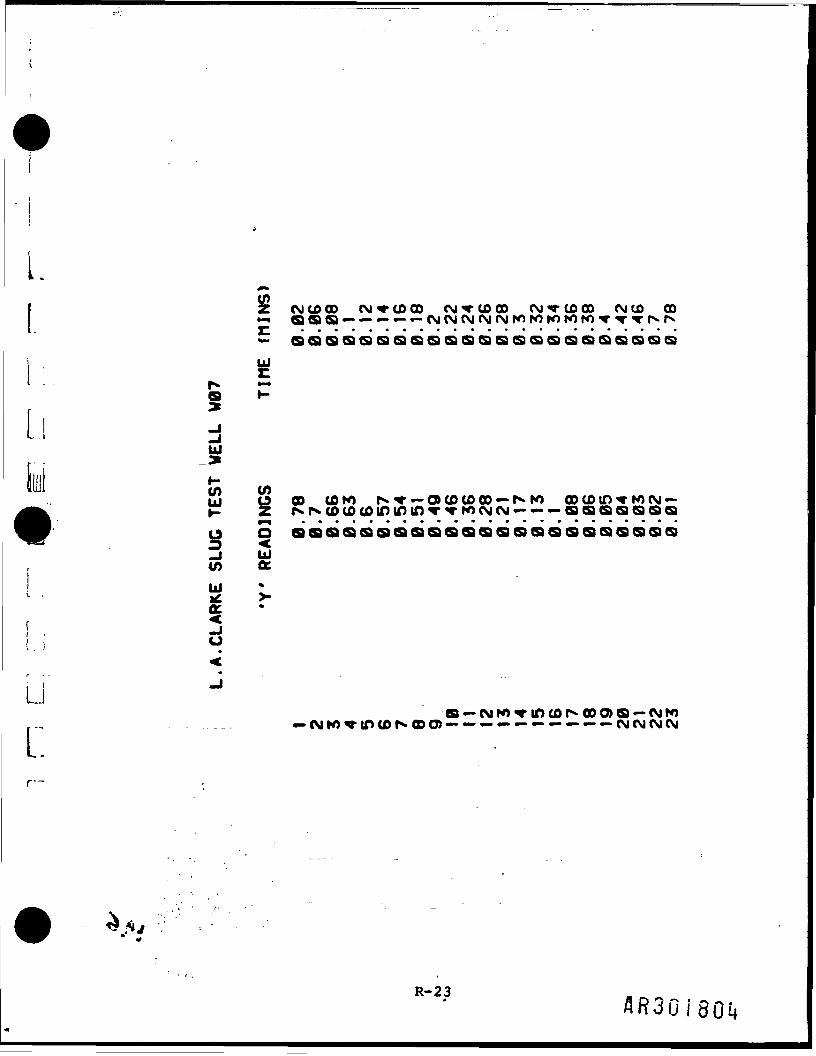
L
Li
LJ
t!
Z (SI tO CO (SIVtOCD (SITtOCO (SJ-rCOOD (StCO CO•-» aaa —— — — — csicsicsi Nrg N> K> ro tofo-r-r *• r«-r*-*—* a a (s a csi a a c& a osi cs ca oa a a Q cs csi a c& G& o a
$to too o COM r^-r-Gocotooo —NW co co in •«• K> csi—z r f*. to co co in to tn *r WC— — — aaaaass
_ UJto cc
1 I rh d
a —CMro^rmcor^oooa ——— — — — — — — — —(MfMCMCM
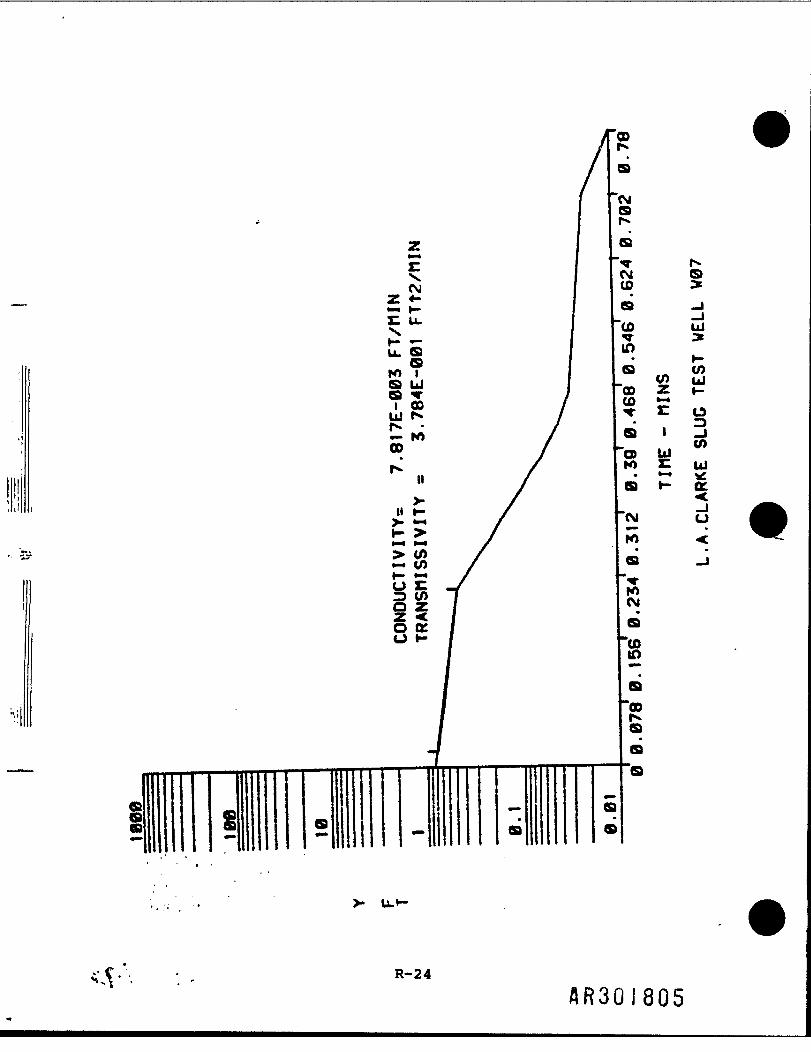
Ul
to
3
o<
AR30I805
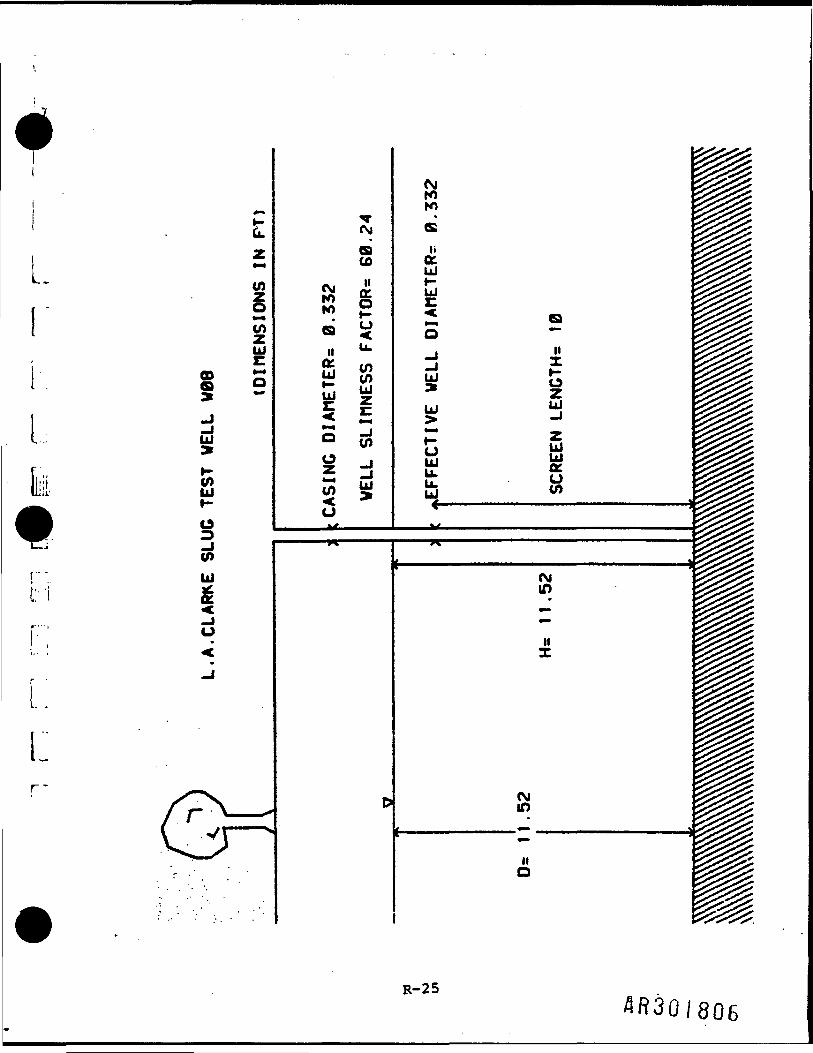
i:
to§to
(0UJ
to
csi10K)
auorUJ
<aotou
-r(SlCDCOII
UU.totoUlz•— 1
to_J-1UJ
(SJ10rosIiorUJUJz:a.
_iUl
Ul
CJUlu.u."i —
4V *
aMoUl_J
UlUlato
t ————————— " ———————————————————————————————————————————— »
i
CM10
IIX
(SIto
o
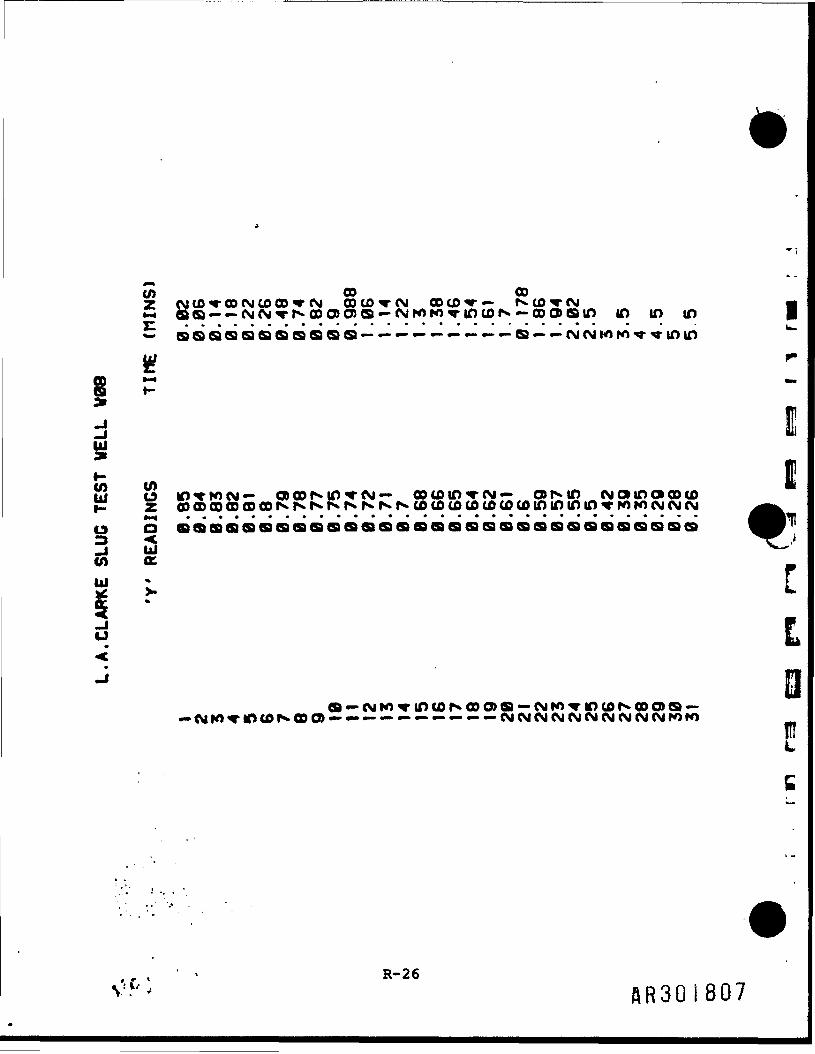
Z (M CO *• 00 (SI CO 00 «T (SI OOtOvCM ODCO^r— fv CO T (SI•»«. aa —— (M(M vi^oocoO)a —(siroro^-intof^ — oocoatn in in in*- cBsaaaaaaaaa —— — — — — — — — a —— cMCMioro-ri-intn
to touj id to f to CM— o> oo f* in <r CM — oo co in «r CM — or»in CM o> tn o co cot- 2 co CD oo co oo oo i i f*- r» K f"» h» Is- to co to to to to to in to tn in t K> to CM CM csio aaaaaaaaaaaaaaaaaaaaaaaaaaaaaaa
a —cMtoviocor^oocDa-—— — — — — — — — — (SlCMCMCSlCMCMCMfMCMCMrOfO
I1
j Uto orui • T• L
L
RR30I807
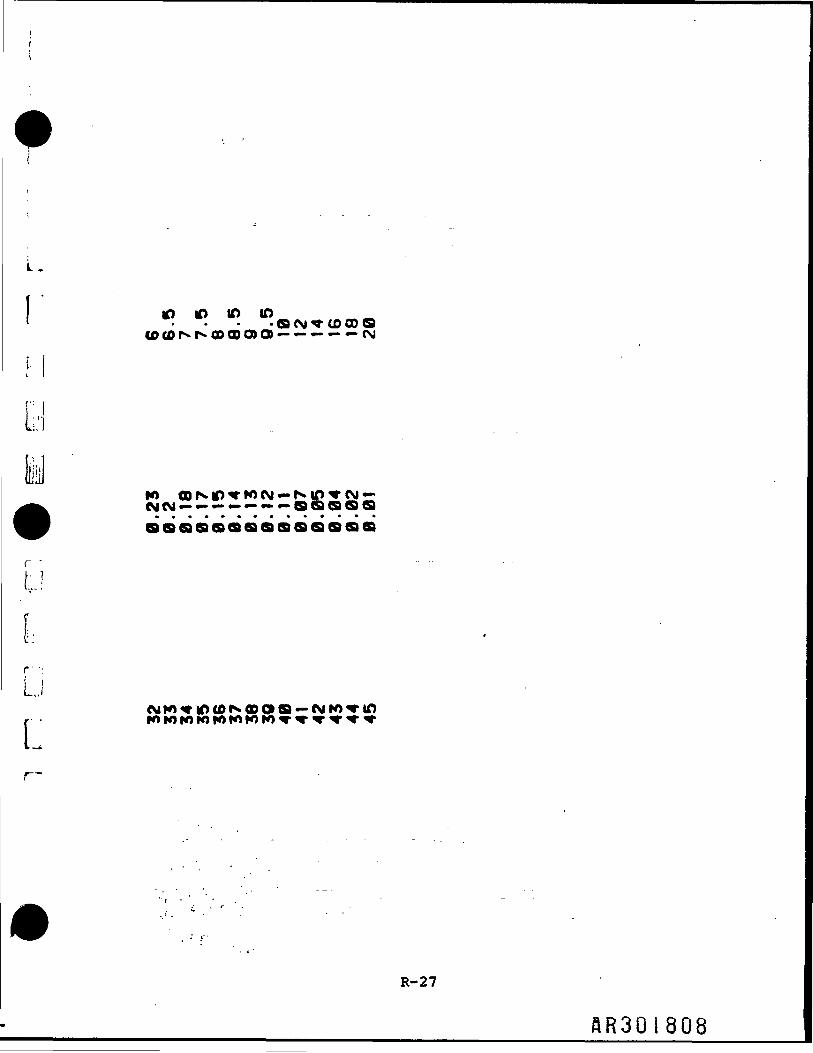
L.
m 10 to to
Li
L
acg<? cocoa— — — — — csi
w CD N 10 *• M CM — r»» 10 <e CM —CMCM— — — — — — —a a a a aaaaaaaaaaaaaaa
CM ro <r_> co N> oo o a — CM ro «r to
R-27
AR30I808
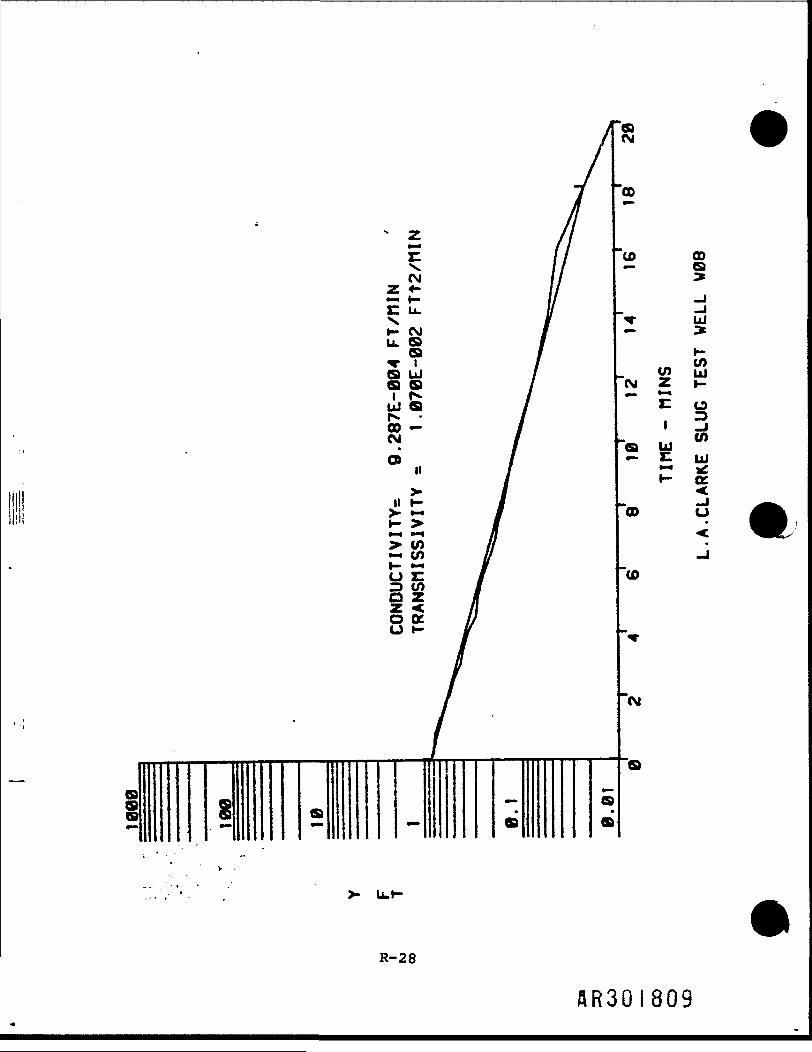
i a
pia
ca
>- U,t-
aCM
00
CO 00— ea
ui
CM Z fr-
*~ n o. 3
a uj w— £ ui£ cc<
'oo u
CO
CM
R-28
AR301809

LC
aco to
^ s* " CC
UJ
w ~ ct wro g =
w s' <->UJ || ^ , IIE * to ^J -xto s • m S
"" zUl
a o F ui 3 9
a toz -Ja M s B s< •*us
toUJ (SIe roin
nx
L:
(MintoIIo
R-29 A R 3 0 I 8 I O
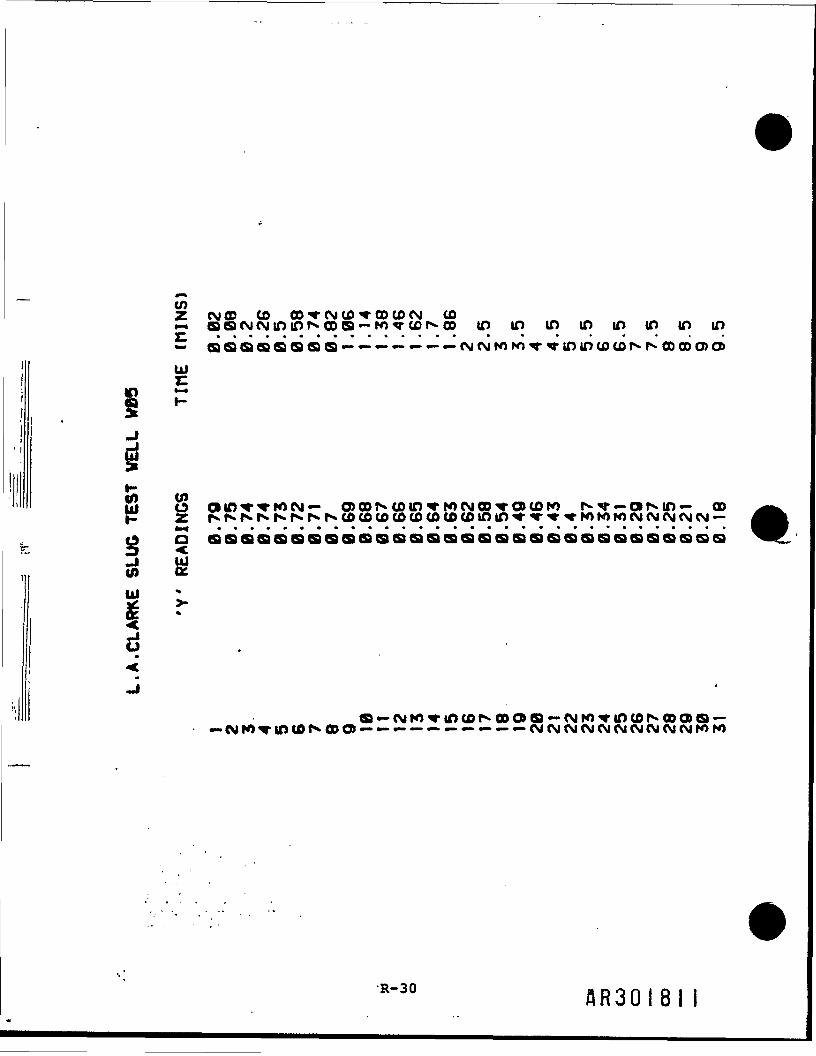
toZ (SI CD CO 00 t CM CO T CO CO CM CO.-• a a CM CM in in r*-co oa — ro^r cor^co i n i n i n i n m i n i n i n— eaaaaaaas — — — — — — — (s.Ntow^vtoincocor*r»cocoo>a>UJ
£ P
a aaaaaaaaaaaaaaaaaaaaaaaaaaaasaatoUl *I *
a — CM to -r in co t^ oo o> a — CM ro •*• in co r« oo o a ——— — — — — — — — —(MCMCMCMCMCMCMCMCMCMrOtO
R"30 A R 3 0 I 8 I I
I
fL
1.1
-.-.---.--(SI
roco.oro(M ——aaaaa
CM to-r to tor*K)rororo ro ro
R-31

z «-
aa— a
— l
—__,.a
a•a
a
mca
UJ:*
ac o. 3UJ ">E. ui
u
to
(M
A R 3 0 J 8 I 3
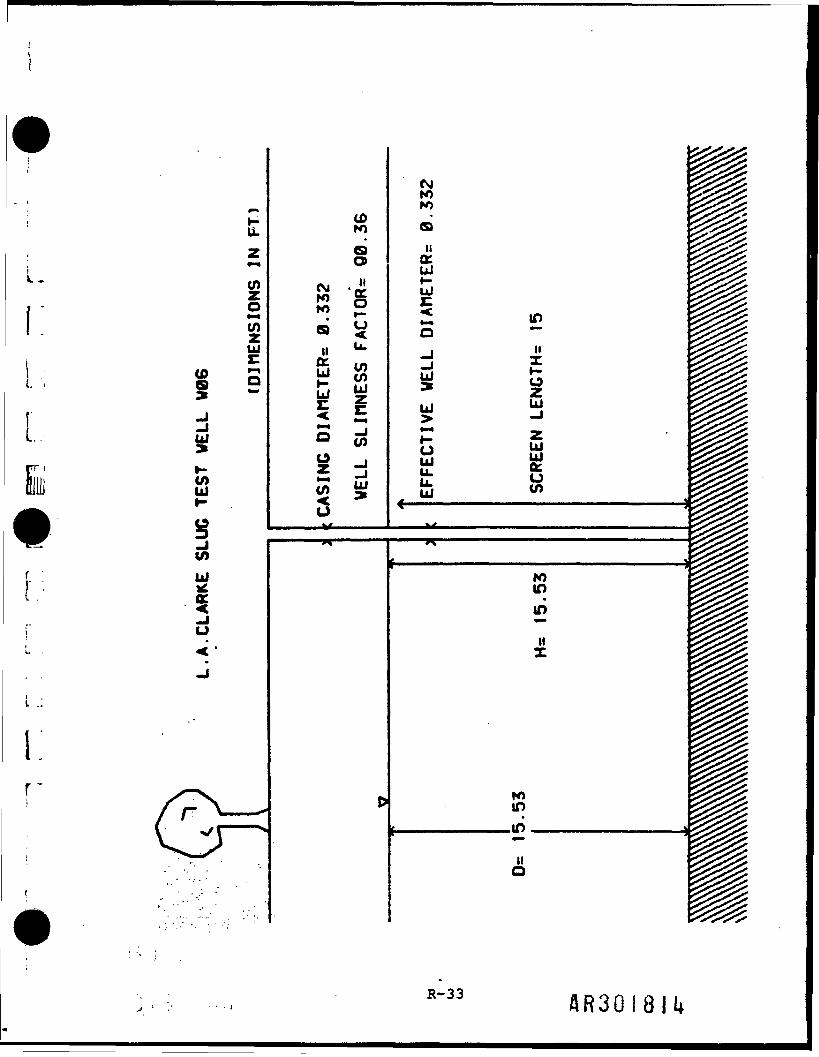
L
i
(SJrotoco
ii.z
otoUl
<0
* = ~ u u
) I-> toUJ
to1 UJ*I .
-JL .;
CMroro
nccUl
ao»u'o:ou
totouJ y
0oto
CO
Ul
inu
f >^^ - roin
uccUJUJ
UJ
uUJ
inIIXo
zUJ
CJto
rotn
ux
uo
R"33 AR30.8U
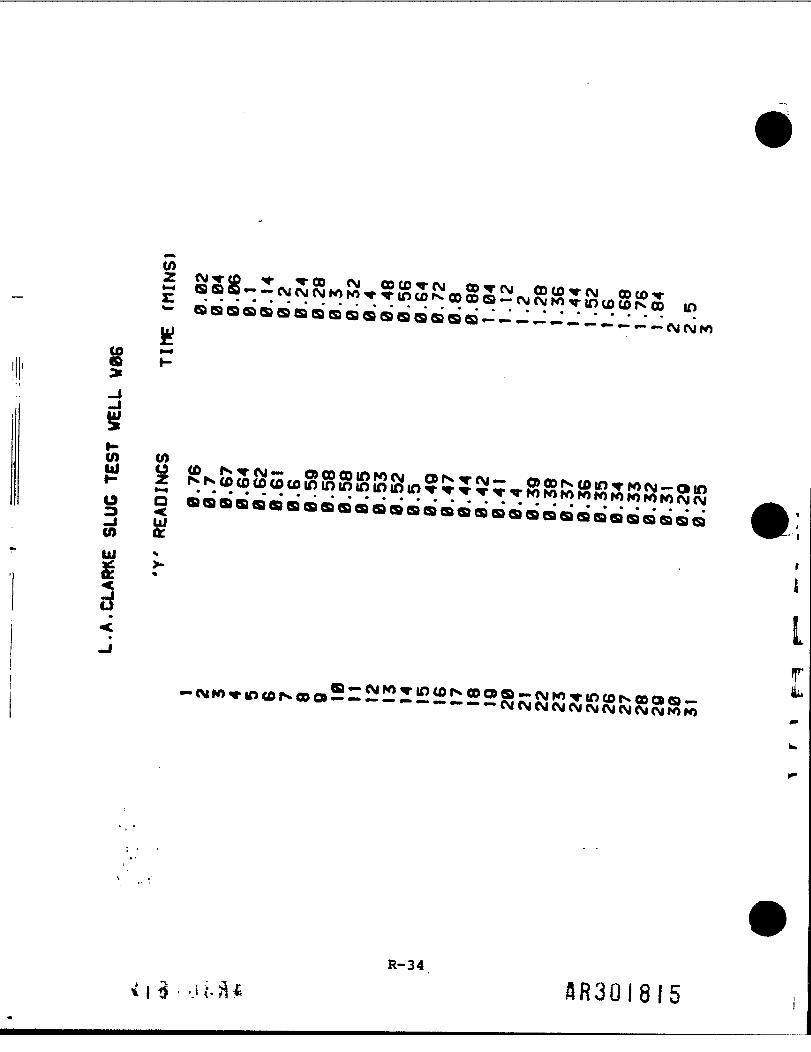
COZ
aaaaaa
til o to f»«rcM— o» co oo in to CM a»^<ecM — o> oo r»» co in <r ro CM — o inp z r^N<o to co o> co to in to to in in to <r <r r *• <r v ro ro ro ro ro ro ro ro ro CM CMo Q a'aaa'a'a'a'aaa'aaaaaaaaaaaaa'caa'aaaaaa- <
UJ
UJ£
I
R-34.
AR30I8I5
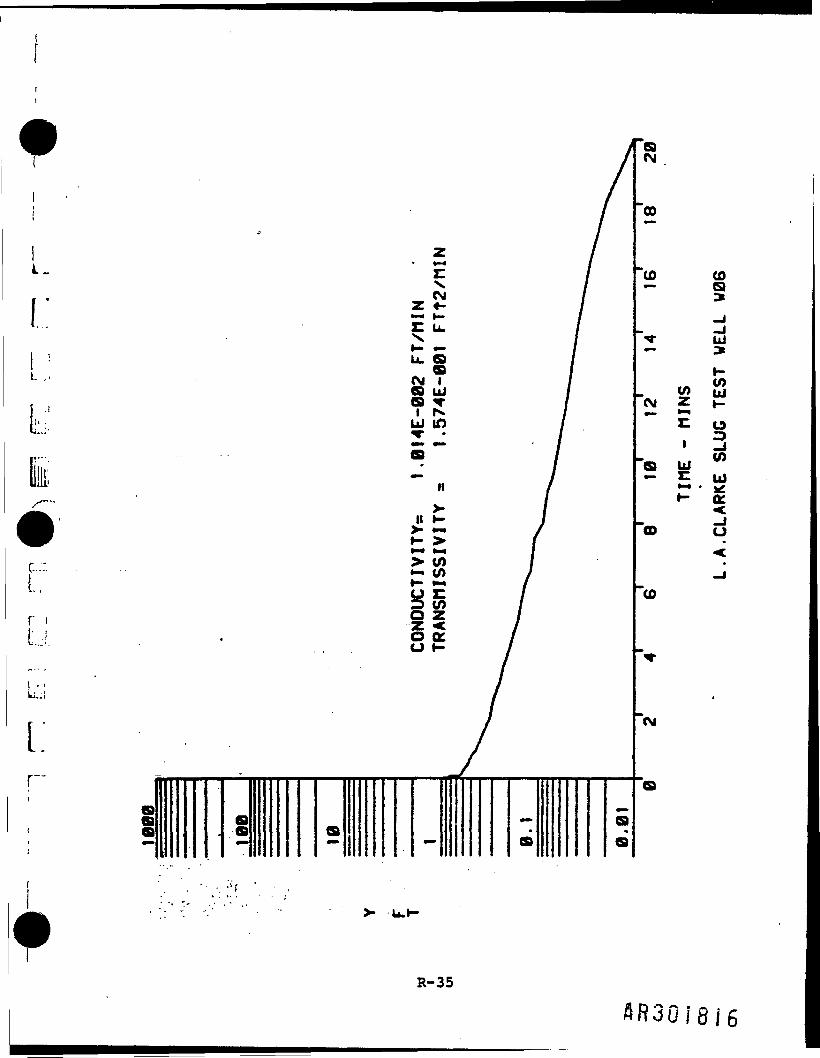
I..!
I,:
L'.i
11
cN.CM
C U.
:• u. aa1 CM Ia uja <ri r-.
UJ lO
a ujn>n
>• to*r- >to* to*> to-* to
OKu c-
a§ a.•s a^
•
a
__a•a
a
>• U.K
R-35
aCM
oo
to co— Q
ui
to
•
00 O
CO
CM
frLLL Appendix S11
000L
I
fl/?30/8/7

I1IIIII
APPENDIX S
RESPIRATION, OSMOREGULATION, AND MORTALITY OBSERVEDDURING SEDIMENT BIOASSAYS
0985B
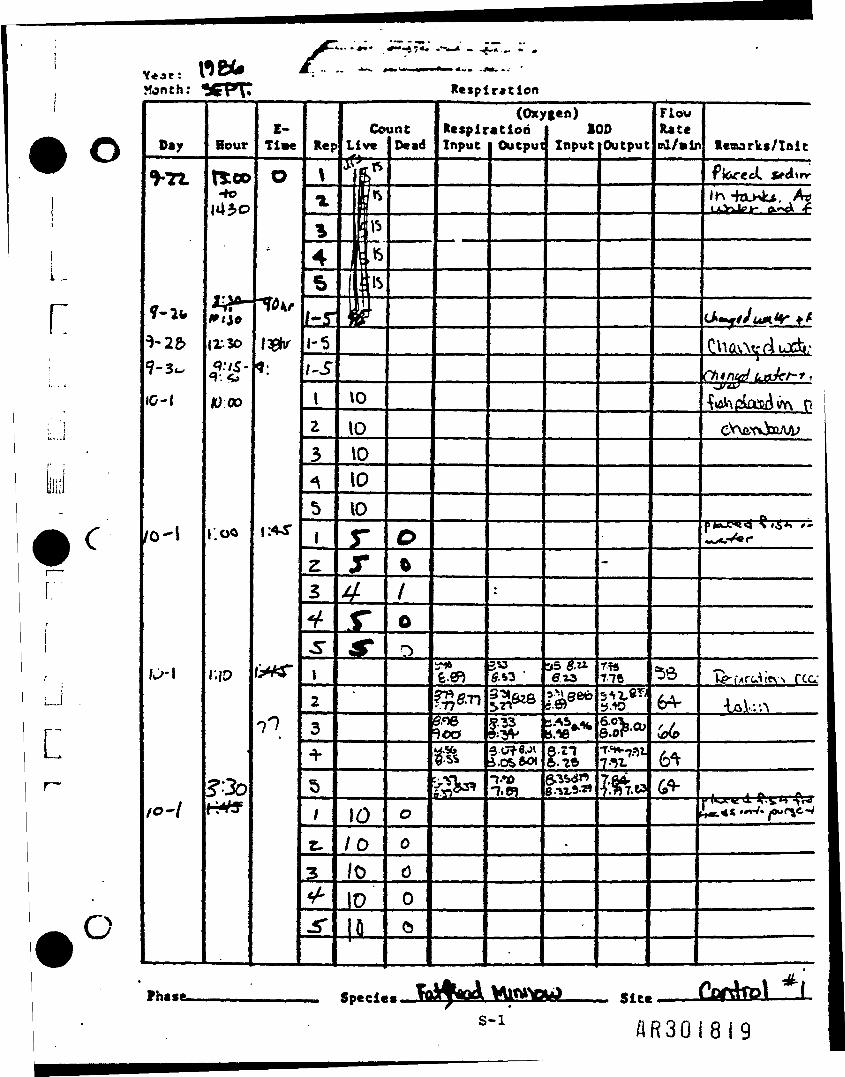
O
i.r
c
J
o
...... _-:m... •• — ••—• *•»*-
Month: 6T 7 Respiration
Day
fO-l
o-l
Hour
-fo1430
ir so
/Woo
l.oo
E-Ti Rep
/-s-1-5\-S
CountLive Dead
ls
10
10101010
10/o/o
ii
RespirationInput Oucpu
(Oxygen)
6*1
•7-'-)
100Input Outpu
as S.
S886•+**.**b/ie**til
776
FlowHateml/air
6-V(0(0
leavarks/Init
flared. crdtIh
Cliav.VrdiuX.tivChtn
rr
rcq-
kjP«d ...i. r-
51f.c ——L
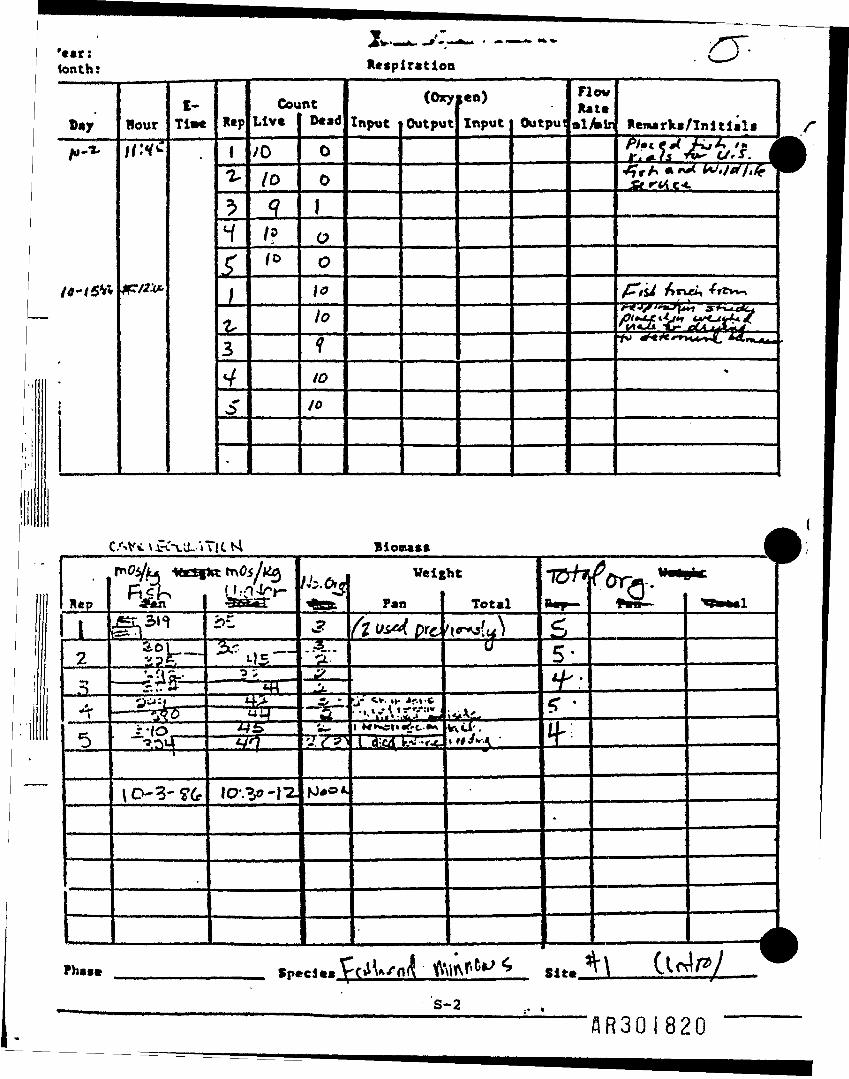
'ear:tenths Respiration
Bay
i
Hour
*~
I-TiM Rep
17.^1
£|7,34o>
CouLive
/O/OqIs(0
ntDead
0
01
OO\olofID
/O
Input(Ory
Output Input Output
FlowRatealAiir
£J.
Rewarks/Initials 1
Pj*'3?<&'u''S. t
Cf _X C^L 1
X /S />nxi» -fi w-
/SS iS^ ^ rii.-
,
r
CAVt v .'-xti..'»Tl (. K BioB»««
lep
Weightrtj.l.. -*-,.->.- _ Pan Total
-*<3 i L t/A«\ inrv\tr*3\i4
_hHz
22.j. . i >» rf ..vy
-30-} "2
4—————"——flR30i820
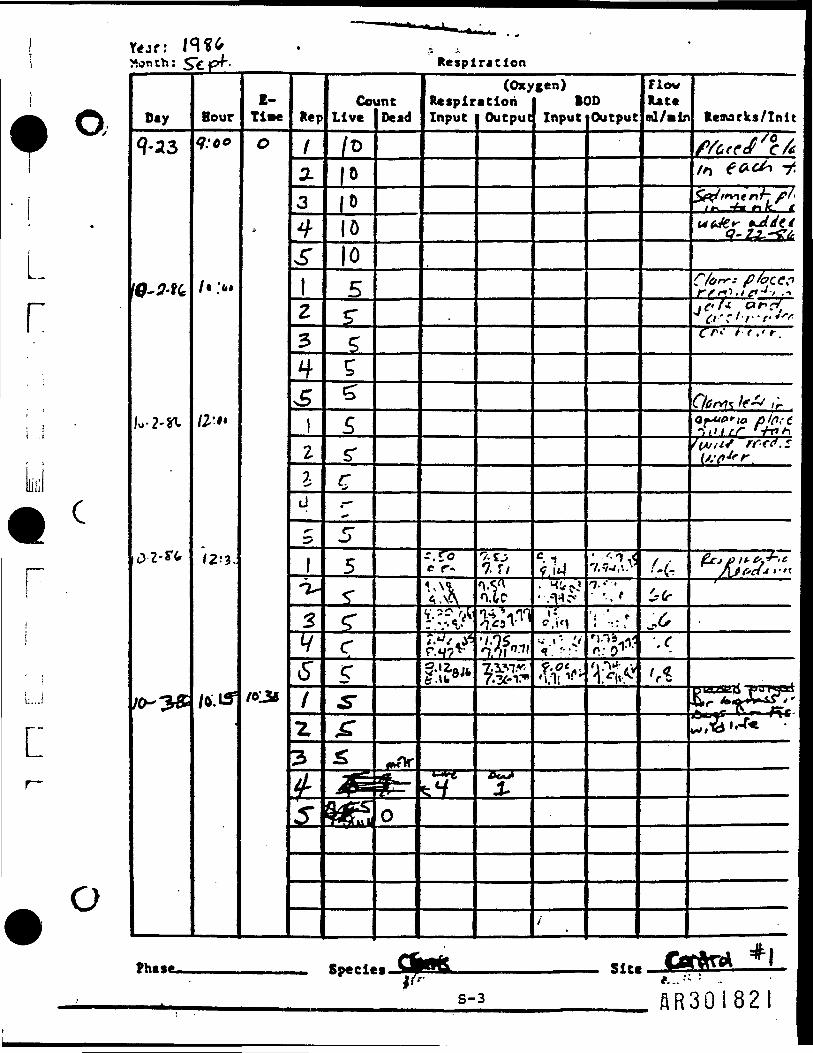
I
r
y cr .
L.i
L"
O
Y«jr:}»onth: $£ pf. _____ Respiration
Day
9-23Hour: 0°
s(• 'fit
&'.»*
/0.15s
E-Ti Rep
CountLive
*
°
°|0_10
Dead
(Oxygen)Respiration I BOOInput Output Input
-7. r/V^ - MJrcJn.&c I-.'"V*;*f] o, * . «VM 11*1 "59 •' ^ iV'1
« * '•l! 1( '
Output
_____fhase___________ Species -3iK&———————————— Sitt
FlowRateml/.tn
'r*r w
Retnarks/Init
//}
I ^ - C c»/&•'?!•/• •(•*'''•
'fill tf r-/T»Airrtf. r
K 75 f'v'
*...«'.
s-3________ flR30i82l
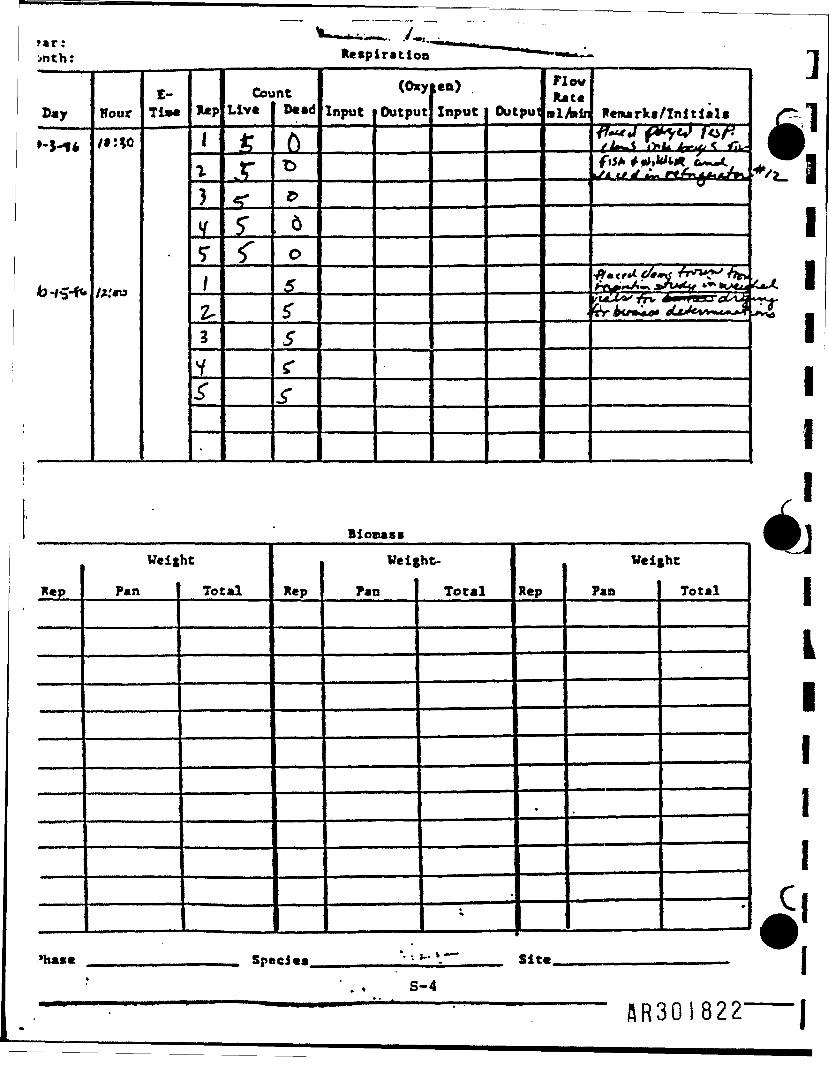
f»r: --->nth: Respiration
Day
••S-**
b-iS-ft.
Hour
/*.'«>
E-Ti»t
•
R«p
1I
J
Y
TJ
2.3V^•
ConLive
*r<5-f
ntDead
f)
o, 6o5$•5£•
.$•
Input(Oxy
Outputen)Input Output
FlovRate
Remarks/Initials
*l*tli ffi fif i5A / .U.WH.T *~~*-,
•f/mttd. trttflf TT VJ* T7j">
b ^ JUL ^
Biomass
Hep
*has*
Weig
Pan
htTotal Rep
i- sp*eiea
Veig
Pan
ht-
Total
-»
'• •.»..* —
Rep
.
Vei|
Pan
;ht
Total
s<*.
' . , S-4
^
C
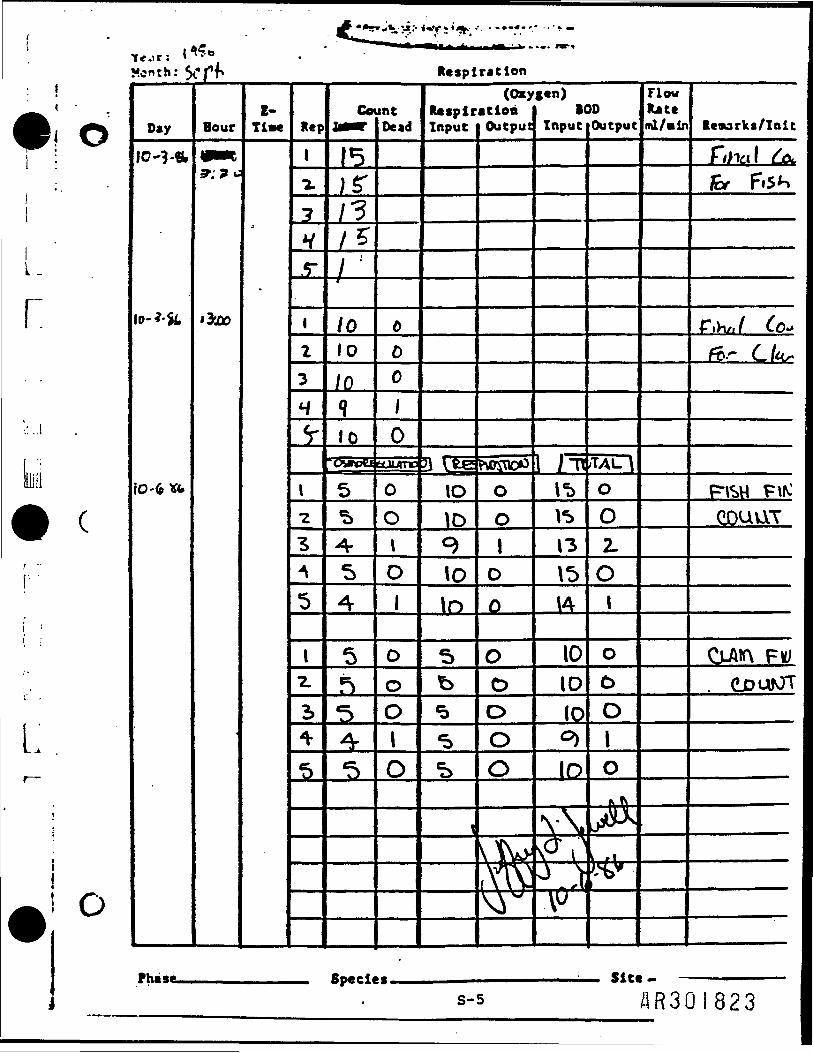
Month i V f _ _ _ Respiration
•11.
r•; ..!
j<
Killl
• cfri !i j
L.i
• °j
Day
,..,-»
'0-<p *fr
Hour
-.
•
E-Tit-e
'
Rep
1
X
7xyy
l13H~
I•z3^5
I7.
2,-Vf»
»K...
Cot
15/ri"3l %I1010
/o9foownpei
5«5>4-54
5jT>c
Speci<
itntDead
C00
/
0tuttrncOOtO1ooo1O
RaspirInput
(OxyatioaOutput
gen)1C
Input>oOutput
IO
ID9
10In5b<=>
*=>
IS
,
OO10o
0oooo
ytVyl\V>M
I'D 1 01*>
1315\4
1010IP°)ID
O_LO1
oD01O
\\j>pi\^ . Jtt'
FlowRateml/Bin Returks/Init
r<>1dtl fa.
far Fi5
T» iHzi f Co**TO-*" C_ Ktr'
F-\SH FtKCDUVXT
CLAKX FMJ. (LDUfOT
s, —————————————— : — Siet- ————————s-s ^R30i823
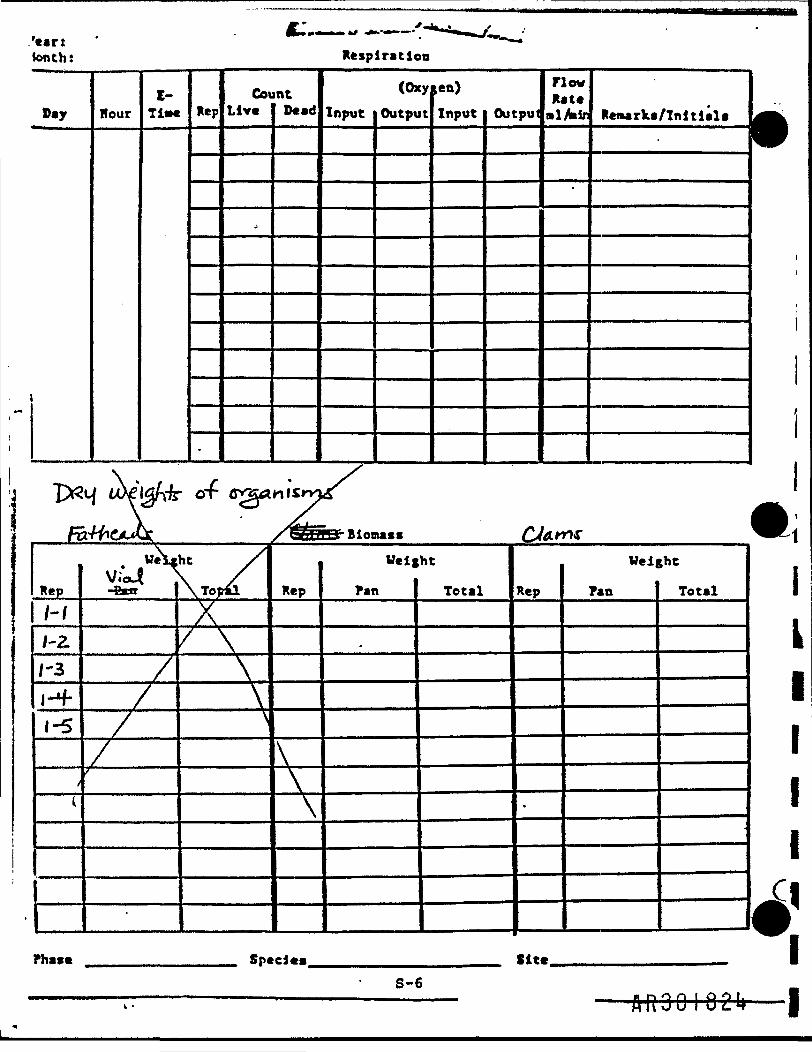
'ear:tenth: Respiration
D«y
i
HourI-TiM R«p
•
CotLive
.
intDead Input
(o*yOutput
;en)Input Output
FlowRat*mlfmli
*
Remarks/Initials
Bionass
Rephi
1-2.1-3,l-f1-5
y
i
VeigvU M
////
•
" /\7opUi
X/ \\\.„„,„„ — .,,,,,^
Rep
\
\
Veig
Pan
.
ht
Total Rep
-
Well
?an
5he
Total
Phase m_____________m Species,_______._______ _ __ Sit*.
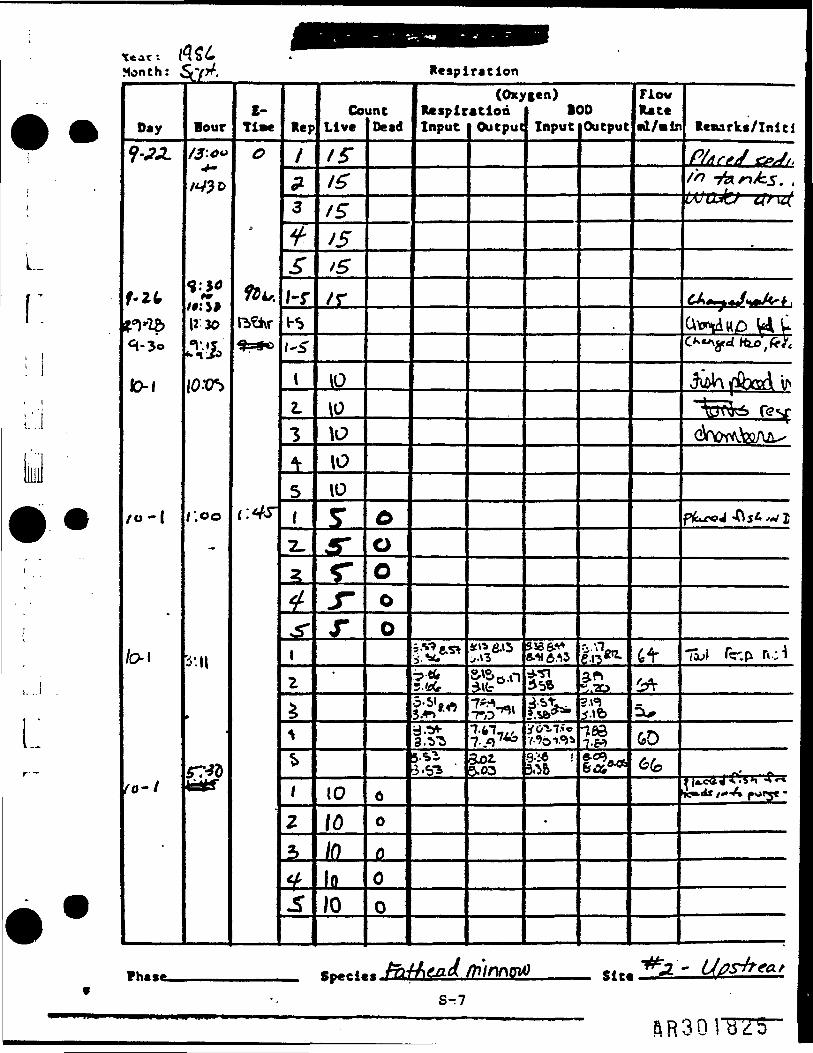
L.
L
Month: S . R e s p i r a t i o n
Day
KM
(Q-t
•our
/r1230
i'll
E-Tls Re
CountLive Dead
/$
/5
1010
to10
10
o
RespirationInput Output
(Oxygen)
Zft
BODInput Output
nea
FlowRate
&.-.T— ^ -5jj fir.p.
GO
Reaarks/Inlti
fjlLoe«l
Ph.se_________ T--'- SlttST?
a.R30i"BT5"
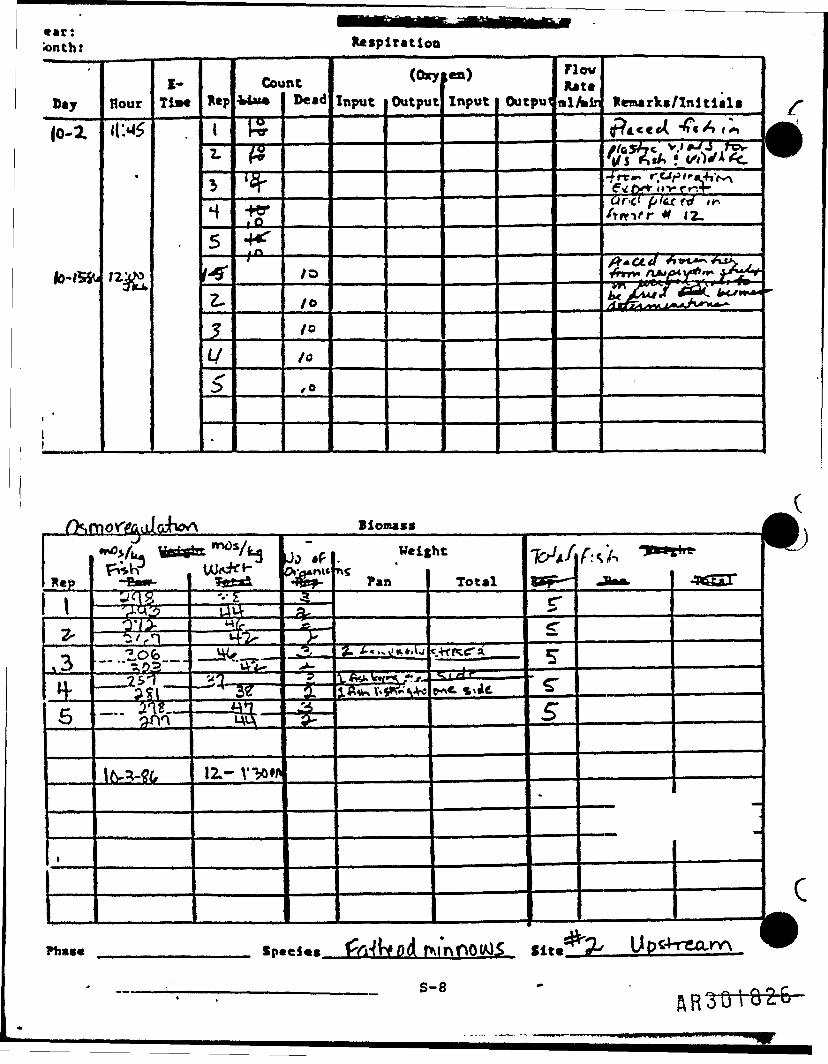
ear:lonths Rtspiration
Day HourE-TiM Rep
CountDead
(OxyInput Output Input Output
FlovRat*l/Birn Remarks/Initials
lo-a.
/O
{f?4C«*(rv
!plM.»MM*___MA_BHMHM_lia
_. . ptec frf if
Biomass
Rep
Veight
Fan Total'-'£
£fsT
fi ^
IZ-
c
S-8
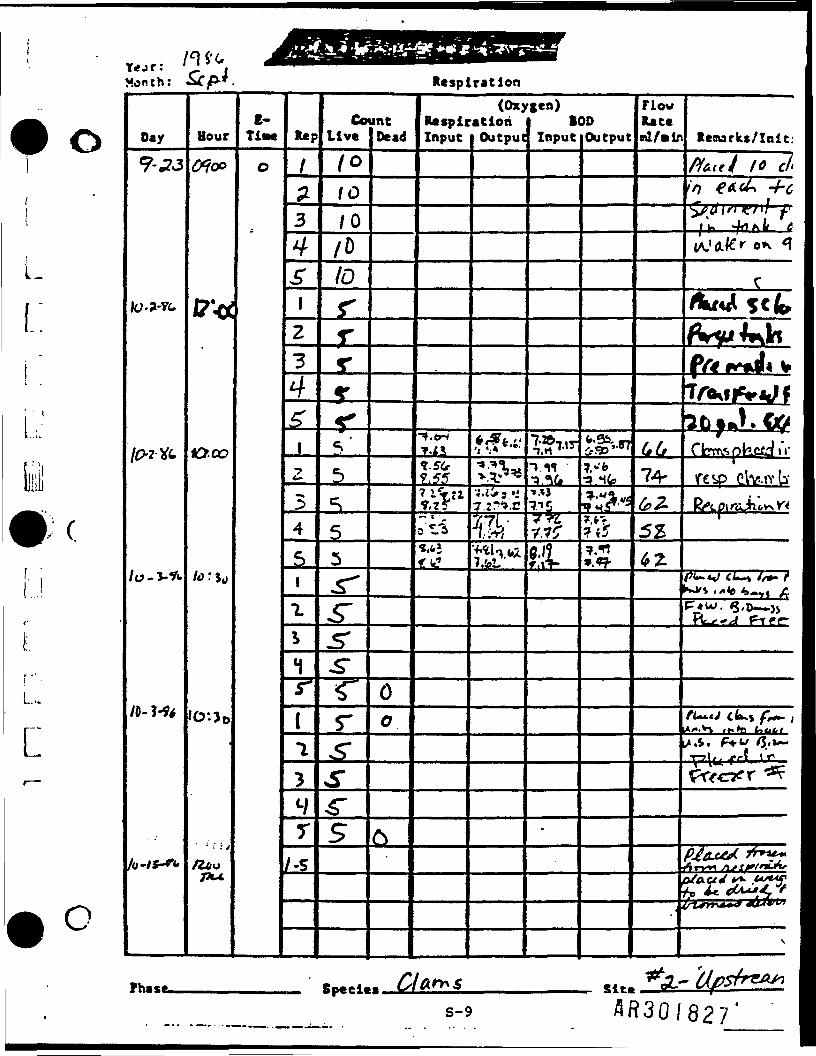
L'
Y«jr: ' •' '.Month: C-C/P-*.__ Respiration
O
L.
c
Day Hour
&CQ \ r> f.l* '!«.-*—• i.H •— iSD'— 66
fill*TV*
E-Ti
Phas
RepCount
Live Dead
10/o
/o
6.2.
I ( A5 »'« %$T 1#T *%_ S£_
-5T
RasplrationInput Outpu
(Oxygen)
UsZ
0
L
BODInput Output
9.11r.il-
s-9
FlowRateml /.I
74-
Renarks/Init:
10
ea
Clv.tvb'
ctJ y* .«/**p
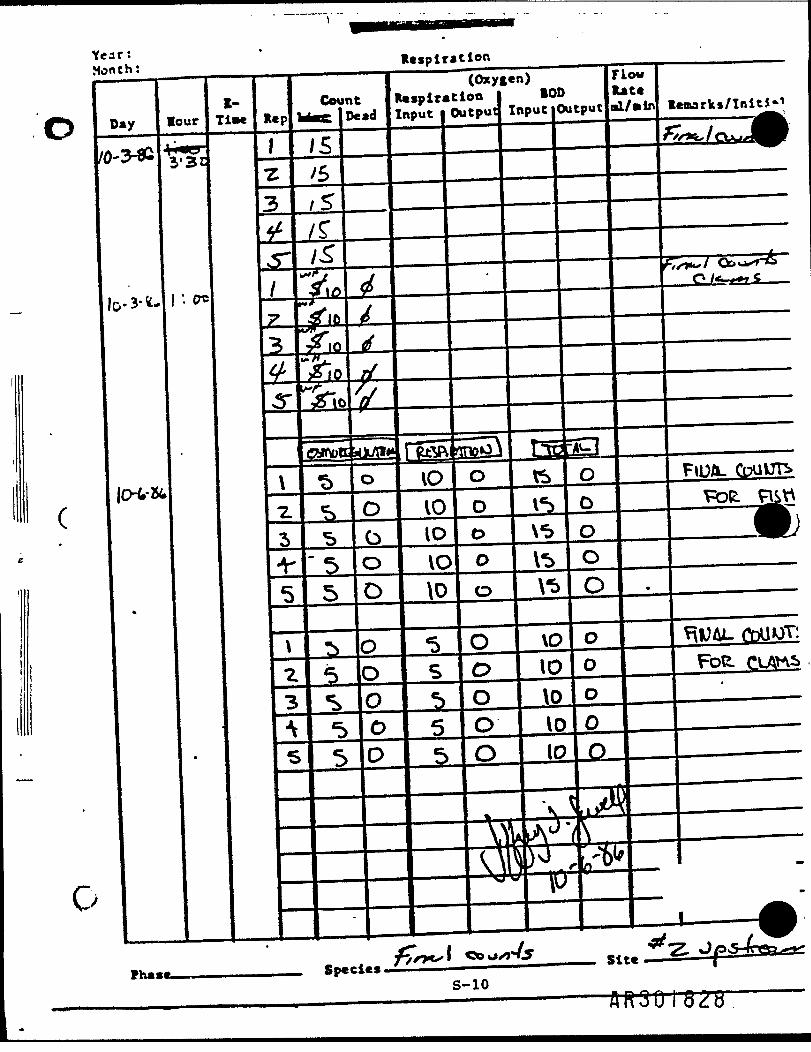
Year. RespirationMon c h: __________————.——-———rr~——»-(Oxygen)
RespirationInput I Output! Input iOutput| /«in
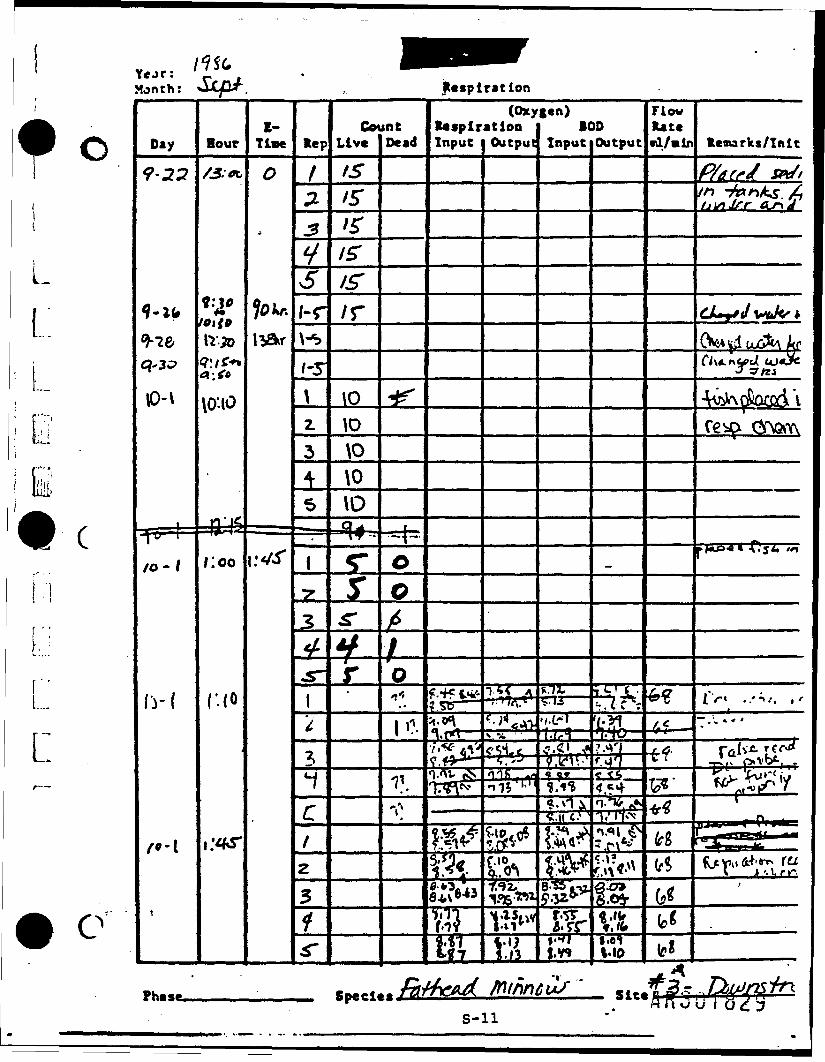
f
L.
'•c
C
Month: 0-Cp.f. ?. _______Respiration1
Day Hour
\OHO
/;oo
no
E-Tisw Rep
vfTi-r
CountLive
/r
10to\o\o\o
DeadRespiration
(Oxygen)
Input
.-r? i'tf-
Si
Output
nits
V.,*'
11
BODInput
^ • «™**-_TE.53-rfrs7.-Ef
5 .«».
t-
r »
J.V1
Output
Mr-'?
%L a..
VtVIO
FlowRatetil/Bin Returks/Init
::
f
(fl
i >« . / .-.
nrx ftf'. t. r »",
ffrr-ttt rar'* ** r""irtuUS—— ilMfl f nff.(*ySr . H n o u i u c 3s-li
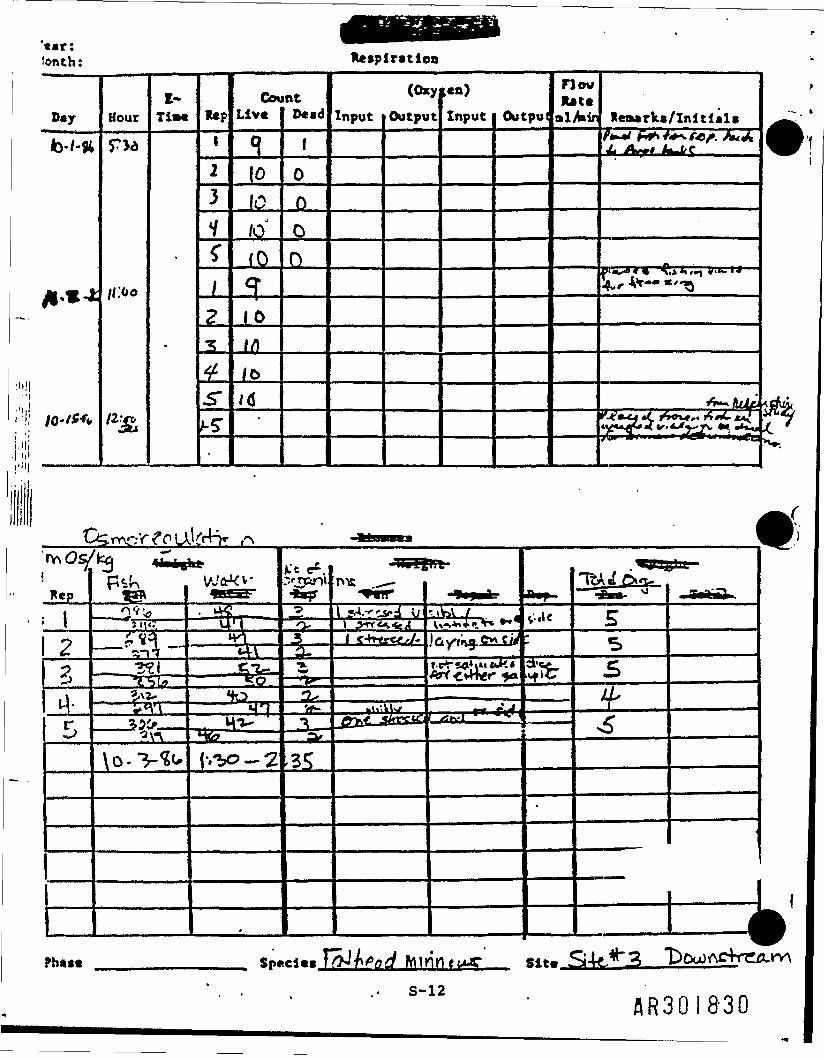
ear: —tonth: Respiration
Day
,.~
Hour
„-..
E-TitM
-
lap1
23t/^12^f5"1-5•
CovLiv*
Cj
|010/o'fO-3-10ifi/o/O
•
intDead
1
00oo
Input
(Oxy
Output
en)Input Output
PlowRate
Remarks/Initials
4, A~t A-wirC
T-Vr*-. "1 "~"
«~*£**.* tl /TOX*,. f i- . *X
<
tf<.>v.
IRep
-'c
: \~ W•'vA -
11
Phast ____________ Sn«ei««
RR30I830
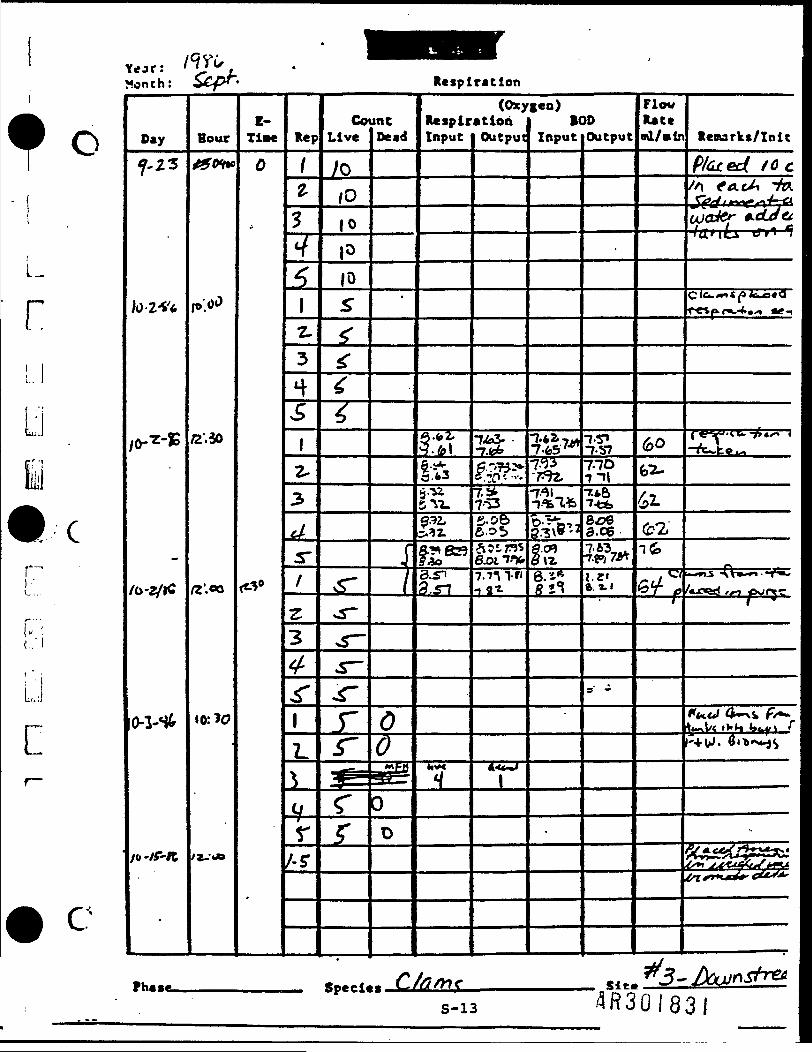
r
r'-
uC
C
C
Y-.r:Month: cp*~' Respiration
Day
f-23
0-2/lC
0-3-H&
Hour
10: 'C?
l-s
c
E-Tia
<**
RepCount
Live
oro ^10
10
DeadRespiration
(Oxygen)
Input
.fe2
.61
Output
TfeS-
6.05
BODInput
tz
Output
T-b"?7-70
a.ce
i.n6. -1
FlowRateml/.ln
60to-
Remarks/In it
/->
^
s-i3 <3R30I83I
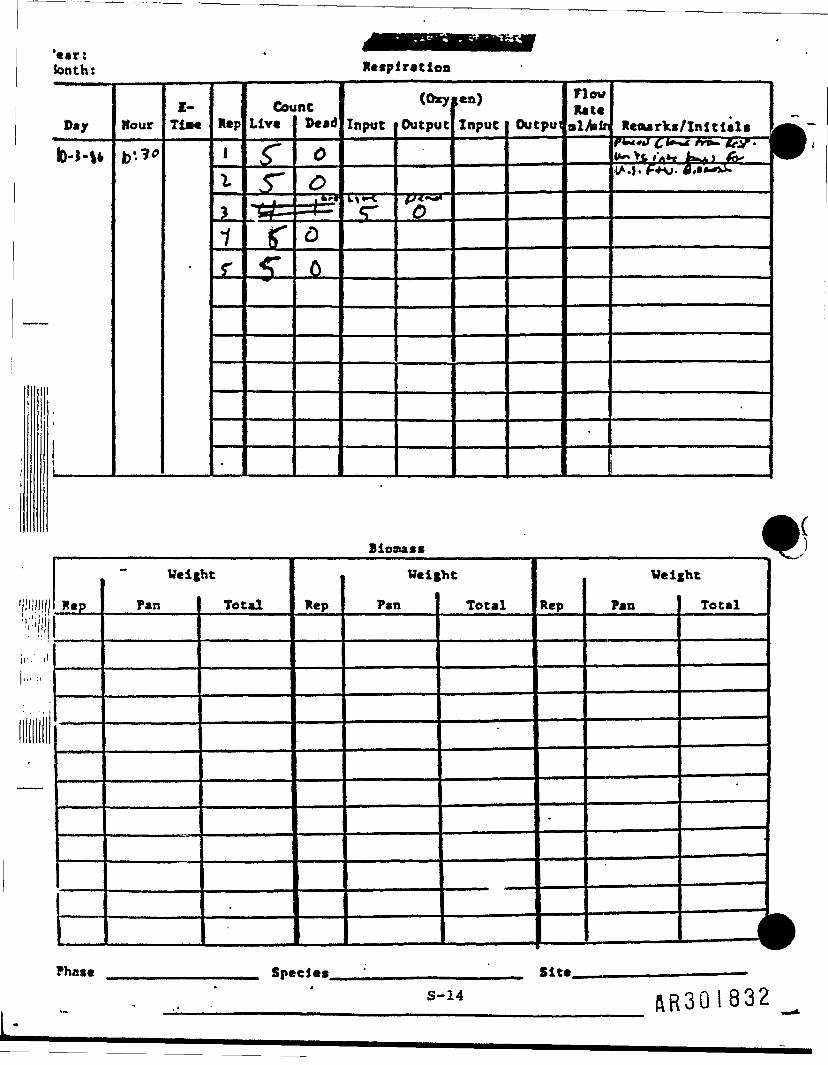
1
•ear:tenths Respiration
Day
kn-tt
|L
Hour
|>*.?0
E-TlJM
•
Rep
1
I
*
1
f
•
Cot!Live
<:<r-«*=IT<r
intDead
O
OI *— *— > -
<Do
Input
n-t
<0xy
Output
(j <.•*•*O
en)Input Output
FlowRateal,_ir
•
Remarks/Initialsfi~nd C**~* tr*- IfZT ' \*-.Vfc,»»« fc A,IA.I. f*v>. fi,»»-» .
•
I
Biomass
,'lilHII• ' • l i
,, ,i
1 i ill 111 1
Rep
Phase
Weig
Pan
ht
Total
t
Rep
Veig
Pan
ht
Total
. ... , ,„ _ Specie* ' i( n ..
Hep
•
Site
Vei]
Pan
_______ ——— ———m ———i
Iht
Total
*
y. .. .' ' s-14 {\R301832
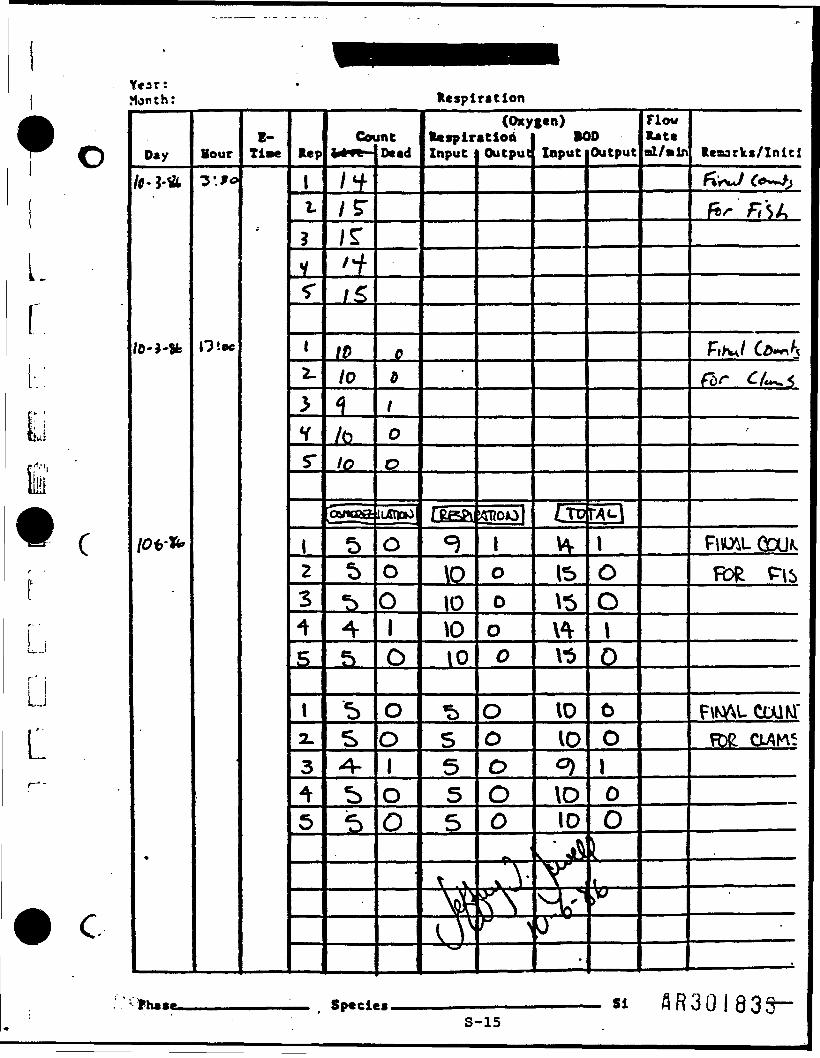
Y«ar:Month: Respiration
L
Ly
Cr
I
LLiL
c.
Day
'0- ?*-t
Hour
"3 \9o
O'.ec
E-TiM Rep
1L3
Yr
i2-.
>
YST
12^45
l2.
3^5
Cen
/f/ .T
/s:/-f/s/0/o1/O/-
oyioaa
55^45
^S4-^is
intDead
0o1
O
O
iuSDoO
OO01ooo1oo
RvspirInput
rtep\<=)P10\0\0
^s555
\. .A.
v V
(OxyatiohOutput
1
0
0oo
O00OO
— T"
\f \
ten)BC
Input
c™w15\5\4\".>
10IO0)
\O10
•i
\^yf
•
)DOutput
F*q»OO»o0oi0O
tr
FlowRateml /«Ln Remarks/Initi
ftfU <*~-*>frr F,U
l-r/v-;/ C_>«»»^^
for C./*-. <>
F\WL CCXJf pls
F\KV\U coawFDe OAK^
.
Phase———————————— . Species-—————————————————— Si flR30 I 83 $~S-15
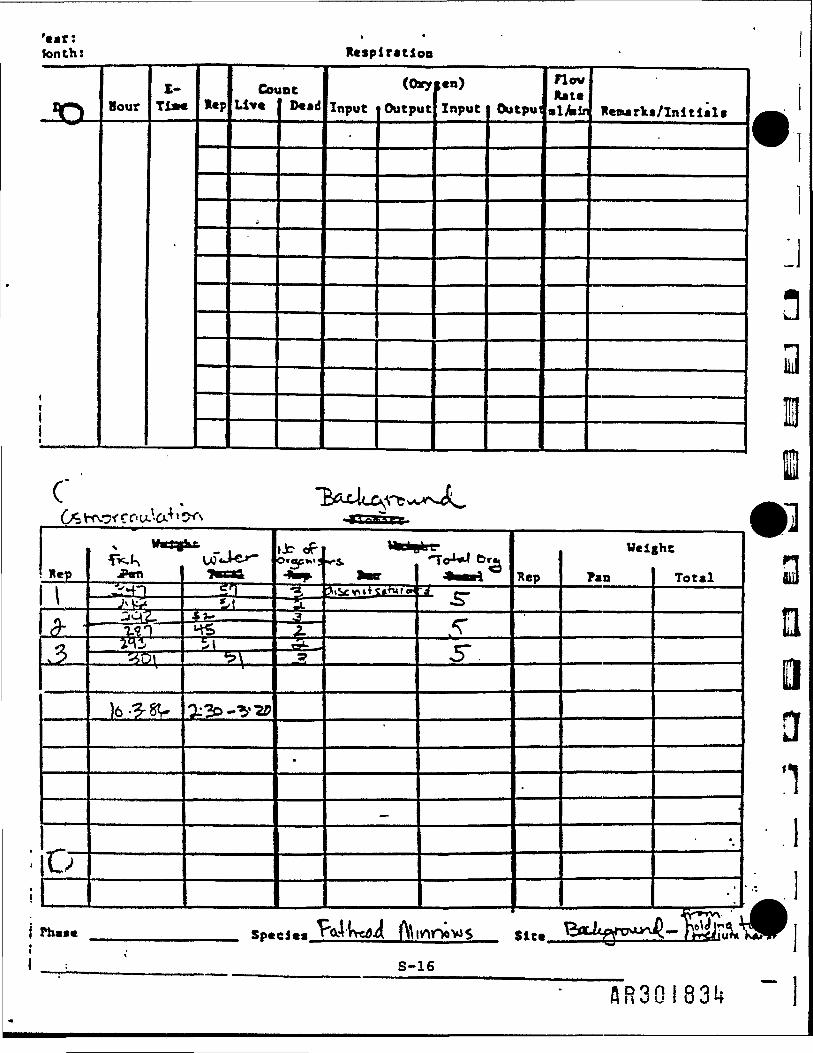
'ear:Jonth: Respiration
T)
i1
HourE-TfcM Rep
CmLive
^
mtDead Input
(Oxy
Output
;en)Input Output
FlowRate•lAiifl Re«arka/Inltials
C
Rep Rep
Velghc
Pan Total
<2l HS
i
j Phi** ______________ Species rft.4ry 4 |\l\lWfrV>$ Site.•I
' -. • S-16
AR30I831;
f
1If
iiiiift
Appendix T
#35
i
LL.
I.
0985B
APPENDIX T
SITE INVESTIGATION METHODOLOGIES
iDRAFT - do note quote or cite
IIim Activity No. 2
AIR SAMPLING
||B NIOSH METHODS P&CAM 127, 3052 AND 5515
CALIBRATION PROCEDURES
I
"I(Hit
T-l
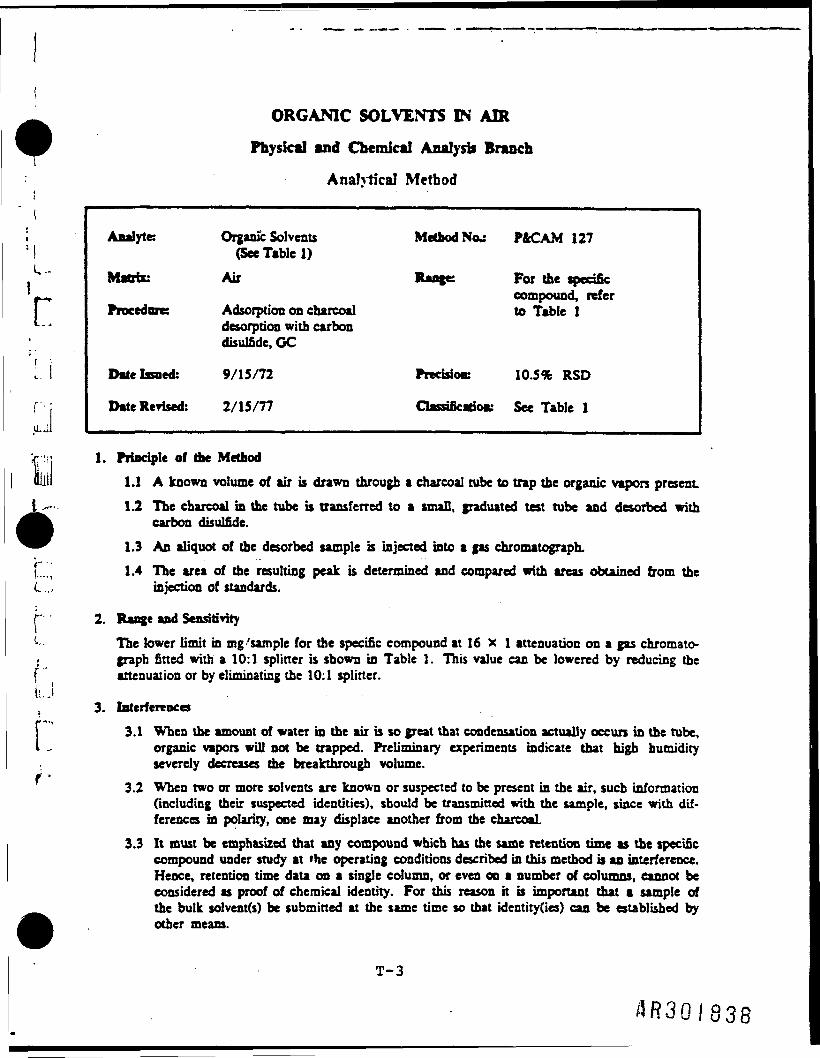
IU
r;
ORGANIC SOLVENTS IN AIR
Physical and Chemical Analysis BranchAnalytical Method
Analyte Organic Solvents Method No. P&CAM 127(See Table 1)
' Matrix: Air Range: For the specific' compound, refer
Procedure: Adsorption on charcoal to Table 1desorption with carbondisulfide, GC
Date Issued: 9/15/72 Precision: 10.5% RSD
Date Revised: 2/15/77 ClassifkadoK See Table 1
1. Principle of the Method1.1 A known volume of air is drawn through a charcoal tube to trap the organic vapors present1.2 The charcoal in the tube b transferred to a small, graduated test tube and desorbed with
carbon disulfide.1.3 An aliquot of the desorbed sample is injected into a gas chromatograph.
L.. 1.4 The area of die resulting peak is determined and compared with areas obtained from theL.., injection of standards.
p 2. Range and Sensitivity<••• The lower limit in mg'sample for the specific compound at 16 x l attenuation on a gas chromato-• graph fined with a 10:1 spliner is shown in Table 1. This value can be lowered by reducing thef attenuation or by eliminating the 10:1 splitter.U - .
3. Interferences3.1 When the amount of water in the air is so great that condensation actually occurs in the tube,
organic vapors will not be trapped. Preliminary experiments indicate that high humidityseverely decreases the breakthrough volume.
3.2 When two or more solvents are known or suspected to be present in the air, such information(including their suspected identities), should be transmitted with the sample, since with dif-ferences in polarity, one may displace another from the charcoal.
3.3 It must be emphasized that any compound which has the same retention time as the specificcompound under study at the operating conditions described in this method is an interference.Hence, retention time data on a single column, or even on a number of columns, cannot beconsidered as proof of chemical identity. For this reason it is important that a sample ofthe bulk solvent(s) be submitted at the same time so that identity(ies) can be established byother means.
T-3
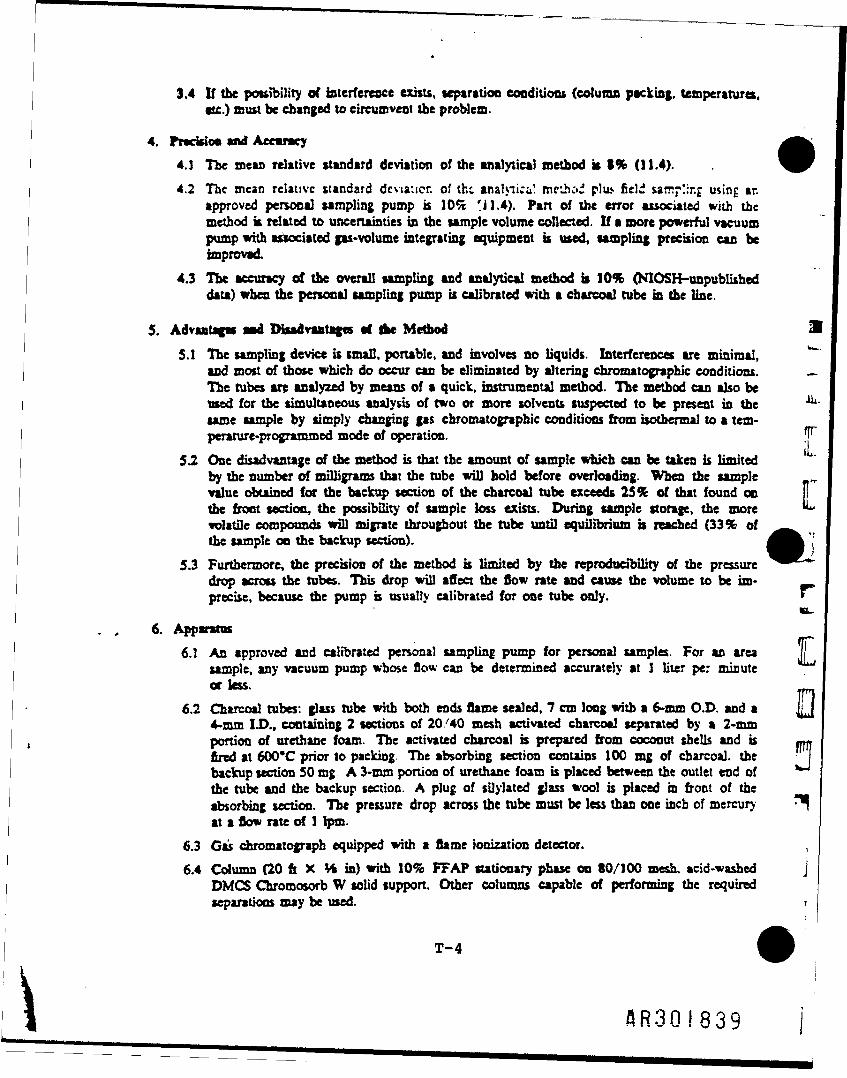
\
3.4 If the pottibility of interference exists, separation condiiions (column packing, temperature.,ate.) must be changed to circumvent the problem.
4. Prtcifioa and Accwacy4.1 The mean relative standard deviation of the analytical method « 1% (11.4).4.2 The mean relative standard deviation of the analytical mc' ic»d plu> field sam '.ir.f using ar.
approved personal sampling pump is 10% 'il.4). Pan of the error associated with themethod k related to uncertainties in the sample volume collected. If • more powerful vacuumpump with associated gas-volume integrating equipment is used, sampling precision can beimproved.
4.3 The accuracy of the overall sampling and analytical method b 10% (NIOSH-unpublisbeddata) when the personal sampling pump is calibrated with a charcoal tube in the line.
S. Advantages a-d Disadvantages «C the Method M5.1 The sampling device U small, portable, and involves no liquids. Interferences are minimal, *~
and most of those which do occur can be eliminated by altering chromatographk conditions. —The tubes are analyzed by means of a quick, instrumental method. The method can also beused for the simultaneous analysis of two or more solvents suspected to be present in the ^same sample by simply changing gas cnromatognphic conditions from isothermal to a tem-perature-programmed mode of operation. fF"
52 One disadvantage of the method is that the amount of sample which can be taken is limitedby the number of milligrams that the tube will bold before overloading. When the samplevalue obtained for the backup section of the charcoal tube exceeds 25% of that found on |the front section, the possibility of sample loss exists. During sample storage, the more -»*volatile compounds will migrate throughout the tube until equilibrium is reached (33% ofthe sample on the backup section).
5.3 Furthermore, the precision of the method is limited by the reproducibility of the pressuredrop across the tubes. This drop will affect the flow rate and cause the volume to be im-precise, because the pump is usually calibrated for one tube only. »
•u-6. Apparatus
6.1 An approved and calibrated personal sampling pump for personal samples. For an area Isample, any vacuum pump whose flow can be determined accurately at 1 liter per minuteor less.
6.2 Charcoal tubes: glass tube with both ends flame sealed, 7 cm long with a 6-mm O.D. and a |y4-mm ID., containing 2 sections of 20.'40 mesh activated charcoal separated by a 2-mmportion of urethane foam. The activated charcoal is prepared from coconut shells and is m*fired at 600*C prior to packing The absorbing section contains 100 mg of charcoal, thebackup section 50 mg A 3-mm portion of urethane foam is placed between the outlet end ofthe tube and the backup section. A plug of silylated glass wool is placed in front of theabsorbing section. The pressure drop across the tube must be less than one inch of mercury ^at a flow rate of 1 1pm.
6.3 Gas chromatograph equipped with a flame ionization detector. ,6.4 Column (20 ft X Vk in) with 10% FFAP stationary phase on 80/100 mesh, acid-washed J
DMCS Chromosorb W solid support. Other columns capable of performing the requiredseparations may be used. i
T-4
AR30I839

6.5 A mechanical or electronic integrator or a recorder and some method for determining peakarea.
6.6 Microcentrifuge tubes, 2.5 ml, graduated.i
j| 6.7 Hamilton syringes: 10 M'. and convenient sizes for making standards.6.8 Pipcu 0.5-ml delivery pipcti or 1.0-m! type graduated in 0.1-ml increments.
i1 6.9 Volumetric flasks: 10 ml or convenient sizes for making standard solutions.
' 7. Reagents7.1 Spectroquality carbon disulfide (Matheson Coleman and Bell).7.2 Sample of the specific compound under study, preferably chromatoquality grade.
i 7.3 Bureau of Mines Grade A helium.j 7.4 Prepurified hydrogen.
i 7.5 Filtered compressed air.
i8. Procedure
8.1 Cleaning of Equipment: All glassware used for the laboratory analysis should be detergentwashed and thoroughly rinsed with tap water and distilled water.
8.2 Cattbntioa of Personal Pumps. Each personal pump must be calibrated with a representa-tive charcoal tube in the line. This will minimize errors associated with uncertainties inthe sample volume collected.
8.3 CoQectioa and Shipping of Samples8.3.1 Immediately before sampling, the ends of the tube should be broken to provide an
opening at least one-half the internal diameter of the tube (2 mm).8.3.2 The small section of charcoal is used as a back-up and should be positioned nearest
the sampling pump.8.3.3 The charcoal rube should be vertical during sampling to reduce channeling through
the charcoal.8.3.4 Air being sampled should not be passed through any hose or tubing before entering
the charcoal tube.8.3.5 The flow, time, and/or volume must be measured as accurately as possible. The sam-
ple should be taken at a flow rate of 1 1pm or less to attain the total sample volumerequired. The minimum and maximum sample volumes that should be collected foreach solvent are shown in Table 1. The minimum volume quoted must be collected if
i the desired sensitivity is to be achieved.\ 8.3.6 The temperature and pressure of the atmosphere being sampled should be measuredi and recorded.]• 8.3.7 The charcoal tubes should be capped with the supplied plastic caps immediately• after sampling. Under no circumstances should rubber caps be used.1 8.3.8 One tube should be bandied in the same manner as the sample tube (break, seal, and( t r a n s p o r t ) , except that no air is sampled thrr zh this tube. This tube should be
labeled as a blank.8.3.9 Capped tubes should be packed tightly before they are shipped to minimize tube break-
age during shipping.
J! T-5
AR30!8l»Q
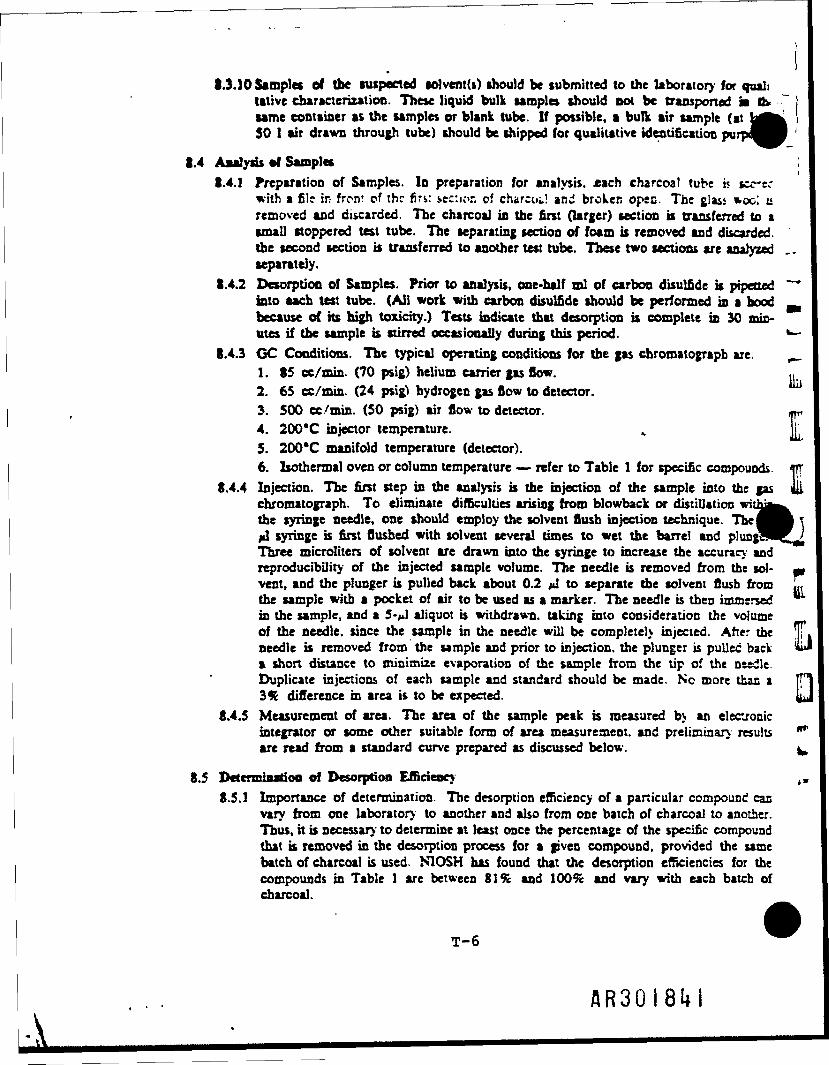
*
8.3.10 Samples of the suspected solvent(t) should be submitted to the laboratory for qualitative characterization. These liquid bulk samples should Dot be transported m dvsame container as the samples or blank tube. If possible, • bulk air sample (at *-""50 1 air drawn through tube) should be shipped for qualitative identification purj
T-6
8.4 Analysis al Sample. ;S.4.] Preparation of Samples. In preparation for analysis, .each charcoal tube i< tce-t;
with a filr in front of the firs: sector, of charcot! and broken open. The glass wool iiremoved and discarded. The charcoal in the first (larger) section is transferred to asmall stoppered test tube. The separating section of foam is removed and discarded.the second section is transferred to another test tube. These two sections are analyzed ,.separately.
8.4.2 Desorption of Samples. Prior to analysis, one-half ml of carbon disulfide k pipetted ~~~into aach test tube. (All work with carbon disulfide should be performed in a hoodbecause of its high toxicity.) Tests indicate that desorption is complete in 30 min-utes if the sample is stirred occasionally during this period. w-
8.4.3 GC Conditions. The typical operating conditions for the gas chromatograpb are: ,__1. 85 cc/min. (70 psig) helium carrier gas flow. ,,2. 65 cc/min. (24 psig) hydrogen gas flow to detector. '3. 500 cc/min. (50 psig) air flow to detector. -r4. 200*C injector temperature. „ Ii,5. 200*C manifold temperature (detector).6. Isothermal oven or column temperature — refer to Table 1 for specific compounds. <nr
8.4.4 Injection. The first step in the analysis is the injection of the sample into the gas _ichromatograph. To eliminate difficulties arising from blowback or distillation witthe syringe needle, one should employ the solvent flush injection technique. Tbe(01 syringe is first flushed with solvent several times to wet the barrel and plungeThree microliters of solvent are drawn into the syringe to increase the accuracy andreproducibility of the injected sample volume. The needle is removed from the sol-vent, and the plunger is pulled back about 0.2 til to separate the solvent flush from .„the sample with a pocket of air to be used as a marker. The needle is then immersedin the sample, and a 5-*J aliquot is withdrawn, taking into consideration the volumeof the needle, since the sample in the needle will be completely injected. After the T,needle b removed from the sample and prior to injection, the plunger is pulled back «*Ja short distance to minimize evaporation of the sample from the tip of the needle.Duplicate injections of each sample and standard should be made. No more tbac a Jfl I3% difference in area is to be expected. i_J
8.4.5 Measurement of area. The area of the sample peak is measured by an electronicintegrator or some other suitable form of area measurement, and preliminary results (irare read from a standard curve prepared as discussed below. ^
8.5 DetermiBadoo of Desorptioo Efficiency (,8.5.1 Importance of determination. The desorption efficiency of a particular compound can
vary from one laboratory to another and also from one batch of charcoal to another.Thus, h is necessary to determine at least once the percentage of the specific compoundthat is removed in the desorption process for a given compound, provided the samebatch of charcoal is used. NIOSH bus found that the desorption efficiencies for thecompounds in Table 1 are between 81% and 100% and vary with each batch ofcharcoal.
AR30I8U
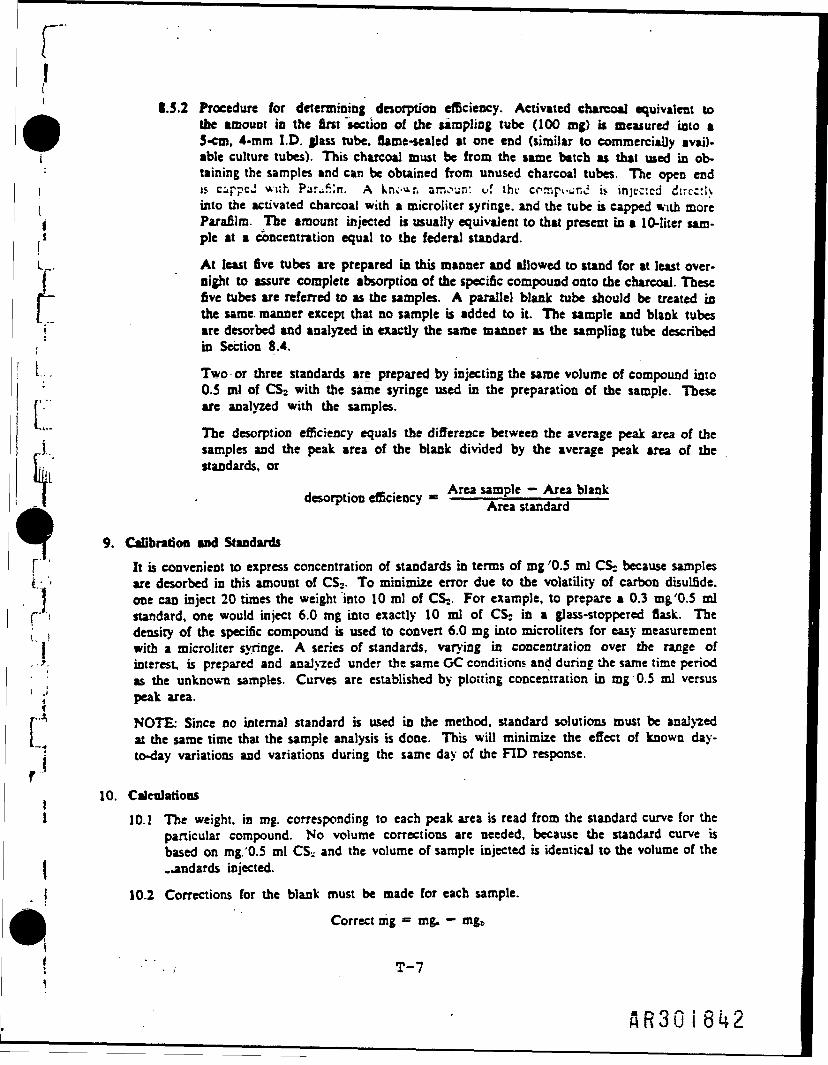
8.5.2 Procedure for determining desorption efficiency. Activated charcoal equivalent tothe amount in the first 'section of the sampling tube (100 mg) is measured into a5-cm, 4-mm I.D. glass tube, flame-sealed at one end (similar to commercially avail-able culture tubes). This charcoal must be from the same batch as that used in ob-
: taining the samples and can be obtained from unused charcoal tubes. The open endI is c-ppcJ w»h Par.if.ln. A kno*r. amount of the cpmpi._r.c ij injected d:rcct!>I into the activated charcoal with a microiiter syringe, and the tube is capped with moreI Parafilm. The amount injected is usually equivalent to that present in a 10-liter sam-i pie at a concentration equal to the federal standard.
At least five tubes are prepared in this manner and allowed to stand for at least over-night to assure complete absorption of the specific compound onto the charcoal. Thesefive tubes are referred to as the samples. A parallel blank tube should be treated inthe same, manner except that no sample is added to it. The sample and blank tubes
j are desorbed and analyzed in exactly the same manner as the sampling tube describedin Section 8.4.
Two or three standards are prepared by injecting the same volume of compound into0.5 ml of CS2 with the same syringe used in the preparation of the sample. Theseare analyzed with the samples.
The desorption efficiency equals the difference between the average peak area of theJ. samples and the peak area of the blank divided by the average peak area of the
standards, or. _ . Area sample — Area blankdesorption efficiency « ———_-*•———•;—-———r Area standard
9. Calibration and StandardsIt is convenient to express concentration of standards in terms of mg '0.5 ml CS» because samples
{• • are desorbed in this amount of CS2. To minimize error due to the volatility of carbon disulfide.1 one can inject 20 times the weight into 10 ml of CS- For example, to prepare a 0.3 mg'0.5 ml
(! standard, one would inject 6.0 mg into exactly 10 ml of CS: in a glass-stoppered flask. The, , density of the specific compound is used to convert 6.0 mg into microliters for easy measurement| with a microiiter syringe. A series of standards, varying in concentration over the range of
, •>. interest, is prepared and analyzed under the same GC conditions and during the same time period1 \ as the unknown samples. Curves are established by plotting concentration in mg 0.5 ml versus1 ;' peak area.P'*• NOTE: Since no internal standard is used in the method, standard solutions must be analyzed[ ^ at the same time that the sample analysis is done. This will minimize the effect of known day-] to-day variations and variations during the same day of the FID response.
f10. Calculations
i 10.1 The weight, in mg. corresponding to each peak area is read from the standard curve for theparticular compound. No volume corrections are needed, because the standard curve isbased on mg '0.5 ml CS- and the volume of sample injected is identical to the volume of the
i ..andards injected.I 10.2 Corrections for the blank must be made for each sample.
Correct mg "= mg. — mgt
" . , T-7
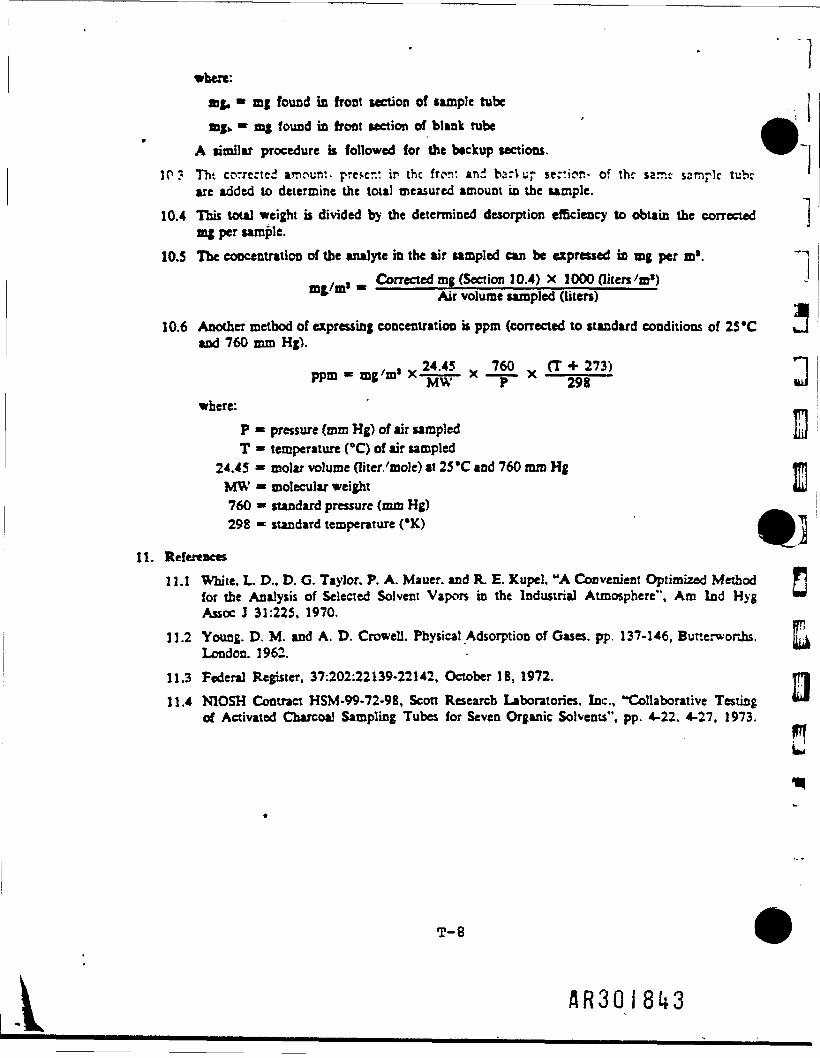
where:mg, " mg found in front section of sample tubemg*. * mg found in front section of blank tube
•A similar procedure is followed for the backup sections.
10? Tht corrected amour.:- present ir the front and bsrVuj- senior.- of the sarr.i- sample tub:are added to determine the total measured amount in the sample.
10.4 This total weight is divided by the determined desorption efficiency to obtain the correctedmg per sample.
10.5 The concentration of the analyte in the air sampled can be expressed in mg per m*./ s m Corrected mg (Section 10.4) X 1000 (liters/m*)
*• Air volume sampled (liters)
10.6 Another method of expressing concentration is ppm (corrected to standard conditions of 25 "Cand 760 mm Hg).
, , v 24.45 _, 760 __ (T + 273)ppm « mg/m x-j x -__ x 29g
where:P m pressure (mm Hg) of air sampledT * temperature (°C) of air sampled
24.45 * molar volume (liter/mole) at 25 °C and 760 mm HgMW - molecular weight760 » standard pressure (mm Hg)298 «» standard temperature (*K)
11. References11.1 White, L. D., D. G. Taylor. P. A. Mauer. and R. E. Kupel. "A Convenient Optimized Method
for the Analysis of Selected Solvent Vapors in the Industrial Atmosphere", Am Ind HygAssoc J 31:225, 1970.
11.2 Young. D. M. and A. D. Crowell. Physical Adsorption of Gases, pp. 137-146, Butterwonijs.London. 1962.
11.3 Federal Register, 37:202:22139-22142, October 18, 1972.11.4 NIOSH Contract HSM-99-72-98, Scott Research Laboratories, Inc., "Collaborative Testing
of Activated Charcoal Sampling Tubes for Seven Organic Solvents", pp. 4-22, 4-27, 1973.
a
T-8
AR30I8W
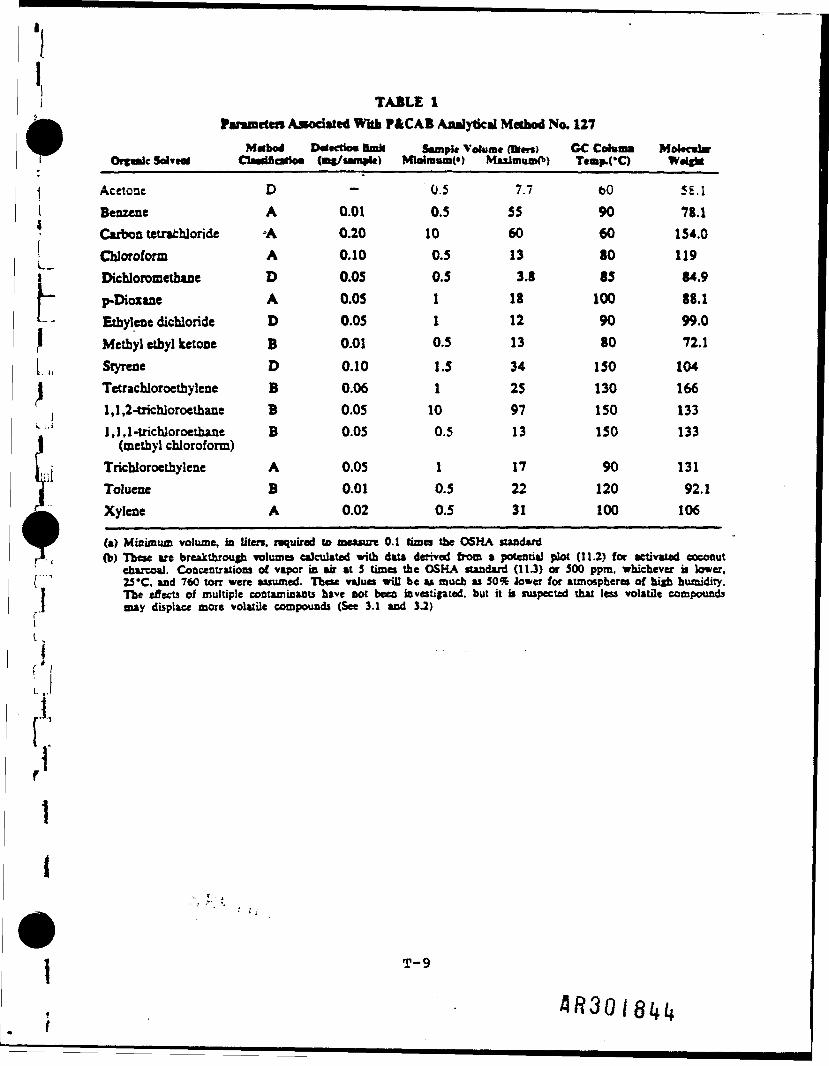
TABLE 1Parameters Associated With PftCAB Analytical Method No. 127
Metbo. D-tctio-j Hmk Sample VoJura* (ttm) GC Catania Mol-rwl-rOrgnic Solveot CU.dfic.rio* (Bg/twru»t«> MlaimooK*) Maximum^) Ttap.CC) Weight
\ Acetone D - 0.5 7.7 oO SE.li Benzene A 0.01 0.5 55 90 78.1* Carbon teirachloride A 0.20 10 60 60 154.0' Chloroform A 0.10 0.5 13 80 119! Dichloromethane D 0.05 0.5 3.8 85 84.9
p-Dioxane A 0.05 1 18 100 88.1Ethylene dichloride D 0.05 1 12 90 99.0Methyl ethyl ketone B 0.01 0.5 13 80 72.1
[ „ Sryrene D 0.10 1.5 34 150 104I Tetrachloroethylene B 0.06 1 25 130 166
j 1,1,2-trichloroethane B 0.05 10 97 ISO 1331,1.1-UicbJoroetnane B 0.05 0.5 13 150 133(methyl chloroform)
Tricnloroethylene A 0.05 1 17 90 131Toluene B 0.01 0.5 22 120 92.1Xylene A 0.02 0.5 31 100 106
(a) Minimum volume, in liters, raquired to measure 0.1 times the OSHA standard(b) These are breakthrough volumes calculated with data derived from a potential plot (11.2) for activated coconut
\ __ charcoal. Concentrations of vapor in air at 5 times the OSHA standard (11.3) or 500 ppm, whichever is lower,[ " JVC, and 760 torr were assumed. These values will be as much as 50% lower for atmospheres of high humidity.I T h e effects of multiple contaminants have not been investigated, but it b suspected that less volatile compounds
may displace more volatile compounds (See 3.1 and 3.2)l
L,.
4,
1
I
T-9
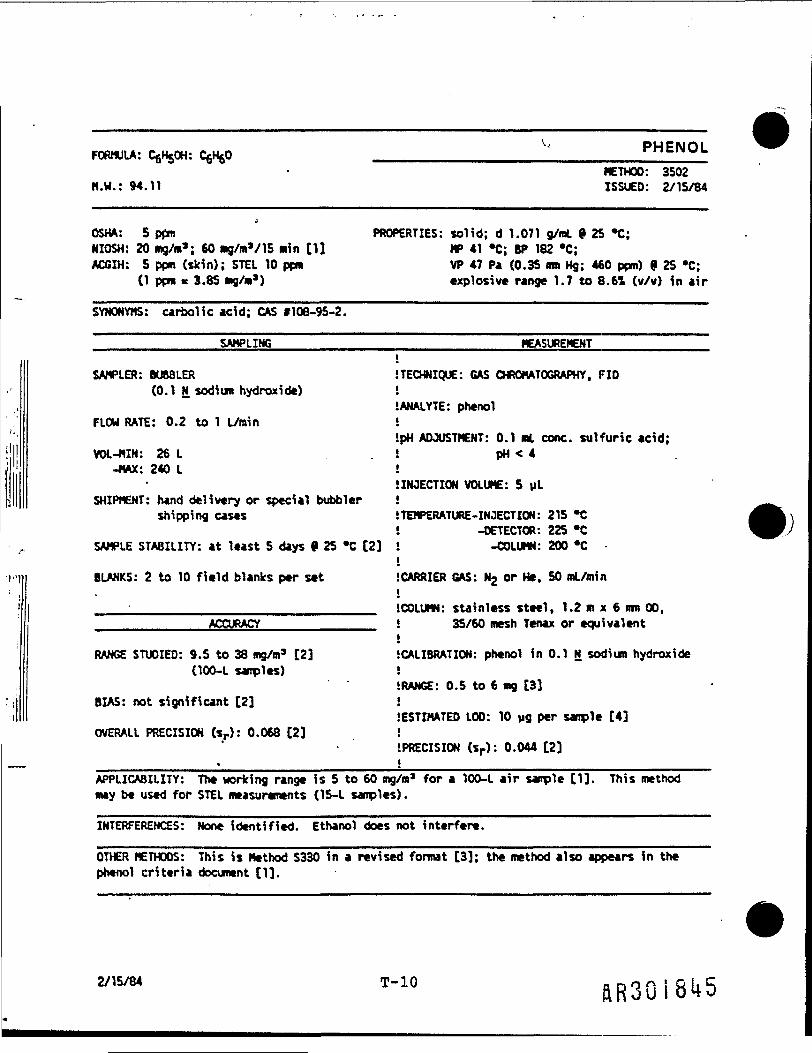
FORMULA: CgHgOH: CgHjO ________________j________PHENOLHETHOO: 3502
H.W.: 94.11 ISSUED: 2/15/84
J
OSHA: 5 ppm PROPERTIES: solid; d 1.071 g/mL 9 25 *C;HIOSH: 20 »3/m3; SO sig/.«*/15 win [1] HP 41 «C; BP 182 »C;ACGIH: S ppm (skin); STEL 10 pen VP 47 Pa (0.35 am Hg; 460 pom) 9 25 *C;
(1 pen * 1.85 *g/»3) explosive range 1.7 to 8.6% (v/v) in air
SYNONYMS: carbolic acid; CAS f108-95-2.
2 SAMPLING MEASUREMENTi•
SAMPLER: BUBBLER !TECHNIQUE: GAS CHROMATOGRAPHY, FID(0.1 £ sodium hydroxide) !
.ANALYTE: phenolFLOW RATE: 0.2 to 1 L/min !
!pH ADJUSTMENT: 0.1 at cone, suIfuric acid;VOL-MIN: 26 L . . pH < 4
-MAX: 240 L !!INJECTION VOLUME: S uL
SHIPMENT: hand delivery or special bubbler !shipping cases !TEMPERATURE-INJECTION: 215 *C
! -DETECTOR: 225 »CSAMPLE STABILITY: at least S days t 25 *C [23 ! -COLUMN: 200 *C
i•BLANKS: 2 to 10 field blanks per sat !CARRIER GAS: N2 or He. SO mL/min
i__ ______________________ .COLUMN: stainless steel, 1.2 m x 6 mm 00,__________ACCURACY___________ ! 35/60 mesh Tenax or equivalent
i•RANGE STUDIED: 9.5 to 38 mg/m3 [2] iCALIBRATION: phenol in 0.1 N sodium hydroxide
(100-L s-ip1«s) !iRANGE: 0.5 to 6 mg [3]
BIAS: not significant [2] !iESTIMATED LOO: 10 ng per sample [4]
OVERALL PRECISION (sr): 0.068 [2] !iPRECISION (sr): 0.044 [2]
____________:_________________!______________________________________APPLICABILITY: Th« working range is 5 to 60 mg/m3 for a 100-L air sanple [1]. This methodmay be used for STEL measurements (15-L samples).
INTERFERENCES: None identified. Ethanol does not interfere.
OTHER METHODS: This is Method 5330 in a revised format [3]; the method also appears in thephenol criteria document [1],
2/15/84 T-10
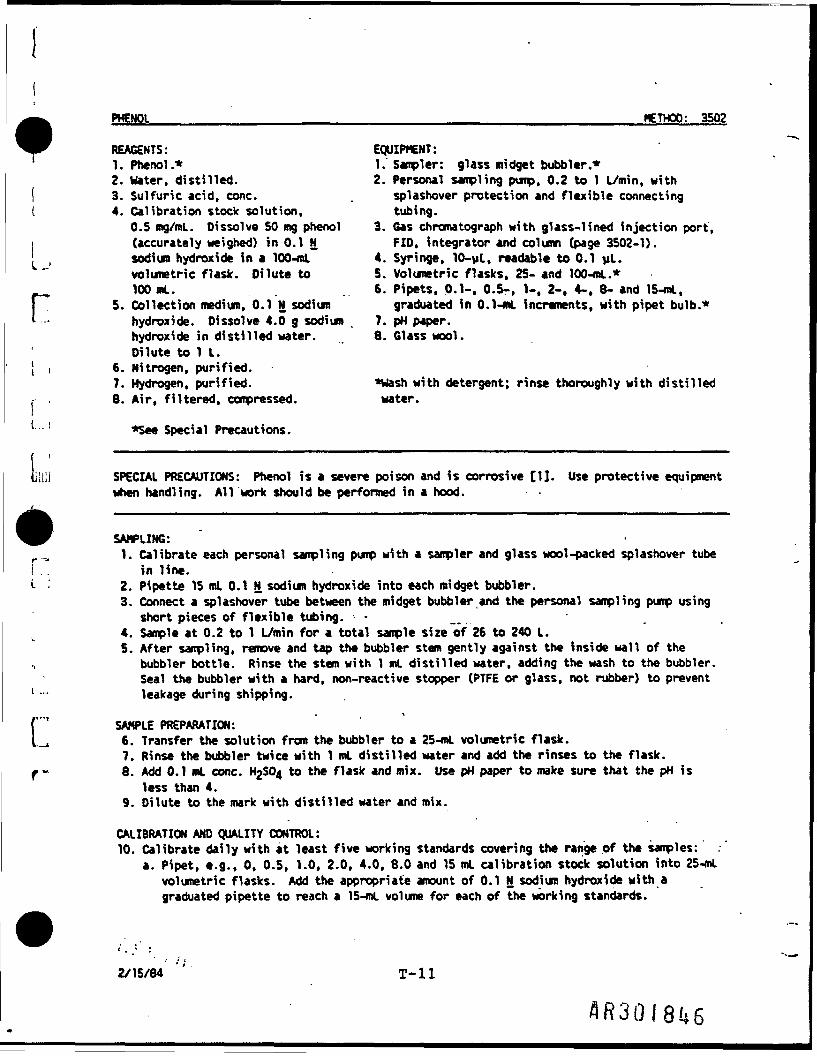
n
PHENOL___________________________________________________METHOD: 3502
REAGENTS: EQUIPMENT:1. Phenol.* 1. Sampler: glass midget bubbler.*2. Water, distilled. 2. Personal sampling pump, 0.2 to 1 L/nrin, with
( 3. Sulfuric acid, cone. . splashover protection and flexible connecting( 4. Calibration stock solution, tubing.
0.5 mg/mL. Dissolve 50 mg phenol 3. Gas chromatograph with glass-lined injection port,i (accurately weighed) in 0.1 N FID, integrator and column (page 3502-1).' , sodium hydroxide in a 100-mL 4. Syringe, 10-ul, readable to 0.1 uL.
volumetric flask. Dilute to S. Volumetric flasks, 25- and 100-mL.*100 mL. . .6. Pipets, 0.1-, 0.5-, 1-, 2-, 4-, 8- and 15-mL,
5. Collection medium, 0.1 N sodium graduated in 0.1-mL increments, with pipet bulb.*hydroxide. Dissolve 4.0 g sodium 7. pH paper.hydroxide in distilled water. 8. Glass wool.Dilute to 1 L.
6. Nitrogen, purified.7. Hydrogen, purified. *Wash with detergent; rinse thoroughly with distilled8. Air, filtered, compressed. water.
*See Special Precautions.
SPECIAL PRECAUTIONS: Phenol is a severe poison and is corrosive [1]. Use protective equipmentwhen handling. All work should be performed in a hood.
SAMPLING:r., 1. Calibrate each personal sampling pump with a sampler and glass wool-packed splashover tubei in line.i •' 2. Pipette 15 mL 0.1 N sodium hydroxide into each midget bubbler.
3. Connect a splashover tube between the midget bubbler and the personal sampling pump usingshort pieces of flexible tubing. •
4. Sonple at 0.2 to 1 L/min for a total sarple size "of 26 to 240 L.5. After saipling, remove and tap the bubbler stem gently against the inside wall of the
bubbler bottle. Rinse the stem with 1 mL distilled water, adding the wash to the bubbler.Seal the bubbler with a hard, non-reactive stopper (PTFE or glass, not rubber) to prevent
1 ••- leakage during shipping.
('"' SAMPLE PREPARATION:L_j 6. Transfer the solution from the bubbler to a 25-mL volumetric flask.
7. Rinse the bubbler twice with 1 mL distilled water and add the rinses to the flask.r- 8. Add 0.1 ml cone. H_S04 to the flask and mix. Use pH paper to make sure that the pH is
less than 4.9. Dilute to the mark with distilled water and mix.
CALIBRATION AND QUALITY CONTROL:10. Calibrate daily with at least five working standards covering the range .of the samples:
a. Pipet, e.g., 0, 0.5, 1.0, 2.0, 4.0, 8.0 and 15 mL calibration stock solution into 25-mLvolumetric flasks. Add the appropriate amount of 0.1 N sodium hydroxide with agraduated pipette to reach a 15-mL volume for each of the working standards.
2/15/84 '' T-ll
AR30I8I*6
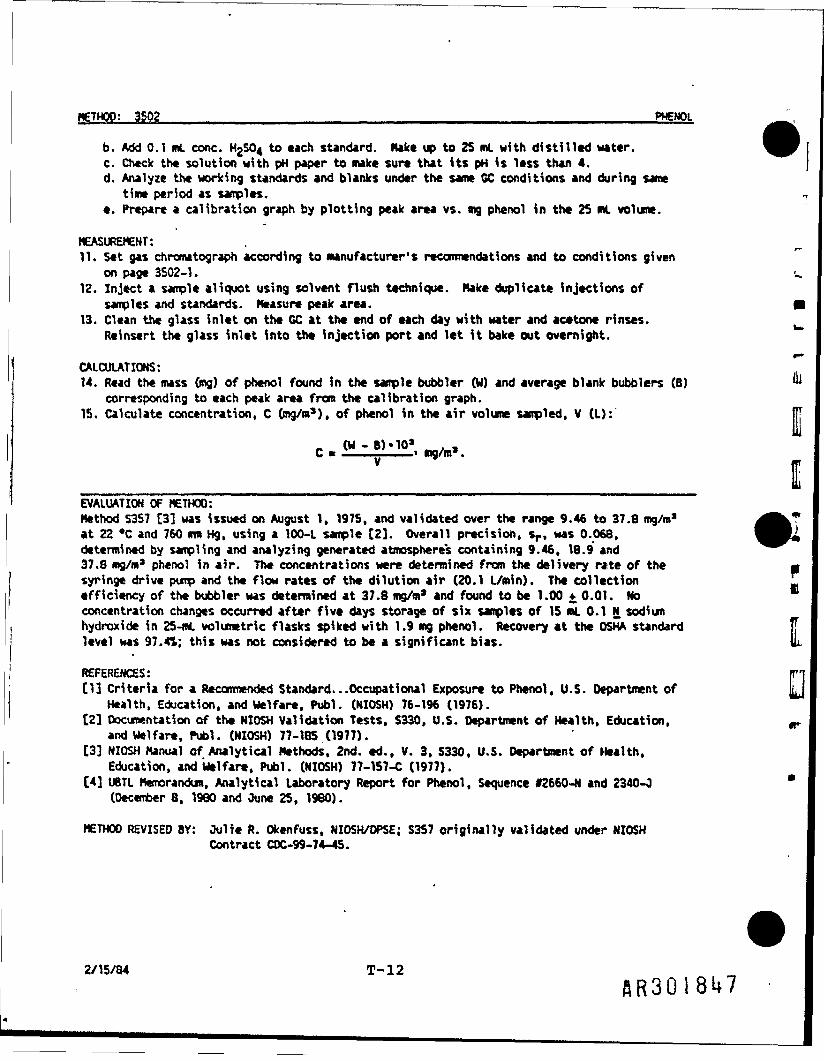
METHOD: 3SQ2 ___________________________________________________ PHENOL
b. Add 0.1 mL cone. H2S04 to each standard. Make up to 25 mL with distilled water.c. Check the solution with pH paper to make sure that its pH is less than 4.d. Analyze the working standards and blanks under the same GC conditions and during same
time period as samples.e. Prepare a calibration graph by plotting peak area vs. mg phenol in the 25 mL volume.
MEASUREMENT:11. Set gas chrcmitograph according to manufacturer's reconmendations and to conditions given
on page 3502-1.12. Inject a sample aliquot using solvent flush technique. Make duplicate injections of
samples and standards. Measure peak area.13. Clean the glass inlet on the GC at the end of each day with water and acetone rinses.
Reinsert the glass inlet into the injection port and let it bake out overnight.
CALCULATIONS:14. Read the mass (mg) of phenol found in the sample bubbler (W) and average blank bubblers (B)
corresponding to each peak area from the calibration graph.15. Calculate concentration, C (mg/m3), of phenol in the air volume sampled, V (L):
IEVALUATION OF METHOD:Method S357 [3] was issued on August 1, 1975, and validated over the range 9.46 to 37.8 mg/m3at 22 *C and 760 mm Hg, using a 100-L sample [2]. Overall precision, sr, was 0.068.determined by sampling and analyzing generated atmospheres containing 9.46, 18.9 and37.8 mg/m1 phenol in air. The concentrations were determined from the delivery rate of the •syringe drive pump and the flow rates of the dilution air (20.1 L/min). The collection L,efficiency of the bubbler was determined at 37.8 mg/m3 and found to be 1.00 + 0.01. No *concentration changes occurred after five days storage of six samples of 15 mL 0.1 N sodiumhydroxide in 25-mL volumetric flasks spiked with 1.9 mg phenol. Recovery at the OSHA standard j[level was 97.41; this was not considered to be a significant bias. tk
REFERENCES:[1] Criteria for a Recommended Standard. . .Occupational Exposure to Phenol, U.S. Department of
Health, Education, and Welfare. Publ. (NIOSH) 76-196 (1976).[2] Documentation of the NIOSH Validation Tests. S330, U.S. Department of Health, Education,
and Welfare, Publ. (NIOSH) 77-185 (1977).[3] NIOSH Manual of Analytical Methods, 2nd. ed., V. 3. 5330, U.S. Department of Health.
Education, and Welfare, Publ. (NIOSH) 77-157-C (1977).[4] UBTL Memorandum, Analytical Laboratory Report for Phenol, Sequence f2660-N and 2340-0
(December 8, 1980 and June 25, I960) .
METHOD REVISED BY: Oulie R. Okenfuss. NIOSH/DPSE; S357 originally validated under NIOSHContract COC-99-74-45.
2/15/84 T-l 2ftR3QI8U7
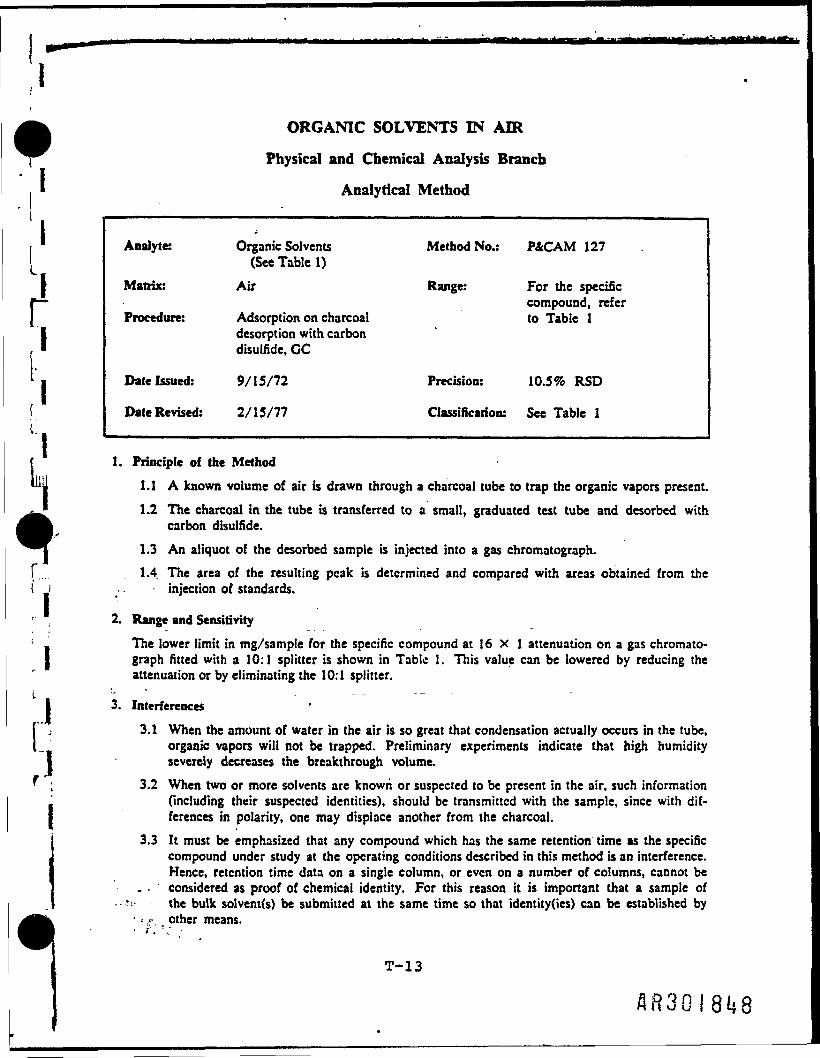
:i
ORGANIC SOLVENTS IN AIR
Physical and Chemical Analysis Branch
Analytical Method
Analyte: Organic Solvents Method No.: P&CAM 127(See Table 1)
Matrix: Air Range: For the specificcompound, refer
Procedure: Adsorption on charcoal to Table 1desorption with carbondisulfide, CC
Date Issued: 9/15/72 Precision: 10.5% RSD
Date Revised: 2/15/77 Classification: See Table 1
1. Principle of the Method
1.1 A known volume of air is drawn through a charcoal tube to trap the organic vapors present.1.2 The charcoal in the tube is transferred to a small, graduated test tube and desorbed with
carbon disulfide.1.3 An aliquot of the desorbed sample is injected into a gas chromatograph.
[. 1.4 The area of the resulting peak is determined and compared with areas obtained from thei i injection of standards.
2. Range and Sensitivity
The lower limit in mg/sample for the specific compound at 16 X 1 attenuation on a gas chromato-graph fitted with a 10:1 splitter is shown in Table 1. This value can be lowered by reducing theattenuation or by eliminating the 10:1 splitter.
3. Interferences
I
I1 3 . 1 When the amount of water in the air is so great that condensation actually occurs in the tube,_f organic vapors will not be trapped. Preliminary experiments indicate that high humidityI severely decreases the breakthrough volume.
m «*
' ; 3.2 When two or more solvents are known or suspected to be present in the air, such information(including their suspected identities), should be transmitted with the sample, since with dif-ferences in polarity, one may displace another from the charcoal.
3.3 It must be emphasized that any compound which has the same retention time as the specificcompound under study at the operating conditions described in this method is an interference.Hence, retention time data on a single column, or even on a number of columns, cannot beconsidered as proof of chemical identity. For this reason it is important that a sample of
• •'-'••• the bulk solvent(s) be submitted at the same time so that identity(ies) can be established by• • .<• other means.• i'".' V •
T-13
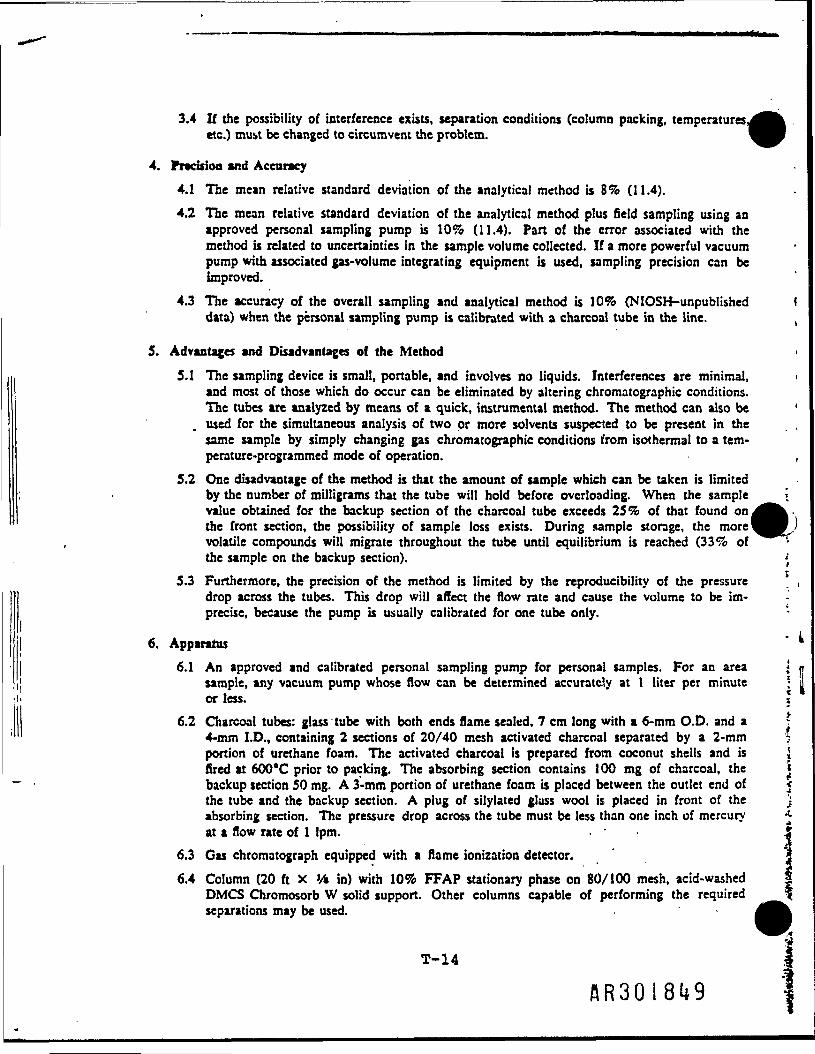
3.4 If the possibility of interference exists, separation conditions (column packing, temperaturesetc.) must be changed to circumvent the problem.
4. Predfioa and Accuracy4.1 The mean relative standard deviation of the analytical method is 8% (11.4).4.2 The mean relative standard deviation of the analytical method plus field sampling using an
approved personal sampling pump is 10% (11.4). Pan of the error associated with themethod is related to uncertainties in the sample volume collected. If a more powerful vacuumpump with associated gas-volume integrating equipment is used, sampling precision can beimproved.
4.3 The accuracy of the overall sampling and analytical method is 10% (NIOSH-unpublisheddata) when the personal sampling pump is calibrated with a charcoal tube in the line.
5. Advantages and Disadvantages of the Method5.1 The sampling device is small, portable, and involves no liquids. Interferences are minimal,
and most of those which do occur can be eliminated by altering chromatographic conditions.The tubes are analyzed by means of a quick, instrumental method. The method can also beused for the simultaneous analysis of two or more solvents suspected to be present in thesame sample by simply changing gas chromatographic conditions from isothermal to a tem-perature-programmed mode of operation.
5.2 One disadvantage of the method is that the amount of sample which can be taken is limitedby the number of milligrams that the tube will hold before overloading. When the samplevalue obtained for the backup section of the charcoal tube exceeds 25% of that found onthe front section, the possibility of sample loss exists. During sample storage, the morevolatile compounds will migrate throughout the tube until equilibrium is reached (33% ofthe sample on the backup section). »
5.3 Furthermore, the precision of the method is limited by the reproducibility of the pressuredrop across the tubes. This drop will affect the flow rate and cause the volume to be im- -precise, because the pump is usually calibrated for one tube only.
6. Apparatus6.1 An approved and calibrated personal sampling pump for personal samples. For an area <
sample, any vacuum pump whose flow can be determined accurately at I liter per minute •or less. \
6.2 Charcoal tubes: glass tube with both ends flame sealed, 7 cm long with a 6-mm O.D. and a r4-mm I.D., containing 2 sections of 20/40 mesh activated charcoal separated by a 2-mm ;portion of urethane foam. The activated charcoal is prepared from coconut shells and is ifired at 6008C prior to packing. The absorbing section contains 100 mg of charcoal, the \backup section SO mg. A 3-mm portion of urethane foam is placed between the outlet end of <the tube and the backup section. A plug of silylated glass wool is placed in front of the jabsorbing section. The pressure drop across the tube must be less than one inch of mercury *at a flow rate of 1 1pm. • • \
6.3 Gas chromatograph equipped with a flame ionization detector. ' 1'6.4 Column (20 ft X V. in) with 10% FFAP stationary phase on 80/100 mesh, acid-washed
DMCS Chromosorb W solid support. Other columns capable of performing the requiredseparations may be used.
T-14
I-"' 6.5 A mechanical or electronic integrator or a recorder and some method for determining peak'~ area.
• 6.6 Microcentrifuge tubes, 2.5 ml, graduated.6.7 Hamilton syringes: 10 /.I, and convenient sizes for making standards.6.8 Pipcts: 0.5-ml delivery pipets or 1.0-ml type graduated in 0.1-ml increments.6.9 Volumetric flasks: 10 ml or convenient sizes for making standard solutions.
7. Reagents • t .7.1 Spectroquaiity carbon disulfide (Matheson Coleman and Bell). ' •
... 7.2 Sample of the specific compound under study, preferably chromatoquality grade.7.3 Bureau of Mines Grade A helium. :•. .7.4 Prepurified hydrogen.
I ;| 7.5 Filtered compressed air. . .
8. Procedure " . .8.1 Cleaning of Equipment: All glassware used for the laboratory analysis should be detergent
washed and thoroughly rinsed with tap water and distilled water.8.2 Calibration of Personal Pumps. Each personal pump must be calibrated with a representa-
tive charcoal tube in the line. This will minimize errors associated with uncertainties inthe sample volume collected.
8.3 Collection and Shipping of Samples8.3.1 Immediately before sampling, the ends of the tube should be broken to provide an
r • * . opening at least one-half the internal diameter of the tube (2 mm).• . • 8.3.2 The small section of charcoal is used as a back-up and should be positioned nearest
the sampling pump. ". • .- 8.3.3 The charcoal tube should be vertical during sampling to reduce channeling through
.the charcoal.• 8.3.4 Air being sampled should not be passed through any hose or tubing before entering
the charcoal tube. • . •8.3.5 The flow, time, and/or volume must be measured as accurately as possible. The sam-
ple should be taken at a flow rate of 1 1pm or less to attain the total sample volumerequired. The minimum and maximum sample volumes that should, be collected foreach solvent are shown in Table 1. The minimum volume quoted must be collected if
• .• the desired sensitivity is to be achieved.8.3.6 The temperature and pressure of the atmosphere being sampled should be measured
and recorded.8.3.7 The charcoal tubes should be capped with the supplied plastic caps immediately
after sampling. Under no circumstances should rubber caps be used.• -. • 8.3.8 One tube should be handled in the same manner as the sample tube (break, seal, and:<••... . transport), except that no air is sampled through this tube. This tube should be
. labeled as a blank.•"• •. 8.3.9 Capped tubes should be packed tightly before they are shipped to minimize tube break-
age during shipping.
T-15
illlil
*
AR30I850
8.3.10 Samples of the suspected solvent(s) should be submitted to the laboratory for quali-tative characterization. These liquid bulk samples should not be transported in thesame container as the samples or blank tube. If possible, a bulk air sample (at least50 1 air drawn through tube) should be shipped for qualitative identification purposes. ••
8.4 Analysis of Samples8.4.1 Preparation "of Samples. In preparation for analysis, each charcoal tube is scored •
with a file in front of the first section of charcoal and broken open. The glass wool is •removed and discarded. The charcoal in the first (larger) section is transferred to asmall stoppered test tube. The separating section of foam is removed and discarded; •the second section is transferred to another test tube. These two sections are analyzed |separately.
8.4.2 Desorption of Samples. Prior to analysis, one-half ml of carbon disulfide is pipetted •into each test tube. (All work with carbon disulfide should be performed in a hood |because of its high toxicity.) Tests indicate that desorption is complete in 30 min-utes if the sample is stirred occasionally during this period. M
8.4.3 GC Conditions. The typical operating conditions for the gas chromatograph are: |1. 85 cc/min. (70 psig) helium carrier gas flow.2. 65 cc/min. (24 psig) hydrogen gas flow to detector.3. 500 cc/min. (50 psig) air flow to detector.4. 200*C injector temperature.5. 200*C manifold temperature (detector).6. Isothermal oven or column temperature — refer to Table 1 for specific compounds.
8.4.4 Injection. The first step in the analysis is the injection of the sample into the gaschromatograph. To eliminate difficulties arising from blowback or distillation withinthe syringe needle, one should employ the solvent flush injection technique. The 10pi syringe is first flushed with solvent several times to wet the barrel and plunger.Three microliters of solvent are drawn into the syringe to increase the accuracy and • •rcproducibility of the injected sample volume.. The needle is removed from the sol- : •vent, and the plunger is pulled back about 0.2 fJ to separate the solvent flush from ,the sample with a pocket of air to be used as a marker. The needle is then immersed ' _in the sample, and a 5-pl aliquot is withdrawn, taking into consideration the volume ' •of the needle, since the sample in the needle will be completely injected. After the ™needle is removed from the sample and prior to injection, the plunger is pulled backa short distance to minimize evaporation of the sample from the tip of the needle. ' HDuplicate injections of each sample and standard should be made. No more than a • •3% difference in area is to be expected.
8.4.5 Measurement of area. The area of the sample peak is measured by an electronic •. integrator or some other suitable form of area measurement, and preliminary results |
are read from a standard curve prepared as discussed below.
8.5 Determination of Desorption Efficiency •8.5.1 Importance of determination. The desorption efficiency of a particular compound can
vary from one laboratory to another and also from one batch of charcoal to another. _Thus, it is necessary to determine at least once the percentage of the specific compound •that is removed in the desorption process for a given compound, provided the same • •batch of charcoal is used. NIOSH has found that the desorption efficiencies for the '.'compounds in Table 1 are between 81% and 100% and vary with each batch ofcharcoal.
T-16 Ji
AR30I85J :i
1
8.5.2 Procedure for determining desorption efficiency. Activated charcoal equivalent tothe amount in the first section of the sampling tube (100 mg) is measured into a5-cm, 4-mm I.D. glass tube, flame-sealed at one end (similar to commercially avail-able culture tubes). This charcoal must be from the same batch as that used in ob-taining the samples and con be obtained from unused charcoal tubes. The open endis capped with Parafilm. A known amount of the compound is injected directly
. . into the activated charcoal with a microiiter syringe, and the tube is capped with moreParafilm. The amount injected is usually equivalent to that present in a 10-liter sam-ple at a concentration equal to the federal standard.
At feast five tubes are prepared in this manner and allowed to stand for at least over-night to assure complete absorption of the specific compound onto the charcoal. Thesefive tubes are referred to as the samples. A parallel blank tube should be treated inthe same manner except that no sample is'added to it. The sample and blank tubesare desorbed and analyzed in exactly the same manner as the sampling tube describedin Section 8.4.
4
Two or three standards are prepared by injecting the same volume of compound into0.5 ml of CSj with the same syringe used in the preparation, of the sample. Theseare analyzed with the samples. - • •• •
The dcsorption efficiency equals the difference between the average peak area of thesamples and the peak area of the blank divided by the average peak area of thestandards, or . .
. . _. . Area sample — Area blankdesorption efficiency « ————-——•—-.—— •- :Area standard *
9. Calibration and StandardsIt is convenient to express concentration of standards in terms of mg/0.5 ml CSj because samplesare desorbed in this amount of CS-. To minimize error due to the volatility of carbon disulfide,one can inject 20 times the weight into 10 ml of CS:. For example, to prepare a 0.3 mg/0.5 ml'standard, one would inject 6.0 mg into exactly 10 ml of CS- in a glass-stoppered flask. The
'- " density of the specific compound is used to convert 6.0 mg into microliters for easy measurementwith a microiiter syringe. A scries of standards, varying in concentration over the range ofinterest, is prepared and analyzed under the same GC conditions and during the same time periodas the unknown samples. Curves are established by plotting concentration in mg '0.5 ml versuspeak area. '
NOTE: Since no internal standard is used in the method, standard solutions must be analyzedat the same time that the sample analysis is done. This will minimize the effect of known day-to-day variations and variations during the same day of the FID response.
10. Calculations10.1 The weight, in mg. corresponding to each peak area is read from the standard curve for the
particular compound. No volume corrections arc needed, because the standard curve isbased on mg''0.5 ml CS.. and the volume of sample injected is identical to the volume of thestandards injected.
10.2 Corrections for the blank must be made for each sample.
Correct mg = mg. — mg(,* i: ';- :
T-17
AR301852
where:ng. « mg found in front section of sample tubemgk •* mg found in front section of blank tube
A similar procedure is followed for the backup sections.10.3 The1 corrected amounts present in the front and backup sections of the same sample tube
are added to determine the total measured amount in the sample.10.4 This total weight is divided by the determined desorption efficiency to obtain the corrected
mg per sample.10.5 The concentration of the analyte in the air sampled can be expressed in mg per m3.
/ 3 » Corrected mg (Section 10.4) X lOOOditers/m")Air volume sampled (liters)
10.6 Another method of expressing concentration is ppm (corrected to standard conditions of 25*Cand 760 mm Hg).
where:P * pressure (mm Hg) of air sampledT » temperature (*O of air sampled
24.45 * molar volume (liter/mole) at 25 9C and 760 mm HgMW •» molecular weight760 *= standard pressure (mm Hg)298 * standard temperature (°K)
II. References1 1.1 White, L. D., D. G. Taylor, P. A. Mauer. and R. E. Kupel, "A Convenient Optimized Method
for the Analysis of Selected Solvent Vapors in the Industrial Atmosphere", Am Ind HygAssoc J 31:225, 1970.
11.2 Young. D. M. and A. D. Crowell, Physical Adsorption of Gases, pp. 137-146, Buttcrworths.London, 1962.
11.3 Federal Register, 37:202:22139-22142, October 18, 1972.11.4 NIOSH Contract HSM-99-72-98, Scott Research Laboratories, Inc., "Collaborative Testing
of 'Activated Charcoal Sampling Tubes for Seven Organic. Solvents", pp. 4-22, 4-27, 1973.
A*
T-18
flR3Gi853
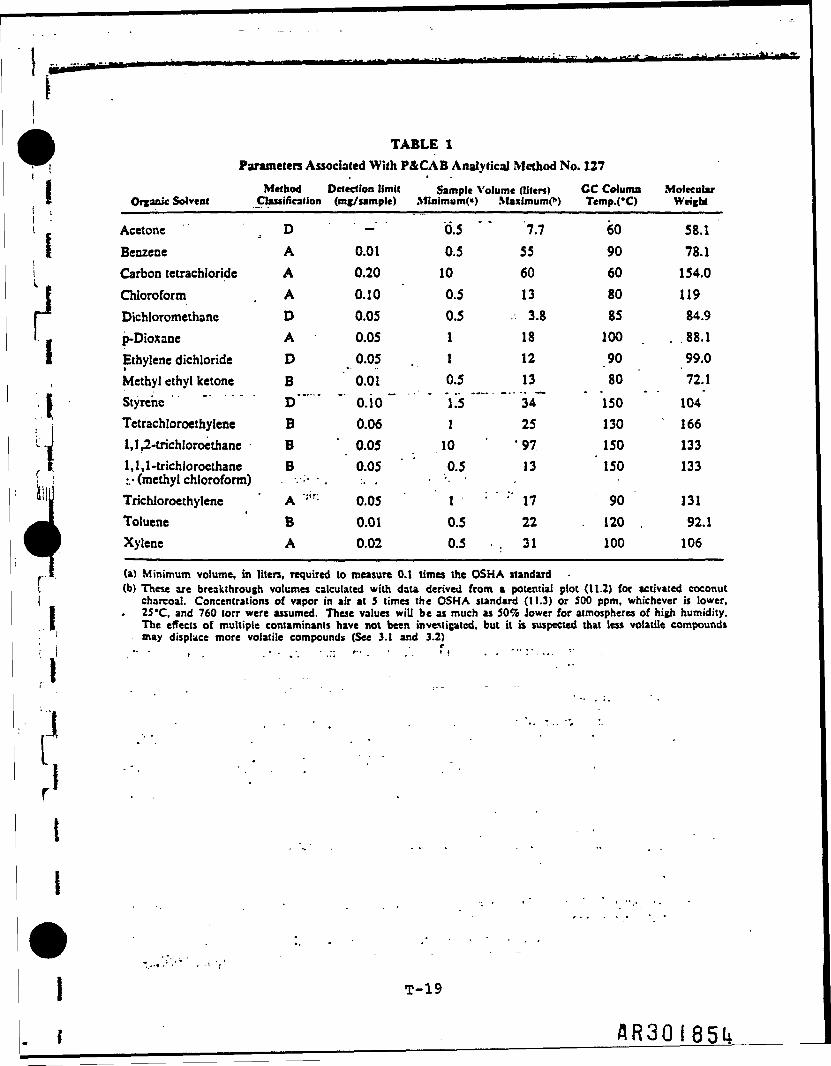
'U
TABLE 1Parameters Associated With P&CAB Analytical Method No. 127
( M e t h o d Detection limit Sample Volume (liters) C C Column MolecularOrganic Solvent Classification (mg/simple) Minimum^) Maximum^*) T«mp.(*C) Weight
i Acetone " ' a D - " 0.5 " 7.7 60 58.1I Benzene A 0.01 0.5 55 90 78.1
i Carbon tetrachloride A 0.20 10 60 60 154.0Chloroform . A 0.10 0.5 13 80 119Dichloromethanc D 0.05 0.5 3.8 85 84.9p-Dioxane A 0.05 1 18 100 . . 88.1Ethylene dichloride D 0.05 .1 12 90 99.0M ethyl ethyl ketone B 0.01 0.5 13 80 72.1Styrehe " "" ' D" " " O.JO ~ " 1.5 ' " 34~~ 150 104Tetrachloroethylene B 0.06 1 25 130 1661,1,2-trichIoroethane B " 0.05 10 ' '97 150 1331,1,1-trichloroethane B 0.05 ' ' 0.5 13 150 133:.-(methyl chloroform) ••••'• • . • : . . • •Trichloroethylenc ' A ;<r; 0.05 I : : 17 90 131Toluene B 0.01 0.5 22 . 120 . 92.1Xylene A 0.02 0.5 . 31 100 106
(a) Minimum volume, in liters, required to measure 0.1 times the OSHA standard(b) These are breakthrough volumes calculated with data derived from a potential plot (11.2) for activated coconut
charcoal. Concentrations of vapor in air at 5 times the OSHA standard (11.3) or 500 ppm, whichever is lower,25*C, and 760 torr were assumed. These values will be as much as 50% Jower for atmospheres of high humidity.The effects of multiple contaminants have not been investigated, but it is suspected that less volatile compoundsmay displace more volatile compounds (See 3.1 and 3.2)
i
I
T-19
AR30I8514
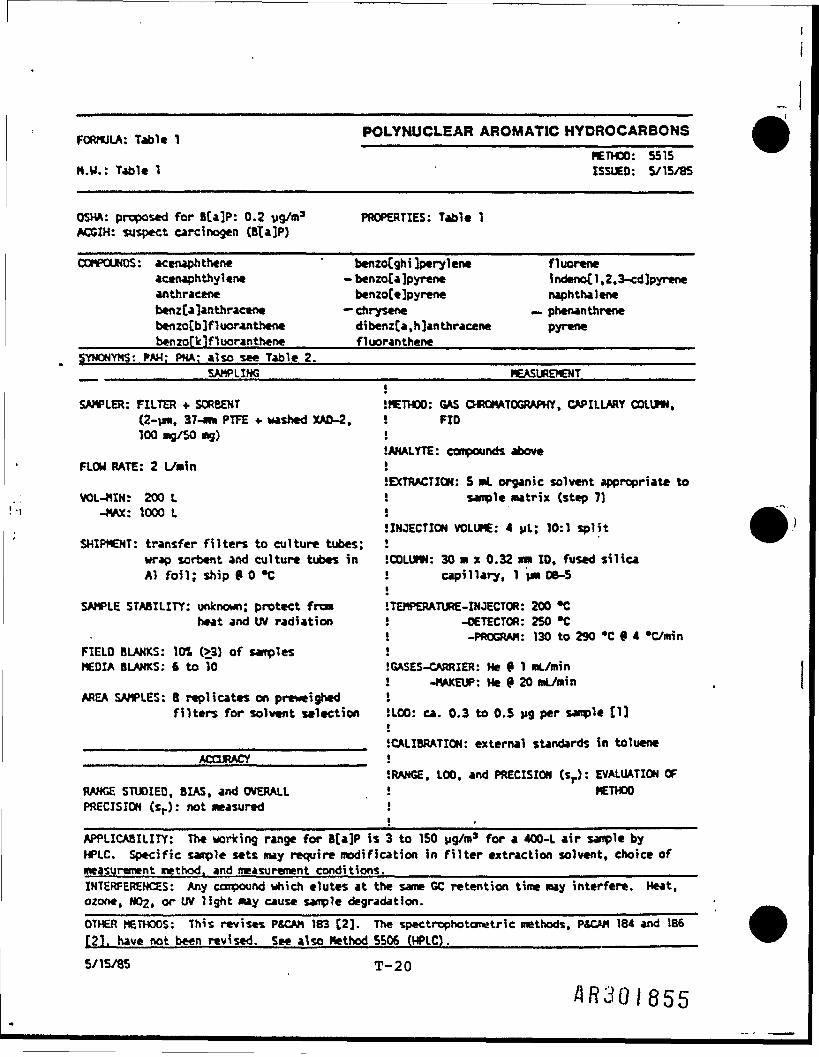
TO., , POLYNUCLEAR AROMATIC HYDROCARBONS. TAD 1C 1 ____________ ____________________ __________METHOD: 5515
N.W.: Table 1 ISSUED: 5/15/85
OSHA: proposed for Bfa]P: 0.2 vS/«3 PROPERTIES: Table 1ACGIH: suspect carcinogen (Sfa]P)
OJMPOUNOS: * c e r u p h t h e n e ' benzoCghiIperylenefluoreneacenaphthylene -benzoCajpyrene indenoC1.2,3-cd]pyreneanthracene benzoCe]pyrene naphthalenebenztalanthracene —chrysene — phenanthrenebenzo[b]fluoranthene dibenzta,h]anthracene pyrenebenzoQlfl uoranthene_______fluoranthene
SYNONYMS: PAH; PNA; also see Table 2.SAMPLING
SAMPLER: FILTER + SORBENT(2-uJ*. 37-«m PTFE * washed XAO-2.100 Mg/SO »g)
FLOW RATE: 2 l/»in
VOL-«IN: 200 L-WAX: 1000 t
SHIPMENT: transfer filters to culture tubes;wrap sorbent and culture tubes inAl foil; ship 9 0 *C
SAMPLE STABILITY: unknown; protect fromheat and UV radiation
FIELD BLANKS: 101 (>3) of sarplesMEDIA BLANKS: 6 to To
AREA SAMPLES: 8 replicates on preweighedfilters for solvent selection
ACCURACY
RANGE STUDIED, BIAS, and OVERALLPRECISION (sr) : not measured
MEASUREMENTi••METHOD: GAS OftOMATOGRAPHY. CAPILLARY COLUMN,! FIO1•
.AMALYTE: compounds abovei••EXTRACTION: S ML organic solvent appropriate to* sample matrix (step 7}i••INJECTION VOLUME: 4 yL; 10:1 spliti! COLUMN: 30 m x 0.32 m ID, fused silica! capillary, 1 IM 06-5•
ITEMPERATURE-INJECTOR: 200 *C! -DETECTOR: 250 "C! -PROGRAM: 130 to 290 "C 9 4 •C/min;iGASES-CARRIER: He 9 1 mL/min! -MAKEUP: He 9 20 mL/mini•!LOO: c_. 0.3 to O.S V9 per s-nple [1]1•
.CALIBRATION: external standards in toluenei.RANGE. LOO, and PRECISION (sp): EVALUATION OF• METHODi•i
APPLICABILITY: The working range for B[*]P is 3 to 150 pg/m3 for a 400-1 air s-nc-le byHPLC. Specific sample sets may require modification in filter extraction solvent, choice of-easuranent nethod. and measurement conditions.INTERFERENCES: Any corpound which elutes at the sane GC retention time may interfere. Heat,ozone, H02, or UV light may cause sanple degradation.OTHER METHODS: This revises PSCAM 183 [2]. The spectrophotcmetric methods, P4CAM 184 and[21. have not been revised. See also Method S506 (HPLC).
186
5/1S/85 T-20
SR30I855
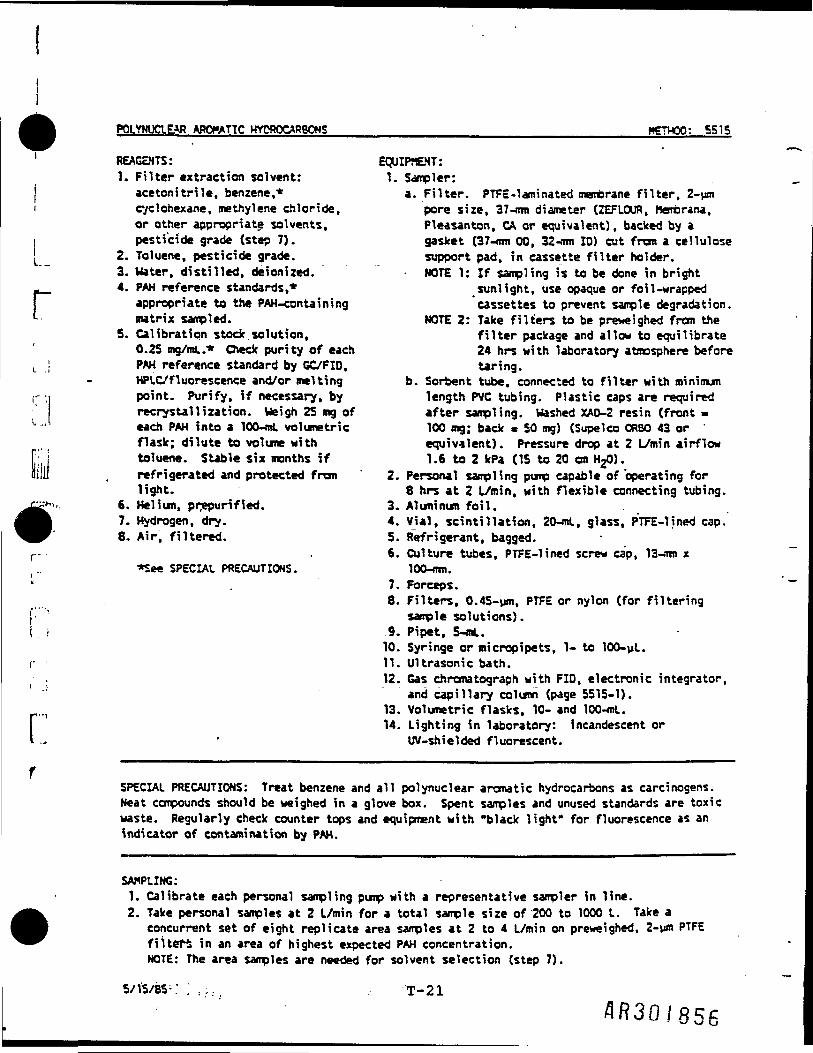
r
r:
POLYNUCIEAR AROMATIC HYDROCARBONS____________________________________METHOD: 5515
REAGENTS: EQUIPMENT:1. Filter extraction solvent: 1. S<-ipler:
acetonitrile, benzene,* a. Filter. PTFE-laminated membrane filter, 2-pmcyclohexane, methylene chloride, pore size, 37-n-i diameter (2EFLOUR, Merrcrana,or other appropriate solvents, Pleasanton, CA or equivalent), backed by apesticide grade (step 7). gasket (37-nm 00, 32-mn ID) cut from a cellulose
2. Toluene, pesticide grade. support pad, in cassette filter holder.3. Water, distilled, deionized. NOTE 1: If sampling is to be done in bright4. PAH reference standards,* sunlight, use opaque or foil-wrapped
appropriate to the PAH-containing 'cassettes to prevent sample degradation.matrix sampled. NOTE 2: Take filters to be preweighed from the
S. Calibration stock solution, filter package and allow to equilibrate0.25 mg/im..* Check purity of each 24 hrs with laboratory atmosphere before
L | PAH reference standard by GC/FID, taring.HPLC/fluorescence and/or melting b. Sorbent tube, connected to filter with minimumpoint. Purify, if necessary, by length PVC tubing. Plastic caps are requiredrecrystallization. Weigh 25 mg of after sampling, Washed XAD-2 resin (front »each PAH into a 100-mL volumetric 100 mg; back « 50 mg) (Supelco ORBO 43 orflask; dilute to volume with equivalent). Pressure drop at 2 L/min airflowtoluene. Stable six months if 1.6 to 2 kPa (IS to 20 en H ).
. refrigerated and protected from ' 2. Personal sampling pump capable of operating forlight. 8 hrs at 2 L/min, with flexible connecting tubing.
6. Helium, pr.epurified. 3. Aluminum foil.7. Hydrogen, dry. 4. Vial, scintillation. 20-mL, glass, PTFE-lined cap.8. Air, filtered. 5. Refrigerant, bagged.
r . 6. Culture tubes, PTFE-lined screw cap, 13-om x*See SPECIAL PRECAUTIONS. 100-nm.
7. Forceps.8. Filters, 0.45-um, PTFE or nylon (for filtering
[> ' sample solutions).Li 9. Pipet, 5-mL.
10. Syringe or mi cropipets, 1- to 100-yL.f 11. Ultrasonic bath.
. 12. Gas chromatograph with FID, electronic integrator,and capillary column (page 5515-1).
13. Volumetric flasks, 10- and 100-fflL.14. Lighting in laboratory: incandescent or
UV-shielded fluorescent.
rSPECIAL PRECAUTIONS: Treat benzene and all polynuclear aromatic hydrocarbons as carcinogens.Neat compounds should be weighed in a glove box. Spent samples and unused standards are toxicwaste. Regularly check counter tops and equipment with "black light" for fluorescence as anindicator of contamination by PAH.
SAMPLING:1. Calibrate each personal sampling pun? with a representative sampler in line.2. Take personal samples at 2 L/min for a total sample size of 200 to 1000 L. Take a
concurrent set of eight replicate area samples at 2 to 4 L/min on preweighed, 2-um PTFEfilters in an area of highest expected PAH concentration.NOTE: The area samples are needed for solvent selection (step 7).
5/15/8S:: ] .... T-21
/1R30I856
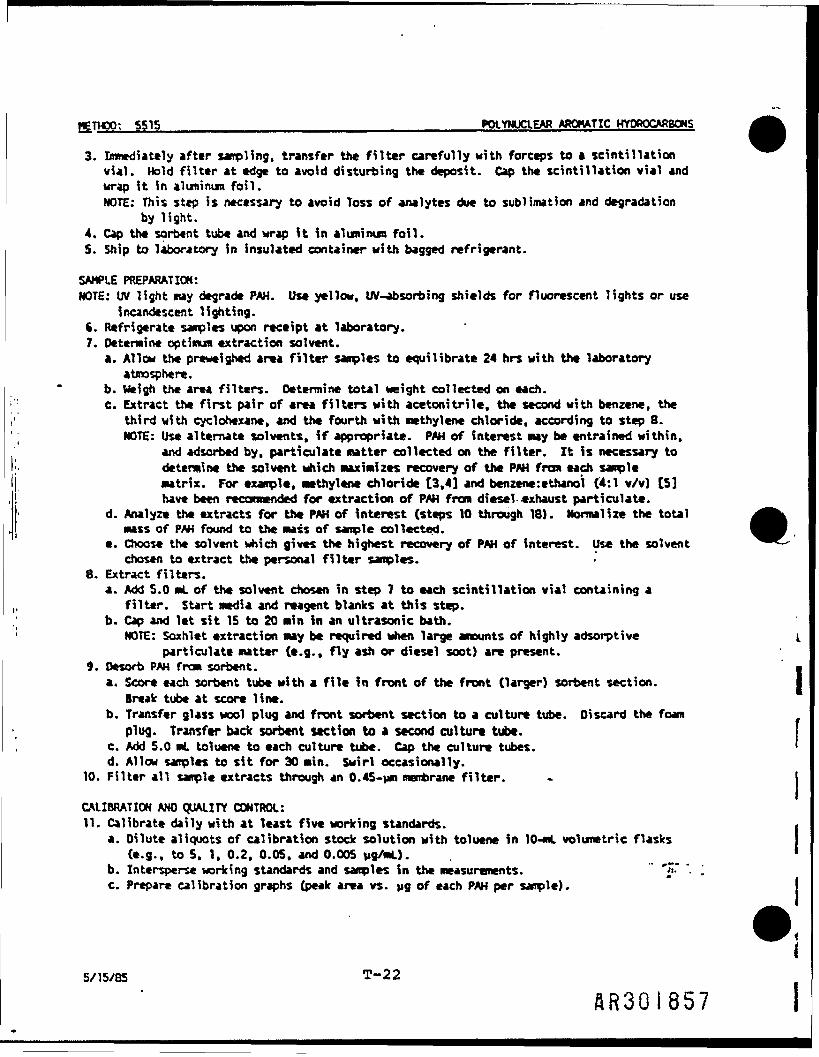
METHOD; SS15____________________________________POLYNUCLEAR AROMATIC HYDROCARBONS
3. Immediately after sampling, transfer the filter carefully with forceps to a scintillationvial. Hold filter at edge to avoid disturbing the deposit. Cap the scintillation vial andwrap it in aluminum foil.NOTE: This step is necessary to avoid Toss of analytes due to sublimation and degradation
by light.4. Cap the sorbent tube and wrap it in aluminum foil.S. Ship to laboratory in insulated container with bagged refrigerant.
SAMPLE PREPARATION:NOTE: UV light may degrade PAH. Use yellow, UV-absorbing shields for fluorescent lights or use
incandescent lighting.ft. Refrigerate samples upon receipt at laboratory.7. Determine optimum extraction solvent.
a. Allow the preweighed area filter samples to equilibrate 24 hrs with the laboratoryatmosphere.
b. Weigh the area filters. Determine total weight collected on each.c. Extract the first pair of area filters with acetonitrile, the second with benzene, the
third with cyclohexane, and the fourth with methylene chloride, according to step 8.NOTE: Use alternate solvents, if appropriate. PAH of interest may be entrained within.
and adsorbed by, particulate matter collected on the filter. It is necessary todetermine the solvent which maximizes recovery of the PAH from each samplematrix. For example, methylene chloride £3,4] and benzene:ethanoi (4:1 v/v) [51have been reccmaended for extraction of PAH from diesel exhaust particulate.
d. Analyze the extracts for the PAH of interest (steps 10 through 18). Normalize the totalmass of PAH found to the mass of sample collected.
e. Choose the solvent which gives the highest recovery of PAH of interest. Use the solventchosen to extract the personal filter samples.
8. Extract filters.a. Add 5.0 mL of the solvent chosen in step 7 to each scintillation vial containing a
filter. Start media and reagent blanks at this step.b. Cap and let sit 15 to 20 min in an ultrasonic bath.
NOTE: Soxhlet extraction may be required when large amounts of highly adsorptive tparticulate matter (e.g., fly ash or diesel soot) are present.
9. Desorb PAH from sorbent. •a. Score each sorbent tube with a file In front of the front (larger) sorbent section. I
Break tube at score line.b. Transfer glass wool plug and front sorbent section to a culture tube. Discard the foam
plug. Transfer back sorbent section to a second culture tube. Ic. Add 5.0 mL toluene to each culture tube. Cap the culture tubes. 'd. Allow samples to sit for 30 min. Swirl occasionally.
10. Filter all sample extracts through an 0.45-um membrane filter. - i
CALIBRATION ANO QUALITY CONTROL:11. Calibrate daily with at least five working standards. •
a. Dilute aliquots of calibration stock solution with toluene in 10-mL volumetric flasks ](e.g., to 5. 1. 0.2. 0.05. and 0.005 V9/«O. . '
b. Intersperse working standards and samples in the measurements. **~ *. '.c. Prepare calibration graphs (peak area vs. pg of each PAH per sample). I
5/15/85 T-22
flR30!857

POLYNUCLEAR AROMATIC HYDROCARBONS ____________ ' ______________________ METHOO: SS15
12. Recovery and desorption efficiency.a. Determine recovery (R) from filters and desorption efficiency (DE) from sorbent tubes at
least once for each lot of filters and sorbent tubes used in the range of interest.(1) Filters. Using a microiiter syringe or micropipette, spike four filters at each of
five concentration levels with calibration stock solution. Allow the filters to dryin the dark overnight. Analyze the filters (steps 8, 10, and 14 through 16).Prepare graphs of R vs. amounts found.NOTE: This step may not be used for some highly adsorptive particulate matrices for
which calibration by the method of standard additions may be more accurate.(2) Sorbent tubes. Transfer an unused front sorbent section to a culture tube. Prepare
a total of 24 culture tubes in order to measure DE at five concentration levels plusblanks in quadruplicate. Using a microiiter syringe or micropipette, addcalibration stock solution directly to sorbent. Cap culture tubes and allow to
: stand overnight. Analyze (steps 9, 10, and 14 through 16). Prepare graphs of DEj- _ vs. amounts found.
b. Check R and DE at two levels for each sample set, in duplicate. Repeat determination ofR and DE graphs if checks do not agree to within +51 of DE graph.
[ 13. Analyze at least three field blanks for each sample medium.
i.r
lilili
MEASUREMENT:14. Set GC according to manufacturer's recomnendations and to the conditions on page 5515-1:15. Inject sample aliquot. Start temperature program.16. Measure peak areas.
NOTE 1: Approximate retention times appear in Table 3.NOTE 2: If peak area is above the calibration range, dilute with appropriate solvent,
reanalyze, and apply dilution factor in calculations.NOTE 3: If sample has many interferences, additional sample cleanup may be necessary. Many
f 1 cleanup procedures have been published. Liquid-liquid partitioning betweenIf I cyclohexane and nitromethane [6,7] is widely used, but other techniques may be more
appropriate for specific samples.
CALCULATIONS:' 17. Read the mass, yg (corrected for R or DE} of each analyte found on the filter (W} and
front sorbent (Wf) and back sorbent (W ) sections, and on the average media blankfilter (B) and front sorbent (Bf) and back sorbent (BD) sections from the calibration
i. graphs.18. Calculate concentration, C (jig/m3), in air as the sum of the particulate concentration
and the vapor concentration using the actual air volume sampled, V (L).rNOTE: Wf and W^ include analyte originally collected on the filter as particulate, then
volatilized during sampling. This can be a significant fraction for many PAH (e.g.,fluoranthane, naphthalene, fluorene, anthracene, phenanthrene).
EVALUATION OF METHOD:Due to large interferences which arose while utilizing NIOSH Method P&CAM 206 for samplescollected during asphalt roofing oprations, the gas chromatographic capillary column method wasdeveloped. The GC method has been evaluated using several hundred field filter and sorbenttube sampling trains. To date, no statistical studies have been initiated. Overall, standardspiked filters and sorbent tubes have produced reproducible measurement calibration graphs.
5/15/85 T-23
flfi-30/858
METHOD.: „r 551S_____________________________________POLYNUCLEAR AROMATIC HYPROCAR8CNS
The method has been applied to the following sample matrices with semi-quantitative resultsusing three separate particulate extraction solvents (benzene, cyclohexane. acetonitrile):aluminum reduction facilities, asphalt fume, coal gasification plants, coal liquefactionplants, coal tar pitch, coke oven emissions, creosote treatment facilities, diesel exhaust,graphite electrode manufacturing, petroleum pitch, and roofing tearoff operations.
REFERENCES:CU UBTL, Inc., NIOSH Sequence f4220-0 (NIOSH, unpublished. August 10. 1964).[2] NIOSH Manual of Analytical Methods. 2nd ed.. Vol. 1, U.S. Department of Health. Education.
and Welfare, Publ. (NIOSH) 77-157-A (1977).[3] Breuer. C. H. Anal. Lett.. 17(A11). 1293-1306 (1984).[4] Zweidinger, R. I.. S. B. Tejada, 0. Oropkins, 0. Huisingh. and L. Claxton. •Characteriza-
tion of Ex tractable Organics in Diesel Exhaust Particulate,' paper presented at Syipcrsiumon Diesel Particulate Emissions Measurement Characterization, Ann Arbor, MI (1978).
[5] SwaHn, S. 3. and R. L. Williams. "Liquid Chromatographic Determination of BenzoCa]pyrenein Diesel Exhaust Particulate: Verification of the Collection and Analytical Methods,'Polynuclear Aromatic Hydrocarbons: Physical and Biological Effects. Sjorseth, A. andDennis, Eds.. Battelle Press, pp. 771-790 (I960).
[6] Wise. S. A., ft al. -Analytical Methods for the Determination of Polycyclic AromaticHydrocarbons on Air Particulate Matter," Polynuclear Aromatic Hydrocarbons: Physical andBiological Chemistry. Cook*, Dennis and Fisher, Eds., Battelle Press, pp. 919-929 (1982).
[73 Movotny. M., H. L. Lee and K. 0. Bartle. 0. Chroma tog. Sci.. 12, pp. 606-612 (1974).[8] Backup Data Report for Method 5506, Analytical Report for NIOSH Sequence 4170 (NIOSH,
DPSE, HRSB, unpublished, March 16, 1984).[91 Studt., P., liebiqs Ann. Chern.. 528 (1978). ' '
[10] Clar, E. Polycyclic Hydrocarbons. Academic Press (1964).[11] Handbook of Chemistry and Physics. 62nd ed.. CRC Press (1982);
METHOO REVISED BY: B. R. Bel inky and E. 0. Slick. NIOSH/OPSE; 0. C. Holt. 0. E. Bilak, and3. B. Perkins, UBTL. Inc.
5/15/85 T-24
SR30I859
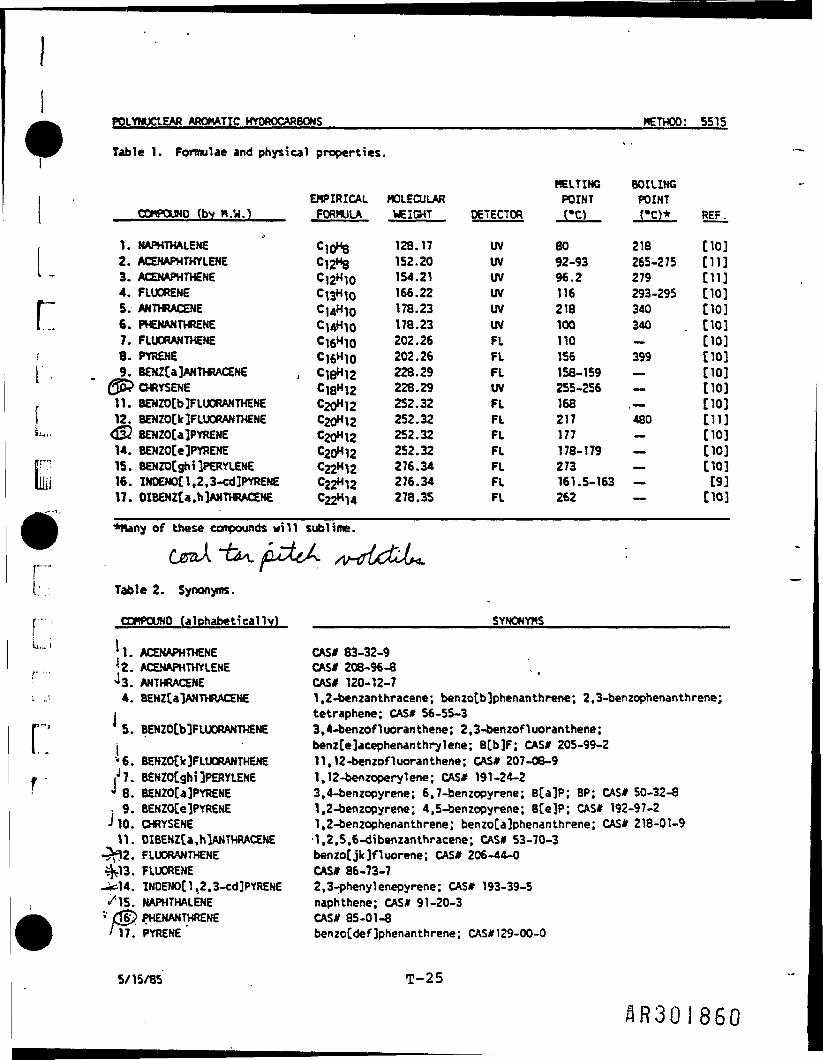
r:
POLYNUCLEAR AROMATIC HYDROCARBONS__________________________;___________METHOD: 5515
Table 1. Formulae and physical properties.I
MELTING BOILINGEMPIRICAL MOLECULAR POINT POINT
COMPOUND (by H.W.) FORMULA WEIGHT DETECTOR ('Ci (*C)* REF.
, 1. NAPHTHALENE ' C10H8 128.17 UV 80 218 [10]2. ACENAPHTHYLENE C 152.20 UV 92-93 265-275 [11]
L- 3. ACENAPHTHENE C\2H1Q '54.21 UV 96.2 279 [11]4. FLUORENE C Q 166.22 UV 116 293-295 [10]
rS. ANTHRACENE C14H10 178.23 UV 218 340 [10]6. PHENANTHRENE Ci4H10 178.23 UV 100 340 [10]7. FLUORANTHENE C Q 202.26 FL 110 — [10]
i 8. PYRENE C16H10 202.26 FL 156 399 [10]I . 9. BENZ[a]ANTHRACENE , C^^ 228.29 FL 158-159 — [10]
(55? CHRYSENE C]aHl2 228.29 UV 255-256 — [10]11. BENZO(b]FLUORANTHENE C20«12 252.32 FL 168 ,— [10]
. 12. BENZO[k]FLUORANTHENE C20"l2 252.32 FL 217 480 [11]t'-> <i32 BENZO[a]PYRENE 2X 12 252.32 FL 177 — [10]
14. BENZO[e]PYRENE C2QH12 252.32 FL 178-179 — [10]F"' 15. BENZO[ghi]PERYLENE C22H12 276.34 FL 273 — [10](jjjj 16. INOENO[1.2.3-cd]PYREN£ C22H12 276.34 FL 161.5-163 — [9]
17. OIBENZ[a.h]ANTHRACENE C22Hl4 278.35 FL 262 — [10]
*Many of these compounds will sublime.
r Table 2. Synonyms.
r COMPOUND (alphabetically) __________________SYNONYMS___________________
L"' 'l. ACENAPHTHENE CAS* 83-32-9f. ... *2. ACENAPHTHYLENE CAS* 208-96-8
*3. ANTHRACENE CAS* 120-12-7i ..'• 4. BENZ[a]ANTHRACENE 1,2-benzanthracene; benzo[b]phenanthrene; 2,3-benzophenanthrene;
i tetraphene; CAS* 56-55-3S. BENZO[b]FLUORANTHENE 3,4-benzofluoranthene; 2.3-benzofluoranthene;
j benz[e]acephenanthrylene; B[b]F; CAS* 205-99-2••6. BENZO[k]FLUORANTHENE 11,12-benzofluoranthene; CAS* 207-06-9
. iJ7. BENZO[ghi]PERYLENE 1.12-benzoperylene; CAS* 191-24-2• ^ 8. BENZO(a]PYRENE 3,4-benzopyrene; 6,7-benzopyrene; B[a]P; BP; CAS* 50-32-8
. 9. BENZO[e]PYRENE 1,2-benzopyrene; 4,5-benzopyrene; B[e]P; CAS* 192-97-2•MO. CHRYSENE 1,2-benzophenanthrene; benzoCa]phenanthrene; CAS* 218-01-911. DIBENZ[a,h]ANTHRACENE -1,2.5.6-dibenzanthracene; CAS* 53-70-3
FLUORANTHENE benzo[jk]fluorene; CAS* 206-44-0FLUORENE CAS* 86-73-7INOENO[l,2,3-cd]PYRENE 2,3-phenylenepyrene; CAS* 193-39-5
/IS. NAPHTHALENE naphthene; CAS* 91-20-3tfjj) PHENANTHRENE CAS* 85-01-8' 17. PYRENE ' benzo(def]phenanthrene; CAS*129-00-0
5/15/85 T-25
flR30I860
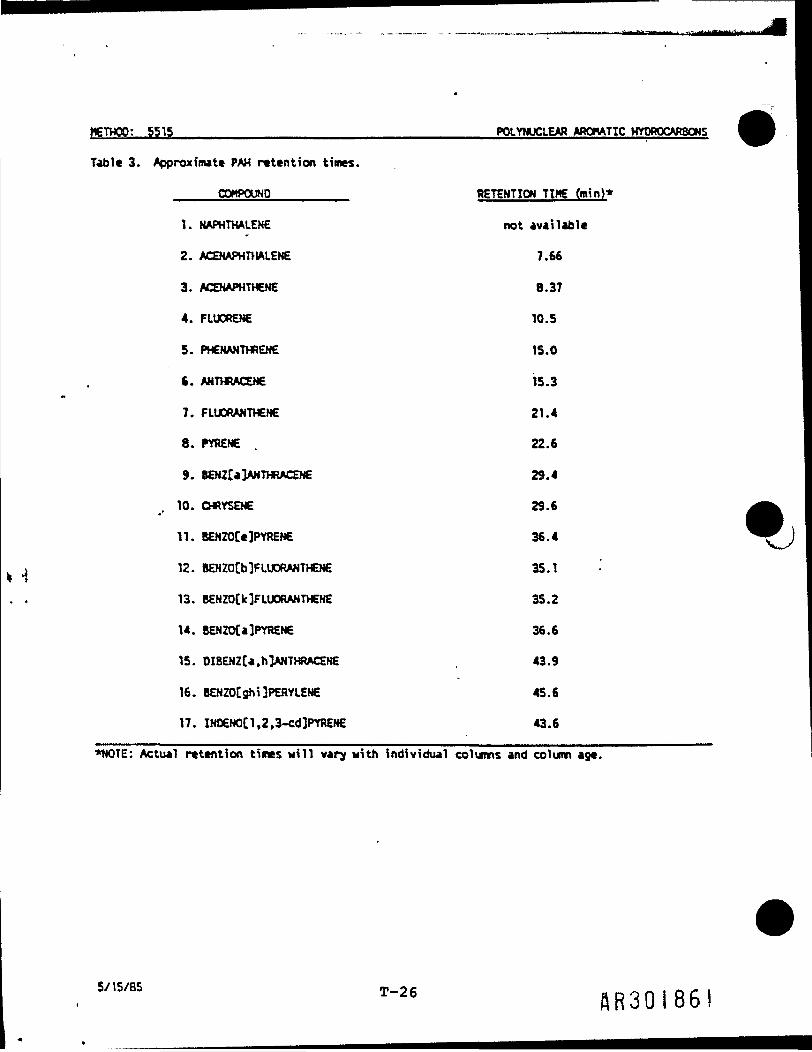
METHOD: ,5515____________________________________POLYNUCLEAR AROMATIC HYDROCARBONS
Table 3. Approximate PAH retention times.
_____COMPOUND________ RETENTION TIME (min)*
1. NAPHTHALENE not available
2. ACENAPHTHALENE 7.66
3. ACENAPHTHENE 8.37
4. FLUORENE 10.5
5. PHENANTHRENE 15.0
6. ANTHRACENE 15.3«*
7. FLUORANTHENE 21.4
8. PYRENE . 22.6
9. B£NZ[a]ANTHRACENE 29.4
10. CHRYSENE 29.6*
11. B£NZO[e]PYRENE 36.4
. , 12. BENZO[b]FLUORANTHENE 35.1t 1. . 13. BENZO[k]FLUORANTHENE 35.2
14. BENZO[a]PYRENE 36.6
IS. DIBENZ[a.h]ANTHRACENE 43.9
16. BENZO[ghi]PERYLENE 45.6
17. INOENO[l,2,3-cd]PYRENE 43.6
*NOTE: Actual retention times will vary with individual columns and column age.
S/15/85 fP_.?fi « i -. /• iT26 ftR30!86!
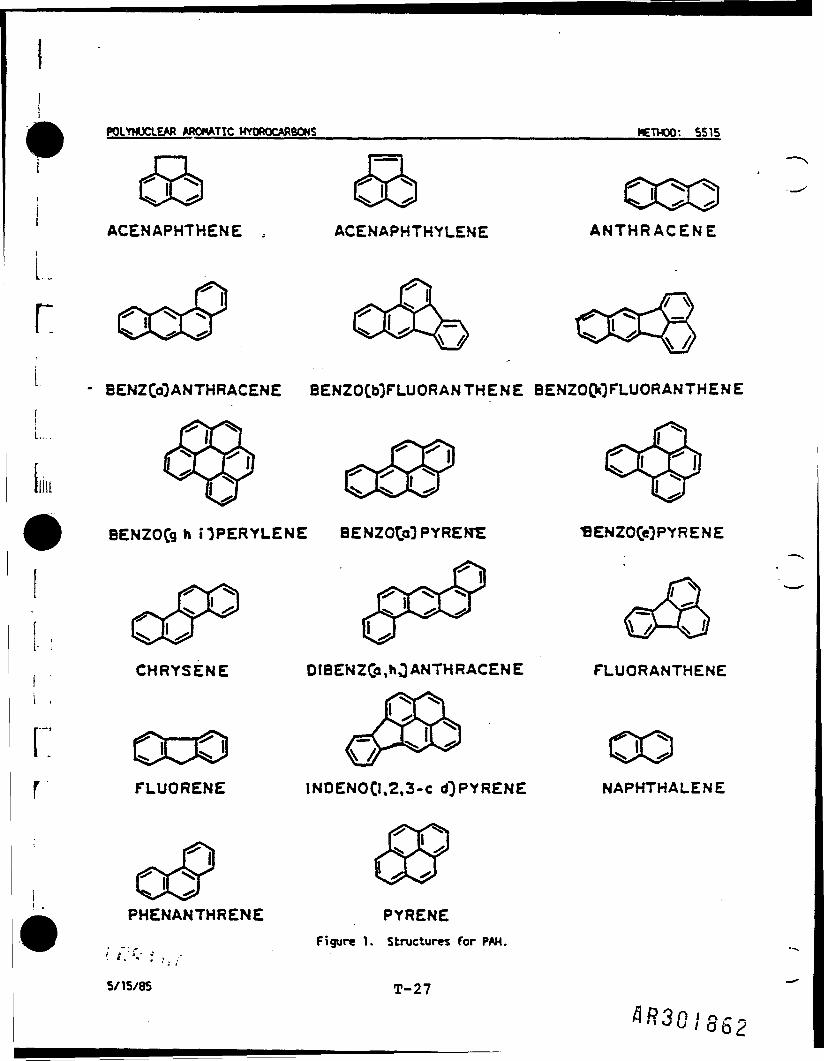
POLYNUCLEAR AROMATIC HYDROCARBONS __________ METHOO: 5515
rACENAPHTHENE , ACENAPHTHYLENE
i
- BENZCcOANTHRACENE BENZOOOFLUORANTHENE BENZOOOFLUORANTHENE
Hill
BENZOCgh HPERYLENE BENZOfcOPYRErfE BENZOQOPYRENE
CHRYSENE DIBENZCo,»»GANTHRACENE FLUORANTHENE
f FLUORENE INDENOO,2,3-c d^PYRENE NAPHTHALENE
PHENANTHRENE PYRENEFigure 1. Structures for PAH.
' '• ** ' : . /'
5/15/85 T-27

CALIBRATION PROCEDURES
Each air sampling pump shall be calibrated individually usingactual sampling trains that will only be used for calibrators.Th« pump and sampling train shall be assembled in the same manneras the sample train and pump in the field.
A primary calibration method shall be used. This will consist ofa 100 cc bubble tube for low flow samples and a one liter bubbletube for high flow samples.
Calibration shall be performed before and after sampling. Threetrials will be performed for each calibration. The trials willbe averaged for the flow rate. For the final average flow rate,the before and after calibration shall be averaged. A differenceof less than 10 percent between the beginning and ending calibra-tion shall be acceptable.
The following information shall be recorded during calibration:
1) volume measured2) pump number3) name of operator4) date of calibration5) time in total seconds of each trial6) averaged flow rates.
e
calpro.507
T"28 AR30I863
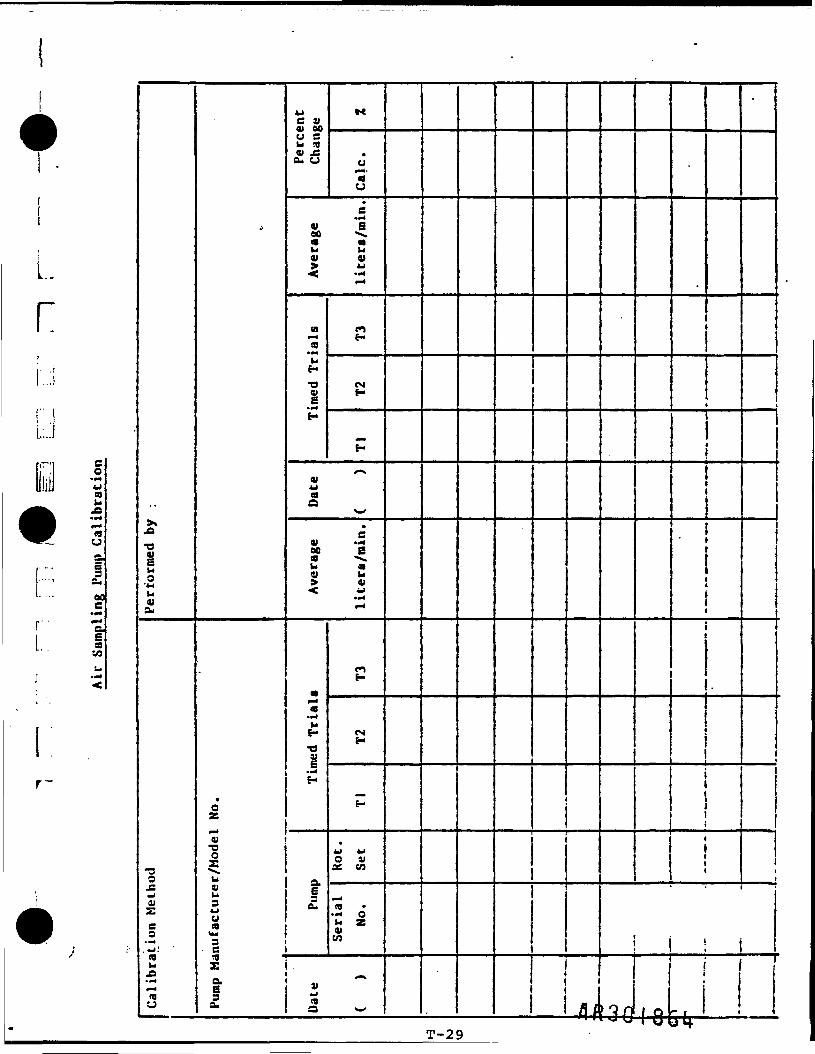
i
Lr.
j
••XW3___
ibO•wbat3u
_O
J>
e
' «'bXI• Ml
(0u
-
^0z01•oo.b0)b9U
9• C
•Q "
Za.
a.
c v0* 60U S0) 4=cu u
004bV
W
"3H•-iH
014Jtdn
0)ocbO
^
•—4<s.-Il-3J
H
aEeu
»roa
«
mu0U
s^—b0)u_4
infr*
CMt-
—H^
^e.•4
m0).— i
r,
H
—f"
O Vx tn
(8— i OW Z01CO
w1 i j
/1rnni *j y-46-
•
••••
i1
,.ji •+
.
.i —
i
!
,t•
T-29
i
t
rDliiiii
rL
DRAFT - do not quote or cite
Activity No. 4
GROUND WATER MONITORING WELL' SAMPLING PROCEDURES

r
DRAFT - do not quote or cite
GROUND WATER MONITORING WELL SAMPLING PROCEDURES
Ground water monitoring wells will be sampled according toProcedure 5619006 in the REM II Site InvestigationsProcedures Manual. Decontamination of sampling equipmentwill utilize acetone, not methanol as specified in theprocedure which follows. Samples to be analyzed fordissolved metals require field filtration prior to preserva-tion. Procedure 5617007, which follows, details theprocedure for filtration of samples.
JJl
f'
T-31
Procedure: 5619006Revision: 0Date: 4/85Page: 1 of 8
SAMPLING PROCEDURES FOR MONITORING WELLS
The following general procedures are followed during sampling ofmonitoring wells.
2.0 PRE-SAMHJNG PROCEDURES
2.1 Records
Prior to sampling, general information concerning the site, welland sampling technique should be recorded on the field recordsheet or log.
AR6-7
AR30J867
I
II1.0 INTRODUCTION
General procedures for sampling monitoring wells include pre-sanpling Vprocedures, well-evacuation, sample withdrawal, field testing of ™"parameters, and sample preparation and preservation. Certain special ^considerations for organic samples exist and are described as well. |
Sampling protocol oust be adhered to strictly to insure the collection V)of ground water samples representative of actual subsurfaceconditions. Correct procedures are particularly important athazardous materials sites, where in addition to sample integrity,other considerations such as cross-contamination, safety, and legalresponsibility are of concern.
1
DPre-sampling procedures include records, equipment, cleaning, and Rwater level measurement. In addition, the well should be checked forabove-ground or below-ground damage. £
D
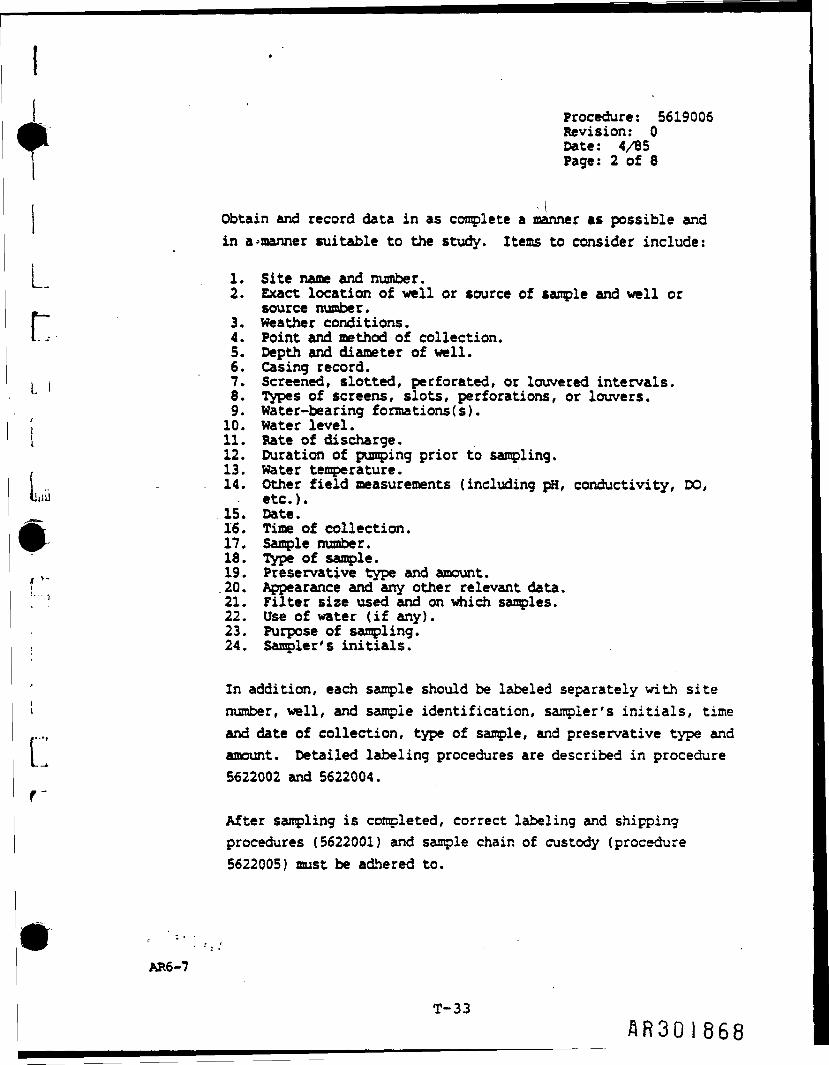
TL.
Procedure: 5619006Revision: 0Date: 4/85Page: 2 of 8
Obtain and record data in as complete a manner as possible andin a^manner suitable to the study. Items to consider include:
1. Site name and number.2. Exact location of well or source of sample and well or
source number.3. weather conditions.4. Point and method of collection.5. Depth and diameter of well.6. Casing record.7. Screened, slotted, perforated, or louvered intervals.8. Types of screens, slots, perforations, or louvers.9. Water-bearing formations(s).10. Water level.11. Rate of discharge.12. Duration of pumping prior to sampling.13. Water temperature.14. Other field measurements (including pH, conductivity, DO,
etc.).15. Date.16. Time of collection.17. Sample number.18. Type of sample.
,. 19. Preservative type and amount.f 20. Appearance and any other relevant data.!' ' 21. Filter size used and on which samples.
22. Use of water (if any).23. Purpose of sampling.
, 24. Sampler's initials.
In addition, each sample should be labeled separately with sitenumber, well, and sample identification, sampler's initials, timeand date of collection, type of sample, and preservative type andamount. Detailed labeling procedures are described in procedure5622002 and 5622004.
f 'After sampling is completed, correct labeling and shippingprocedures (5622001) and sample chain of custody (procedure5622005) must be adhered to.
AR6-7
T-33
AR30I868
Procedure: 5619006Revision: 0Date: 4/85Page: 3 of 8
2.2 Equipment
All equipment should be assembled, calibrated, and tested beforearriving at the site. All items which potentially come incontact with the ground water samples should be pre-cleanedaccording to procedure 5621003. Between sampling locations, allitems which come in contact with sample water should be eitherdisposed of or thoroughly cleaned.
All apparatus, buffers, and samples should be kept out of directsunlight to avoid temperature fluctuations, particularly pitbuffers.
Lay out all equipment on the plastic drop cloth adjacent to thesampling location, to prevent contamination .of or from theoutside environment. A truck tailgate provides an excellentequipment bench, if the site is accessible to vehicles.
A list of equipment necessary for sampling of monitoring wells athazardous waste sites is given below.
2.2.1 Well Evacuation and Sample Withdrawal
- Disposable chemically inert gloves (separate pair foreach sampling location).
- A sampler apparatus (e.g., Kemmerer, Bailer) with acapacity to collect 750 to 1000 ml of sample per trip,including sample transfer tubing.
- A 500 foot or more length of nylon cord or cable markedin 5, 25, and 100 foot increments on a retrieval systemfor use with the Kemmerer or Bailer.
- Pump and Power supply (if needed).
AR6-7
T-34
^30/869

Lr
Procedure: 5619006Revision: 0Date: 4/85Page: 4 of 8
2.2.2 Field Measurements
- Tape measure marked in tenths and hundredths of feet.
- Calibrated M-scope or similar water level recordingdevice.
- Dissolved oxygen meter with an accuracy of +0.1 mg/1,if needed.
- Thermometer or temperature measuring device calibratedin 'C (degrees centrigrade) with an accuracy of +1'C.
- pH meter with an accuracy of +0.1 pH units.
- At least pH buffer standards with pH value below andpH value above the limits anticipated for the samples.
- Conductivity (specific conductance) meter preferablywith the capacity to report conductivity (micromhos/cm)correct to 25'C. Functional range of 0 to 50,000umhos/cm.
- Beaker for field measurement of pH, conductivity, etc.
- Any additional project-specific sampling equipment asrequired.
2.2.3 Sample Preparation
i J - Field filter apparatus 0.45 micron membrane filters,and pre-filters when dissolved constituents are to beanalyzed.r: - A pressure-suction filtration apparatus capable of atleast 250 ml volume filtration at any one time.
- Precleaned, capped sample containers containing theappropriate sample preservations, if necessary.
- Tightly capped, securely stored containers holdingappropriate preservatives, if necessary.
- Pipet or "squeeze" bottle for preservative additions ifsuch additions are needed.
T-35
Procedure: 5619006Revision: 0Date: 4/85Page: 5 of 8
2.2.4 Sample Containers
AR6-7
IIt
- Precleaned, capped sample containers.
- Ice chest(s) to hold collected water samples, and ice £or "blue ice".
- Leak-proof liners for ice-chest(s). K
2.2.5 Labeling and Shipping M
- Water resistant sample bottle labeling materials.
- Laboratory instructions. |fc
- Shipping labels, including DOT labels, waste —.identification, and "This end up" labels, as Fappropriate. *
- Shipping papers, as provided by carrier or regulatory fp|agency.
- Packing tape.
2.2.6 Cleaning between Sampling Locations
- Laboratory (phosphate-free) detergent.
- Reagent-grade methanol (one tc several gallons,depending on amount of equipment to be cleaned, numberof sampling locations, and levels of contamination).
- Distilled water, generally about 2 gallons per samplinglocation.
- Buckets (sufficient for each cleaning liquid and forsize of equipment to cleaned).
- Brushes for cleaning inside of bailer, beakers, etc.
- Handiwipes, disposable after each use.
- Plastic sheeting at least one large sheet for eachsampling location, for clean layout of equipment.
T-36SR30I87I

Procedure: 5619006Revision: 0Date: 4/85Page: 6 of 8
2.2.7 Record-keeping
I ' - Prepared field record-sheets for entering dataL - collected in the field.
r— - Photographic record, if appropriate.
- Chain of custody.
i .! 2.3 Equipment Cleaningf-' •
ji j All items which potentially come in contact with ground water atthe sampling location should be pre-cleaned.
("'«lil" Between sites, sampler cleaning is to be performed immediately
prior to sampling from any well. Any portion of the samplingdevice which contacts contaminated water shall be cleaned ordisposed of between wells. For example, the cable used forbailing shall be subjected to the same cleaning requirement for alength at least equal to twice the depth to the water surface.Where pumps are used, short sections of sample tubing may bedisposed of rather than cleaning. The other items which must becleaned or disposed of between sampling locations includebailers, pumps, probes, beakers and gloves.
r The following procedure is followed for cleaning samplers andequipment:
• Before first equipment cleaning, clean the buckets andrinse with methanol and distilled water.
e Fill first bucket with laboratory (phosphate-free)detergent and tap water.
• Fill second bucket with reagent grade methanol.
e Fill third bucket with distilled water.
AR6-7
T-37
______ SR30I872
Procedure: 5619006Revision: 0Date: 4/85Page: 7 of 8
e Clean equipment thoroughly in lab detergent, usingbrushes and disposable handiwipes as necessary.
• Rinse thoroughly in distilled water.
• Lay out cleaned equipment on plastic drop-cloth adjacentto sampling location.
3.0 SAMPLING SCOPE AND CONSIDERATION
1. Prepare field record sheet and record all relevant data.
2. Check the well for above ground damage.
3. Remove the well cap (a wrench may be needed).
4. Lay out equipment on the plastic drop-cloth adjacent to thesampling location, to prevent contamination of or from theoutside environment.
5. Measure and record the depth to water and the time ofmeasurement.
6. Measure the total depth of the well.
7. Remeasure and record the depth of water after a lapse of 4 to 8minutes following initial measurement and record the depth towater and tin.* of measurement.
8. If successive measurements show essentially no difference,continue the sampling procedure. Where the level change isgreater than l/100th*ft, delay the remaining procedures until thechange observed and recorded is less than that figure.
9. Determine the amount of water in the well (depth of water x crosssectional area).
10. Purge the well.
11. If soundings show sufficient level of recovery, prepare samplingsystem. If insufficient recovery is noted, allow additional timeto collect samples on a periodic schedule which will allowrecovery between samplings.
12. Collect volatile organic analysis samples if required.
13. Perform any appropriate field testing of ground-water parameters.
AR6-7
T-38
fl«30IB73
i Procedure: 5619006Revision: 0Date: 4/85Page: 8 of 8.
r
14. Withdraw sample(s) according to correct procedures.
15. Fill necessary sample bottles completely by allowing samplerdischarge to flow gently down the side of bottle with minimalentry turbulence. Cap each bottle as filled.
16. Preserve and/or filter the sample if necessary as per guidelines.
17. Check that a Teflon-liner is present in cap if required. Securethe cap tightly.
18. Label the sample bottle with in appropriate tag. Be sure tocomplete the tag with all necessary information. Completechain-of-custody documents and field log book.
19. Place the properly labeled sample bottle in an appropriatecarrying container maintained at 4'C throughout the sampling andtransportation period.
20. Between sampling locations, all items which come in contact withground water such as bailers, pumps, cables, tubing, probes,gloves, and beakers must be either disposed of or thoroughlycleaned.
| 4.0 REFERENCESt ' • . ...
- : Taras, J.J., Greenberg, A.E.. Hoak, R.D., Rand, M.D. (editors), 1976,I Standard Methods for the Examination of Water and Waste Water,
14th ed.: Amer. Pub. Health Assoc., N.Y.
Taras, M.J., Greenber, A.E., Hoak, R.D., Rand, M.C. {editcrs;, 19~2,Standard Methods for the Examination of Water and Waste Water,13th ed.,: Amer. Pub. Health Assoc., N.Y., p. 323.
j U.S. Environmental Protection Agency, 1974, Methods for ChemicalI - Analysis of water and Wastes (EPA-625/6-74-003a): Environmental
Monitoring and Support Laboratory, Environmental Research Center,f * Cincinnati, Ohil.
U.S.G.S., 1984, National Handbook of Recommended methods forWater-Data Aquisition, Reston, VA.
U.S.E.P.A. Hazardous Response Support Division, 1984. Sampling atHazardous Materials Incidents.
Geotrans, Inc., 1983. RCRA Permit Writer's Manual: Ground-waterProtection (40 CFR Part 264 Subpart F). EPA contract no.68-01-6464.
T-39

Procedure: 5617007Revision: 0Date: 4/85Page: 1 of 3
PROCEDURE FOR FILTRATION OF SAMPLES
1.0 INTRODUCTION
The sampler should carefully review any proposed procedures forfiltering samples on site. Filtration of samples in which volatileorganic constituents are of interest is not recommended, sincefiltration may strip these constituents from the sample. However,filtration of samples in which metals are the constituents of concernmay be applicable depending on the proposed analytical method. Iftotal recoverable methods are to be used, the sample should not befiltered. However, if measurement of dissolved metals is desired, thesample should be filtered on site.
The use of filtering in the dissolved method is designed to removeparticulate matter drawn during sampling into the well, through thescreen, from the surrounding geologic materials. These particulatesmay have adsorbed constituents that, once a preservative (particularlyacid) is added, may become dissolved in the sample. Thus, if samplestruly representative of in-situ ground-water quality are desired,
^ , filtering should be required. However, if the goal is simply to' detect in the subsurface the presence of a constituent, filtering may
not be recommended. Analyzing unfiltered samples may, accordingly, beparticularly suitable for detection monitoring. However,establishment of a suitable background may become a problem becausewater-quality measurements may be strongly influenced by the designand construction of individual wells and the grain size distributionof the formation in which the intake of each well is located. The
f . sampler will need to determine which method is most appropriate foreach particular program. In some cases both filtered and unfilteredsamples may be collected and compared.
AR5-13 T_40
AR30I875
Procedure: 5617007Revision: 0Date: 4/85Page: 2 of 3
If mineral precipitation is observed during filtration or if the[__ chemical species of interest are suspected to be significantly present
in colloidal form, an unfiltered acidified sample should also beP"~ collected and subsequently analyzed for the same parameters as the
filtered sample. The containers for the filtered and unfilteredsamples must be so labeled and appropriately identified in the field
! .. notes.
y,2.0 PROCEDURE
If filtration is required, the use of a 0.45 micron filter isgenerally considered appropriate. Occasionally well or surface watersmay contain high concentrations of Total Suspended Solids (TSS) suchthat the 0.45 micron filters will clog during filtering. To avoidclogging, prefilters, available commercially, should be used in
F, addition to the 0.45 micron filters. The filter should also be made' of materials compatible with the chemical characteristics of the
«"'•-, ground water samples.Li
Filtration of ground water samples will be performed when appropriate,! • as summarised in the table below.L ,
t Analysis Sample CollectionFiltered Non-Filtered
Volatile Organics No YesTotal Metals or Ions No YesDissolved Metals or Ions Yes Sometimes
(acidify after filtration)
3.0 REFERENCE
U.S. i'EPA : 1983. Test Methods for Evaluating Solid Waste. SW9846..
AR5-13T-41
AR30I876
Procedure: 5617007Revision: 0Date: 4/85Page: 3 of 3
U.S. EPA, 1983. Methods for the Chemical Analysis of Water andWastes. March 1983, EPA-600/4-79-020.
Geotrans, Inc., 1983. RCRA Permit Writer's Manual: GroundwaterProtection (40 CFR Part 264, Subpart F), EPA Contract no.68-01-6464.
Scalf, M.R., McNabb, J.F., Dunlap, W.J., Cosby, R.L., Fryberger, J.,1981. Manual of Ground-Water Sampling Procedures. NWWA/EPA
Series.
AR5-13 T-42 AR30I877
LrLIniii
r -I' 1
f .
Cf *
DRAFT - do not quote or cite
Activity No. 9
SURFACE SOIL SAMPLING PROCEDURES
1R30I878
DRAFT - do not quote or cite
r
a
n
SURFACE SOIL SAMPLING PROCEDURES
Surface soil samples will be taken at grid nodes,as indicated on Figure 5-5, and selected locationsbased on visual observations. Each samplelocation will be logged in the field notebook andthose locations not already staked as grid nodeswill be staked.
Soil samples will be taken with a clean stainlesssteel trowel or similar sampling device from asingle location at a depth of 0 to 18 inches.
o Soil characteristics are then logged/ including/for example:
HorizonationColor
] ., - TextureDensity
(" - Odor1 - Relative moisture content/ i o Soil samples should be well mixed so that aL.J representative sample is placed in each of the
prepared sample containers for field screening andoptional CLP analyses.
f' o Chain-of-custody records, sample tags, and otherrequired documentation are then completed (seeSection 6.0).
o The sampling device will be cleaned beforesampling and between samples with an Alconoxsolution and scrub brush, followed by a rinse withpotable water, an acetone rinse, and a finaldistilled water rinse (see Section 5.2.3).
T-43/JR3QI879
DRAFT - do not quote or cite
L .
rLIu
Hf .!
l •,
rr
Activity No. 10
TEST PIT EXCAVATION AND SAMPLING PROCEDURES
I..
r
.
r
DRAFT - do not quote or cite
TEST PIT EXCAVATION AND SAMPLING PROCEDURES
The following procedures will be used for excavation andsampling of soil test pits:
e Before excavating each test pit, the backhoe willbe decontaminated at a designated area by steamcleaning (see Section 5.2.3).
• At each location, a test pit will be excavatedwith a backhoe to the water table, approximately2-6 feet deep depending on the area of the siteand 2-3 feet wide.
e The top approximately 6 inches of soil will besegregated to be backfilled at the levels fromwhich they were removed. All other materialsexcavated will be placed on a tarp with plastic
f sheeting or, depending on the quantity, in a dump(. itruck.
r :( ' e The test pit will be described (in the logbook)
according to United Soil Classificationi ;I \ procedures.
• The face of the test pit will be scraped off,exposing a fresh surface for sampling.
f• Soil samples will be taken at the surface, where
staining is visible, and in approximately 18-inchintervals on the side of the test pit. Up to fourcomposite samples will be collected from each testpit.
T-45
DRAFT - do not quote or cite
Clean stainless steel trowels or similar samplingdevices will be used to collect the samples.Stainless steel buckets will be used for mixing ofcomposite samples. All sampling equipment will be Idecontaminated between samples using Alconoxsolution, acetone, and distilled water as jdescribed in Section 5.2.3.
Samples will be placed in appropriately labeled ^3laboratory-supplied jars. Chain-of-custody ._documentation, as specified in Section 6.0, will Jbe completed for each sample.
QFollowing the completion of the soil excavation,the test pits will be backfilled. The segregatedtop 6 inches of soil will be backfilled last. Astake identifying the pit location and number willbe placed at each site.
As excavation of each pit progresses, the release »Jof volatile organics and combustible gases will bemonitored to assure that the proper level of IFlpersonnel and surrounding community protection ismaintained. a
3
III
T"46 flR30!882 f
iDRAFT - do not quote or cite
L
L.rLL
hr....il :•
rr
Activity No. 11
SURFACE WATER/SEDIMENT SAMPLING PROCEDURES
4R30I883
DRAFT - do not quote or cite
SURFACE WATER SAMPLING PROCEDURES
1. Wade into stream or ditch and approach samplingstations from a downstream point in order to minimize
i bottom disturbances. If the bottom sediment isL-- accidentally disturbed, collect the sample at«_ progressively upstream locations, as required. Surface| water samples may be taken from the bank if sampling
stations are accessible from the bank.
i. .,2. At each sampling station, record the following
|" information in the field log book:
r••. e Sample location, identification number, date, andiljji . time;
e Water temperature, at the point and time ofsampling;
p.e pH of water sampled;
n11 e Dissolved oxygen content of water sample;r
I '• e Depth of stream;
j e Velocity of stream;
f e Flow rate of stream;
e Weather conditions;
e Observable physical characteristics (odor, color,turbidity, multi-phase layering, precipitates);
T-47 AR30I88I*
DRAFT - do not quote or cite
o Stream characteristics (fast running versusstagnant);
o Evidence of dead vegetation or animals.i
3. Collect samples directly into the bottles provided.Fill vials for volatile organic analyses tooverflowing; fill other containers approximately 7/8full. There should be no air bubbles in samples forvolatile organics.
4. If necessary^ filter and/or add preservatives, and/orice samples, based on analyses to be performed (seeAppendix A.O).
5. Complete chain-of-custody records, sample tags, andother required documentation (see Section 6.0) andinclude with the shipment.
SEDIMENT SAMPLING PROCEDURES
1. Collect sediment samples at the same locations assurface water samples.
2. Wade into stream or ditch and approach samplingstations from a downstream point in order to minimizebottom disturbance. If the bottom sediment isaccidentally disturbed, collect the sample atprogressively upstream locations, as required.
3. At each station, record the following information inthe log book:
o Sample location, identification number, date, andtime;
T"48 AR30I885
if
LJ
r:
DRAFT - do not quote or cite
• Depth of stream;
e Weather conditions;'
e Observable physical characteristics;
e Stream characteristics;
• If a surface water sample has not been collectedat the same location or stream conditions havesignificantly changed, record the additionalinformation listed under surface water samplingprocedures, Item 2.
4. Collect sediment samples by driving a clean split-spoonsampler (or other suitable device) into the ditch,stream or wetlands bottom to obtain a 12-inch coresample.
5. Try to avoid plant material and material greater than2 mm in size.
6. All possible care should be taken to avoid losing thefine materials.
7. Divide the sample among the required sample bottles.If a single core does not provide sufficient material,form a composite sample by mixing cores in a stainlesssteel pan or bucket before filling bottles. Thesamples should be well mixed to assure that eachcontainer receives a representative sample.
8. Do not remove native water on the top of the finalsample.
AR30I886
DRAFT - do not quote or cite |
9. Complete the chain-of-custody records, sample tags, andother required documentation (see Section 6.0) andinclude with the shipment.
10. Decontaminate the split-spoon sampler and any auxiliarysampling equipment (e.g., buckets, trowels) by rinsingwith potable water, washing with Alconox solution,rinsing with acetone, and rinsing with distilled water.Collect and containerize the decon fluids for disposalat an EPA-approved facility.
T-50
!DRAFT - do not quote or cite
i
i
r.
u . •Activity No. 12
RESIDENTIAL WELL SAMPLING PROCEDURES
Cf
AR30I888

Lr
c
Procedure: 5617008Revision: 0Date: 4/85Page: 1 of 4
COLLECTION OF WATER SAMPLES FROM RESIDENTIAL WATER SUPPLIESr
1.0 INTRODUCTION
This procedure shall be used to collect samples from existingf residential water supplies for all non-microbiological analyses. Thej I primary objective of this technique is to collect a sample
representative of the groundwater supply and not water standing in the| delivery system or well casing.
I In a nonpumped well, there will be little or no vertical mixing of thelljill water, and stratification may occur. Water in the screened section
will mix with the grcuncvater due to normal flow patterns, but thewell water above the screened section will remain isolated and becomestagnant. Stagnant water may contain foreign material inadvertentlyor deliberately introduced from the surface, resulting innonrepresentative data and misleading interpretations.
In most cases, groundwater samples from existing residential watersupplies are obtained from taps or spigots on the existing deliverysystem. The installation of a new tap for sampling purposes is notusually warranted. Samples should be collected from the tap closesttc the well as practical and upstream of any filtration or watertreatment device.
i Two separate operational steps are required to obtain a representativesample.
e presampling system purging, followed bye sample collection
AR5-1IT-51 5R30I889
Procedure: 5617008"Revision: 0Date: 4/85Page: 2 of 4
2.0 PRESAMPLE PURGING
Before any samples are collected, all standing (stagnant) water shouldbe purged or removed from the delivery system. The volume of watercontained in the well casing, pressure or holding tanks, and otherplumbing and appurtenances (pipes, hoses, etc.) should be determined.
The system should then be purged with a minimum of three (3) times thecalculated casing volume before sampling commences. Care should beexercised before pumping a well to preclude the possibility ofoverpumping. Excessive pumping can result in flow entering a wellfrom outside the zone of interest. The purging necessary to obtain asample representative of the groundwater supply depends on a number offactors;
o pump intake levelo specific capacity of the aquifiero well efficiency
Information obtained during pumping is required to determine thespecific capacity of the aquifier and well efficiency, therefore, thepurging volume can only be estimated for a specific well for theinitial sampling. Well performance data from the initial samplingshould be recorded for future sampling.
If the sampling tap or spigot has an aerator or filter, it should beremoved prior to purging and sampling. Provisions should also be madeto dispose of the presample purge water.
For most sampling, purge water may be discharged directly to thesanitary sewer or on the ground at least thirty (30) feet from thewell. If gross contamination of the purge water is anticipated,provisions should be made for proper containment and disposal.Ideally, the contaminated purge water should be contained and storeduntil the water samples have been analyzed. Once the contaminants
AR5-12
T~52 AR30I890
L.i:t;
r('
L,!
L
Procedure: 5617008Revision: 0Date: 4/85Page: 3 of 4
have been identified, appropriate treatment and/or disposalalternatives can be determined.
3.0 SAMPLING
After the required volume of water is purged from the delivery system,the sampling tap should be shut off. Sample bottles with requiredpreservatives should then be brought to the sampling point. Turn tapon, adjusting the flow to about 100 ml/ruin. Fill sample bottles asrequired for specific analyses to be completed. Shut off tap. (Reconnect all filters, aerators, and treatment systems.
liiiIn addition to information normally recorded in field notebook (asdescribed in Procedure 5621004), the following information should beincluded:
resident's nameaddresssampling location (specific tap or spigot)filtering or treatment systems on delivery systemaerator or filter on sampling tapwell casing diameter (ID)water levelwell volumepressure on holding tank volumeappurtenances and other plumbing volumetotal delivery system volumepurge flow ratepurge timetotal purge volume
4.0 REFERENCES
NEIC Manual for Groundwater/Subsurface Investigations at HazardousWastes Sites (July 1981) Steven W. Sisk
National Enforcement Investigations Center, Denver, Colorado
AR5-12T-53 AR30/89
Procedure: 5617008Revision: 0Date: 4/85Page: 4 of 4
Manual of Groundwater Sampling procedures, Scalf, McNabb, Dunlap,Cosby, Fryberger 1WWA/EPA Series
AR5-12 1-M
AR301892
unL
1:
I,
IL*• Appendix UI
i[roiTI
i ..-••••flR30!893
I
n
0985B
APPENDIX U
BIODEGRADATION STUDIES
Lr
APPENDIX U
BIODEGRADATION STUDIES
API. 1983. The Land Treatability of Appendix VII Constituents Present inPetroleum Industry Wastes. .American Petroleum Institute, API publicationNo. 4379.
Borden, R. C., M. D. Lee, J. T. Wilson, C. H. Ward, and P. B. Bedient.Modeling the Migration and Biodegradation of Hydrocarbons Derived from aWood-creosoting Process Waste.
Ehrlich, G. G., D. F. Goerlitz, E. M. Godsy, and M. F. Hult. 1982.Degradation of Phenolic Contaminants in Groundwater by AnaerobicBacteria. St. Louis Park, Minnesota. Ground Water, 20; 703-710.
I | Goldstein, R. M., L. M. Mallory, and M. Alexander. 1985. Reasons forPossible Failure of Inoculation to Enhance Biodegradation. Appl. Environ.
r Microbiol. .50: 977-983.i
j- Heitkamp, M. A., J. P. Freeman, and C. E. Cerniglia. 1987. Naphthalenet- Biodegradation in Environmental Microcosms: Estimates of Degradation._, . Rates and Characterization of Metabolites. Appl. Environ. Microbiol. 53;[ 129-136.
! Heroes, S. E. and L. R. Schwall. 1978. Microbial Transformation ofi
Polycyclic Aromatic Hydrocarbons in Pristine and Petroleum-ContaminatedSediments. Appl. Environ. Microbiol. 35; 306-316.
Jobson, A., M. McLaughlin, F. D. Cook, and D. W. S. Westlake. 1974.Effect of Amendments on the Microbial Utilization of Oil Applied to Soil.Appl. Microbiol. 27: 166-171.
U-l0985B
I1I
Kobayashi, H. and B. E. Rittman. 1982. Microbial Removal of HazardousOrganic Compounds. Environ. Sci. Technol. 16; 170A-183A. I
Overcash, M. R. and D. Pal. 1979. Design of Land Treatment Systems forIndustrial Wastes - Theory and Practice. Ann Arbor Science Publishers,
Tabak, H. H., S. A. Quave, C. I. Mashni, and E. F. Barth. 1981.Biodegradability Studies with Organic Priority Pollutants. Journal WPCF53: 1503-1518.
Wilson, J. T., L. E. Leach, M. Henson, and J. N. Jones. 1986. In SituBiorestoration as a Groundwater Remediation Technique. GWMR, fall 1986.
( «*., M .
II
Kopecky/ A. 1986. ECOVA, Personal communication (see Appendix B).
Lee, M. D. 1983. Microbial Degradation of Selected Aromatic Compounds ina Hazardous Waste Site. Masters Thesis, Rice University, Houston, Texas.
Lee/ M. D. and C. H. Ward. 1984. Reclamation of Contaminated Aquifers:Biological Techniques. Proceedings 1984 Hazardous Material SpillsConference, April 9-12, Nashville, Tennessee. I
IAnn Arbor, Michigan. ^It _
Poglazora, M. N., G. E. Fedoseera, A. J. Khesina, M. N. Meissel, and L.M. Shabad. Destruction of Benzo(a)pyrene by Soil Bacteria. Life Sciences •6.: 1053-1062.
II
TOXNET data base. 1985. National Library of Medicine. National Institute Wof Health. Bethesda, Maryland.
Wilson, J. T., J. F. McNabb, J. W. Cochran, T. H. Wang, and M. R. Tomson.1985. Influence of Microbial Adaption on the Fate of Organic Pollutants •in Groundwater. Environ. Tox. Chem. .4: 721-726. •
It PB87-111738
Treatability Studies for Four Complexial Wastes: Methodologies and Results
Volume 1. Literature Assessment, Waste/SoilCharacterization, Loading Rate Selection
1KI—1 1 Utah Water Research Lab., Logan
&i i
WJiil ^
W^ oct 86 ?OY F._WESTON, INC.^P I . WEsf6;VvVAyr"'KlV'Ar:
WEST CHESTER, PA 19380
Prepared for
Robert S. Kerr Environmental Research Lab.Ada, OK
U.S. DEPARTMENT OF COMMERCENational Tachnical Information Service
U-3 ^30/89
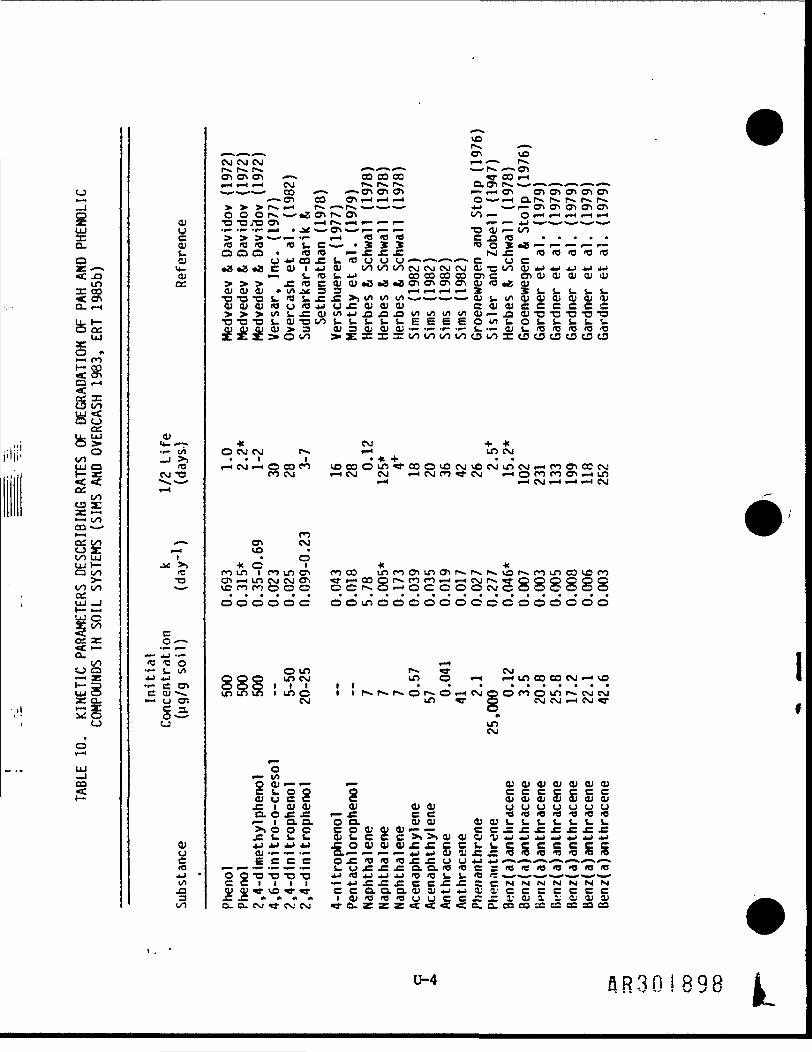
iUJ£CP•sCoo"in
Q. i—l
LU
O
uj a
as ai * CM + *O CM CM r>- «—i in CM. . i i . * + . .
S
£
a. oo
^O
UJCO
(Uuia;(*-O)a:
•_;£CM "a
cn •COa* CM
co •—•i J 3 O**** &» u•—• c cnc v •**.
Vas
J3
<£>
CM CM CM ,_ _, i-4 •— f>»CP> Cft CT> «•—» CO CO 00 ^ CO t—I_< --i i—i CM r*. r r>. Cx.cr> r -« *—>.—•<—. -s —."—uJ-mmr*~-T_IJ *~ . " ^ ^ ^ ^ (J) ^ «™H CT ^ C ^ 1 C7~1
• Cl CO 1 i""t *™ f* O *•••* fn™< ex ^ i « ^ r *- r*> •> •> r*~ --i r>> •—-i . »-> «—•»-' •« •—•-- cr> ai en en crioooi»*«—•«3cr*r^cr> oo_- o •—i.—i --1 -H -4^ jC CTi p—I r*» «—4 «.— f— r— - ._ j «_»«_»%_*»_»>«.
> > > «-^ p— ••— t—l <OfO'O C^>O .....
u *J co f _.c ai i *j ai u c•3 .3 «B C O) l jj ID OOOOOOcMCMCSJOvjO!-COO(Uj-)4JjJJ-ia->•—i t. IB t. j-> co co co co cn c cn QJ <D aj QJ (i)< u a i c o « » u i j . s s s 3 ,—«,_i--i--3e s _ . 4 - s _ i - s -< u a > a > ' O U i Q 4 J U f : w < u a j C C U C U C C C C C C•a-aT3ua)T3oos-i-s-s-..eEeeo1'is-o.-.-..i_QJ OJ CD CU > 3 (U 3 4) <U CU •-••—•-••— L. -P- CU _. <O <O >O lOg;£2r*»'~'L/' —.srarr—:~rtrtt/ic/it/')t.ot/i~r.-f-f-f-t-t-o oo
too «—i CM CM ^HCMCO-J-CM «—locoooaii—iin•—( -1 CM « —H -H CM
o _OO UJ I • O
* C i * *mm ipoincri coco inmoiinc^r».f»vr»»vor^coincosOf'O•a ' 'oo ooUJ _l OOOOOC O O in O O O O C O O O C O O O C O O
g; S C M«—I I-H I
O in ^mcM in o «—i <-H in co co CM «—• vol i t i t . . . .......line i ir-r«»rv.O!*-Oi—iCMOOf*JOinr"»CMCMCM un —r o CM CM t—i CM «8-
mCM
o
§cu—--- •— a; a* cu ai ai cu Hii_ o o o c c c c c c cCU U C C C CU CU CU CU CU Q) CUg* I C U C U CU CUCU V W Q O O O C Jr- i a. a. "o a. cucu c u c u _ _ _ _ . . v . .>i O O C C Q C U C U C U -r — C C^JCffJZJZf
^ c* z c CD «J" 3 5 3 jc *>c y y * -* " •• •» *** . ~ .* ~ •*•" •»OQtn^'O'C 4-»<t3*J*J*Jrt3t).U4..t5? ->_-»•*_.-'*—.»-.--.*-*_ ----•«—'
"-4 SR30I898
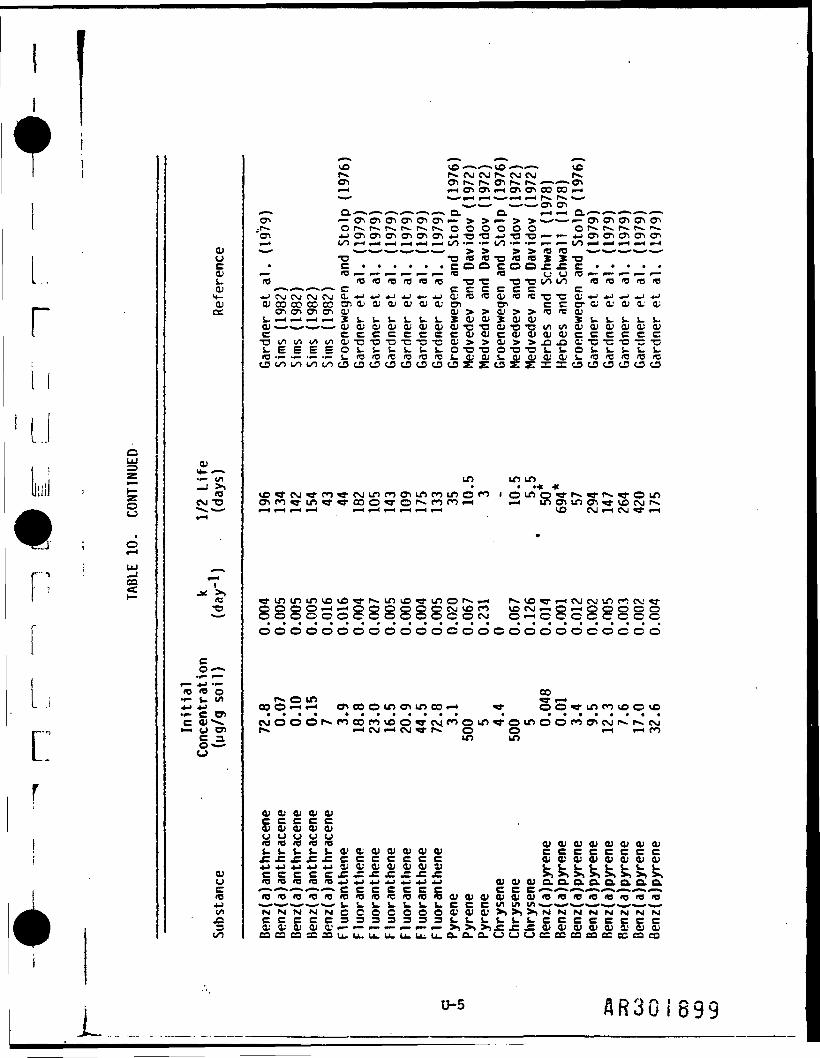
rl..:
•n
ONTINUED
eo
cuucucuK-QJ
CUH-— »•f- t/1<e
CM •&
(C•o
CUu
toJ=oo
P«» CM CM f«» CM CM
^ '» CL* «.". * * * "**m>**"i^ ^^ Q. ^H .^ CL*
J O} C?t C Cft Cft Cft ^ T3 3 *J 3 3 ™ *""" *J Cft J** Cft Oi cnOOf—l<—li—l--(f—li—lOO'^ — OO— •—•--—-OO»—l^^.—l<—li—4
«_'«_~«_'«_*_'_* > > > > ro (O *»• —— •»..•«_«•.—-OO C O O J= J= C
_» < . —— p— p—• —— —— IB IO {J O It3 i— »— »— '
—--»•—- c c c c c c c c— c\j c\j oo CNJ c« •*-* •*-* —' —• —' ^ o ' n!) ^ ro tn c " ^ Q —* *-* •J —' •*~'c u c o c o c o c o c n c u a i c u c u c u e u c n er c c c r c u a ; c u a ; Q ;WCftCftCftCU C U > > C U > > ' O ' C C U
c '~"~'""•* e c c c c c c c / c u c u c c u c u c u c u c c c c c cs _ E E E E o s _ s _ ^ i . s - s _ o - c i - c o - o - o . . . . o s - s - w s _ s _
in in invo-rcM-rPO'B'CMincocftincoino'*' i •* *
VO CM •—( CM (
8QOO-Hi—iQOQQQOCMVDfO VOC\J^HQ«—"C3OC3COO O O O O C C O O O O O O CM O—i C O C C C C C O
o'o'o'o'oodooo'o'o'o'oooo'oo'oo'coc'o'o'
c4-> '
<e *o o cor o in «• .—ioo o .-H <—i CD co o m en m co .—> «• o o -»• in co vo o vo•—•cmccu^* _ . , _ _•—i<JC7> ~^ •—ICM<—ICM—fr^O O «—I *•H COin in
CU CU CU CU CUc c c c cCU V CU CU CUu u u u u<O_ . _ . _ . i . _ . c u a : c u c u c u c u a > c e c c e c c c£££j=£ccccccc eu a; cv eu oj cu cu <D4J4->j->4->+ja;cucucucucu_> u v - v v w — — —
'DJ_)»JJ_>J-;^*J-J CUCUCUQ.Q.Q.Q.O.Q.Q.Q.-—- C C C C C C C CC C *-« ->'—« ~> ———. »—.«-^._S...i._...l-CCContn t/i < « «_«_> _.«_,«_
CU: C C CC33333334.4-l._....-CCCCCCCC,• a; a; a; a1 --•—•— — .— --•— >>>>>)j= :j.: cucu cu cucu i' eu cu
L flR30!899
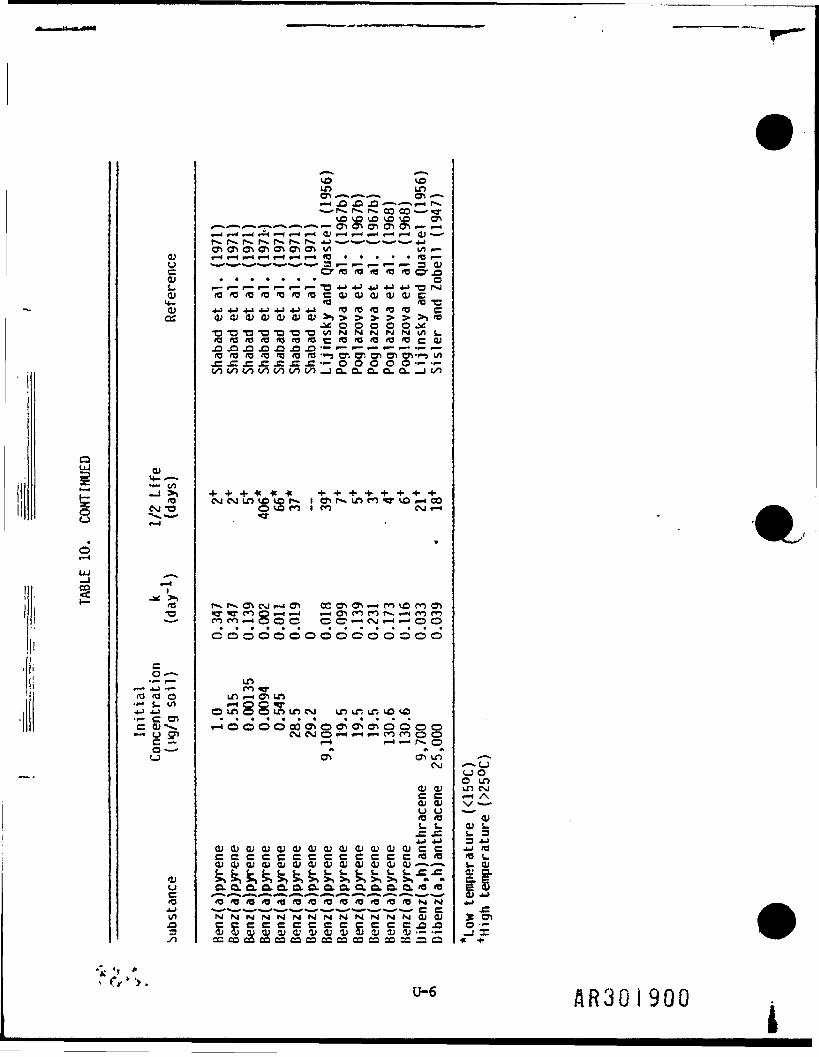
o
or-H
UJ
aioIfl IO fl iO fl fl C 4J CU CU CU CU C
ITS ~~CU 4J 4J 4J 4J 4-> 4J 4-> fl fl fl fl fln* '_ -• - -
'' o b o b o
Q01f in
i £•;
tfl•a
ra <a o
— y 5£>
a>
•t *
VO vfi
*—*r>» r-» r>— CO CO *—' f\g \Q p ( 1J5 o>»"— Cft Cft Cft Cft Cft •—• _-4
_-i --« r—i W< .—4 r-1 i—i <L' i—i-^i—i •—i i—i CU •—'(>>r-.r>».r^r^r^.fs» *J >—•*—-<_» «_- j_>t—4l—Ii—4l—<»—It—!l—Ifl • • • • «flp—
o-34J4->4J*J*->-3P«a
QJ
j=j=j=j=j=j=_;'->o'o o o o — ••-oooooooooOoooo_iQ.a.a-Q.a._joo
4.+*** ^ + 4. + + 4. + +
O VO CO I CO CM -H
r** * eft CM f-4 eft cc cn cn «~* ro 10 co cnr T co t~* ."I — ._< cn co co r t.™4 co coCOCO--IOOO CO-—4CMi—If—'OO
co'o'ddo'odddo'do'do'
o—. inCO -J-m t— < eft in•i- s. </i i—i o o r4-14-1 ovnoOmmcM minmvovo
ca»^> f-i d d d d oo cn o cn cn cn d d o o~~ CMCMO«i->--4--ICOCOOOi—i I-Hi -i r . o
cn cn inCJCM
O OO UD
CU 11C Ccu cu
_JJ _)< u ^ o ; c u c u c u c u c u c u c u c u c u c u c ce c c c c c c c c c c c c f l i s
C U C U Q ; C U C U C U C U C U C U C U 4 J C U C U - **
o.o.e_a.o.o.o.a.cLQ.a.o.Q.fl fl
XXX'75'"f3''T.r"iC'"N'"N'<Nf*NrX*N.' § §csccccccccccc.a.accaacocaeDcaeacaaaaacaaaasao
m CMv —*~* cucu -._. 33 4-J4_ flfl 4.
55
AR30I900
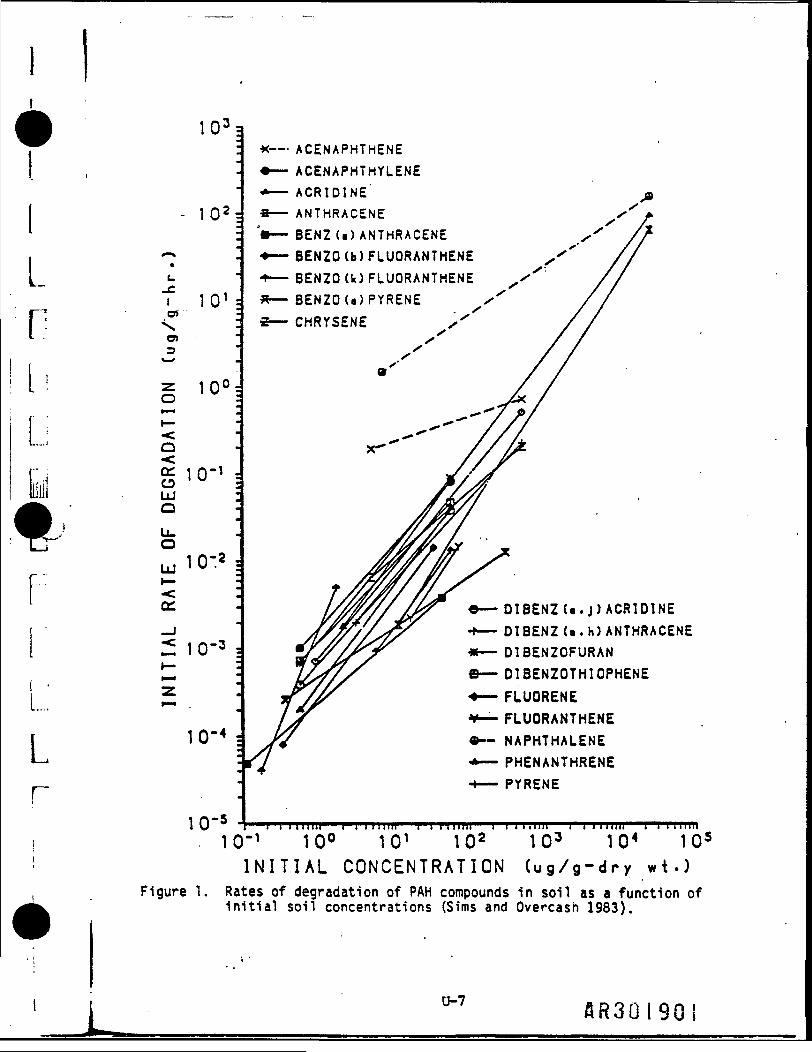
Lr-L:y
Lr
1033*—• ACENAPHTHENE•— ACENAPHTHYLENE-—— ACRIDINE
102 _
101cn
1CT4 =
10-5
ANTHRACENEBEN2(•)ANTHRACENEBENZO(b)FLUORANTHENEBENZO (k)FLUORANTHENE
01BENZ(•..)ACRIDINE01BENZ(•.h)ANTHRACENEOIBENZOFURAND1BENZOTHIOPHENEFLUORENEFLUORANTHENENAPHTHALENEPHENANTHRENEPYRENE
TO'1 10° TO1 102 103 104 105INITIAL CONCENTRATION (ug/g-dry wt.)
Figure 1. Rates of degradation of PAH compounds in soil as a function ofinitial soil concentrations (Sims and Overcash 1983).
0-7 AR3QI9G!