
Appendix III. ME 3514 Handouts and Survey
47
138 Appendix III. ME 3514 Handouts and Survey
Transcript of Appendix III. ME 3514 Handouts and Survey

138
Appendix III. ME 3514 Handouts and Survey

139
III.A. PowerPoint Lecture

140

141

142

143

144

145

146

147

148

149

150

151

152

153

154
III.B. Assignment Sheet
155
ME 3514: Design Project 2 Fall Semester, 2000
Simulation and Measurements of a DC Motor’s Steady-State Velocity
Abstract: The steady-state velocity of a DC motor shaft will be simulated using the Matlab Simulink program and simulation results will be compared to measured steady-state shaft velocities. The simulations will be based on a transfer function description provided for a specific DC motor that is available for testing in the Mechatronics Laboratory. A motor speed controller, to be created using the PIC Visual Developer application software, will be used to generate experimental data in the lab. The data will indicate a relationship between the duty cycle of a pulse width modulated (PWM) input voltage and the voltage reading from a tachometer measuring shaft velocity. Students will then be able to compare the modeled predictions of steady-state shaft velocities versus the actual steady-state shaft velocities, as a function of PWM duty cycle. The final value theorem will also be used to approximate the motor shaft steady-state velocity for comparison to the simulated and measured values. A project report, due by November 17, will provide a brief analysis of the comparisons and the algebraic development of the motor’s steady-state velocity using the final value theorem. Procedure:
• Students will conduct the experimental component of this project in groups of four. Detailed procedures for the motor measurements are provided in the additional handout titled “ME 3514 Motor Model Laboratory.” Laboratory times must be reserved; sign-up sheets are posted on the door of the Mechatronics Laboratory, located in Room 7 of Randolph Hall.
• Suggestions for creation of the simulation program are discussed in the “class notes” Power Point handout. Those notes describe the essential elements of the Simulink program that will lead to predictions of steady-state motor shaft velocity in response to a PWM signal of different duty cycles. The duty cycles used for simulation should be the same as those used in the lab.
• A dynamic model for the permanent magnet DC motor is provided with this assignment sheet. Development of the transfer function for the motor is summarized; details were worked in a previous homework problem. Students should apply the final value theorem to the appropriate transfer function relating motor shaft angular velocity to applied armature voltage (see Eq. 7 or 8) in order to determine the expected steady-state shaft velocity based on the dynamic model. The Laplace transform of the PWM input will need to be approximated; be sure to show how you made that approximation.
Project Report:
A summary report, documenting the procedure used for the project, should be individually prepared for grading. Each report should be one-page in length with appropriate use of appendices to support the summary. (The appendices should show the final value theorem analysis and any other pertinent information.) All reports should include an X-Y graph of steady-state velocity (ordinate) versus PWM duty cycle (abscissa). The graph should show a comparison of the results from the Simulink model and the lab measurement results. Finally, provide comments about the accuracy of the model versus experiment and discuss which motor parameters affect steady-state velocity of a DC motor.

156
III.C. Lab Manual

157
ME 3514 Motor Model Laboratory
Objective:
The objective of this project is to generate a dynamic model for a DC permanent magnet motor, and investigate its accuracy through a comparison of experimental measurements and numerical simulations of the motor’s shaft speed in response to an applied armature voltage. In the laboratory, students will use the PIC Visual Developer (PVD) software to create an open-loop velocity control program for a DC motor and download a corresponding executable file to the VT Project Box. The program will control the motor speed proportionally to the value of a potentiometer signal connected to the project box. The project box will output a PWM (Pulse-Width-Modulated) signal to the motor, and the motor shaft speed will then be measured with a tachometer. Students will record the tachometer values and the corresponding potentiometer values. The students will then use Simulink™ to model the motor’s response (motor model parameters will be provided) to the PWM signal with various duty cycles as determined by the potentiometer signal value. Finally, students will compare the simulation results to the experimental results and provide a brief description of the results.

158
Table of Contents
Lab Preliminaries PVD Program Creation Procedure Connecting Power to the VT Project Box Downloading the PVD Program to the VT Project Box Motor Stand Connections Running the Experiment Appendix I: Box Layout Appendix II: Motor Stand Layout

159
Lab Preliminaries – Discussion of Mechatronics Terms Microprocessor: The typical function of a microprocessor is to take an input from one or more of its pins, and then perform an operation depending on the value(s) of the input. The operation that is performed is dependent upon the software written and downloaded to the microprocessor. After performing the operation an output may be sent to one or more pins of the microprocessor. The microprocessor used in the VT Project Box is a Microchip PIC16F84 (PIC). This type of microprocessor, which operates with a low number of instructions, is often called a microcontroller. A datasheet for the PIC microcontroller can be found at
http://mechatronics.me.vt.edu/book/PIC%20Processor/pic.html For the PIC the values of the inputs and outputs are 0 or 5 volts. One example that demonstrates the use of a microcontroller is concerned with designing an interface between the PIC and an analog-to-digital (A/D) converter. An A/D converter takes an analog voltage value and converts it to a binary value; for example, 2.5 volts into an 8-bit, 5-volt A/D converter would output 10000000. There is a custom board in the VT project box that enables the PIC to communicate with an A/D converter using this digital logic. The way the PIC communicates with this chip is by outputting a timing signal, which is created by toggling one pin from 0 volts to 5 volts. While toggling one pin, another pin changes its values to tell the A/D converter what data to send. After sending this string of data to initialize the A/D converter, the A/D converter returns a signal to the PIC indicating the input voltage value. Pulse Width Modulation: Pulse width modulation (PWM) is a square wave where the time high and the time low varies. The percentage of the time high verses the period of the waveform is called the percent duty cycle. A typical square wave therefore has a 50% duty cycle. An example of other duty cycles can be seen below.
25% duty cycle PWM signal
75% duty cycle PWM signal
A typical use of a PWM signal is an input to a DC motor. This allows one to vary speed of the motor without varying the voltage. An important point with this application and other similar applications is that the bandwidth of the motor is significantly less than the frequency of the PWM. Potentiometer: A potentiometer acts as a variable resistor. There are two types of potentiometers. One being rotary, where there is a knob that is turned which changes the resistance. The other is linear, where there is a wiper that slides along a pad whose resistance changes depending on a “wiper’s” position.

160
Tachometer: A tachometer acts like a generator; i.e. a motor generating power by shaft rotation, instead of consuming energy to rotate the shaft. From a typical DC motor model, it can be seen that the shaft velocity is nearly proportional to the input voltage, or the output voltage of a tachometer is proportional to shaft velocity. Thus, using a tachometer one can find the velocity of a rotating shaft. Motor and specifications: The motor model derived in class results in a transfer function between the shaft output speed and the voltage input as shown in following equation:
( )( ) ( ) RbKKsLbsRJLJs
KsVs
Tb
T
++++= 2
θ!.
Motor parameters: KT = 0.0551 N m/A Kb = 0.0551 V/(rad/s) L = 2.54 mH J = 1.62E-5 kg m2 R = 1.73 Ohms b =1.14E-5 N m/(rad/s) PVD Software: The PIC Visual Developer software is a visual programming environment used to create programs for the PIC16F84 microcontroller, and specifically for use with the VT Project Box. It uses a block diagram concept for programming. Generic blocks are placed in the workspace, and then are assigned a specific operation to perform. For most of the operations there are certain parameters that need to be specified, i.e. for subtraction what variable is supposed to be subtracted from a what other variable. Each block can also be considered as a section of code for a function in a program, and specifying the operation specifies the function, and the parameters are inputs to the function. After, the blocks are assigned their operation and the parameters for the operation are specified, the blocks are connected in order of their desired execution. Upon compiling the code a .hex file is created that can be directly downloaded to the VT Project Box. How this all works together: For this project a PVD program will be created that will be downloaded to the VT Project Box, and then executed. The program will read a value from an A/D converter, the value read by the A/D is the voltage of a rotary potentiometer. Then, based on the value of the potentiometer, the PIC will send a PWM signal to run a DC motor. Attached to the DC motor is a tachometer, from the tachometer a voltage will be read and the speed of the DC motor can be determined. An analytical model of the motor can then be constructed using the above values and the transfer function. Then, the results of the experiment can be compared to the results of an analytical model.

161
PVD Program Creation Procedure Program synopsis: The figure to the right is the final program that will be created for this project. It will be helpful to read through this brief description before and after YOUR creation of the program. This program performs open-loop speed control of a DC motor using a software package called the PIC Visual Developer (PVD). The software relies on block diagram construction of functional blocks in order to achieve a particular function. Once the block diagram is successfully fabricated, the PVD environment will automatically compile an executable code that can be downloaded to the PIC processor inside the VT Project box. The following discussion is an overview of the motor speed controller block diagram construction. The speed and direction of rotation is determined by the potentiometer position (Pot1). A value of approximately 2.5V on the potentiometer output pin should result in nearly zero shaft rotation. A value of 5V should result in full speed shaft rotation in one direction and 0V should result in full speed shaft rotation in the opposite direction. The potentiometer voltage value is read into the program using the POT1 block. The program uses an analog-to-digital converter that takes a sample from the 0-5V signal of the potentiometer and converts it to a digital value. This value enters the program as an 8-bit word and is stored as the variable potspd. Note that in an 8-bit word there are 256 unique values 2^8), therefore, we have a 19.5mV resolution (5V/256). The 8-bit word ‘00000001’ is 19.5mV, the 8-bit word ‘10000000’ is 2.5V, and ‘11111111’ is 5V. The decimal values for these 8-bit words are 1, 128, and 255, respectively. After, the POT1 block is executed, the SUBTRACT block is executed. Upon executing the SUBTRACT block, the literal decimal value of 128 is subtracted from potspd which results in the absolute value being returned and stored in hfspd. A sign bit is set depending on the resulting sign of the subtraction, this result is stored in dir. For example, if potspd was 230 then hfspd would be 102 (‘01100110’) and dir would be ‘1’; or, if potspd was 26 then hfspd would again be 102, however, dir would be ‘0.’ Here the value of dir determines the direction that
Finished Program

162
the motor will turn. Notice that the SETSPEED block can utilize up to an 8-bit word and also notice that by subtracting the value of 128 we have essentially created a 7-bit word (i.e. half of the range for the speed has been subtracted away). In order to get the full range of speed again, the hfspd variable must be multiplied by 2, resulting in a full speed value flspd. Therefore, in the above example where hfspd was 102, flspd would be 204, ‘1101100’, an 8-bit word. Now, the final two blocks of the program are more straightforward. SETSPEED sets the speed of the motor by outputting a 12V PWM with a duty cycle proportional to the 8-bit word flspd, and SETDIRECTION changes the 12V of the PWM from positive to negative depending on the value of dir. Next, detailed instructions are provided for creation of your PIC program using the computers in the Mechatronics Laboratory. 1) Start PIC Visual Developer (PVD) by double-clicking the PVD icon in Figure 1. The Screen should look like Figure 2.
Figure 1: PVD icon
Figure 2: Start-up screen

163
2) Layout: Click the block toolbar button, circled in Figure 3, this makes the cursor a block placement tool. Then, clicking anywhere in the workspace creates a block there. After the cursor has been activated as the block placement tool, one can place the blocks as shown in Figure 3. If a block is misplaced, right click for the option to move or delete it. After selecting the move option, click where you want the center of the block to appear in the workspace. Remember to save frequently during the creation of the program.
Figure 3: Workspace Layout
3) Block 1 Instructions: First, right-click on Block 1, select ‘properties’ on the menu. Next, click ‘RAM Config,’ and then click ‘Add’. Next, enter the variable ‘potspd’ in the label field. You can also enter a comment about the variable in the description field if you like. An appropriate comment for this variable would be ‘Pot value to determine speed.’ Click OK in the ‘RAM configuration’ dialogue window. Next, under Block Type select ‘Pot1.’ Then, set output 1 to ‘potspd.’ The finished block property’s window should look like Figure 4. Click OK to finish Block 1.
Figure 4: Block Properties window for Block 1
Block 1
Block 2
Block 3
Block 4
Block 5
Block toolbar button

164
4) Block 2 Instructions: First, right-click on Block 2, select ‘properties’ on the menu. Next, click ‘RAM Config,’ and then click ‘Add’. Next, enter the variable ‘hfspd’ in the label field. An appropriate description for this variable would be ‘half of the motor speed.’ Click ‘Add’ again, and enter the variable ‘dir.’ A description for this variable could be ‘Motor direction.’ Click OK in the ‘RAM configuration’ dialogue window. Next, under ‘Block Type’ select ‘Subtract.’ Then, set input 2 to ‘potspd,’ output 1 to ‘hfspd,’ and output 2 to ‘dir.’ Select ‘literal’ in the input 1 field and enter ‘128’ into the adjacent field. The finished block property’s window should look like Figure 5. Click OK to finish Block 2.
Figure 5: Block Properties window for Block 2
5) Block 3 Instructions: First, right-click on Block 3, select ‘properties’ on the menu. Next, click ‘RAM Config,’ and then click ‘Add’. Next, enter the variable ‘flspd’ in the label field. An appropriate description for this variable would be ‘Full motor speed.’ Click OK in the ‘RAM configuration’ dialogue window. Next, under ‘Block Type’ select ‘Multiply.’ Then, set input 2 to ‘hfspd,’ and output 1 to ‘flspd.’. Select ‘literal’ in the input 1 field and enter ‘2’ into the adjacent field. The finished block property’s window should look like Figure 6. Click OK to finish Block 3.
Figure 6: Block Properties for Block 3
6) Block 4 Instructions: First, right-click on Block 4, select ‘properties’ on the menu. Under ‘Block Type’ select ‘SetSpeed.’ Then, select ‘flspd’ for input 1. The finished block property’s window should look like Figure 7. Click OK to finish Block 4.
Figure 7: Block Properties for Block 4

165
7) Block 5 Instructions: First, right-click on Block 5, select ‘properties’ on the menu. Under ‘Block Type’ select ‘SetDirection.’ Then, select ‘dir’ for input 1. The finished block property’s window should look like Figure 8. Click OK to finish Block 5. After finishing Block 5 the resulting block diagram should appear as in Figure 9.
Figure 8: Block Properties for Block 5
Figure 9: Unconnected Block Diagram

166
8) Block Connections: Left-click the connection icon, shown in Figure 10, then click from node to node of each block to connect the blocks. The node of each block is connection point of each block. Do not connect nodes that are on the same block. When finished the workspace should look similar to Figure 11. The final workspace should look like Figure 11. Exercise caution when connecting the blocks, it is easy to miss the intended connection.
Figure 10: Connection
icon
Figure 11: Connected Block Diagram
9) Locate MPASMWIN: Now that the program is written it is necessary to locate the compiler. To do this click ‘Options.’ Under the ‘Options’ menu select ‘MPASM Location,’ this can be seen in Figure 12. Go to the following file location on the hard drive C:\mplab\mpasmwin and select this file and click ‘Open.’
Figure 12: MPASM Location, in Options Menu
10) Save the file!!! 11) Compile the File: To compile the file click on the compile icon on the tool bar, the icon is shown in Figure 13. After the program compiles the MPASM v02.50 window should appear as it does in Figure 14. If the window reports errors, ask the TA for assistance.
Figure 13: The compile icon
Figure 14: MPASM compile window

167
Connecting Power to the VT Project Box 1) Familiarize yourself with the VT Project Box Layout in Appendix I. 2) Turn on the Power Supply. 3) On the power supply press the ‘Recall’ button, the display should read RECALL
1, then press the ‘Recall’ button again. 4) The read out should read OUTPUT OFF, if the output is on i.e. a voltage appears
in the read out, press the ‘Output On/Off’ button, this will turn off the output. Now, turn on the output by pressing ‘Output On/Off’ button. Next, press the ‘+6V’ and approximately 5 volts should be displayed on the read out (This value should not change, ever, during the lab!!), if not notify the TA before proceeding. Now, press the ‘+25V’ button, the readout should now read approximately 12 volts (This value should not change, ever, during the lab!!). Again, if it does not read 12 volts, notify the TA before proceeding. Finally, press the ‘Output On/Off’ button again, and the read out should read OUTPUT OFF.
5) Connect a BNC cable, Figure 15, with BNC to Banana Plug adapters (Figure 16) on both ends to the +6 V channel and connect another BNC cable with BNC to Banana Plug adapters on it to the +25 V channel of the power supply as shown in Figure 17. When connecting the cables make sure the ground tab on the BNC to Banana Plug adapter is in the ground/common plug of the power supply.
Figure 15: BNC Cable
Figure 16: BNC to Banana Plug Adapter

168
Figure 17: BNC cable connection to the Power Supply
6) Connect the BNC cable attached to the +25V channel to the 12V port of the
project box as shown in Figure 18. When connecting the cable make sure the ground tab on the BNC to Banana Plug adapter is in the common plug of the Project Box.
Figure 18: Connection to the 12V port of the project box.
7) Connect the BNC cable attached to the +6 V channel to the 5 port of the project
box as shown in Figure 19. When connecting the cable make sure the ground tab on the BNC to Banana Plug adapter is in the ground plug of the Project Box.
Figure 19: Connection to 12V and 5V port.
8) Have the TA check your connections now.

169
Downloading the PVD Program to the VT Project Box 1) Take the serial cable attached to the computer that the PVD program was created on and attach it
to the serial port on the project box. 2) Double-click the SERPROG icon (see Figure 20) on the desktop.
Figure 20: Serprog icon
3) Click the browse button and find the program you created with the PVD. It will have a .hex
extension. Select this file and click open. 4) On the power supply, press ‘Output On/Off’ button, turning on the output. 5) In the SERPROG window, click ‘set port.’ 6) Slide the switch on the project box to the program position (shown in Appendix I). 7) Press the reset button on the project box (shown in Appendix I). 8) Click ‘Program’ in the SERPROG window. 9) A window should now appear and read “Memory verified OK.” If this is not the message you
receive, notify the TA. 10) On the power supply, press the ‘Output On/Off’ button, turning the output off.

170
Motor Stand Connections 1) Familiarize yourself with the motor stand layout in Appendix II. 2) In addition to having the 6V channel of the power supply connected to the project box, also
connect it to the banana post on the motor stand. Figure 21 shows the added connection at the power supply and Figure 22 shows the connection to the motor stand.
Figure 21: Connection to power supply for the motor stand.
Figure 22: Five volt connection to the motor stand.
3) Connect two BNC cables to the potentiometer output as shown in Figure 23.
Figure 23: BNC connection to the potentiometer output.
4) Connect a BNC cable to the tachometer output as shown in Figure 24.

171
Figure 24: BNC connection to the tachometer output.
5) Connect one of the potentiometer BNC cables to the multimeter as shown in Figure 25.
Figure 25: Multimeter connection from the potentiometer.
6) Connect the other potentiometer BNC cable to the A/D channel 1 on the project box as shown in
Figure 26.
Figure 26: BNC connection to A/D channel 1
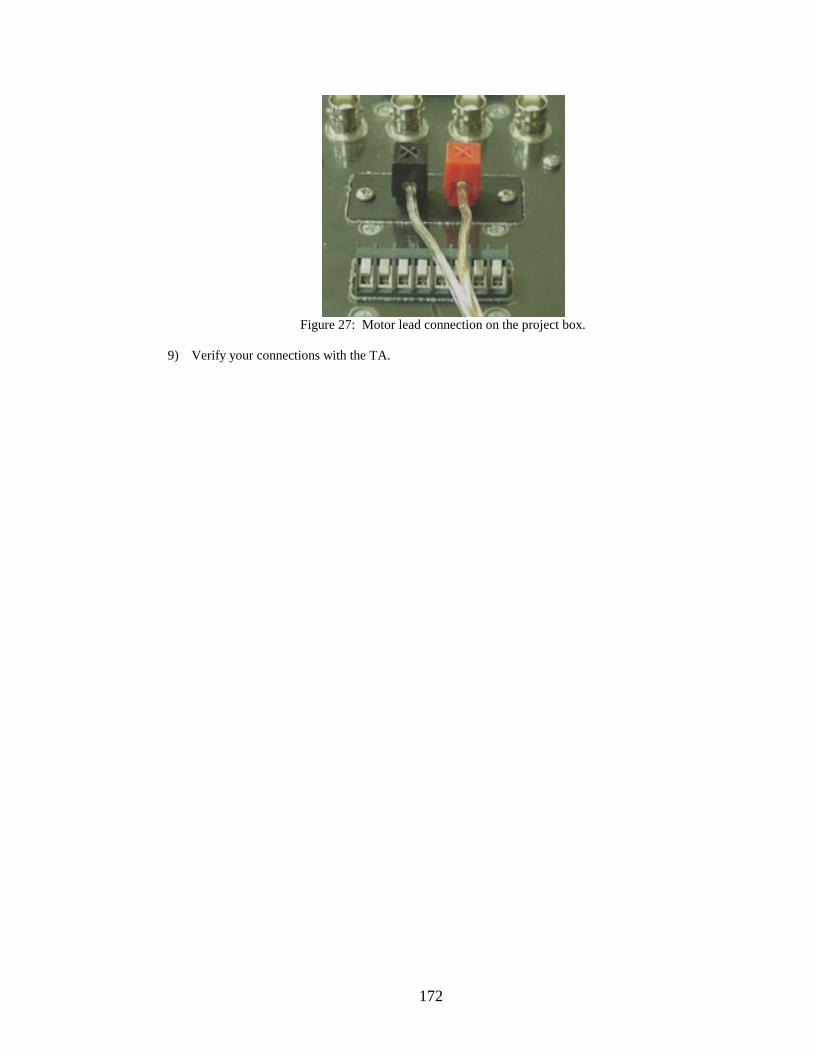
7) Connect the tachometer BNC cable to the other multimeter at your table as shown in Figure 25. 8) Connect the motor leads to the H-Bridge output on the project box as shown in Figure 27.
172
Figure 27: Motor lead connection on the project box.
9) Verify your connections with the TA.

173
Running the Experiment 1) Slide the Run/Program switch on the project box to the run position. 2) On the power supply, press the ‘Output On/Off’ button. 3) At this point the motor may be running, if so, turn the potentiometer to a position in which the
motor stops running. 4) Press the power switch on the multimeters, turning them on. The multimeters will already be in
the voltage read mode. 5) Record the values on the multimeter corresponding to tachometer and to the potentiometer, for
various positions of the potentiometer. You may want to do this for 5-10 different values of the potentiometer for both directions of rotation.

174
Appendix I Virginia Tech Project Box Project Box Layout
Power connections, program/run switch and reset button.
Program
Run
Run / Program switch positions are as marked
Serial Port Connection
Bl B
Power Supply connections and
programming buttons
Input and output connections
Input Side
Output Side
Reset Button
5V input ack is groundRed is 5V
12 V input lack is Com
Red is 12 V

175
Output Side
Input Side
H- Bridge Output (Power Amplifier)
Digital Output Channels
Analog to Digital Input Channels
Channel 1 Channel 2
Channel 3
Channel 4
Digital Input Channels

Appendix II Motor Stand Layout
Motor input leads
Tachometer output P 5V input for
potentiometer
24V ittman Motor
176
power
Potentiometer to vary motor
speed
Potentiometer output

177
III.D. Survey and Raw Data

178
III.D.1 Survey

179
1 = I agree very strongly 2 = I agree 3 = I have no opinion 4 = I disagree 5 = I disagree very strongly
1) By participating in the mechatronics lab my interest in mechatronics was increased. 1 O 2 O 3 O 4 O 5 O
2) By participating in the mechatronics lab my understanding of the course material was increased. 1 O 2 O 3 O 4 O 5 O
3) The laboratory instructions are thorough enough to allow completion of the lab without a TA. 1 O 2 O 3 O 4 O 5 O
4) The lecture material presented for the mechatronics lab was relevant to the project. 1 O 2 O 3 O 4 O 5 O
5) The experiment was an improvement to the typical design project approach. 1 O 2 O 3 O 4 O 5 O

180
III.D.2 Raw Data

181
Composite
Ratings Question # 1 2 3 4 5 2 2 2 2 1 2 2 2 2 2 2 2 4 2 2 2 3 4 3 2 2 2 2 2 3 1 1 1 2 2 1 2 4 2 4 2 2 2 3 4 3 2 2 2 2 1 1 2 1 1 2 2 2 3 2 2 2 1 1 2 3 2 2 2 3 2 4 3 3 2 2 2 2 2 2 1 2 1 3 1 2 2 1 1 2 2 1 1 1 2 2 2 1 2 3 4 2 4 4 4 2 2 2 2 4 3 2 2 2 2 2 3 2 3 2 2 2 2 2 2 2 2 2 2 2 2 2 2 2 1 2 2 2 2 2 2 1 2 2 1 1 2 2 2 3 3 4 4 4 4 2 2 3 2 2 1 2 2 2 1 4 4 4 4 4 2 1 2 2 2 4 4 1 1 1 1 2 4 4 2 1 1 5 4 2 2 3 4 2 3 3 2 3 5 2 2 2 3 2 2 1 1 3 2 2 2 2 1 3 2 2 2 1 2 2 4 3 2 2 2

182
3 2 4 4 2 2 2 4 2 2 1 2 3 2 3 3 2 3 2 1 2 2 1 1 1 2 3 4 2 3 2 4 2 4 2 1 2 1 1 1 4 2 4 2 2 2 1 2 4 3 4 4 2 2 4 1 3 4 3 3 1 2 4 4 2 4 3 4 2 3 1 2 2 1 2 2 3 4 2 3 5 4 2 3 4 1 2 1 2 2 3 2 3 2 2 5 4 2 4 3 1 2 4 2 2 2 4 2 3 2 2 2 3 3 2 2 4 4 2 3 1 2 1 1 2 2 4 2 2 3 2 2 4 4 2 3 2 5 3 2 2 1 1 2 2 2 2 1 3 2 4 2 2 2 1 2 1 2 2 1 1 3 4 3 2 2 2 2 2 2 2 4 1 2 2 4 2 4 3 1 2 3 2 2 2 2 2 2 1 2 3 2 3 3 3 2 3 1 2 2 2 2 3 2 2 2 2 2 2 2 2 1 2 1 2 3 3 2 2 3 3 3 2 4 4 5 3 2 4 2 1 2 1 2 2 2 3 2 2 4

183
2 2 2 2 3 2 3 2 4 4 2 2 2 3 2 2 2 2 2 2 2 2 4 3 1 1 2 1 1 2 3 4 3 1 3 4 2 4 2 4 2 2 1 2 2 4 2 2 2 3 4 5 2 2 5 3 2 4 4 3 2 2 3 2 3 3 2 2 2 2 2 2 2 2 1 2 3 2 2 2 3 4 2 4 4 2 2 2 2 1 2 2 4 2 2 2 2 2 2 2 1 1 1 2 2 4 2 4 2 4 2 3 1 2 4 1 4 2 3 2 1 1 2 1 1 4 2 4 4 1 3 4 2 2 4 4 2 4 3 3 3 2 5 4 2 2 1 2 2 2 2 2 2 2 2 2 2 4 2 2 2 1 2 2 2 3 1 1 2 1 2 2 2 2 2 2 3 2 3 3 3 4 4 4 2 2 3 2 2 2 1 2 1 3 2 4 4 2 3 2 2 1 2 1

184
Vita
Donald Edward Grove was born on June 13, 1976 in Winchester, Virginia, and
resided in Bunker Hill, West Virginia for following twenty years. After graduating from
Musselman High School in 1994, he began his undergraduate engineering degree at
Shepherd College in Shepherdstown, West Virginia. While attending Shepherd College,
Donald worked at the USDA Agricultural Research Service’s Appalachian Fruit
Research Station in Kearneysville, WV, where he aided in the construction of
experimental fruit harvesters. In May of 1996 he received his Associates of Science in
Engineering from Shepherd College. In the Fall of 1996, he transferred into Virginia
Tech’s Engineering Program and chose mechanical engineering as his field of
concentration. Following his first two semester’s of study at Virginia Tech, he, again,
worked at the USDA during the summer. The following summer he worked as a research
assistant for two of the mechanical engineering faculty. In May of 1999 Donald received
his Bachelors of Science in Mechanical Engineering, and began his graduate studies
immediately after receiving his degree. For the following eighteen months Donald
worked as a graduate research assistant with the support of NSF/SUCCEED. The focus
of this work was the vertical integration of mechatronics; which became his thesis topic.
In February 2001 Donald will complete his thesis and begin his career as an engineer at
Pratt & Whitney.


