APPENDIX I WILDFIRE HAZARD ANALYSIS - State of Oregon I-Wildlife... · Appendix I Wildfire Hazard...
32
APPENDIX I WILDFIRE HAZARD ANALYSIS
-
Upload
nguyenliem -
Category
Documents
-
view
230 -
download
0
Transcript of APPENDIX I WILDFIRE HAZARD ANALYSIS - State of Oregon I-Wildlife... · Appendix I Wildfire Hazard...

APPENDIX I
WILDFIRE HAZARD ANALYSIS

Appendix I Wildfire Hazard Analysis
Introduction
Appendix I contains a wildfire hazard analysis that assesses the potential issues associated with flare use within the existing and proposed airspaces. These analysis specifically address comments on the Draft Environmental Impact Statement (EIS) provided by the U.S. Fish and Wildlife Service (USFWS), Oregon Department of Fish and Wildlife (ODFW), and Oregon Natural Deserts Association (ONDA). This appendix also provides a complete record of fire danger rating data from 2015 which was derived from the Wildland Fire Assessment System (U.S. Forest Service [USFS] 2016).
Table of Contents Wildfire Hazard Analysis ....................................................................................................... I-2
Eastern Oregon Fire Danger Rating History (2015) ............................................................ I-21
I-1

EIS for Proposed Establishment and Modification of Oregon Military Training Airspace Final – April 2017
I-2
APPENDIX I WILDFIRE HAZARD ANALYSIS
EXECUTIVE SUMMARY
The Oregon Air National Guard (ANG) published a Draft Environmental Impact Statement (EIS) in July 2015 to evaluate the proposed establishment and modification of military training airspace over coastal, central, and eastern Oregon. The Proposed Action includes modifications to existing Military Operations Areas (MOAs), Air Traffic Control Assigned Airspaces (ATCAAs), and Warning Areas as well as the establishment of new military training airspace. The need for the Proposed Action is driven by several factors described in the Draft EIS, including travel distance and time required to access existing training airspace areas and the frequency of weather conditions that limit the availability of coastal airspace areas for operational training.
Several agencies and non-governmental organizations responded with comments on the Draft EIS (refer to Appendix C of the Final EIS). Some comments related to the use of chaff and flare as a part of training activities raised concerns regarding the potential for increases in wildfire risk, particularly in the more arid and fire-prone region of central and eastern Oregon (refer to Appendix C, specifically comment responses ONDA-12, ODFW-1, DOI (Milchak)-1, DOI (Milchak)-6, and USEPA-5). Commenters asked the Oregon ANG to consider expanding flare use restrictions from “extreme” to “high and extreme”. Additionally, USFWS asked the Oregon ANG to avoid flare use during golden eagle nesting season.1
This technical analysis focuses on the issue of flare use in training by the Oregon ANG, wildfire danger, and wildfire history across the state as a whole but with a more in depth analysis of wildfire conditions in eastern Oregon as a case study. Wildfire danger is not a quantitative value that translates equally across agencies and terrain, and it is subjective to some degree, as it is a tool that management agencies use to communicate the risks of wildfire to the general public. This is particularly true for the Proposed Action which includes airspace areas that span multiple counties and overlies Federal and state lands
1 Additionally, as original described in the Draft EIS, the Oregon ANG would establish seasonal buffer areas from surface to 1,000 feet AGL with a radius of 0.25 miles from mapped bald and golden eagle nests (flight operations would not occur within these buffer areas from 1 January - 15 August).

EIS for Proposed Establishment and Modification of Oregon Military Training Airspace Final – April 2017
I-3
managed by multiple agencies. Therefore, in addition to wildfire danger ratings, other measures to calculate overall fire risk (e.g., weather, fuels, topography, minimum altitude, etc.) have been evaluated and presented where appropriate.
Due to mission critical training requirements and other important safety considerations the Oregon ANG has adopted and employs highly conservative operating (altitude restrictions) procedures and standards throughout its mission critical use of flares during training. The Final EIS declines to adopt commenters’ suggestions to expand flare use restriction during “high and extreme” fire danger. The Draft EIS included a special procedure restricting the use of flares over areas deemed to be in the “extreme” wildfire risk category as determined under the National Fire Danger Rating System (NFDRS). However, upon further analysis, this additional measure has been determined unnecessary and impracticable due to the Oregon ANG’s standard operating procedures of restricting flare use below 5,000 feet AGL. Flares released at an altitude of 5,000 feet AGL would not have the potential to ignite wildfires. The remainder of this technical analysis explains, details and provides support for the Oregon ANG’s decisions, as reflected in the Final EIS.
I.1 INTRODUCTION
The purpose of the Proposed Action, as described in further detail within Section 1, Introduction of the Draft EIS, is to modify existing airspaces as well as establish new airspaces for the purpose of providing properly configured and located military airspace to support military training activities. The need for the Proposed Action is driven by several factors, including travel distance and time required to access existing training airspace areas as well as the frequency of weather conditions that limit the availability of existing coastal airspace areas for training. Under the Proposed Action, new airspace would be established over central Oregon and the eastern boundary of the existing Juniper/Hart MOA Complex in eastern Oregon would be extended approximately 20 miles to the east and 25 miles to the south.
Comments on the Draft EIS regarding the use of flares during training were received from three agencies, U.S. Fish and Wildlife Service (USFWS), U.S. Environmental Protection Agency (USEPA), and Oregon Department of Fish and Wildlife (ODFW), as well as one non-governmental organization, Oregon Natural Desert Association (ONDA) (refer to Appendix C, specifically comment responses ONDA-12, ODFW-1, DOI-1, DOI-6, USEPA-4, and USEPA-5). Concerns expressed centered on the use of flares during “high” and

EIS for Proposed Establishment and Modification of Oregon Military Training Airspace Final – April 2017
I-4
“extreme” wildfire danger conditions, particularly in the more arid region of eastern Oregon, where desert sagebrush habitat exists.
Wildfire danger is normally defined as a descriptor of the combination of factors which affect the initiation, spread, and difficulty of control of wildfires in an area. These factors include fuels, weather, topography, and risk. The National Fire Danger Rating System (NFDRS) ratings are established by fire weather meteorologists at local National Weather Service (NWS) offices using predictive modelling based on broad vegetation patterns, daily and historic weather conditions, and historic wildfire occurrence data at different locations. The resulting wildfire hazard rating is distributed to requesting agencies. Wildfire danger is usually expressed in descriptive terms (i.e., “low”, “moderate”, “high”, “very high”, and “extreme”) (National Wildfire Coordinating Group 2002).
As described in the Draft EIS, the Oregon ANG takes several conservative precautions with the use of flares, particularly in times of fire hazard conditions. Per Air Force Instruction (AFI) 11-214, the minimum altitude for flare use by F-15s over all Federal land is 700 feet above ground level (AGL), in order to ensure flares are completely extinguished before reaching the ground. However, due to increased wildfire risk in the arid west, the Oregon ANG has voluntarily raised the minimum elevation flare use for all training operations to 5,000 feet AGL (AFI 11-2F-15V3 KF CH 8). Based on the burnout time of five seconds for an MJU-7 flare (i.e., the flare model used by Oregon ANG pilots) and the minimum release elevation of 5,000 feet AGL, the difference between the estimated burn out elevation and contact with any potentially flammable material is approximately 4,598 feet AGL (refer to Table 4.7-2 in the Final EIS) nearly 1 mile, or the equivalent of 13 football fields, above the ground surface.2 Even under rare circumstances in which a flare might require double the amount of time predicted for burnout (i.e., 10 seconds), there would still be a 3,390-foot buffer before the flare would contact flammable materials at the ground surface. MJU-7 flares do not have enough flammable materials to support burn times of longer durations.
Comments provided by USFWS on the Draft EIS requested that the Oregon ANG analyze whether wildfire risk would be reduced if flare use was restricted in the proposed airspace
2 One football field includes 100 yards in the field of play as well as two 10-yard end zones, totaling
approximately 360 feet
EIS for Proposed Establishment and Modification of Oregon Military Training Airspace Final – April 2017
I-5
when NFDRS was at a “high” wildfire danger rating. Additional restrictions on the seasonal use of flares would not appear to measurably affect or reduce the potential for wildfires. Instead, restricting flare use based on local and national designations would unduly burden and seriously interfere with not only the Oregon ANG’s mission critical training requirements but also the U.S. Department of Defense’s (DoD’s) tactical defense training mandate. “Extreme” wildfire risk areas are typically only known for the current or following day for a given area. Limited advance warning of these “extreme” fire conditions would not give the Oregon ANG the appropriate amount of time to adjust the weekly flight scheduling with FAA and established daily flight plans. Changes to the flight plan without the appropriate amount of notice, may result in loss of flare training for one or more days. The inability to deploy flares, even if just for a few days a year, could delay or inhibit critical training for the Oregon ANG. In order to minimize wildfire risks, while also accomplishing mission objectives, the Oregon ANG would continue to prohibit flare use below 5,000 feet AGL. Further limiting use of airspace for flare training based on fire ratings would significantly reduce the Oregon ANG pilots’ ability to train and would not provide additional fire safety benefits. Therefore, the requested mitigation measure based on the National Fire Danger Rating would not be practicable.
I.2 EXISTING REGIONAL SETTING
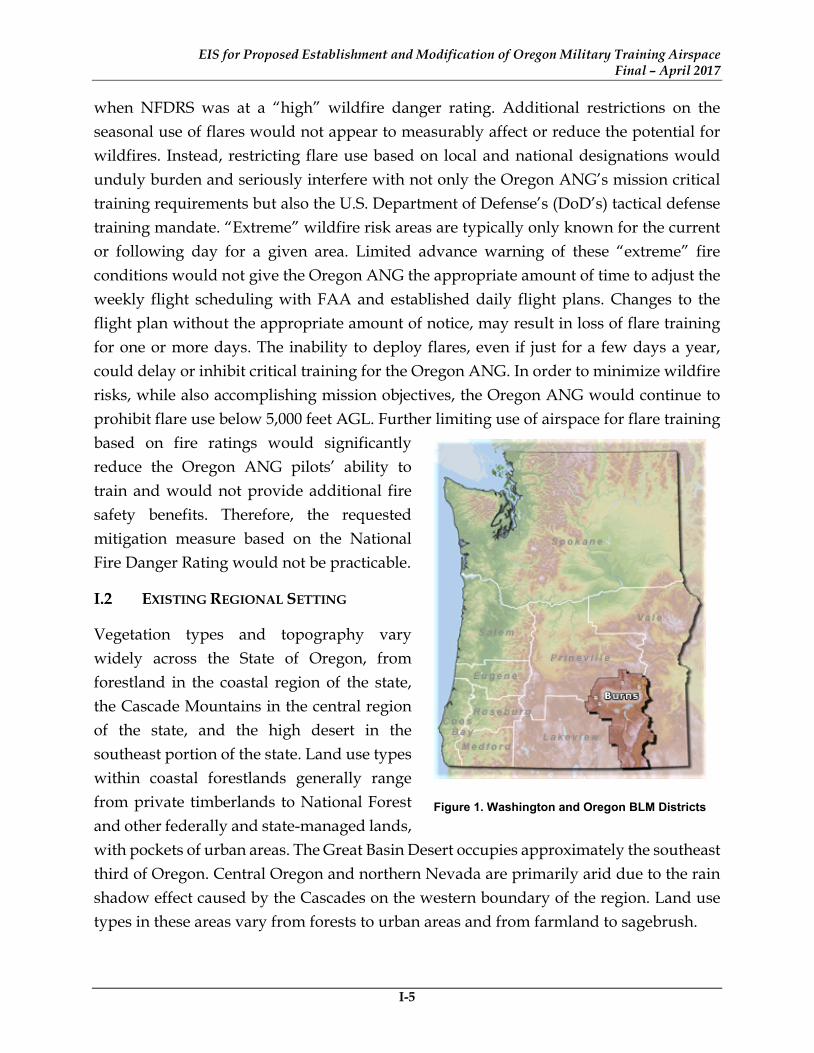
Vegetation types and topography vary widely across the State of Oregon, from forestland in the coastal region of the state, the Cascade Mountains in the central region of the state, and the high desert in the southeast portion of the state. Land use types within coastal forestlands generally range from private timberlands to National Forest and other federally and state-managed lands, with pockets of urban areas. The Great Basin Desert occupies approximately the southeast third of Oregon. Central Oregon and northern Nevada are primarily arid due to the rain shadow effect caused by the Cascades on the western boundary of the region. Land use types in these areas vary from forests to urban areas and from farmland to sagebrush.
Figure 1. Washington and Oregon BLM Districts

EIS for Proposed Establishment and Modification of Oregon Military Training Airspace Final – April 2017
I-6
Complete descriptions of land use types beneath the proposed airspaces included in the Proposed Action area are provided in the Final EIS (refer to Section 3.3, Land Use and Visual Resources and Appendix G, Land Use and Land Management). The existing Juniper/Hart MOA Complex overlies approximately 7,928 square miles in southeastern Oregon. Lands underlying the Juniper/Hart MOA Complex are predominantly managed by the U.S. Bureau of Land Management (BLM). Other federally managed lands underlying the existing and proposed airspace include three National Wildlife Refuges (NWRs), U.S. Forest Service (USFS) land (Burns District), and one Wild and Scenic River. Private land holdings are governed at the local level by county and city governments. No National Parks occur within these areas. Proposed modifications to the Juniper/Hart MOA Complex would include extensions of the airspace to the east and south. The extension of the existing Hart North and South MOA east and south from its existing dimensions would extend the airspace in Harney County in Oregon and establish new airspace over Humboldt County and Washoe County in northwestern Nevada.
The State of Oregon contains 56 million acres (90 percent of all lands) that are potentially burnable. Significantly for this analysis, 22 percent of those burnable acres (56 million acres) are classified as moderate-to-high wildfire risk (Oregon Department of Forestry [ODF] 2013). Although this analysis is largely focused on eastern Oregon, it should be noted that entire state of Oregon is considered highly flammable. Overall wildfire hazards within the state are increased with an increased reduction in moisture and increase in temperature, which is typical of the wildfire season, beginning in May and lasting through October (see Table 1).
Table 1. Fire Season Start and End across the State Forests of Oregon
Fire Season Start Date End Date Total Days Number of Fires Acres Burned
2013 May 10 October 21 164 1,186 104,167
2014 May 22 October 23 154 1,119 53,387
2015 June 1 October 28 149 1,080 86,625
10-Year Average (2005 – 2014)
May 29 October 25 - 987 27,599
Source: ODF 2016a.

EIS for Proposed Establishment and Modification of Oregon Military Training Airspace Final – April 2017
I-7
Known wildfire hazards in Oregon include lightning and human-caused fires. Over 50 percent of all wildfires in eastern Oregon since 1960 have been caused by lightning strikes (ODF 2016; see Figure 2).
In 2015, persistent drought covered most of the state and intensified throughout the summer; by mid-September, Oregon Governor Kate Brown declared drought in 26 of 36 counties. Lightning-caused fires spread quickly in central and eastern Oregon. Approximately 50,000 lightning strikes in Oregon from May through mid-September accounted for 272 fires which burned 69,625 acres, or 80 percent of the total ODF-protected acres that burned in 2015. This total was more than twice the 10-year average for lightning fires (ODF 2016). The extreme fuel conditions and fire weather of 2015 prompted industrial and public fire prevention on a new scale. For example, in northwest Oregon officials had to discourage recreational shooting, as it was becoming a source of wildfire ignition.
I.3 METHODOLOGY
As stated above, wildfire danger is a subjective description normally defined as a combination of factors which affect the initiation, spread, and difficulty of control of wildfires in an area. A wildfire danger rating takes into account current and antecedent weather, fuel types, and both live and dead fuel moisture (ODF 2016b). However, wildfire danger ratings are not used or applied uniformly throughout the State of Oregon. While
Figure 2. Percent Cause of Fires in Eastern Oregon from 1960 to 2016 (ODF 2016d)

EIS for Proposed Establishment and Modification of Oregon Military Training Airspace Final – April 2017
I-8
there is a high-level of cooperation among land use agencies throughout the state, wildfire danger ratings and overall reporting varies greatly.
Readily accessible Federal, state, and interagency sources were used to gather data in an effort to summarize wildfire history and wildfire danger in the region. In addition to publicly available data, additional information was gathered from Federal and state agencies and via interagency cooperation through inquiries via email and telephone. Regional wildfire danger statistics were derived from the Wildland Fire Assessment System (WFAS), which was developed by the Fire Behavior unit at the Fire Sciences Laboratory in Missoula, Montana. The WFAS is supported and maintained at the National Interagency Fire Center (NIFC). As the foundation of the NWS Digital Services Program, the National Digital Forecast Database (NDFD) consists of gridded forecasts of sensible weather elements (e.g., maximum temperature, cloud cover, wind speed, relative humidity, etc.), which are used to make a determination regarding the level of wildfire danger (i.e., “low”, “moderate”, “high”, “very high”, and “extreme”). The NDFD contains a matrix of digital forecasts as reported by NWS field offices working in collaboration with the National Centers for Environmental Prediction (NCEP).
I.4 DATA ANALYSIS
The analysis below provides a regional overview of key variables influencing wildfire, including weather, fuels, and topography. These variables have been used to make inferences about the wildfire season and overall wildfire risk within the State of Oregon throughout the year. Additional analysis of the annual wildfire danger ratings associated with areas beneath and in the vicinity of the Juniper/Hart MOA Complex is also provided as a case study using 2015 wildfire data from the WFAS.
Weather
Weather is the most variable factor affecting wildfire behavior, with some geographic locations having a favorable overall climate for wildfire activity. Predominant wind directions also play a role in influencing a wildfire’s path. Oregon’s climate varies throughout the state but it is generally mild with cool summers and cold winters. The coastal regions are mild to cool year-round while eastern Oregon’s high desert areas are hot in the summer and cold in the winter. Precipitation generally occurs year-round in much of Oregon; however, in southeast Oregon in the desert sagebrush, most precipitation falls in the winter. Table 2 provides long-term climate data for the region beneath the Juniper/Hart MOA Complex in eastern Oregon.

EIS for Proposed Establishment and Modification of Oregon Military Training Airspace Final – April 2017
I-9
Table 2. 1981-2010 Temperature Normals at O O Ranch, Oregon (USC00356302)
Month Precipitation (inches)
Min Temperature (°F)
Average Temperature (°F)
Max Temperature (°F)
January 0.74 19.4 30.0 40.6
February 0.72 23.3 33.9 44.5
March 1.07 28.1 41.0 53.8
April 1.04 30.8 45.4 59.9
May 1.71 35.9 51.3 66.8
June 0.73 41.1 59.3 77.6
July 0.37 47.0 66.7 86.4
August 0.36 44.2 65.3 86.4
September 0.47 35.8 57.0 78.2
October 0.72 30.0 47.4 64.7
November 0.96 24.4 36.5 48.6
December 0.87 18.0 29.0 40.0 Source: NOAA 2016a. Notes: The O O Ranch National Climatic Data Center (NCDC) Station (USC00356302) is located beneath the Juniper C MOA.
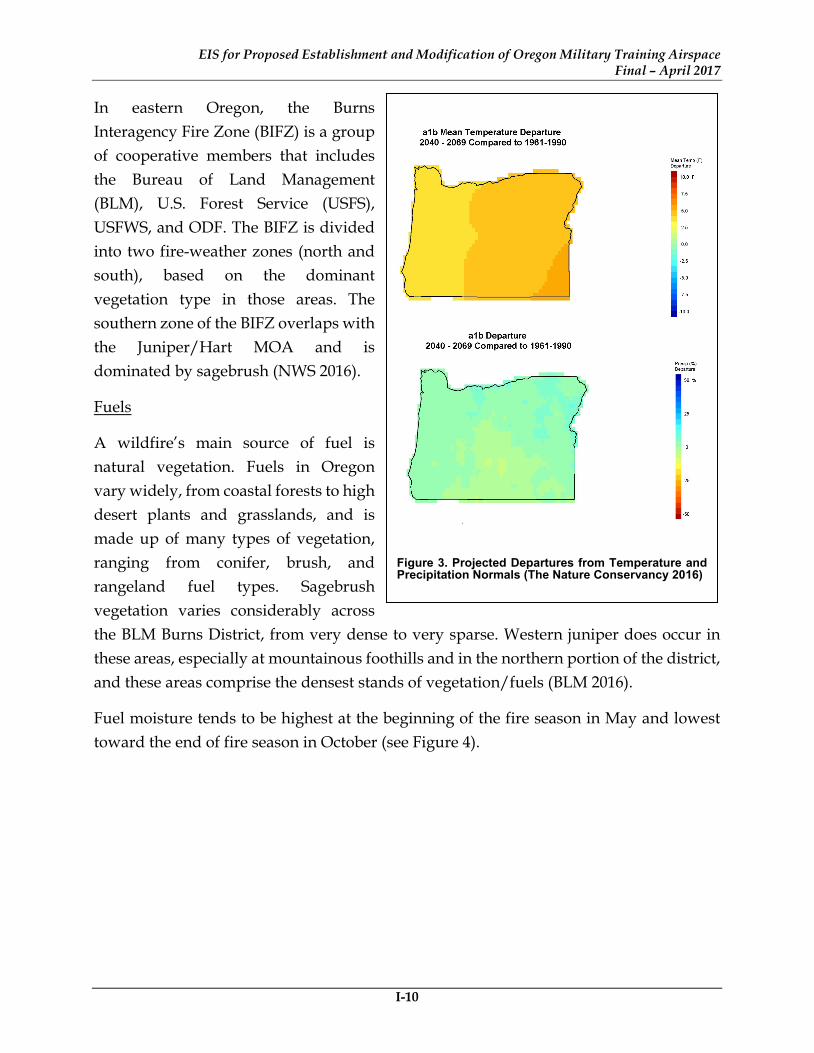
Wildfire conditions, particularly in eastern Oregon, are generally greatest during late spring and early fall months, with a sharp decrease in precipitation and a corresponding increase in overall temperature (refer to Table 2). However, it is likely that in the future, conditions could continue to be warmer and drier during the spring and fall months as a result of climate change. Nature Conservancy climate models, which compare long-term average climate data between 1961-1990 to long-term modeled climate data in 2040-2069) predict approximately 10-degree increases in annual temperature throughout the state with little to no increase in annual precipitation (The Nature Conservancy 2016).
The Fire Weather Planning Forecast is a zone-type product used by land management personnel for decision-making and planning. The forecast decision (the wildfire danger rating) affects firefighter safety, protection of the public and property, and resource allocation. Weather parameters represent average conditions across the given zone.
EIS for Proposed Establishment and Modification of Oregon Military Training Airspace Final – April 2017
I-10
In eastern Oregon, the Burns Interagency Fire Zone (BIFZ) is a group of cooperative members that includes the Bureau of Land Management (BLM), U.S. Forest Service (USFS), USFWS, and ODF. The BIFZ is divided into two fire-weather zones (north and south), based on the dominant vegetation type in those areas. The southern zone of the BIFZ overlaps with the Juniper/Hart MOA and is dominated by sagebrush (NWS 2016).
Fuels
A wildfire’s main source of fuel is natural vegetation. Fuels in Oregon vary widely, from coastal forests to high desert plants and grasslands, and is made up of many types of vegetation, ranging from conifer, brush, and rangeland fuel types. Sagebrush vegetation varies considerably across the BLM Burns District, from very dense to very sparse. Western juniper does occur in these areas, especially at mountainous foothills and in the northern portion of the district, and these areas comprise the densest stands of vegetation/fuels (BLM 2016).
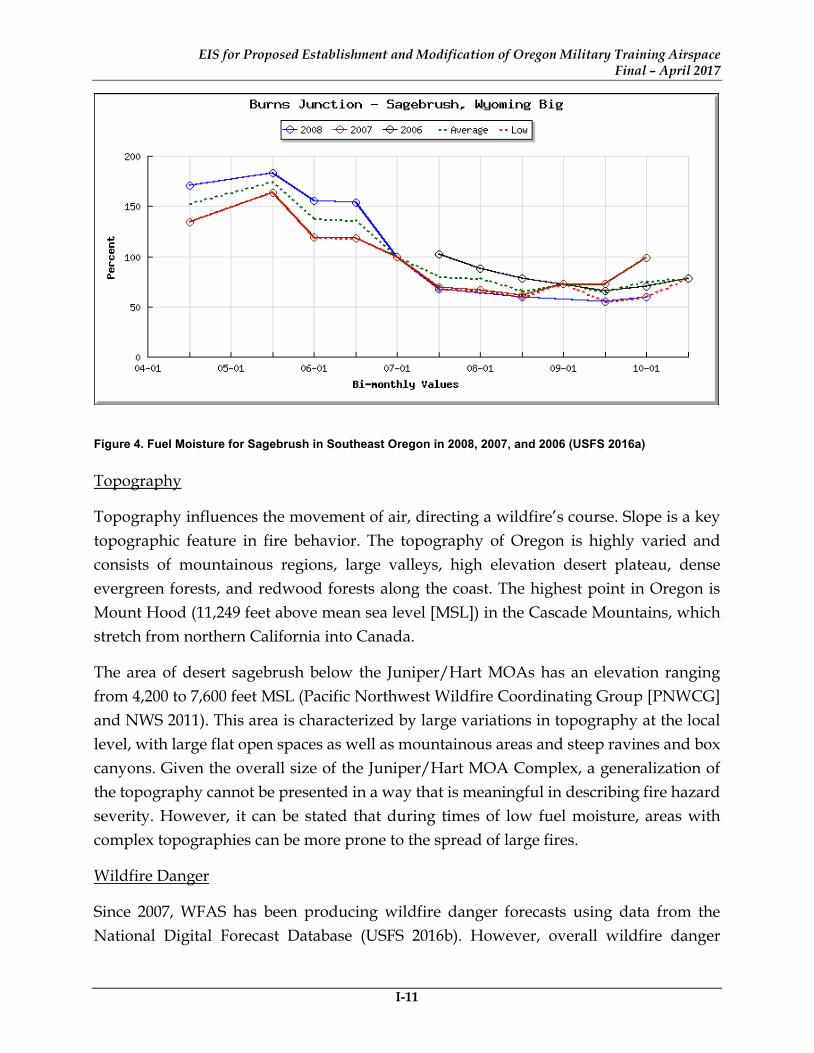
Fuel moisture tends to be highest at the beginning of the fire season in May and lowest toward the end of fire season in October (see Figure 4).
Figure 3. Projected Departures from Temperature and Precipitation Normals (The Nature Conservancy 2016)
EIS for Proposed Establishment and Modification of Oregon Military Training Airspace Final – April 2017
I-11
Figure 4. Fuel Moisture for Sagebrush in Southeast Oregon in 2008, 2007, and 2006 (USFS 2016a)
Topography
Topography influences the movement of air, directing a wildfire’s course. Slope is a key topographic feature in fire behavior. The topography of Oregon is highly varied and consists of mountainous regions, large valleys, high elevation desert plateau, dense evergreen forests, and redwood forests along the coast. The highest point in Oregon is Mount Hood (11,249 feet above mean sea level [MSL]) in the Cascade Mountains, which stretch from northern California into Canada.
The area of desert sagebrush below the Juniper/Hart MOAs has an elevation ranging from 4,200 to 7,600 feet MSL (Pacific Northwest Wildfire Coordinating Group [PNWCG] and NWS 2011). This area is characterized by large variations in topography at the local level, with large flat open spaces as well as mountainous areas and steep ravines and box canyons. Given the overall size of the Juniper/Hart MOA Complex, a generalization of the topography cannot be presented in a way that is meaningful in describing fire hazard severity. However, it can be stated that during times of low fuel moisture, areas with complex topographies can be more prone to the spread of large fires.
Wildfire Danger
Since 2007, WFAS has been producing wildfire danger forecasts using data from the National Digital Forecast Database (USFS 2016b). However, overall wildfire danger

EIS for Proposed Establishment and Modification of Oregon Military Training Airspace Final – April 2017
I-12
throughout a region is extremely localized given the varying microclimates, fuels, and topographies that occur over large land areas. Additionally, while the WFAS maintains data on observed wildfire danger across the country, uniform reporting has not yet been achieved. Although some stations report data regularly, other stations report more sporadically, therefore it is not possible to compare wildfire danger ratings at one station or within one particularly region over large expanses of time.
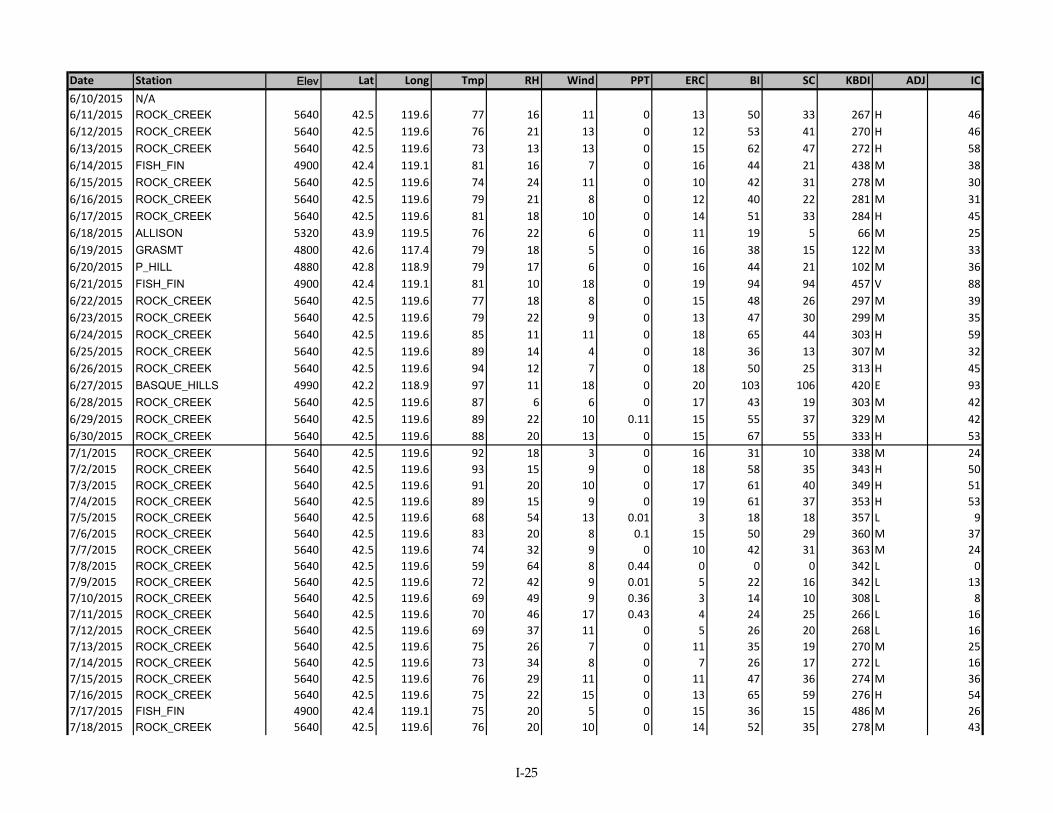
In order to give the most accurate representation of wildfire danger severity, the WFAS was reviewed for the reporting stations located closest to the Juniper/Hart MOA Complex. Seven stations were generally reviewed for representative fire data: Rock Creek, Fish Fin, Basque Hills, and Painted Hill, which are located beneath the proposed airspace, and Grass Mountain, Red Butte, and Allison, located east/northeast of the airspace.
Figure 5. WFAS Fire Weather Observation Data in Eastern Oregon
Source: USFS 2016b.
Notes: ADJ = NFDRS Wildfire Danger Rating M = Moderate, H = High, V = Very High, E = Extreme
As demonstrated by Figure 5 above, while each of the seven stations are located within approximately 100 miles of each other, wildfire danger ratings can vary substantially depending on localized conditions. For example, on 29 August 2015 Rock Creek Station, located beneath the proposed Hart A MOA, reported a “moderate” wildfire danger, while Basque Hills, located 40 miles to the southeast beneath the proposed Juniper D MOA, reported an “extreme” wildfire danger (USFS 2016b). It is rare that the wildfire danger
EIS for Proposed Establishment and Modification of Oregon Military Training Airspace Final – April 2017
I-13
ratings are uniform beneath the airspace, even during the wildfire season. The WFAS data revealed that more often than not, the wildfire danger beneath the airspace is a matrix of different ratings based on extremely localized condition.
In order to generalize the overall wildfire danger over time, each day of 2015 observed wildfire danger record was examined. Rock Creek Station was the preferred reporting station given its central location beneath the Juniper/Hart MOA Complex. However, if data was not available for a particular day at Rock Creek Station, then data was selected from the nearest station that did report information for that date. Grass Mountain and the other stations located east/northeast of the airspace were only selected if no stations located beneath the proposed airspace reported data. It should also be noted that there were 96 days throughout the year where either no stations throughout the State of Oregon and/or within 100 miles of the Juniper/Hart MOA Complex reported wildfire danger data in 2015.
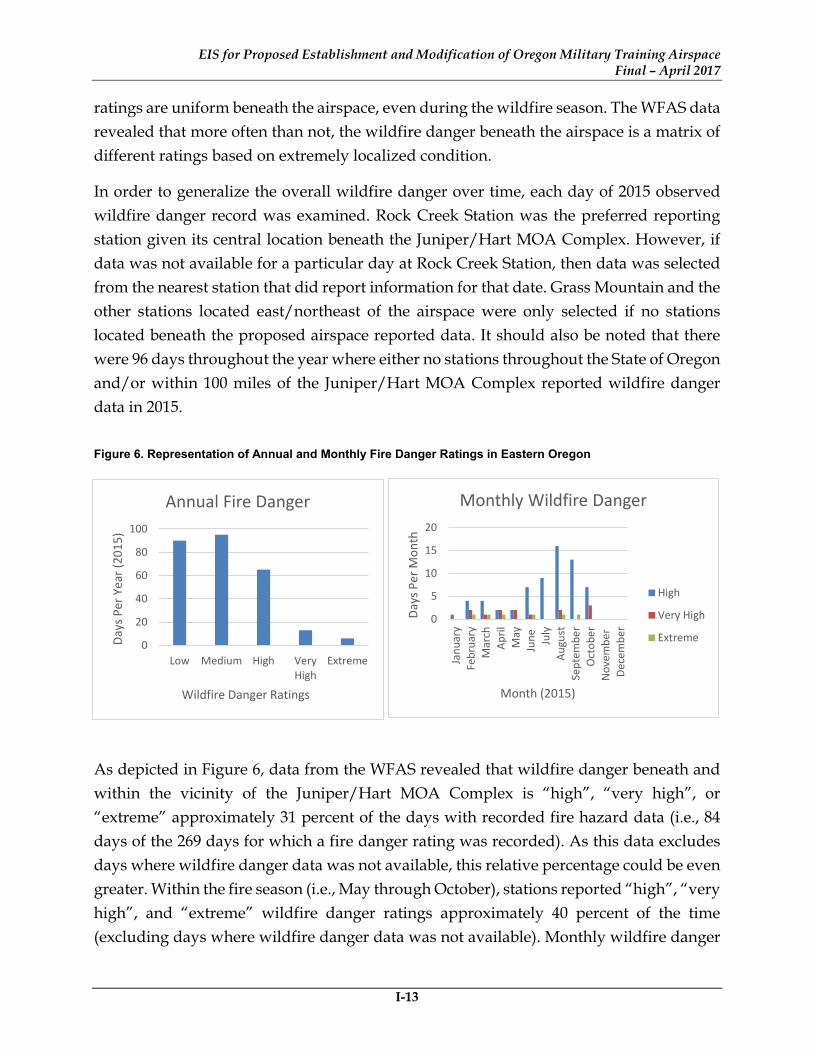
Figure 6. Representation of Annual and Monthly Fire Danger Ratings in Eastern Oregon
As depicted in Figure 6, data from the WFAS revealed that wildfire danger beneath and within the vicinity of the Juniper/Hart MOA Complex is “high”, “very high”, or “extreme” approximately 31 percent of the days with recorded fire hazard data (i.e., 84 days of the 269 days for which a fire danger rating was recorded). As this data excludes days where wildfire danger data was not available, this relative percentage could be even greater. Within the fire season (i.e., May through October), stations reported “high”, “very high”, and “extreme” wildfire danger ratings approximately 40 percent of the time (excluding days where wildfire danger data was not available). Monthly wildfire danger
0
20
40
60
80
100
Low Medium High VeryHigh
Extreme
Days
Per
Yea
r (20
15)
Wildfire Danger Ratings
Annual Fire Danger
0
5
10
15
20
Janu
ary
Febr
uary
Mar
chAp
rilM
ayJu
ne July
Augu
stSe
ptem
ber
Oct
ober
Nov
embe
rDe
cem
ber
Days
Per
Mon
th
Month (2015)
Monthly Wildfire Danger
High
Very High
Extreme

EIS for Proposed Establishment and Modification of Oregon Military Training Airspace Final – April 2017
I-14
ratings greater than “moderate” were reported most often during the months of August and September, however, there were at least 6 days reported as “high”, “very high”, or “extreme” during each month of the fire season.
Wildfire Preparedness
Many interagency fire groups exist in Oregon and the surrounding regions, necessitated by the high cost and technical skill required of fighting wildfires. The level of resources and personnel and equipment available at any given time fluctuates depending on the time of year, location, and wildfire danger.
Oregon’s Complete and Coordinated Fire Protection System relies on landowners and forestry professionals to share firefighting resources and equipment. Other Federal and state agencies, such as the National Wildland Fire Coordinating Group and the National Interagency Fire / Coordination Center (NMAC) via the Northwest Coordination Center for the Geographic Area of Oregon and Washington (PNWCG/MAC), BLM, USFS, NPS, Bureau of Indian Affairs (BIA), USFWS, and many other collaborators, are also involved (ODF 2016).
Since 1995, the BLM has been integrated with the USFS for fire and aviation management. In the Pacific Northwest, the fire program is managed cooperatively between the two agencies and in close collaboration with the Pacific Northwest Wildfire Coordinating Group, an interagency group including the five Federal wildland fire agencies, two state forestry agencies, and two state fire marshal associations. The agencies administer fire, fuels, and aviation programs cooperatively, increasing efficiency and capitalizing on the expertise of each agency's personnel (BLM 2016b).
The BIFZ has a standard for increasing vigilance and crew availability as wildfire danger increases (see Table 3).
Table 3. Burns Interagency Fire Zone Information for the Southern Zone in 2015
Wildfire Danger Level
Adjective
Dispatch Level Management Actions
High 3 Work hours are from 9:30 AM to 6 PM Phone and radio monitored by BICC until 1800 Prepare daily updates to fire recording phone Daily staffing reports required Consider increasing patrols following dry lightning storms

EIS for Proposed Establishment and Modification of Oregon Military Training Airspace Final – April 2017
I-15
Wildfire Danger Level
Adjective
Dispatch Level Management Actions
Predicted LAL between 4 and 6, bump up to Level IV
Very High 4 All of the above PLUS Briefings for Agency Administrators as needed Extended staffing hours if appropriate Consider fire restrictions and public safety messages Consider cancelling planned project work and prescribed fires
Extreme 5 All of the above PLUS Consider ordered stand-by or cancelled leave for employees Consider daily briefings for Agency Administrators Issue regular press releases Maintain regular communication with local fire chiefs and county fire marshals
Source: Burns Interagency Fire Zone 2015.
The State of Oregon is one of three states to adopt a state-wide sage-grouse conservation plan that includes interagency regulatory mechanisms. It also addresses wildfire, a major concern in sagebrush areas. Increases in funding and logistical support for Rangeland Fire Protection Areas have been provided to improve suppression efforts, and the rapid deployment of smokejumpers to remote areas helped limit the fires in sage-grouse habitat. Prescribed wildfire, treatment of encroaching juniper stands, and protection of existing sagebrush habitat are planned BLM activities (USFWS 2016).
I.5 DISCUSSION
Correspondence received from the USFWS and USEPA requested that the Oregon ANG further restrict the use of flares when the NFDRS reports a “high” wildfire danger rating. As described in Section 1.4, Analysis these additional restrictions on the use of flares throughout the year would eliminate the ability of pilots to deploy flares in the proposed airspace – including Juniper/Hart MOA Complex – during approximately one third of the year.
Impact to the Oregon ANG Mission
Combat-effective chaff and flare deployment requires training and frequent use by aircrews in order to both master the devices’ capabilities and ensure safe and efficient handling by ground crews. The Oregon ANG needs to conduct training operations using chaff and flares, in order to provide aircrews with the skills needed to meet and defeat potential hostile challenges to the nation’s security and vital interests. Training is
EIS for Proposed Establishment and Modification of Oregon Military Training Airspace Final – April 2017
I-16
conducted through simulated battle conditions within Department of Defense (DoD) weapons ranges, electronic combat ranges, and other airspace areas, such as MOAs and Military Training Routes (MTRs) that have been assessed and approved for chaff or flare use. Chaff and flares also are used in field exercises. The training resources represented by the use of chaff and flares must be available to support development and implementation of the tactics necessary to prevail in potential combat situations.
The 173d Fighter Wing (173 FW) is the sole Formal Training Unit (FTU) for the F-15C. The FTU is a step in a multi-year journey for a student pilot to become a Combat Mission Ready (CMR) fighter pilot. This journey is known as a “pipeline” due to its multi-step nature and is managed by Headquarters Air Education Training Command, Air Combat Command, and the Air Force Personnel Center. The necessity for flare use during FTU training missions is highlighted within formal studies and required by the F-15C training syllabus. Approximately 33 of the 46 sorties in the Initial Course require flare use by the student pilots and their support aircraft. Reducing deployment of flares or delaying their use in training would result in decreased combat effectiveness by fighter aircrew and a delay in advancing within their “pipeline” training. As mentioned previously, the Oregon ANG does not have the authority to alter “pipeline” training (e.g., restructuring courses or altering training requirements). Delaying a student during their Initial Qualification training would exacerbate an already critical fighter pilot shortage in the Combat Air Force (CAF).
The Initial Qualification Course is approximately 130 training days. Classes are scheduled throughout the year based on requirements driven by the aforementioned commands. As there is not an annual class start date for the Initial Course, the training program and individual training missions could not feasibly avoid the 6-month fire season between May and October. Eliminating the use of the airspace for approximately 84 days out of the year (i.e., during “high”, “very high”, and “extreme” fire danger) would would not be practicable and would result a corresponding delay of up to 84 days in pilot production, which could have carry over effects on future class recruitment. This would severely impact the overall pilot throughput, and would not meet the purpose and need of the Proposed Action to provide a more usable airspace to support efficient, realistic mission-oriented training. The annual number of days considered as “extreme” is also very unpredictable and has the potential to restrict the ability of the Oregon ANG to fully execute pilot training if “extreme” conditions exist for an extended period of time. The inability to deploy flares, even if just for a few days a year, could delay or inhibit critical training for the Oregon ANG and would not be practicable.

EIS for Proposed Establishment and Modification of Oregon Military Training Airspace Final – April 2017
I-17
Existing Special Procedures Related to Flares
The Oregon ANG already conservatively prohibits the use flares below 5,000 feet AGL, which is well beyond the Air Combat Command requirement of a minimum altitude of 700 feet AGL (i.e., the minimum altitude required by AFI 11-214). Additionally Oregon ANG pilots engage a safety on the aircraft that prevents the release of flares on Low A/A training missions, which effectively eliminates the potential to release a flare below 5,000 feet AGL, barring any pilot error. Based on the burnout time for an MJU-7 flare of five seconds and the minimum release elevation of 5,000 feet AGL, the difference between the estimated burnout elevation and contact with any potentially flammable material is approximately 4,598 feet AGL (refer to Table 4.7-2 in the Final EIS), nearly 1 mile, or the equivalent of 13 football fields, above the ground surface. Due to the limited physical quantity of flammable material, flares released at 5,000 feet AGL could not possibly reach the ground surface before extinguishing. Consequently, regardless of the fire danger rating below the aircraft, flares released at an altitude of 5,000 feet AGL would not have the potential to ignite wildfires. In the rare event that a flare fails to ignite and contacts the ground surface, it is handled by the ANG as unexploded ordinance. If an unburned broken or whole flare struck the ground, it would not burn unless subject to temperatures or friction generating temperatures in the one to two thousand degree range (USAF 2011).
I.6 CONCLUSION
In order to minimize wildfire risks, while also accomplishing mission objectives, the Oregon ANG will continue to prohibit flare use below 5,000 feet AGL. The continued implementation of this standard operating procedure per AFI 11-2F-15V3 KF CH 8 would effectively eliminate the potential for wildfire related to flare use by the Oregon ANG regardless of the underlying fire danger rating.

EIS for Proposed Establishment and Modification of Oregon Military Training Airspace Final – April 2017
I-18
I.7 LITERATURE CITED
Bureau of Land Management (BLM). 2016a. “Fire Danger PocketCards - Fuel Model G Oregon/Washington BLM.” http://www.blm.gov/or/districts/burns/fire/pocket-card.php.
BLM. 2016b. “Fire Danger Ratings Oregon/Washington BLM.” http://www.blm.gov/or/resources/fire/fire-ratings.php.
BLM. 2016c. “Fire Oregon/Washington.” http://www.blm.gov/or/resources/fire/.
Burns Interagency Fire Zone (BIFZ). 2015. “Fire Danger Operating and Preparedness Plan.” http://gacc.nifc.gov/nwcc/content/products/Plans/BIFZ_FDOP_2015.pdf.
National Oceanic and Atmospheric Agency (NOAA). 2016. “Data Tools: 1981-2010 Normals.” http://www.ncdc.noaa.gov/cdo-web/datatools/normals.
National Wildfire Coordinating Group. 2002. “Gaining an Understanding of the National Fire Danger Rating System (NFDRS).” http://gacc.nifc.gov/nwcc/content/products/fwx/publications/UnderstandingNFDRS.pdf.
National Weather Service (NWS). 2012. “NWS Boise Fire Weather Annual Report.” National Weather Service. http://www.wrh.noaa.gov/boi/firewx/2012final_copy.pdf.
Oregon Department of Forestry (ODF). 2013. “West Wide Wildfire Risk Assessment Final Report.” http://wflccenter.org/wp-content/uploads/2013/12/WWA_FinalReport_3-6-2016-1.pdf.
ODF. 2016a. “Fire Protection Division 2015 Fire Season Report.” Oregon Department of Forestry. https://www.oregon.gov/ODF/Documents/Fire/2015_Protection_Division_Fire_Season_Report.pdf.
ODF. 2016b. “State of Oregon: Fire - Fire Danger & Weather.” https://www.oregon.gov/ODF/Fire/Pages/Weather.aspx.
ODF. 2016c. “Wildfire - Oregon Department of Forestry: 2016 Fire Season Ends.” Wildfire - Oregon Department of Forestry. http://wildfireoregondeptofforestry.blogspot.com/2016/10/2016-fire-season-ends.html.

EIS for Proposed Establishment and Modification of Oregon Military Training Airspace Final – April 2017
I-19
ODF. 2016d. “FIRES Statistics Charts.” http://www.odf.state.or.us/DIVISIONS/protection/fire_protection/fires/FireCharts.asp#top.
Pacific Northwest Wildfire Coordinating Group (PNWCG) and NWS. 2011. “Northwest Area Fire Weather Annual Operating Plan.” https://www.oregon.gov/ODF/Documents/Fire/PNW_AOP_2011_Final-public.pdf.
The Nature Conservancy. 2016. “ClimateWizard.” http://www.climatewizard.org/#
U.S. Forest Service (USFS). 2016a. “National Fuel Moisture Database.” http://wfas.net/index.php/national-fuel-moisture-database-moisture-drought-103.
USFS. 2016b. “Wildland Fire Assessment System.” http://www.wfas.net/.
U.S. Fish and Wildlife Service (USFWS). 2016. “Greater Sage-Grouse Conservation in Oregon.” http://www.blm.gov/style/medialib/blm/wo/Communications_Directorate/public_affairs/sage-grouse_planning/documents.Par.14122.File.dat/OregonGrSGFactSheet.pdf.
EIS for Proposed Establishment and Modification of Oregon Military Training Airspace Final – April 2017
I-20
ATTACHMENT A
WFAS (2015) Fire Danger Data
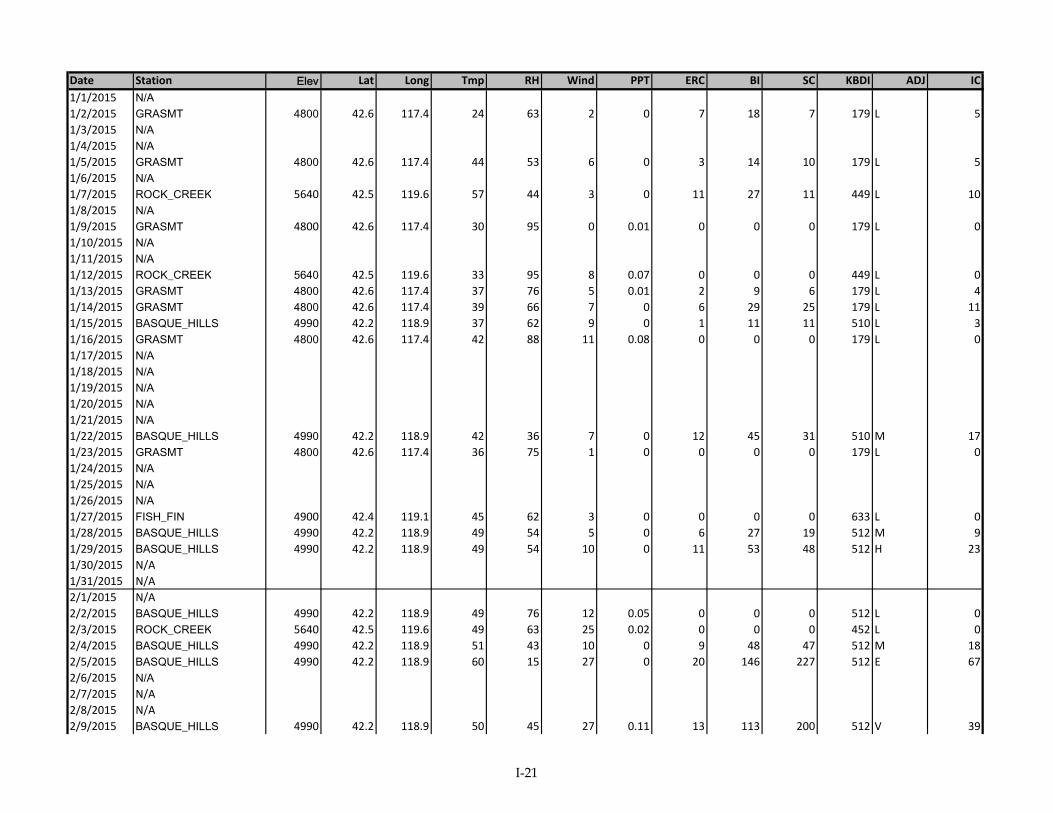
Date Station Elev Lat Long Tmp RH Wind PPT ERC BI SC KBDI ADJ IC1/1/2015 N/A1/2/2015 GRASMT 4800 42.6 117.4 24 63 2 0 7 18 7 179 L 51/3/2015 N/A1/4/2015 N/A1/5/2015 GRASMT 4800 42.6 117.4 44 53 6 0 3 14 10 179 L 51/6/2015 N/A1/7/2015 ROCK_CREEK 5640 42.5 119.6 57 44 3 0 11 27 11 449 L 101/8/2015 N/A1/9/2015 GRASMT 4800 42.6 117.4 30 95 0 0.01 0 0 0 179 L 01/10/2015 N/A1/11/2015 N/A1/12/2015 ROCK_CREEK 5640 42.5 119.6 33 95 8 0.07 0 0 0 449 L 01/13/2015 GRASMT 4800 42.6 117.4 37 76 5 0.01 2 9 6 179 L 41/14/2015 GRASMT 4800 42.6 117.4 39 66 7 0 6 29 25 179 L 111/15/2015 BASQUE_HILLS 4990 42.2 118.9 37 62 9 0 1 11 11 510 L 31/16/2015 GRASMT 4800 42.6 117.4 42 88 11 0.08 0 0 0 179 L 01/17/2015 N/A1/18/2015 N/A1/19/2015 N/A1/20/2015 N/A1/21/2015 N/A1/22/2015 BASQUE_HILLS 4990 42.2 118.9 42 36 7 0 12 45 31 510 M 171/23/2015 GRASMT 4800 42.6 117.4 36 75 1 0 0 0 0 179 L 01/24/2015 N/A1/25/2015 N/A1/26/2015 N/A1/27/2015 FISH_FIN 4900 42.4 119.1 45 62 3 0 0 0 0 633 L 01/28/2015 BASQUE_HILLS 4990 42.2 118.9 49 54 5 0 6 27 19 512 M 91/29/2015 BASQUE_HILLS 4990 42.2 118.9 49 54 10 0 11 53 48 512 H 231/30/2015 N/A1/31/2015 N/A2/1/2015 N/A2/2/2015 BASQUE_HILLS 4990 42.2 118.9 49 76 12 0.05 0 0 0 512 L 02/3/2015 ROCK_CREEK 5640 42.5 119.6 49 63 25 0.02 0 0 0 452 L 02/4/2015 BASQUE_HILLS 4990 42.2 118.9 51 43 10 0 9 48 47 512 M 182/5/2015 BASQUE_HILLS 4990 42.2 118.9 60 15 27 0 20 146 227 512 E 672/6/2015 N/A2/7/2015 N/A2/8/2015 N/A2/9/2015 BASQUE_HILLS 4990 42.2 118.9 50 45 27 0.11 13 113 200 512 V 39
I-21
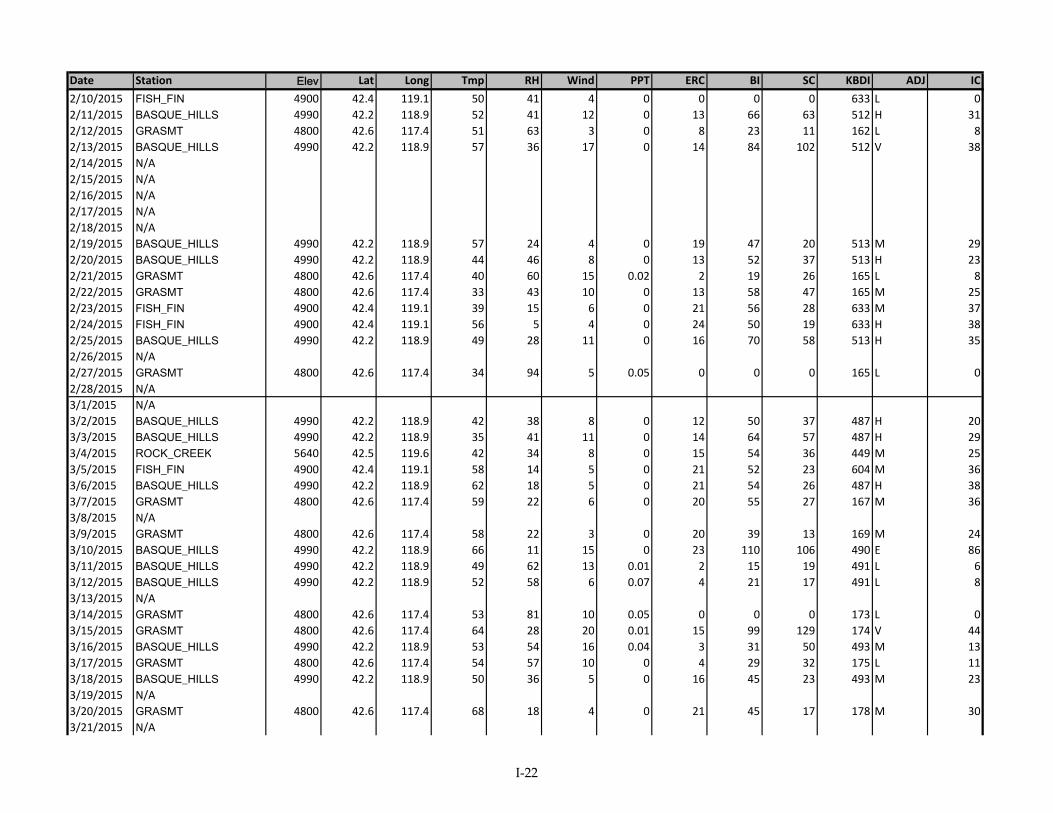
Date Station Elev Lat Long Tmp RH Wind PPT ERC BI SC KBDI ADJ IC2/10/2015 FISH_FIN 4900 42.4 119.1 50 41 4 0 0 0 0 633 L 02/11/2015 BASQUE_HILLS 4990 42.2 118.9 52 41 12 0 13 66 63 512 H 312/12/2015 GRASMT 4800 42.6 117.4 51 63 3 0 8 23 11 162 L 82/13/2015 BASQUE_HILLS 4990 42.2 118.9 57 36 17 0 14 84 102 512 V 382/14/2015 N/A2/15/2015 N/A2/16/2015 N/A2/17/2015 N/A2/18/2015 N/A2/19/2015 BASQUE_HILLS 4990 42.2 118.9 57 24 4 0 19 47 20 513 M 292/20/2015 BASQUE_HILLS 4990 42.2 118.9 44 46 8 0 13 52 37 513 H 232/21/2015 GRASMT 4800 42.6 117.4 40 60 15 0.02 2 19 26 165 L 82/22/2015 GRASMT 4800 42.6 117.4 33 43 10 0 13 58 47 165 M 252/23/2015 FISH_FIN 4900 42.4 119.1 39 15 6 0 21 56 28 633 M 372/24/2015 FISH_FIN 4900 42.4 119.1 56 5 4 0 24 50 19 633 H 382/25/2015 BASQUE_HILLS 4990 42.2 118.9 49 28 11 0 16 70 58 513 H 352/26/2015 N/A2/27/2015 GRASMT 4800 42.6 117.4 34 94 5 0.05 0 0 0 165 L 02/28/2015 N/A3/1/2015 N/A3/2/2015 BASQUE_HILLS 4990 42.2 118.9 42 38 8 0 12 50 37 487 H 203/3/2015 BASQUE_HILLS 4990 42.2 118.9 35 41 11 0 14 64 57 487 H 293/4/2015 ROCK_CREEK 5640 42.5 119.6 42 34 8 0 15 54 36 449 M 253/5/2015 FISH_FIN 4900 42.4 119.1 58 14 5 0 21 52 23 604 M 363/6/2015 BASQUE_HILLS 4990 42.2 118.9 62 18 5 0 21 54 26 487 H 383/7/2015 GRASMT 4800 42.6 117.4 59 22 6 0 20 55 27 167 M 363/8/2015 N/A3/9/2015 GRASMT 4800 42.6 117.4 58 22 3 0 20 39 13 169 M 243/10/2015 BASQUE_HILLS 4990 42.2 118.9 66 11 15 0 23 110 106 490 E 863/11/2015 BASQUE_HILLS 4990 42.2 118.9 49 62 13 0.01 2 15 19 491 L 63/12/2015 BASQUE_HILLS 4990 42.2 118.9 52 58 6 0.07 4 21 17 491 L 83/13/2015 N/A3/14/2015 GRASMT 4800 42.6 117.4 53 81 10 0.05 0 0 0 173 L 03/15/2015 GRASMT 4800 42.6 117.4 64 28 20 0.01 15 99 129 174 V 443/16/2015 BASQUE_HILLS 4990 42.2 118.9 53 54 16 0.04 3 31 50 493 M 133/17/2015 GRASMT 4800 42.6 117.4 54 57 10 0 4 29 32 175 L 113/18/2015 BASQUE_HILLS 4990 42.2 118.9 50 36 5 0 16 45 23 493 M 233/19/2015 N/A3/20/2015 GRASMT 4800 42.6 117.4 68 18 4 0 21 45 17 178 M 303/21/2015 N/A
I-22

Date Station Elev Lat Long Tmp RH Wind PPT ERC BI SC KBDI ADJ IC3/22/2015 N/A3/23/2015 N/A3/24/2015 FISH_FIN 4900 42.4 119.1 41 64 9 0 1 10 10 605 L 33/25/2015 N/A3/26/2015 BASQUE_HILLS 4990 42.2 118.9 66 33 10 0 17 69 53 496 H 423/27/2015 N/A3/28/2015 N/A3/29/2015 N/A3/30/2015 N/A3/31/2015 N/A4/1/2015 ROCK_CREEK 5640 42.5 119.6 40 41 7 0.04 13 46 29 449 L 194/2/2015 N/A4/3/2015 BASQUE_HILLS 4990 42.2 118.9 56 13 13 0 23 99 86 501 E 784/4/2015 N/A4/5/2015 N/A4/6/2015 FISH_FIN 4900 42.4 119.1 49 19 12 0 20 82 68 609 H 524/7/2015 FISH_FIN 4900 42.4 119.1 39 62 8 0 2 11 9 609 L 34/8/2015 FISH_FIN 4900 42.4 119.1 45 69 15 0.25 2 19 26 604 L4/9/2015 N/A4/10/2015 ALLISON 5320 43.9 119.5 56 27 7 0 16 34 13 10 M 304/11/2015 N/A4/12/2015 N/A4/13/2015 ROCK_CREEK 5640 42.5 119.6 61 19 18 0 19 106 119 450 V 614/14/2015 ROCK_CREEK 5640 42.5 119.6 34 54 27 0 6 68 159 451 M 194/15/2015 N/A4/16/2015 ROCK_CREEK 5640 42.5 119.6 57 16 8 0 21 66 40 451 H 454/17/2015 ROCK_CREEK 5640 42.5 119.6 65 16 7 0 21 62 34 452 M 434/18/2015 N/A4/19/2015 N/A4/20/2015 N/A4/21/2015 ROCK_CREEK 5640 42.5 119.6 66 18 8 0 19 63 38 456 M 374/22/2015 ROCK_CREEK 5640 42.5 119.6 53 30 17 0 17 94 104 457 V 504/23/2015 ROCK_CREEK 5640 42.5 119.6 57 31 12 0 14 68 61 457 M 314/24/2015 P_HILL 4880 42.8 118.9 49 39 6 0.3 6 24 15 266 L 134/25/2015 N/A4/26/2015 N/A4/27/2015 ROCK_CREEK 5640 42.5 119.6 62 26 9 0 18 64 44 438 M 394/28/2015 N/A4/29/2015 FISH_FIN 4900 42.4 119.1 64 39 12 0 13 64 60 603 M 294/30/2015 ROCK_CREEK 5640 42.5 119.6 60 16 6 0.01 21 56 28 440 M 38
I-23

Date Station Elev Lat Long Tmp RH Wind PPT ERC BI SC KBDI ADJ IC5/1/2015 GRASMT 4800 42.6 117.4 71 12 6 0 12 34 16 161 M 365/2/2015 N/A5/3/2015 N/A5/4/2015 ROCK_CREEK 5640 42.5 119.6 72 16 13 0 21 92 79 444 V 695/5/2015 ROCK_CREEK 5640 42.5 119.6 58 18 14 0 20 93 85 445 V 635/6/2015 FISH_FIN 4900 42.4 119.1 55 20 10 0 20 74 52 608 H 465/7/2015 FISH_FIN 4900 42.4 119.1 52 29 15 0 15 80 84 608 M 375/8/2015 N/A5/9/2015 N/A5/10/2015 N/A5/11/2015 ROCK_CREEK 5640 42.5 119.6 61 36 11 0 13 60 53 448 M 255/12/2015 ROCK_CREEK 5640 42.5 119.6 43 84 12 0.07 0 0 0 448 L 05/13/2015 ROCK_CREEK 5640 42.5 119.6 47 56 5 0.23 0 0 0 438 L 05/14/2015 ROCK_CREEK 5640 42.5 119.6 41 89 4 0.17 0 0 0 421 L 05/15/2015 ROCK_CREEK 5640 42.5 119.6 41 95 12 0.64 0 0 0 357 L 05/16/2015 N/A5/17/2015 N/A5/18/2015 N/A5/19/2015 ROCK_CREEK 5640 42.5 119.6 55 68 13 0.04 2 14 19 323 L 65/20/2015 ROCK_CREEK 5640 42.5 119.6 49 84 1 0.34 0 0 0 295 L 05/21/2015 BASQUE_HILLS 4990 42.2 118.9 63 38 4 0.11 5 11 3 384 L 85/22/2015 P_HILL 4880 42.8 118.9 62 53 6 0.15 4 12 5 61 L 85/23/2015 N/A5/24/2015 N/A5/25/2015 N/A5/26/2015 ROCK_CREEK 5640 42.5 119.6 64 35 12 0 14 67 61 232 M 335/27/2015 ROCK_CREEK 5640 42.5 119.6 67 29 12 0 17 76 64 233 H 455/28/2015 ROCK_CREEK 5640 42.5 119.6 71 30 5 0 14 38 17 235 M 235/29/2015 BASQUE_HILLS 4990 42.2 118.9 77 23 7 0 8 19 8 341 L 175/30/2015 GRASMT 4800 42.6 117.4 74 28 7 0 4 12 4 43 L 115/31/2015 GRASMT 4800 42.6 117.4 83 14 11 0 6 20 9 47 M 246/1/2015 BASQUE_HILLS 4990 42.2 118.9 71 26 22 0 7 42 42 348 M 366/2/2015 ROCK_CREEK 5640 42.5 119.6 61 42 14 0.02 10 62 72 246 M 256/3/2015 ROCK_CREEK 5640 42.5 119.6 62 41 8 0.01 10 45 34 247 L 176/4/2015 ROCK_CREEK 5640 42.5 119.6 65 31 12 0 5 20 12 248 L 146/5/2015 ROCK_CREEK 5640 42.5 119.6 73 32 14 0 6 24 16 251 L 196/6/2015 ROCK_CREEK 5640 42.5 119.6 73 32 14 0 6 24 16 251 L 196/7/2015 N/A6/8/2015 ROCK_CREEK 5640 42.5 119.6 82 23 5 0 9 23 9 258 L 196/9/2015 ROCK_CREEK 5640 42.5 119.6 77 34 14 0 5 23 16 262 L 16
I-24
Date Station Elev Lat Long Tmp RH Wind PPT ERC BI SC KBDI ADJ IC6/10/2015 N/A6/11/2015 ROCK_CREEK 5640 42.5 119.6 77 16 11 0 13 50 33 267 H 466/12/2015 ROCK_CREEK 5640 42.5 119.6 76 21 13 0 12 53 41 270 H 466/13/2015 ROCK_CREEK 5640 42.5 119.6 73 13 13 0 15 62 47 272 H 586/14/2015 FISH_FIN 4900 42.4 119.1 81 16 7 0 16 44 21 438 M 386/15/2015 ROCK_CREEK 5640 42.5 119.6 74 24 11 0 10 42 31 278 M 306/16/2015 ROCK_CREEK 5640 42.5 119.6 79 21 8 0 12 40 22 281 M 316/17/2015 ROCK_CREEK 5640 42.5 119.6 81 18 10 0 14 51 33 284 H 456/18/2015 ALLISON 5320 43.9 119.5 76 22 6 0 11 19 5 66 M 256/19/2015 GRASMT 4800 42.6 117.4 79 18 5 0 16 38 15 122 M 336/20/2015 P_HILL 4880 42.8 118.9 79 17 6 0 16 44 21 102 M 366/21/2015 FISH_FIN 4900 42.4 119.1 81 10 18 0 19 94 94 457 V 886/22/2015 ROCK_CREEK 5640 42.5 119.6 77 18 8 0 15 48 26 297 M 396/23/2015 ROCK_CREEK 5640 42.5 119.6 79 22 9 0 13 47 30 299 M 356/24/2015 ROCK_CREEK 5640 42.5 119.6 85 11 11 0 18 65 44 303 H 596/25/2015 ROCK_CREEK 5640 42.5 119.6 89 14 4 0 18 36 13 307 M 326/26/2015 ROCK_CREEK 5640 42.5 119.6 94 12 7 0 18 50 25 313 H 456/27/2015 BASQUE_HILLS 4990 42.2 118.9 97 11 18 0 20 103 106 420 E 936/28/2015 ROCK_CREEK 5640 42.5 119.6 87 6 6 0 17 43 19 303 M 426/29/2015 ROCK_CREEK 5640 42.5 119.6 89 22 10 0.11 15 55 37 329 M 426/30/2015 ROCK_CREEK 5640 42.5 119.6 88 20 13 0 15 67 55 333 H 537/1/2015 ROCK_CREEK 5640 42.5 119.6 92 18 3 0 16 31 10 338 M 247/2/2015 ROCK_CREEK 5640 42.5 119.6 93 15 9 0 18 58 35 343 H 507/3/2015 ROCK_CREEK 5640 42.5 119.6 91 20 10 0 17 61 40 349 H 517/4/2015 ROCK_CREEK 5640 42.5 119.6 89 15 9 0 19 61 37 353 H 537/5/2015 ROCK_CREEK 5640 42.5 119.6 68 54 13 0.01 3 18 18 357 L 97/6/2015 ROCK_CREEK 5640 42.5 119.6 83 20 8 0.1 15 50 29 360 M 377/7/2015 ROCK_CREEK 5640 42.5 119.6 74 32 9 0 10 42 31 363 M 247/8/2015 ROCK_CREEK 5640 42.5 119.6 59 64 8 0.44 0 0 0 342 L 07/9/2015 ROCK_CREEK 5640 42.5 119.6 72 42 9 0.01 5 22 16 342 L 137/10/2015 ROCK_CREEK 5640 42.5 119.6 69 49 9 0.36 3 14 10 308 L 87/11/2015 ROCK_CREEK 5640 42.5 119.6 70 46 17 0.43 4 24 25 266 L 167/12/2015 ROCK_CREEK 5640 42.5 119.6 69 37 11 0 5 26 20 268 L 167/13/2015 ROCK_CREEK 5640 42.5 119.6 75 26 7 0 11 35 19 270 M 257/14/2015 ROCK_CREEK 5640 42.5 119.6 73 34 8 0 7 26 17 272 L 167/15/2015 ROCK_CREEK 5640 42.5 119.6 76 29 11 0 11 47 36 274 M 367/16/2015 ROCK_CREEK 5640 42.5 119.6 75 22 15 0 13 65 59 276 H 547/17/2015 FISH_FIN 4900 42.4 119.1 75 20 5 0 15 36 15 486 M 267/18/2015 ROCK_CREEK 5640 42.5 119.6 76 20 10 0 14 52 35 278 M 43
I-25

Date Station Elev Lat Long Tmp RH Wind PPT ERC BI SC KBDI ADJ IC7/19/2015 ROCK_CREEK 5640 42.5 119.6 81 19 5 0 14 35 14 281 M 277/20/2015 ROCK_CREEK 5640 42.5 119.6 82 20 6 0 15 40 18 284 M 327/21/2015 ROCK_CREEK 5640 42.5 119.6 81 22 12 0 13 55 44 287 M 407/22/2015 ROCK_CREEK 5640 42.5 119.6 78 29 17 0.04 12 66 70 290 H 517/23/2015 ROCK_CREEK 5640 42.5 119.6 75 25 13 0.78 11 53 46 231 M 407/24/2015 ROCK_CREEK 5640 42.5 119.6 77 21 12 0 14 57 44 233 H 487/25/2015 ROCK_CREEK 5640 42.5 119.6 77 17 14 0 15 68 57 236 H 597/26/2015 ROCK_CREEK 5640 42.5 119.6 70 37 12 0 7 39 34 238 M 247/27/2015 ROCK_CREEK 5640 42.5 119.6 63 34 10 0.13 9 37 28 240 M 267/28/2015 ROCK_CREEK 5640 42.5 119.6 72 17 6 0 14 38 17 242 M 327/29/2015 ROCK_CREEK 5640 42.5 119.6 81 14 10 0 16 55 35 245 H 517/30/2015 ROCK_CREEK 5640 42.5 119.6 89 11 9 0 18 56 33 250 H 567/31/2015 ROCK_CREEK 5640 42.5 119.6 88 12 4 0 16 34 12 255 M 288/1/2015 FISH_FIN 4900 42.4 119.1 96 11 5 0 19 44 18 492 M 398/2/2015 ROCK_CREEK 5640 42.5 119.6 86 17 12 0 16 63 47 265 H 538/3/2015 ROCK_CREEK 5640 42.5 119.6 80 25 10 0.02 13 49 34 269 M 368/4/2015 ROCK_CREEK 5640 42.5 119.6 83 15 6 0 17 43 19 272 M 378/5/2015 ROCK_CREEK 5640 42.5 119.6 71 34 11 0 9 44 36 275 M 278/6/2015 ROCK_CREEK 5640 42.5 119.6 77 25 7 0 13 40 22 277 M 288/7/2015 ROCK_CREEK 5640 42.5 119.6 74 20 12 0 14 59 46 279 M 418/8/2015 ROCK_CREEK 5640 42.5 119.6 78 18 10 0 15 56 37 282 M 438/9/2015 ROCK_CREEK 5640 42.5 119.6 80 12 14 0 19 78 65 285 H 738/10/2015 FISH_FIN 4900 42.4 119.1 84 16 7 0 18 52 27 514 M 408/11/2015 ROCK_CREEK 5640 42.5 119.6 84 10 14 0 20 83 69 291 V 808/12/2015 ROCK_CREEK 5640 42.5 119.6 85 11 10 0 20 67 43 295 H 638/13/2015 ROCK_CREEK 5640 42.5 119.6 87 9 13 0 21 82 64 299 H 788/14/2015 ROCK_CREEK 5640 42.5 119.6 77 14 16 0 19 89 83 303 H 778/15/2015 ROCK_CREEK 5640 42.5 119.6 75 25 10 0 14 55 39 305 M 378/16/2015 ROCK_CREEK 5640 42.5 119.6 79 16 10 0 18 64 42 307 H 538/17/2015 ROCK_CREEK 5640 42.5 119.6 79 13 11 0 20 72 50 310 H 628/18/2015 ROCK_CREEK 5640 42.5 119.6 82 14 9 0 19 63 38 313 H 548/19/2015 ROCK_CREEK 5640 42.5 119.6 85 14 10 0 19 66 44 316 H 548/20/2015 ROCK_CREEK 5640 42.5 119.6 83 15 9 0 19 63 39 320 H 538/21/2015 ROCK_CREEK 5640 42.5 119.6 78 18 16 0 18 88 84 324 H 718/22/2015 ROCK_CREEK 5640 42.5 119.6 79 11 8 0 21 62 35 327 H 558/23/2015 ROCK_CREEK 5640 42.5 119.6 88 10 17 0 21 102 101 331 E 928/24/2015 ROCK_CREEK 5640 42.5 119.6 84 15 14 0 20 87 74 335 H 748/25/2015 ROCK_CREEK 5640 42.5 119.6 83 12 14 0 20 88 75 338 H 748/26/2015 ROCK_CREEK 5640 42.5 119.6 84 8 13 0 22 89 72 341 V 828/27/2015 ROCK_CREEK 5640 42.5 119.6 83 15 12 0 20 78 60 344 H 61
I-26

Date Station Elev Lat Long Tmp RH Wind PPT ERC BI SC KBDI ADJ IC8/28/2015 ROCK_CREEK 5640 42.5 119.6 81 19 17 0 17 91 94 347 H 638/29/2015 ROCK_CREEK 5640 42.5 119.6 70 41 17 0 11 69 86 350 M 358/30/2015 ROCK_CREEK 5640 42.5 119.6 68 27 11 0 15 63 49 352 M 378/31/2015 ROCK_CREEK 5640 42.5 119.6 75 23 8 0 17 56 33 354 M 399/1/2015 ROCK_CREEK 5640 42.5 119.6 78 19 14 0 19 83 73 356 H 659/2/2015 ROCK_CREEK 5640 42.5 119.6 70 26 15 0 15 77 75 358 H 489/3/2015 ROCK_CREEK 5640 42.5 119.6 54 57 10 0.03 2 14 12 359 L 69/4/2015 ROCK_CREEK 5640 42.5 119.6 51 55 14 0.02 2 17 20 360 L 79/5/2015 ROCK_CREEK 5640 42.5 119.6 53 41 13 0.12 8 46 47 360 M 279/6/2015 BASQUE_HILLS 4990 42.2 118.9 69 14 3 0 20 41 15 507 M 339/7/2015 ROCK_CREEK 5640 42.5 119.6 68 22 14 0 15 68 60 362 H 529/8/2015 ROCK_CREEK 5640 42.5 119.6 77 15 10 0 17 60 40 364 H 529/9/2015 ROCK_CREEK 5640 42.5 119.6 84 11 9 0 18 60 36 367 H 539/10/2015 ROCK_CREEK 5640 42.5 119.6 87 10 9 0 20 63 37 370 H 609/11/2015 ROCK_CREEK 5640 42.5 119.6 88 12 12 0 19 72 54 374 H 649/12/2015 ROCK_CREEK 5640 42.5 119.6 87 12 9 0 19 62 37 378 H 539/13/2015 ROCK_CREEK 5640 42.5 119.6 76 14 7 0 18 51 26 382 M 409/14/2015 ROCK_CREEK 5640 42.5 119.6 66 45 22 0.02 5 48 80 384 M 259/15/2015 ROCK_CREEK 5640 42.5 119.6 52 56 9 0.35 0 0 0 368 L 09/16/2015 ROCK_CREEK 5640 42.5 119.6 47 72 15 0.03 0 3 2 365 L 19/17/2015 ROCK_CREEK 5640 42.5 119.6 52 50 10 0.02 3 14 11 363 L 79/18/2015 ROCK_CREEK 5640 42.5 119.6 66 26 7 0 10 33 18 364 M 239/19/2015 ROCK_CREEK 5640 42.5 119.6 72 22 9 0 12 43 27 365 M 329/20/2015 ROCK_CREEK 5640 42.5 119.6 78 19 10 0 13 49 33 367 M 409/21/2015 ROCK_CREEK 5640 42.5 119.6 79 18 9 0 14 47 29 369 M 389/22/2015 ROCK_CREEK 5640 42.5 119.6 77 15 14 0 15 67 57 371 H 579/23/2015 ROCK_CREEK 5640 42.5 119.6 74 16 11 0 15 57 40 373 H 469/24/2015 ROCK_CREEK 5640 42.5 119.6 78 10 15 0 19 81 70 375 H 799/25/2015 ROCK_CREEK 5640 42.5 119.6 80 12 20 0 17 94 102 377 E 829/26/2015 ROCK_CREEK 5640 42.5 119.6 75 18 14 0 15 68 59 379 H 549/27/2015 REDBU 4460 43.5 117.8 69 34 4 0 10 25 10 370 L 189/28/2015 ROCK_CREEK 5640 42.5 119.6 77 10 6 0 18 46 20 383 M 409/29/2015 ROCK_CREEK 5640 42.5 119.6 77 12 11 0 17 64 45 385 H 559/30/2015 ROCK_CREEK 5640 42.5 119.6 67 17 4 0 15 33 12 387 M 2210/1/2015 N/A10/2/2015 ROCK_CREEK 5640 42.5 119.6 65 25 20 0 13 79 96 389 H 5410/3/2015 ROCK_CREEK 5640 42.5 119.6 51 40 10 0 5 26 22 390 L 1310/4/2015 ROCK_CREEK 5640 42.5 119.6 63 37 7 0 8 30 19 391 L 1710/5/2015 BASQUE_HILLS 4990 42.2 118.9 71 31 5 0 13 37 18 545 M 2610/6/2015 ROCK_CREEK 5640 42.5 119.6 72 21 12 0 14 59 46 393 M 43
I-27

Date Station Elev Lat Long Tmp RH Wind PPT ERC BI SC KBDI ADJ IC10/7/2015 ROCK_CREEK 5640 42.5 119.6 69 24 9 0 12 45 30 394 M 2910/8/2015 ROCK_CREEK 5640 42.5 119.6 78 17 9 0 16 53 33 396 M 4210/9/2015 ROCK_CREEK 5640 42.5 119.6 82 8 15 0 19 85 73 398 V 8010/10/2015 ROCK_CREEK 5640 42.5 119.6 74 19 21 0 15 92 110 400 V 6710/11/2015 ROCK_CREEK 5640 42.5 119.6 69 24 9 0 13 48 31 401 M 3210/12/2015 ROCK_CREEK 5640 42.5 119.6 76 15 9 0 17 55 34 403 M 4410/13/2015 ROCK_CREEK 5640 42.5 119.6 76 17 10 0 16 58 39 405 H 4510/14/2015 ROCK_CREEK 5640 42.5 119.6 76 17 10 0 16 58 39 405 H 4510/15/2015 ROCK_CREEK 5640 42.5 119.6 80 14 8 0 18 54 30 409 M 4310/16/2015 ROCK_CREEK 5640 42.5 119.6 79 18 12 0 16 66 51 411 H 5110/17/2015 ROCK_CREEK 5640 42.5 119.6 57 76 12 0.2 0 0 0 413 L 010/18/2015 BASQUE_HILLS 4990 42.2 118.9 57 62 5 0.14 2 10 5 559 L 410/19/2015 ROCK_CREEK 5640 42.5 119.6 52 51 12 0 2 16 14 413 L 710/20/2015 ROCK_CREEK 5640 42.5 119.6 52 52 7 0 7 33 26 413 L 1210/21/2015 ROCK_CREEK 5640 42.5 119.6 62 30 9 0 15 59 42 414 M 3110/22/2015 ROCK_CREEK 5640 42.5 119.6 59 36 7 0 13 47 29 415 M 2110/23/2015 ROCK_CREEK 5640 42.5 119.6 61 18 8 0 19 63 39 416 M 4010/24/2015 ROCK_CREEK 5640 42.5 119.6 63 17 10 0 20 74 53 417 H 4810/25/2015 ROCK_CREEK 5640 42.5 119.6 60 26 22 0 17 112 153 418 V 5110/26/2015 ROCK_CREEK 5640 42.5 119.6 57 24 15 0 18 88 88 418 H 5010/27/2015 BASQUE_HILLS 4990 42.2 118.9 63 18 10 0 13 50 34 490 H 3810/28/2015 ROCK_CREEK 5640 42.5 119.6 47 73 9 0.04 0 2 1 420 L 010/29/2015 ROCK_CREEK 5640 42.5 119.6 50 51 15 0.01 7 56 76 420 M 2110/30/2015 GRASMT 4800 42.6 117.4 53 52 9 0 2 12 8 321 L 510/31/2015 N/A11/1/2015 N/A11/2/2015 ROCK_CREEK 5640 42.5 119.6 38 75 10 0 0 0 0 420 L 011/3/2015 ROCK_CREEK 5640 42.5 119.6 36 50 16 0 5 43 68 420 L 1511/4/2015 ROCK_CREEK 5640 42.5 119.6 35 59 9 0.03 2 14 13 420 L 511/5/2015 ROCK_CREEK 5640 42.5 119.6 42 40 12 0 11 60 59 420 M 2411/6/2015 N/A11/7/2015 N/A11/8/2015 N/A11/9/2015 BASQUE_HILLS 4990 42.2 118.9 39 63 11 0.13 2 12 10 483 L 411/10/2015 ROCK_CREEK 5640 42.5 119.6 36 61 16 0 2 19 28 420 L 811/11/2015 N/A11/12/2015 BASQUE_HILLS 4990 42.2 118.9 48 48 2 0 11 27 11 483 M 1011/13/2015 ROCK_CREEK 5640 42.5 119.6 54 29 12 0 16 71 62 420 M 3611/14/2015 N/A11/15/2015 N/A
I-28

Date Station Elev Lat Long Tmp RH Wind PPT ERC BI SC KBDI ADJ IC11/16/2015 BASQUE_HILLS 4990 42.2 118.9 29 72 11 0.01 0 0 0 483 L 011/17/2015 BASQUE_HILLS 4990 42.2 118.9 44 64 14 0 0 0 0 483 L 011/18/2015 ROCK_CREEK 5640 42.5 119.6 40 62 8 0 2 12 11 420 L 511/19/2015 ROCK_CREEK 5640 42.5 119.6 50 60 26 0.01 3 38 87 420 L 1711/20/2015 GRASMT 4800 42.6 117.4 37 53 9 0.1 10 48 39 324 M 1911/21/2015 N/A11/22/2015 N/A11/23/2015 ROCK_CREEK 5640 42.5 119.6 53 32 12 0 15 69 62 420 M 3311/24/2015 BASQUE_HILLS 4990 42.2 118.9 40 81 12 0 0 0 0 483 L 011/25/2015 N/A11/26/2015 N/A11/27/2015 N/A11/28/2015 N/A11/29/2015 N/A11/30/2015 GRASMT 4800 42.6 117.4 32 52 8 0 11 45 34 324 M 1712/1/2015 ROCK_CREEK 5640 42.5 119.6 38 60 15 0 0 0 0 420 L 012/2/2015 BASQUE_HILLS 4990 42.2 118.9 42 65 8 0.11 0 0 0 483 L12/3/2015 GRASMT 4800 42.6 117.4 42 61 21 0.01 2 20 37 324 L 812/4/2015 GRASMT 4800 42.6 117.4 40 63 17 0 7 59 90 324 M 2312/5/2015 N/A12/6/2015 N/A12/7/2015 BASQUE_HILLS 4990 42.2 118.9 49 65 17 0 0 0 0 483 L 012/8/2015 FISH_FIN 4900 42.4 119.1 54 61 17 0 0 0 0 665 L 012/9/2015 N/A12/10/2015 GRASMT 4800 42.6 117.4 38 65 26 0.17 2 23 49 324 L 1012/11/2015 BASQUE_HILLS 4990 42.2 118.9 36 52 12 0 0 0 0 470 L 012/12/2015 N/A12/13/2015 N/A12/14/2015 BASQUE_HILLS 4990 42.2 118.9 26 66 20 0 0 0 0 470 L 012/15/2015 BASQUE_HILLS 4990 42.2 118.9 26 74 6 0 0 0 0 470 L 012/16/2015 GRASMT 4800 42.6 117.4 31 72 14 0 1 10 15 322 L 312/17/2015 ROCK_CREEK 5640 42.5 119.6 39 69 31 0.12 0 0 0 366 L 012/18/2015 BASQUE_HILLS 4990 42.2 118.9 39 57 29 0.01 0 0 0 470 L 012/19/2015 BASQUE_HILLS 4990 42.2 118.9 39 57 29 0.01 0 0 0 470 L 012/20/2015 N/A12/21/2015 BASQUE_HILLS 4990 42.2 118.9 41 69 33 0.01 0 0 0 470 L 012/22/2015 N/A12/23/2015 N/A12/24/2015 N/A12/25/2015 N/A
I-29
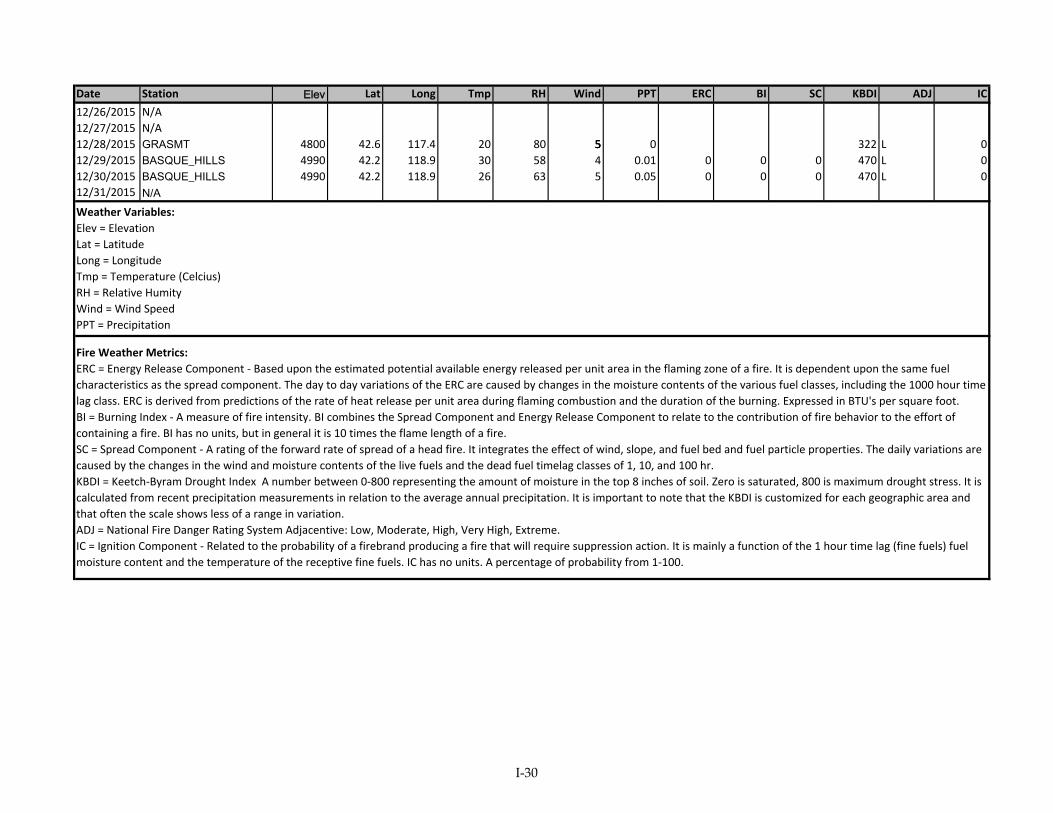
Elev Lat Long Tmp RH Wind PPT ERC BI SC KBDI ADJ IC
4800 42.6 117.4 20 80 5555 0 322 L 04990 42.2 118.9 30 58 4 0.01 0 0 0 470 L 04990 42.2 118.9 26 63 5 0.05 0 0 0 470 L 0
Date Station12/26/2015 N/A12/27/2015 N/A12/28/2015 GRASMT12/29/2015 BASQUE_HILLS12/30/2015 BASQUE_HILLS12/31/2015 N/AWeather Variables:Elev = ElevationLat = LatitudeLong = LongitudeTmp = Temperature (Celcius)RH = Relative HumityWind = Wind SpeedPPT = Precipitation
Fire Weather Metrics:ERC = Energy Release Component ‐ Based upon the estimated potential available energy released per unit area in the flaming zone of a fire. It is dependent upon the same fuel characteristics as the spread component. The day to day variations of the ERC are caused by changes in the moisture contents of the various fuel classes, including the 1000 hour time lag class. ERC is derived from predictions of the rate of heat release per unit area during flaming combustion and the duration of the burning. Expressed in BTU's per square foot.BI = Burning Index ‐ A measure of fire intensity. BI combines the Spread Component and Energy Release Component to relate to the contribution of fire behavior to the effort of containing a fire. BI has no units, but in general it is 10 times the flame length of a fire.SC = Spread Component ‐ A rating of the forward rate of spread of a head fire. It integrates the effect of wind, slope, and fuel bed and fuel particle properties. The daily variations are caused by the changes in the wind and moisture contents of the live fuels and the dead fuel timelag classes of 1, 10, and 100 hr.KBDI = Keetch‐Byram Drought Index A number between 0‐800 representing the amount of moisture in the top 8 inches of soil. Zero is saturated, 800 is maximum drought stress. It is calculated from recent precipitation measurements in relation to the average annual precipitation. It is important to note that the KBDI is customized for each geographic area and that often the scale shows less of a range in variation. ADJ = National Fire Danger Rating System Adjacentive: Low, Moderate, High, Very High, Extreme.IC = Ignition Component ‐ Related to the probability of a firebrand producing a fire that will require suppression action. It is mainly a function of the 1 hour time lag (fine fuels) fuel moisture content and the temperature of the receptive fine fuels. IC has no units. A percentage of probability from 1‐100.
I-30

Annual Fire Hazard Data Fire Hazard by Month
Category Days Percent Month High Very High ExtremeDays Not Reported 96 January 1 0 0Low 90 February 4 2 1Medium 95 March 4 1 1High 65 24% April 2 2 1Very High 13 5% May 2 2 0Extreme 6 2% June 7 1 1
July 9 0 0Total Above Medium 84 31% August 16 2 1
September 13 0 1October 7 3 0November 0 0 0December 0 0 0
0102030405060708090
100
Low Medium High Very High Extreme
Days
Per
Yea
r
Fire Danger Ratings
Annual Fire Danger
02468
1012141618
Days
Per
Mon
th
Month (2015)
Monthly Fire Danger
High
Very High
Extreme
I-31