
Exploration Geochemistry Design and Interpretation of Soil Surveys

Environmental Impact Statement Wellington North Solar Plant
17‐382 Final v2.0 I‐I
APPENDIX I SOIL SURVEYS

DM McMahon Pty Ltd
6 Jones St (PO Box 6118)
East Wagga Wagga NSW 2650
t (02) 6931 0510 www.dmmcmahon.com.au
SOIL SURVEY REPORT
WELLINGTON NORTH
SOLAR FARM
March 2018

Soil Survey Report: Wellington North Solar Farm
DM McMahon Pty Ltd – March 2018 Page 2 of 23
SOIL SURVEY REPORT
WELLINGTON NORTH SOLAR FARM
March 2018
Project brief
At the request of Jane Blomfield of NGH Environmental Pty Ltd, soil sampling, analysis and
reporting was carried out to assess the site on 13 and 14 March 2018. The document
provides information about the site and soil conditions from field observations and laboratory
analysis.
Site identification
Address: Goolma Road, Wellington NSW 2820
Real property description: Lot 109 DP750760
Centre co-ordinate: 683829 6402941 MGA GDA z55
Property size: approx. 970ha
Owner: c/o NGH Environmental Pty Ltd
Local Council Area: Dubbo Regional
Present use: Agriculture
Development Application Reference: not known
Report identification: 5040
Certification
Name Signed Date Revision Number
David McMahon BAppSc GradDip WRM
5/06/18 2
Soil Survey Report: Wellington North Solar Farm
DM McMahon Pty Ltd – March 2018 Page 3 of 23
Contents
CONTENTS........................................................................................................................................... 3
1.0 INTRODUCTION ............................................................................................................................. 5
2.0 SITE CHARACTERISTICS ............................................................................................................. 5
2.1 Topography ............................................................................................................... 5
2.2 Vegetation ................................................................................................................. 5
2.3 Weather .................................................................................................................... 5
2.4 Hydrology .................................................................................................................. 5
2.5 Soil & Landform ......................................................................................................... 6
2.6 Geology ..................................................................................................................... 7
2.7 Hydrogeology ............................................................................................................ 7
2.8 Biophysical Strategic Agricultural Land ...................................................................... 7
3.0 INVESTIGATION SCOPE OF WORKS .......................................................................................... 7
4.0 RESULTS ....................................................................................................................................... 9
4.1 Field Survey .............................................................................................................. 9
4.2 Typical Soil Profiles ................................................................................................... 9
4.2.3 Ferrosols (Equivalent to Euchrozems). .............................................................. 10
4.4 Laboratory Analysis ................................................................................................. 10
4.4.1 Topsoil Analysis ................................................................................................... 11
4.4.1.1 pH & Electrical Conductivity ........................................................................... 11
4.4.1.2 Cation Exchange Capacity, Exchangeable Sodium Percentage & Dispersion 11
4.4.1.3 Colwell Phosphorus and Phosphorus Buffering Index .................................... 11
4.4.1.4 Calcium:Magnesium Ratio ............................................................................. 11
4.4.2 Subsoil Analysis ................................................................................................... 11
4.4.2.1 pH & Electrical Conductivity ........................................................................... 11
4.4.2.2 Dispersion ...................................................................................................... 11
5.0 SUMMARY OF TEST RESULTS ................................................................................................. 12
6.0 COMMENTS AND RECOMMENDATIONS.................................................................................. 14
6.1 Potential Limitations ................................................................................................ 14
6.2 Erosion Control ....................................................................................................... 14
6.3 Acid Sulfate Soils .................................................................................................... 15
6.4 Potential Impacts on Salinity, Groundwater Resources and Hydrology .................... 15
6.5 Potential Impacts on Agricultural Resources ........................................................... 17
6.6 Potential for the project to improve erosion characteristics of the land ..................... 17
6.5 Soil Characteristics and Management Responses................................................... 18
6.5.1 Ferrosols ........................................................................................................... 18
7.0 NOTES RELATING TO RESULTS .............................................................................................. 21
8.0 DISCLAIMER ................................................................................................................................ 22

Soil Survey Report: Wellington North Solar Farm
DM McMahon Pty Ltd – March 2018 Page 4 of 23
9.0 REFERENCES .............................................................................................................................. 22
10.0 ATTACHMENTS ......................................................................................................................... 23
List of Figures
Figure 1: Soil survey investigation pit locations. ................................................................. 9
Figure 2: Typical soil profile with A, B and C horizons. ..................................................... 10
Figure 3: Typical soil profile with A and B horizons. .......................................................... 10
Figure 4: Bodangora soil landscape with site overlay. ...................................................... 14
Figure 5: Registered groundwater bores on and near the site. ......................................... 16
List of Tables
Table 1: Soil Landscapes ................................................................................................... 6
Table 2: Scope of Works .................................................................................................... 8
Table 3: Topsoil - Results of laboratory testing. ................................................................ 12
Table 4: Subsoil - Results of laboratory testing. ................................................................ 13
Table 5: Potential landscape limitation assessment .......................................................... 14
Table 6: Registered groundwater bores in the locale (DPI, 2018). .................................... 16
Table 7: Characteristics and Management Responses. .................................................... 18

Soil Survey Report: Wellington North Solar Farm
DM McMahon Pty Ltd – March 2018 Page 5 of 23
1.0 Introduction
The report presents the results of a soil survey carried out by DM McMahon Pty Ltd
(McMahon) for the proposed Wellington North Solar Farm near Wellington, NSW.
The soil and land survey work was commissioned by Jane Blomfield of NGH Environmental
Pty Ltd and was undertaken in general accordance with an email dated 7 August 2017 from
Nick Graham-Higgs of NGH Environmental Pty Ltd. The survey was carried out utilising a
backhoe to excavate soil pits for evaluation to a depth of approximately 1.2m. Alice Debney
of DM McMahon Pty Ltd conducted a free soil survey on 13 and 14 March 2018 using
standard soil surveying techniques. Sampling and classification of in situ soils was carried
out as per the Australian Soil and Land Survey Field Handbook (2009) and The Australian
Soil Classification (Isbell, 1996). Density of investigation pits was determined via Guidelines
for Surveying Soil and Land Resources (2008) where selection of a ‘Moderately High
(Detailed)’ intensity level was deemed appropriate for satisfying the objectives for detailed
project planning.
2.0 Site Characteristics
A brief desktop review and investigation of the topography, hydrology, soil, lithology, geology
and hydrogeology of the site has been undertaken and are as follows:
2.1 Topography
The site is situated over two different Topographic map sheets: The Wellington 1:50,000
Topographic map sheet (8632-N) and the Geurie 1:50,000 Topographic map sheet (8633-
S). The site is located at an elevation range of approximately 340m to 400m AHD. The site
slope is classed as level to very gently inclined in the west and gently to moderately inclined
to the east. The landform is generally a simple slope with a crest formation to the east and
drainage plain associated with the first, second and fourth order streams which are tributaries
of the Wuuluman Creek to the south west.
2.2 Vegetation
The site is used for agricultural production, predominantly livestock. The pastures consist of
largely lucerne, with one paddock of sorghum. Cathead and paddy melon weeds are
prevalent. A more detailed assessment of vegetation present can be seen in the NGH
environmental scoping report.
2.3 Weather
The mean rainfall for Wellington is approximately 617.1mm per annum. The wettest months
are November, December and January, however the rainfall is spread relatively evenly
throughout the year. Mean maximum temperatures range from 15.2 ºC in July to 33.0 ºC in
January and mean minimum temperatures range from 2.2 ºC in July to 15.2 ºC in January.
Historical records obtained from Wellington (D&J Rural) AWS 065034 (www.bom.gov.au).
2.4 Hydrology
The site is located in the Macquarie River catchment area. Natural watercourses have been
extensively modified since European settlement to improve channel efficiency. Run-off of

Soil Survey Report: Wellington North Solar Farm
DM McMahon Pty Ltd – March 2018 Page 6 of 23
surface waters from precipitation flow into the drainage system of Wuuluman Creek and
ultimately into the Macquarie River.
2.5 Soil & Landform
The site is on soil landscapes coded bz from the Soil and Land Resources of Central and
Eastern NSW (OEH, 2017). A brief description of the soil landscapes are as follows, Table
1.
Table 1: Soil Landscapes
bz – Bodangora
Topography Low undulating hills ranging in elevation from 300 – 500 m. Local relief from
40 – 100m. Slopes are gently inclined (3 – 10%) with slopes from 1000 – 3000
m long. Drainage lines are 500 – 1000 m apart.
Soils: Euchrozems
Topsoil
Dark reddish-brown clay loams to light clays, moderately well structured with
sub-angular or angular blocky peds. Field pH increases from 5.5 to 7.0 in the
A horizon; to 35cm depth. Gradual boundary to-
Subsoils
Moderate to strongly structured reddish-brown light to medium clays with
smooth-faced, sub-angular or polyhedral peds. Gravel increases with depth
and soft nodules of calcium carbonate begin to appear at about 90cm depth.
Field pH 8.0 to 8.5.
Non-calcic Brown Soils
Top Soils
Hardsetting, gravelly (50-90%) dark reddish-brown fine sandy loams to sandy
clay loams with weak crumb or sub-angular blocky peds; pH 6 – 7; to 30cm
depth. Clear boundary to –
Subsoils
Gravelly, dark reddish-brown, light medium clays with moderately structured
fine sub-angular blocky peds; pH 8.0; weathered rock is encountered at about
80cm.
Terra Rossa Soils
Topsoils
Friable dark reddish-brown fine sandy clay loams to clay loams with
moderately structured, fine angular blocky, smooth-faced peds. pH 5.5; 12cm
depth. Clear boundary to-
Subsoils
Dark reddish-brown, clay loams to medium clays; strongly structured, fine
angular blocky peds with some limestone gravel at depth; pH 7.0 to 8.0,
becoming 8.0 to 8.5 at depth.
Geology and Regolith:
Geological units are Ordovician undifferentiated, Silurian undifferentiated and
Gowan Green Group. Parent rocks are Andesite, tuff, keratophyric lava and
tuff, shale, limestone, conglomerate, agglomerate, siltstone and chert. In situ
and colluvial-alluvial materials are derived from parent rock.

Soil Survey Report: Wellington North Solar Farm
DM McMahon Pty Ltd – March 2018 Page 7 of 23
The site lies within the mapping unit MO3 from the Digital Atlas of Australian Soils (CSIRO,
1991). The map unit MO3 is described as:
"MO3"
"Gently undulating plains with occasional higher stony ridges: a complex array of soils is
present but loamy nodular mottled yellow earths (Gn2.61), with lesser (Gn2.64) and
(Gn2.74), are probably dominant. Closely associated are important areas of loamy or, less
commonly, sandy red earths (Gn2.11, Gn2.14); these usually occur on well-defined stream
levees. Smaller areas of friable earths (Gn3.71) and (Gn3.91) and deep loamy duplex soils
(Dy3.81) also occur. The higher stony ridges have shallow gravelly duplex soils (Dy3.41)
and shallow stony loams (Um2.12) and (Um4.1). Data are fairly limited. Occurs on
sheet(s): 7"
2.6 Geology
The site geology is distributed over one unit: Ordovician sedimentary volcanics.
2.7 Hydrogeology
From the Geoscience Australia hydrogeology dataset, the groundwaters beneath the site are
crossed over two units. They are described as porous extensive highly productive aquifers
and fractured or fissured, extensive aquifers of low to moderate productivity.
2.8 Biophysical Strategic Agricultural Land
The site is located within a Biophysical Strategic Agricultural Land (BSAL) area, NSW DPE
2016. The dataset comes with an important note for users, that ‘mapping was done at a
regional scale, not at a property boundary level’ therefore, a site-specific assessment is
required to gauge the development against the BSAL mapping. A further investigation of
the metadata which provides criteria for the BSAL mapping demonstrates that the site is
within two classes being ‘grazing - modified pasture’ in the east and ‘dryland cropping’ in the
west, OEH 2018. This is in conflict with the criteria for the BSAL mapping which suggests
that land capability classes I or II under the Land and Soil Capability Mapping of NSW is
BSAL land. Of note are the incorrect classes have been applied to the BSAL mapping with
the old land classes I and II from the NSW Agriculture 2002 system being incorrectly applied
to the Land and Soil Capability Classes of 1 and 2, OEH 2012. The classification systems
are inverse which confuses the relevance of the BSAL dataset for use in land classification.
However, this assessment of the subject site categorises the land as Class 3 in the western
lower slopes and plains and Class 4 on the eastern higher slopes and crests by reference to
the Land and Soil Capability Classes, OEH 2012. Class 3 is defined as having moderate
agricultural limitations with careful management required while Class 4 has moderate to high
agricultural limitations with restricted management options. Based on the above, the land
does not qualify as BSAL under the current classification system. More on the site-specific
impacts of the proposal and the recommended management can be seen in section 6.6.
3.0 Investigation Scope of Works
The specifications for the site investigation and soil survey are as follows, Table 2:

Soil Survey Report: Wellington North Solar Farm
DM McMahon Pty Ltd – March 2018 Page 8 of 23
Table 2: Scope of Works
Item Description Description
1. Where available, review plans and other general related documents provided to us to gain a comprehensive understanding of the proposed project.
-
2. Undertake a desktop study of local landform, geological, lithological & hydrogeological conditions.
-
3. Conduct Dial Before You Dig search. -
4. Carry out field investigations by reference to Guidelines for Surveying Soil and Land Resources (2008) & AS1726:1993 Geotechnical Site Investigations.
40 pits in total. Samples of topsoils, B, B/C and C horizons taken where present to adequately classify soils as per ASC 1996.
5. Analyse soils in situ and at our NATA accredited laboratory to AS/RMS methods.
10 x Representative samples for topsoil analysis – pH, EC, nutrient and cation status. 10 x Representative samples for subsoil analysis – pH, EC, dispersion.
6. Generate laboratory reports and review results.
-
7. Compile results in report detailing methodology, desktop study, physical conditions, field work results, test locations, bore logs, in-situ test results, laboratory results and discussion.
-
8. Recommendations for erosion control and prevention measures and management recommendations for earthworks.
-
As follows is a map of the investigated site and investigation pit locations, Figure 1.

Soil Survey Report: Wellington North Solar Farm
DM McMahon Pty Ltd – March 2018 Page 9 of 23
Figure 1: Soil survey investigation pit locations.
4.0 Results
4.1 Field Survey
A free soil survey was conducted using standard soil surveying techniques. Sampling and
classification of in situ soils was carried out as per the Australian Soil and Land Survey Field
Handbook (2009) and The Australian Soil Classification (Isbell, 1996). Density of
investigation pits was determined via Guidelines for Surveying Soil and Land Resources
(2008) where selection of a ‘Moderately High (Detailed)’ intensity level was deemed
appropriate for satisfying the objectives for detailed project planning. Soils encountered were
typical of the locale, generally falling into reconnaissance survey classes. Slight variations in
profiles exist due to remnant channels and the complex soil sequences that are associated
with such. Soil moisture contents varied considerably between soil types but were generally
found to be moderately moist at depth. Free groundwater was not encountered within the
investigated depths.
4.2 Typical Soil Profiles
Soils can be classified into a typical soil profile across the site as per the Australian Soil
Classification system (Isbell, 1996) and the Great Soil Groups (Stace et al., 1968).
Representative photographs from profiles examined on site can be seen below with a brief
description of the profile characteristics. All soil pits investigated were located on managed
agricultural lands. Field soil log sheets can be seen attached.

Soil Survey Report: Wellington North Solar Farm
DM McMahon Pty Ltd – March 2018 Page 10 of 23
4.2.3 Ferrosols (Equivalent to Euchrozems).
Topsoil
Dark reddish-brown clay loams to light clays, moderately well-structured with sub-angular or
angular blocky peds. Field pH increases from 5.5 to 7.0 in the A horizon; to 35cm depth.
Gradual boundary to-
Subsoils
Moderately to strongly structured reddish-brown light to medium clays with smooth-faced,
sub-angular or polyhedral peds. Gravel increases with depth and soft nodules of calcium
carbonate begin to appear at about 90cm depth. Field pH 8.0 to 8.5.
Figures 2 and 3 represent typical soil profiles on site.
4.4 Laboratory Analysis
Ten representative topsoil samples were obtained and analysed at a NATA accredited
laboratory for the establishment of baseline soil data that may be referred to and used in
preparation of a site decommissioning plan. Laboratory COA’s can be found in the
attachments and soil parameters can be seen summarised in Table 3. Ten subsoil samples
were also analysed for pH and EC, and tested for dispersion, Table 4.
There was one outlier set of results in soil pit 34 that has been left out of the ranges provided
below. There is the possibility of a sampling or laboratory error that has rendered inaccurate
results. There was, however, considerably more moisture in the soil profile than any other
soil pit, with the A Horizon classified as ‘T’ (moderately moist) and the B Horizon classified
as ‘T – M’ (moderately moist to moist). Water and salt accumulates in open drainage
depressions which is indicative of the landscape at this point. Salt from the colluvial water
fluxes can accumulate in the soil after long periods of low rainfall, which may explain the high
Figure 2: Typical soil profile with A and B
horizons. Figure 3: Typical soil profile with A, B and C
horizons.

Soil Survey Report: Wellington North Solar Farm
DM McMahon Pty Ltd – March 2018 Page 11 of 23
Electrical Conductivity (EC), chloride and Exchangeable Sodium Percentage (ESP)
readings.
4.4.1 Topsoil Analysis
4.4.1.1 pH & Electrical Conductivity
Topsoil pH (1:5 soil/water) ranged from 5.3 to 7.4 and can be classed as ‘Strongly Acid’ to
‘Mildly Alkaline’ (Bruce & Rayment, 1982). EC ranged from 0.03 to 0.27 dS/m and therefore
the salinity rating was ‘very low’ (Agriculture Victoria, 2011).
4.4.1.2 Cation Exchange Capacity, Exchangeable Sodium Percentage & Dispersion
Cation Exchange Capacity (CEC) ranges from 5.3 to 19.3 cmol(+)/kg. CEC of the soils is
rated by Hazelton and Murphy (2007), as ‘very low’ (<6) to ‘moderate’ (12 - 25). ESP ranges
from 0.17% to 2.00%, which is given a sodicity rating of ‘non-sodic’ (0-6) (Hazelton & Murphy,
2007). Field determination of dispersion was Nil in all topsoil samples, with some slacking in
3 of the samples. It should be noted that one result (soil pit 34) had an ESP of 36%, however,
field determination of dispersion was nil and therefore this is considered an outlier.
4.4.1.3 Colwell Phosphorus and Phosphorus Buffering Index
Colwell P (plant available phosphorus) ranges from 8 to 140mg/kg, which is classed as
‘Extremely low’ to ‘Low’ (AWI, 2008). Phosphorus Buffering Index (PBI) ranged from 22 to
110 and is classed from ‘very, very low’ (15 - 30) to ‘low’ (71 – 140) (Agriculture Victoria,
2011).
4.4.1.4 Calcium:Magnesium Ratio
Ca:Mg ratio should be at least 2:1. Higher calcium contents are acceptable however higher
magnesium content may result in soil dispersion. Ca:Mg determined for topsoils returned
results ranging from 0.5 to 4.7, indicating that there is low potential for dispersion of topsoils
upon wetting.
4.4.2 Subsoil Analysis
4.4.2.1 pH & Electrical Conductivity
Subsoil pH (1:5 soil/water) ranged from 6.2 to 7.3 and can be classed as ‘Slightly Acid’ to
‘Neutral’ (Bruce & Rayment, 1982). EC ranged from 0.036 to 0.231 dS/m and therefore the
salinity rating was ‘very low’ (Agriculture Victoria, 2011).
4.4.2.2 Dispersion
Field determination of dispersion indicated that all soils are unlikely to be sodic. (Hazelton &
Murphy, 2007).
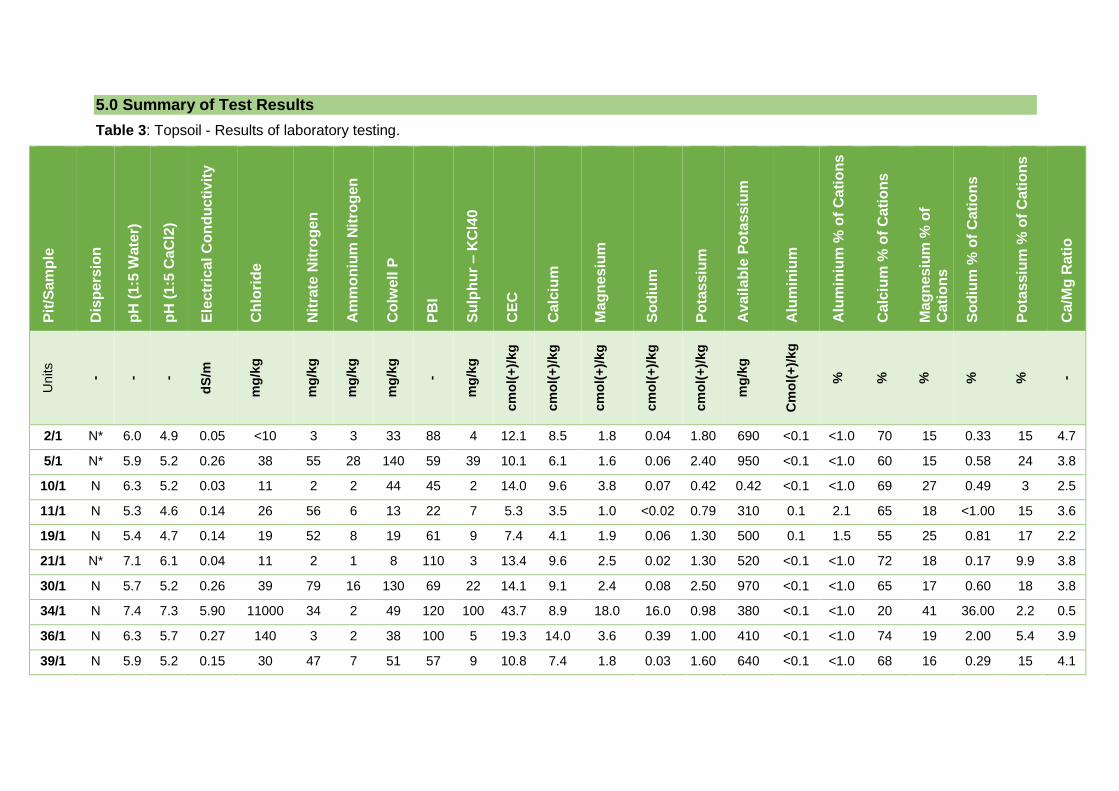
5.0 Summary of Test Results
Table 3: Topsoil - Results of laboratory testing.
Pit
/Sam
ple
Dis
pe
rsio
n
pH
(1
:5 W
ate
r)
pH
(1
:5 C
aC
l2)
Ele
ctr
ical C
on
du
cti
vit
y
Ch
lori
de
Nit
rate
Nit
rog
en
Am
mo
niu
m N
itro
gen
Co
lwell P
PB
I
Su
lph
ur – K
Cl4
0
CE
C
Ca
lciu
m
Ma
gn
es
ium
So
diu
m
Po
tas
siu
m
Av
ail
ab
le P
ota
ssiu
m
Alu
min
ium
Alu
min
ium
% o
f C
ati
on
s
Ca
lciu
m %
of
Ca
tio
ns
Ma
gn
es
ium
% o
f
Ca
tio
ns
So
diu
m %
of
Cati
on
s
Po
tas
siu
m %
of
Ca
tio
ns
Ca
/Mg
Ra
tio
Units
- - -
dS
/m
mg
/kg
mg
/kg
mg
/kg
mg
/kg
-
mg
/kg
cm
ol(
+)/
kg
cm
ol(
+)/
kg
cm
ol(
+)/
kg
cm
ol(
+)/
kg
cm
ol(
+)/
kg
mg
/kg
Cm
ol(
+)/
kg
%
%
%
%
%
-
2/1 N* 6.0 4.9 0.05 <10 3 3 33 88 4 12.1 8.5 1.8 0.04 1.80 690 <0.1 <1.0 70 15 0.33 15 4.7
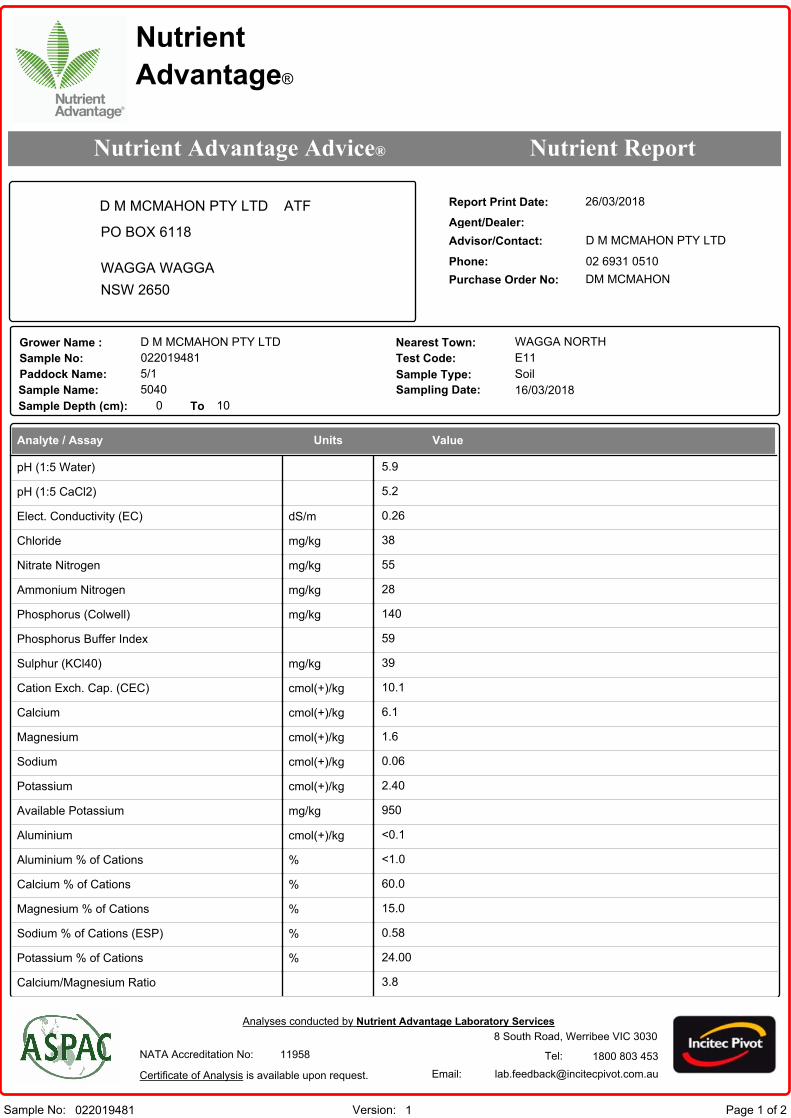
5/1 N* 5.9 5.2 0.26 38 55 28 140 59 39 10.1 6.1 1.6 0.06 2.40 950 <0.1 <1.0 60 15 0.58 24 3.8
10/1 N 6.3 5.2 0.03 11 2 2 44 45 2 14.0 9.6 3.8 0.07 0.42 0.42 <0.1 <1.0 69 27 0.49 3 2.5
11/1 N 5.3 4.6 0.14 26 56 6 13 22 7 5.3 3.5 1.0 <0.02 0.79 310 0.1 2.1 65 18 <1.00 15 3.6
19/1 N 5.4 4.7 0.14 19 52 8 19 61 9 7.4 4.1 1.9 0.06 1.30 500 0.1 1.5 55 25 0.81 17 2.2
21/1 N* 7.1 6.1 0.04 11 2 1 8 110 3 13.4 9.6 2.5 0.02 1.30 520 <0.1 <1.0 72 18 0.17 9.9 3.8
30/1 N 5.7 5.2 0.26 39 79 16 130 69 22 14.1 9.1 2.4 0.08 2.50 970 <0.1 <1.0 65 17 0.60 18 3.8
34/1 N 7.4 7.3 5.90 11000 34 2 49 120 100 43.7 8.9 18.0 16.0 0.98 380 <0.1 <1.0 20 41 36.00 2.2 0.5
36/1 N 6.3 5.7 0.27 140 3 2 38 100 5 19.3 14.0 3.6 0.39 1.00 410 <0.1 <1.0 74 19 2.00 5.4 3.9
39/1 N 5.9 5.2 0.15 30 47 7 51 57 9 10.8 7.4 1.8 0.03 1.60 640 <0.1 <1.0 68 16 0.29 15 4.1
Soil Survey Report: Wellington North Solar Farm
DM McMahon Pty Ltd – March 2018 Page 13 of 23
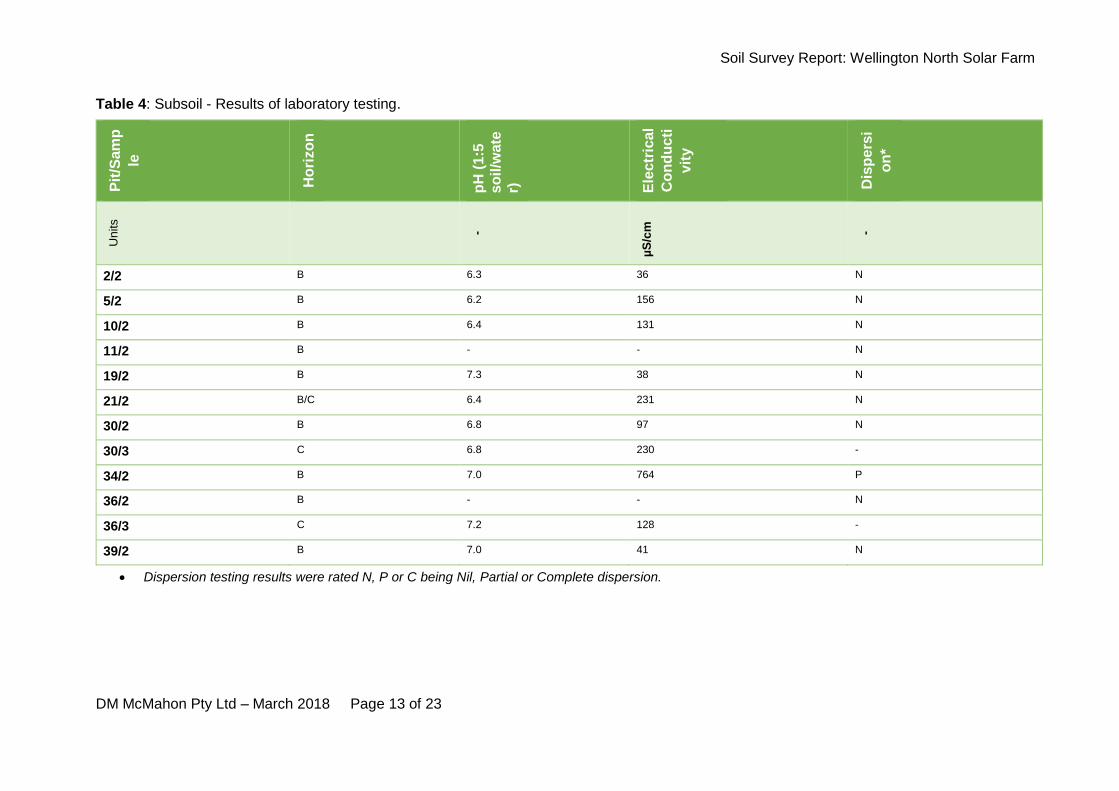
Table 4: Subsoil - Results of laboratory testing. P
it/S
am
p
le
Ho
rizo
n
pH
(1
:5
so
il/w
ate
r)
Ele
ctr
ical
Co
nd
uc
ti
vit
y
Dis
pe
rsi
on
*
Units
-
µS
/cm
-
2/2 B 6.3 36 N
5/2 B 6.2 156 N
10/2 B 6.4 131 N
11/2 B - - N
19/2 B 7.3 38 N
21/2 B/C 6.4 231 N
30/2 B 6.8 97 N
30/3 C 6.8 230 -
34/2 B 7.0 764 P
36/2 B - - N
36/3 C 7.2 128 -
39/2 B 7.0 41 N
• Dispersion testing results were rated N, P or C being Nil, Partial or Complete dispersion.

6.0 Comments and Recommendations
The discussion and recommendations provided below are based on field observations and
testing at discrete locations.
6.1 Potential Limitations
Potential landscape limitations have been summarised below, Table 5.
Table 5: Potential landscape limitation assessment
Soil Type Erosion Hazard
Salinity Risk
Acid Soil
Waterlogging Risk
Acid Sulfate Soils
Infrastructure
Ferrosol LOW LOW YES MODERATE NO MODERATE
As follows is the soil landscape map (eSpade, 2017) that has been generally validated by
the soil survey through laboratory and field techniques, Figure 4. As such, management
practices can be grouped into management classes of either soil landscape units or
Australian Soil Classification units. This report identifies management practices for ASC units
in section 6.5 below.
Figure 4: Bodangora soil landscape with site overlay.
6.2 Erosion Control
In order to mitigate the occurrence of erosion the following primary principles should be
adhered to, particularly throughout the construction period of the project. Best Management
Practices (BMPs) should be employed where applicable to further reduce the risk of potential
erosion and sediment control.
• Integrate project design with any site
constraints.
• Preserve and stabilise drainageways.
Soil Survey Report: Wellington North Solar Farm
DM McMahon Pty Ltd – March 2018 Page 15 of 23
• Minimise the extent and duration of
disturbance.
• Control stormwater flows onto,
through and from the site in stable
drainage structures.
• Install perimeter controls.
• Stabilise disturbed areas promptly.
• Protect steep slopes.
• Employ the use of sediment control
measures to prevent off and on-site
damage.
• Protect inlets, storm drain outlets and
culverts.
• Provide access and general
construction controls.
• Inspect and maintain sediment and
erosion control measures regularly.
The risk of erosion on site due to construction activities is considered low due to the very low
relief and generally low salinity and sodicity of topsoils and subsoils. Excavation of subsoils
should be limited where possible, and excavated subsoils should be stockpiled and contained
to avoid potential dispersion and sediment transfer. Ground cover around the structures
should be maintained where possible. Maintenance of ground cover will also aid in the
prevention of topsoil losses from wind erosion. Managing Urban Stormwater: Soils and
Construction Volume 1 (Landcom, 2004) and Volume 2A & 2C (DECC, 2008) should be
consulted further in the development of an Erosion and Sediment Control Plan (ESCP).
6.3 Acid Sulfate Soils
Acid sulphate soils is the common name given to naturally occurring soils containing iron
sulphides. Exposure of the sulphides present in these soils to oxygen from drainage or
excavation will lead to the generation of sulfuric acid. Field pH of these soils in their
undisturbed state is generally pH 4 or less.
Landscape characteristics such as; the dominance of mangroves, reeds, rushes and other
marine/estuarine or swamp-tolerant vegetation, low lying areas, back swamps or scalded
areas of coastal estuaries and floodplains and sulphurous smell following rain after prolonged
dry periods (Stone et al, 1998) after soil disturbance were not observed. There was no
evidence of a jarositic horizon or jarosite precipitates or coatings on any root channels or
cracks in the soil.
From the soil survey conducted, it has been deduced that acid sulfate soils are not present
on site.
6.4 Potential Impacts on Salinity, Groundwater Resources and Hydrology
Current operational procedures include dryland farming and grazing. Associated water
features are drainage plains and lines, and two groundwater bores (GWO14993 and
GWO16640). At the time of investigation, the pasture condition appeared to be poor with
minimal ground cover in the majority of paddocks which would increase the flux of rainwater
into the subsoil through recharge. Given the soils on site are classified as ‘non-sodic’ and
are of low salinity the risk of salt build-up in discharge areas is thought to be low. However,
changing direction of surface waters and any run-on should be avoided as local changes in
the water regime are likely to mobilise any salts stores, however low, in the soil. Deep rooted
vegetation should be maintained where present, especially large individual trees along fence
lines and in paddocks, and the three small areas of bush on the eastern side of the property.
The majority of pastures consist of lucerne, a pasture with a deep root system, with the
exception of one paddock which contains sorghum, an annual species which would ideally

Soil Survey Report: Wellington North Solar Farm
DM McMahon Pty Ltd – March 2018 Page 16 of 23
be replaced with lucerne. Ground clearing of pastures and trees should be minimised, and
where removal is necessary, minimise disturbance of surrounding vegetation.
There are four groundwater bores found within and around the subject site as can be seen
in Figure 5 below.
Figure 5: Registered groundwater bores on and near the site.
The details of the bore construction for the bores located above are shown as follows in
Table 6 (DPI, 2018).
Table 6: Registered groundwater bores in the locale (DPI, 2018).
Bore ID Drilled depth (m)
Water bearing zone (m)
Standing water level (m)
AHD (m) Purpose
GW043218 18.80 No data No data 380 Stock, Domestic
GW014993 18.30 12.20 - 14.30
17.10 - 17.40 No data 370 Not known
GW026447 33.50 19.8 – 21.3 No data 350 Stock
GW016640 7.3 No data No data 310 Stock

Soil Survey Report: Wellington North Solar Farm
DM McMahon Pty Ltd – March 2018 Page 17 of 23
As can be seen above the groundwater bores onsite or down gradient of the site are for stock
and/or domestic use. The groundwater is likely to be in alluvial layers and be responsive to
rainfall events in terms of standing water level and salinity. From a review of the current and
proposed site operations the potential impacts on salinity, groundwater and hydrology are
thought to be low.
6.5 Potential Impacts on Agricultural Resources
The proposal is to install solar panels for a short to medium term period with a view to restore
the land to the original land use setting upon decommissioning. The proposal is to build
limited infrastructure in the form of boundary roads and substations while the solar panels
will be installed on pile driven posts or on small pad footings. Upon decommissioning of the
solar farm, the pile driven posts or small pad footings will be removed causing minimal soil
and landscape disturbance and the land will be fit for purpose for continued primary industry
use dependent upon the soil management responses outlined as follows being implemented.
During operation of the solar farm ground cover will be maintained and managed with the
option for slashing, crash grazing, reseeding and amelioration with fertiliser and/or lime
dependent upon the results of the monitoring and reporting carried out. Therefore, based on
the findings of this report from the site-specific assessment, the proposal will have limited
impact on agricultural resources, and the land upon decommissioning of the solar farm will
be suitable for alternative land uses such as forestry and mining in addition to agriculture.
6.6 Potential for the project to improve erosion characteristics of the land
The project has the ability to potentially improve erosion characteristics of the land owing to
the minimisation of grazing and cessation of cultivation. Agricultural practices, which will be
limited throughout the commissioning and operation of the solar farm are the main cause of
uncontrolled erosion on site and by limiting this erosion characteristics will be improved. The
landscape will be stabilised by maintaining groundcover through, allowing vegetation to
become better established, which will abate structural breakdown and increase organic
matter content in soil and subsequent aggregate stability. Proposed conservation earthworks
on the eroded gully on the property will also enhance erosion control and improve water
quality downstream.

Soil Survey Report: Wellington North Solar Farm
DM McMahon Pty Ltd – March 2018 Page 18 of 23
6.5 Soil Characteristics and Management Responses
6.5.1 Ferrosols
Table 7: Characteristics and Management Responses.
Soil Property Behaviour of soil to
activity or
environment
Management responses/measures
Soil Surface
These soils generally
have moderate structure
in the surface and
subsoil and are non-
sodic.
Surface structure can deteriorate following prolonged cultivation/ handling to produce a hardsetting surface.
Excessive cultivation or handling of these soils should be avoided. Soil structure and surface infiltration rate can be maintained through the incorporation of composted organic matter and by maintaining vegetative cover. During construction limit traffic to designated paths to minimise destruction of the soil structure. Following construction do not disturb unless necessary (routine maintenance of infrastructure should be kept to the designated paths). Construct gravel roads on the site and limit access off these roads.
Expansive Clays
These soils contain little to no shrink swell clays.
Some of these soils may contain layers of shrink swell clays at depth.
Reinstate soils in the order they are removed (ie. topsoil above subsoil) to reduce possible effect on infrastructure.
Clay subsoils
These soils contain clay loam to medium clay subsoils that may be grouped into red and brown sub groups.
Subsoils have moderate to strong structure with texture ranging from clay loam to medium clay. Where these soils are formed on weathered rock profiles may be shallow (some rocky), while those developed on alluvium are deep. The subsoil of this soil type is generally suitable for most earthwork purposes. However both the topsoil and subsoil are prone to structural decline and compaction.
Relieve compaction of subsoil material where revegetation required, amelioration may assist. Excessive handling of these soils should be avoided.

Soil Survey Report: Wellington North Solar Farm
DM McMahon Pty Ltd – March 2018 Page 19 of 23
Soil Property Behaviour of soil to
activity or
environment
Management responses/measures
Dispersion
These soils are usually non-dispersive.
These soils generally have low sodium content (ie. non-sodic) and as a result are likely to be nondispersive. However, these soils may be susceptible to rill and sheet erosion when left exposed to heavy rainfall and/or stream bank erosion when located adjacent to watercourses.
Maintain cover to reduce sheet and rill erosion. Final shaping of sloping land should avoid the concentration of water flows (ie. maintain sheet flow). If possible, during construction the existing gullies are to be remediated to minimise further erosion. Stream bank erosion managed by maintaining vegetative cover and encouraging plants with fibrous root systems. Riparian zones should be
maintained and improved where possible.
Salinity
Due to their free drainage characteristics, these soils generally have low salt levels (depending on parent material and landscape practices).
Soil parent material often contains minimal salt, this in combination with elevated landscape position with good runoff and/ or permeable soil characteristics are such that these soils do not generally contain high salt concentration within the soil profile.
Maintain site drainage. Avoid applying poor quality water (ie. salty) water to these soils to maintain low salinity status.
Fertility
These soils are often fertile with clay textured soils generally the best.
Moderate clay content and moderate fertility. The site is within two classes of the BSAL area, being ‘grazing – modified pasture’ in the east and ‘dryland cropping’ in the west.
May require limited fertiliser additions to stimulate plant growth, particularly nitrogen and phosphorus (depending on plants). Topsoil conservation should be maximised through appropriate soil handling practices. Addition of organic matter in the form of composted organics will maintain fertility, nutrient retention assist to and improve moisture holding capacity of these soils.

Soil Survey Report: Wellington North Solar Farm
DM McMahon Pty Ltd – March 2018 Page 20 of 23
Soil Property Behaviour of soil to
activity or
environment
Management responses/measures
Revegetation
These soils have strong to slight acid pH, they are well drained with good fertility and plant available water holding capacity (depending on profile depth).
Plant species need be selected that are adapted to these conditions.
Relieve any compaction present and ensure adequate fertility for quick establishment (testing required). Shallow profiles will require frequent, low volume watering. Deep profiles can be watered for longer periods and less frequently (monitor moisture conditions). Protect surface with mulch material to reduce raindrop induced crusted or hardsetting surface. Stabilisation and revegetation targets and timeframes should be in accordance with IECA (2008) guidelines.
Soil Handling
These soils have very few limitations for agronomic and engineering uses.
The objective of soil handling is to minimise off site impacts and maximise the productive capacity of the soil on site consistent with the intended use.
Topsoil stripping should maximise available reserves and should avoid mixing salty and/or sodic subsoils – testing is recommended. Topsoil or subsoil stockpiles should be kept separate. Reinstate soil in the order they were removed (ie. lower subsoil below upper subsoil). To maintain soil structure, limit the handling of soil material and ensure traffic is concentrated on constructed road surfaces and utilise water trucks (reduce dust generation). Installation of erosion and sediment control structures may be required where soil is exposed (eg. clean water diversions upslope, sediment fences around stockpiles). Trafficability of these soils should be avoided when wet (structural decline), the use of gravel road surfaces may improve site access.

Soil Survey Report: Wellington North Solar Farm
DM McMahon Pty Ltd – March 2018 Page 21 of 23
7.0 Notes relating to results
Groundwater
No Free groundwater was encountered during the investigation. A groundwater table or
seepage may be present at other times and fluctuations in groundwater levels and seepage
could occur due to rainfall, changes in temperature and other factors.
Bore hole / test pit logging
The information supplied in the log sheets is based on visual and tactile assessment based
on field conditions at the time of testing. The log sheets can include inferred data based on
the experience of the geotechnician as well as factual data from in situ testing.
Samples
D Disturbed sample
B Bulk or composite sample
U Undisturbed sample
Moisture Condition
D Dry – runs freely through the fingers
T Moderately moist – does not run freely and is difficult to form
M Moist – does not run freely but is able to be formed
W Wet – free water visible on the soil surface
Consistency (Cohesive Soils)
Description Unconfined Compressive Strength (UCS)
Very soft <25kPa
Soft 25-50kPa
Firm 50-100kPa
Stiff 100-200kPa
Very Stiff 200-400kPa
Hard >400kPa
Relative Density (Cohesionless Soils)
Description N Value Density Index Soil Friction
blows per 300mm Range% Angle (degrees)
Very Loose 0-4 <15 <30
Loose 4-10 15-35 30-35
Medium 10-30 35-65 35-40
Dense 30-50 65-85 40-45
Very Dense >50 >85 <45

Soil Survey Report: Wellington North Solar Farm
DM McMahon Pty Ltd – March 2018 Page 22 of 23
8.0 Disclaimer
The information contained in this report has been extracted from field and laboratory sources
believed to be reliable and accurate. DM McMahon Pty Ltd will not assume any responsibility
for the misinterpretation of information supplied in this report. The accuracy and reliability of
recommendations identified in this report need to be evaluated with due care according to
individual circumstances. It should be noted that the recommendations and findings in this
report are based solely upon the said site location and the ground level conditions at the time
of testing. The results of the said investigations undertaken are an overall representation of
the conditions encountered. The properties of the soil within the location may change due to
variations in ground conditions outside of the tested area. The author has no control or liability
over site variability that may warrant further investigation that may lead to significant design
changes.
9.0 References
Agriculture Victoria (2011). Understanding soil tests – pastures.
<http://agriculture.vic.gov.au/agriculture/farm-management/soil-and-
water/soils/understanding-soil-tests-pastures>
Bureau of Rural Sciences after Commonwealth Scientific and Industrial Research
Organisation (1991), Digital Atlas of Australian Soils
Burkitt, L. L., Moody, P. W., Gourley, C. J. P., Hannah, M. C. (2002). A simple phosphorus
buffering index for Australian soils. Australian Journal of Soil Research 40(3) pp 497 – 513.
Bruce, R. C., and Rayment, G. E. (1982). Analytical methods and interpretations used by
the Agricultural Chemistry Branch for Soil and Land Use Surveys. Queensland Department
of Primary Industries. Bulletin QB8 (2004), Indooroopilly, Queensland.
DERM. (2011). Salinity management handbook (2nd ed.). Queensland, Australia:
Department of Environment and Resource Management.
Department of Primary Industries Office of Water (2018). NSW Government.
<http://allwaterdata.water.nsw.gov.au/water.stm>
Geeves GW, Craze B and Hamilton GJ 2007a. Soil physical properties. In ‘Soils – their
properties and management’. 3rd edn. (Eds Charman PEV and Murphy BW) pp. 168-191
Oxford University Press Melbourne.
Geology information: Copyright Commonwealth of Australia (MDBC) 1999
Hazelton P and Murphy B 2007, Interpreting Soil Test Results, What do All the Numbers
Mean?, NSW Department of Natural Resources.
International Erosion Control Association (IECA) 2008. Best Practice Erosion and Sediment
Control. Books 1 – 3.
Ipswich City Council. (Undated). Soil Management Guidelines. Ipswich City Council (www.
ipswich.qld.gov.au).
Isbell, R. F. (1996). Australian Soil and Land Survey Handbook-The Australian Soil
Classification, CSIRO Publishing, Collingwood Vic, Australia.
AWI (2008). Interpreting soil tests. Making More From Sheep.
<http://www.makingmorefromsheep.com.au/grow-more-pasture/tool_7.3.htm>
McKenzie, N. J., Grundy, M. J., Webster, R., Ringrose-Voase, A. J., 2008. Guidelines for
Surveying Soil and Land Resources, 2nd Ed. CSIRO Publishing, Collingwood Vic, Australia.

Soil Survey Report: Wellington North Solar Farm
DM McMahon Pty Ltd – March 2018 Page 23 of 23
Metson, A. J. (1961). Methods of chemical analysis for soil survey samples. Soil Bureau Bulletin
No. 12, New Zealand Department of Scientific and Industrial Research, pp. 168-175.
Wellington, New Zealand.
National Committee on Soil and Terrain (Australia) (2009). Australian Soil and Land Survey
Field Handbook, 3rd Ed. CSIRO Publishing, Collingwood Vic, Australia.
NSW Agriculture (2000). Understanding Soil pH.
<https://www.dpi.nsw.gov.au/__data/assets/pdf_file/0003/167187/soil-ph.pdf>
NSW DPI Office of Water, 2018
<http://allwaterdata.water.nsw.gov.au/water.stm>
Office of Environment and Heritage (OEH) (2017) eSpade v2.0
<http://www.environment.nsw.gov.au/eSpade2WebApp>
Standards Australia AS 1726 – 1993 Geotechnical Site Investigations
Standards Australia AS 2159 – 2009 Piling Design and Installation
Standards Australia AS 2870 – 2011 Residential Slabs and Footings - Construction
Standards Australia AS 3798 – 1996 Guidelines on earthworks for commercial and
residential developments
Stone, Y., Ahern, C. R., and Blunden, B. (1998). Acid Sulfate Soil Manual 1998. Acid
Sulfate Soil Management Committee, Wollongbar, NSW, Australia.
10.0 Attachments
Field soil logs
Laboratory results

Page 1 of 6
5040
Wellington Solar Farm
Goolma Road, Wellington NSW 2650
Site
Ide
nti
ty
Sam
ple
Co
-ord
inat
es
MG
A
GD
A9
4 z
55
Laye
r
Laye
r T
op
(m
)
Laye
r B
ott
om
(m
)
Ho
rizo
n
Bo
un
dar
y
Co
lou
r
Mu
nse
ll C
od
e
Text
ure
Mo
istu
re
Co
nsi
ste
nce
Mo
ttle
s
Mo
ttle
Typ
e
Stru
ctu
re
Co
arse
Fra
gme
nts
Frag
me
nt
Size
(mm
)
Frag
me
nt
(%)
Co
mm
en
ts
1 0.0 0.2 A1 RB SCL D 5 N - s.d. SAB Nil - -
- 0.2 0.5 A2 D RB SCL D 5 N - s.d. SAB Nil - -
2 0.5 0.9 B C BR LC D-T 5 Y Black w.d. SAB Nil - -
1 0.0 0.4 A RB SCL D 3 N - s.d. SAB Nil - -
2 0.4 1.2 B D BR/RB LC D 3 N - w.d. SAB Nil - -
1 0.0 0.4 A RB SL D 1 N - w.d. SAB Y 0-5 5
2 0.4 1.0 B C BR CL D 4 Y Black Massive Y 5-10 10
1 0.0 0.4 A RB SCL D 1 N - s.d. SAB Y 0-20 10
2 0.4 1.2 B C BR LC D-T 4 N - Massive Y 0-20 20
1 0.0 2.0 A RB SCL D SCL N - w.d. SAB Nil - -
2 0.2 1.2 B C BR LC D-T LC N - Massive Y 0-5 5
1 0.0 0.2 A RB SCL D 1 N - w.d. SAB Nil - -
2 0.2 1.2 B C BR LC D-T 5 N - Massive Y 0-5 5
1 0.0 0.2 A RB SCL D 1 N - w.d. SAB Nil - -
2 0.2 1.0 B C BR LC D-T 4 N - Massive Nil - -
- 0.0 0.2 A RB SCL D 1 N - w.d. SAB Nil - -- 0.2 1.2 B D BR-R LC D-T 7 Y Black SAB Y 0-5 5
80684125 E
6402719 N
Redening with depth. Small
bluestone fragements.
60684649 E
6402300 NBluestone from 1.0m.
70684215 E
6402292 N
40685018 E
6402265 N
Red clay w. soft silty rock &
bluestone.
Lots of tap roots. Catheads.
Sorghum crop.5
0684677 E
6402709 N
Lots of roots present. Slight
colour change from A1 to A2.
Hit bluestone.
20685008 E
6402891 N
Roots to approx 0.8m. Slightly
darker brown BR.
30684816 E
6402596 N
Roots to 0.6m. V. hard at
1.0m.
SOIL SURVEY FIELD SHEET
Job No:
Project:
Site:
10685615 E
6402770 N

Page 2 of 6
5040
Wellington Solar Farm
Goolma Road, Wellington NSW 2650
Site
Ide
nti
ty
Sam
ple
Co
-ord
inat
es
MG
A
GD
A9
4 z
55
Laye
r
Laye
r T
op
(m
)
Laye
r B
ott
om
(m
)
Ho
rizo
n
Bo
un
dar
y
Co
lou
r
Mu
nse
ll C
od
e
Text
ure
Mo
istu
re
Co
nsi
ste
nce
Mo
ttle
s
Mo
ttle
Typ
e
Stru
ctu
re
Co
arse
Fra
gme
nts
Frag
me
nt
Size
(mm
)
Frag
me
nt
(%)
Co
mm
en
ts
- 0.0 0.2 A RB SCL D 1 N - s.d. SAB Nil - -
- 0.2 1.2 B C BR-R CL T 5 N - w.d. SAB Y 0-10 5
1 0.0 0.4 A RB SCL D 1 N - s.d. SAB Nil - -
2 0.4 0.9 B D -RB-BR LC T 5 N - w.d. SAB Y 0-10 5
1 0.0 0.3 A YB SCL D 3 N - s.d. SAB Nil - -
- 0.3 0.8 B1 C RB LC T 5 N - w.d. SAB Nil - -
2 0.8 1.2 B1 D R LC T 6 N - Massive Y 0-10 5
- 0.0 0.3 A RB SCL D 3 N - s.d. SAB Nil - -
- 0.3 0.6 A1 C BR LC D 4 N - s.d. SAB Nil - -
- 0.6 1.1 B C BR LC T 4 N - w.d. SAB Y 0-30 10
1 0.0 0.3 A RB SCL D 2 N - w.d. SAB Nil - -
- 0.3 0.8 B1 C BR CL T 4 N - w.d. SAB Nil - -
2 0.8 1.2 B2 C R LC T 6 N - Massive Nil - -
- 0.0 0.3 A RB SCL D 2 N - w.d. SAB Nil - -
- 0.3 0.8 B1 C BR CL D 5 N - Massive Nil - -
- 0.8 1.2 B2 D R LC T 4 Y Black Massive Nil - -
- 0.0 0.2 A RB SCL D 4 N - s.d. SAB Nil - -- 0.2 0.8 B1 C BR CL D 5 N - Massive Nil - -
- 0.8 1.2 B2 D R LC T 3 N - Massive Nil - -
140682224 E
6401374 N
150682642 E
6401305 N
130682015 E
6401388 N
Bluestone fragments.
Hit bluestone at 0.9m.
110683164 E
6402740 NBluestone (soft).
120682789 E
6401946 NBluestone from 0.6m.
100683033 E
6402406 N
SOIL SURVEY FIELD SHEET
Job No:
Project:
Site:
90683834 E
6402354 N

Page 3 of 6
5040
Wellington Solar Farm
Goolma Road, Wellington NSW 2650
Site
Ide
nti
ty
Sam
ple
Co
-ord
inat
es
MG
A
GD
A9
4 z
55
Laye
r
Laye
r T
op
(m
)
Laye
r B
ott
om
(m
)
Ho
rizo
n
Bo
un
dar
y
Co
lou
r
Mu
nse
ll C
od
e
Text
ure
Mo
istu
re
Co
nsi
ste
nce
Mo
ttle
s
Mo
ttle
Typ
e
Stru
ctu
re
Co
arse
Fra
gme
nts
Frag
me
nt
Size
(mm
)
Frag
me
nt
(%)
Co
mm
en
ts
- 0.0 0.15 A RB SCL D 4 N - s.d. SAB Nil - -
- 0.15 0.6 B1 C BR CL D 5 N - Massive Nil - -
- 0.6 1.2 B2 D RB LC T 3 N - Massive Y 0-5 10
1 0.0 0.1 A YB SCL D 4 N - s.d. SAB Nil - -
2 0.1 0.4 B C RB CL T 6 N - s.d. SAB Nil - -
3 0.4 0.9 C D GR Rock D 7 N - Rock fragments Y 5-50 95
- 0.0 0.2 A YB SCL D 3 N - s.d. SAB Nil - -
- 0.2 0.5 B C RB CL T 6 N - s.d. SAB Nil - -
- 0.5 0.8 C D GR Rock D 7 N - Rock fragments Y 5-50 95
- 0.0 0.5 A RB SCL D 3 N - s.d. SAB Nil - -
- 0.5 1.2 B D BR CL-LC T 5 N - Massive Nil - -
- 0.0 0.4 A RB SCL D 3 N - Platey/SAB Nil - -
- 0.4 1.2 B D BR CL-LC T 5 Y Black Massive Y 5-15 20
1 682798 E 0.0 0.4 A RB SCL D 1 N - s.d. SAB Nil - -
2 6403705 N 0.4 0.7 B C BR CL T 5 N - w.d. SAB Nil - -
- 0.7 1.3 C C G LC D 7 N - Massive Y 5-40 80
- 0682543 E 0.0 0.4 A YB SCL D 5 N - s.d. SAB N - -
- 6403705 N 0.4 0.8 B C RB CL T 6 N - s.d. SAB N - -
- 0.8 1.2 C C R+G LC T 7 N - Massive Y 5-40 80
Reddening with depth.
200682727 E
6403498 NReddening with depth.
21
22
190682611 E
6402858 N
Small bluestone fragments.
17Small peds in B Horizon.
Bluestone rock.
18Small peds in B Horizon.
Bluestone rock.
0681974 E
6402581 N
0682037 E
6403307 N
SOIL SURVEY FIELD SHEET
Job No:
Project:
Site:
160682642 E
6401305 N

Page 4 of 6
5040
Wellington Solar Farm
Goolma Road, Wellington NSW 2650
Site
Ide
nti
ty
Sam
ple
Co
-ord
inat
es
MG
A
GD
A9
4 z
55
Laye
r
Laye
r T
op
(m
)
Laye
r B
ott
om
(m
)
Ho
rizo
n
Bo
un
dar
y
Co
lou
r
Mu
nse
ll C
od
e
Text
ure
Mo
istu
re
Co
nsi
ste
nce
Mo
ttle
s
Mo
ttle
Typ
e
Stru
ctu
re
Co
arse
Fra
gme
nts
Frag
me
nt
Size
(mm
)
Frag
me
nt
(%)
Co
mm
en
ts
- 682226 E 0.0 0.20 A RB SCL D 2 N - s.d. SAB Nil - -
- 6404132 N 0.20 0.6 B1 C BR CL D 3 N - s.d. SAB Nil - -
- 0.6 1.1 B2 D BR CL D 2 N - Massive y 5-40 80
1 682530 E 0.0 0.10 A RB SCL D 2 N - s.d. SAB Nil - -
2 6404182 N 0.10 0.5 B C BR/R CL D 6 N - s.d. SAB Y 5-10 10
3 0.5 0.7 C D BR/R CL D 7 N - Massive Y 20-50 80
- 0682918 E 0.0 0.30 A YB SCL D 1 N - s.d. SAB Nil - -
- 6404066 N 0.30 0.6 B C RB CL D 5 N - w.d. SAB Nil - -
- 0.6 1.0 C D BG LC/rock D 7 N - Massive Y 10-5 80
- 0683507 E 0.0 0.35 A YB SCL D 4 N - w.d. SAB Nil - -
- 6403742 N 0.35 0.6 B1 C BR LC D 5 N - w.d. SAB Nil - -
- 0.6 1.2 B2 C R LC T 2 N - Massive Y 5-40 5
1 0684060 E 0.0 0.20 A YB SCL D 3 N - w.d. SAB Nil - -
2 6403927 N 0.20 0.8 B1 D +RB LC T 5 N - Massive Nil - -
3 0.8 1.2 B2 C BR LC T 4 N - Massive Nil - -
w.d. SAB
- 0684111 E 0.0 0.40 A YB SCL D 2 N - s.d. SAB Nil - -
- 6403522 N 0.40 1.2 B C RB LC T 3 N - w.d. SAB Nil - -
SOIL SURVEY FIELD SHEET
Job No:
Project:
Site:
23
24
25
28
26 Bluestone fragments.
27

Page 5 of 6
5040
Wellington Solar Farm
Goolma Road, Wellington NSW 2650
Site
Ide
nti
ty
Sam
ple
Co
-ord
inat
es
MG
A
GD
A9
4 z
55
Laye
r
Laye
r T
op
(m
)
Laye
r B
ott
om
(m
)
Ho
rizo
n
Bo
un
dar
y
Co
lou
r
Mu
nse
ll C
od
e
Text
ure
Mo
istu
re
Co
nsi
ste
nce
Mo
ttle
s
Mo
ttle
Typ
e
Stru
ctu
re
Co
arse
Fra
gme
nts
Frag
me
nt
Size
(mm
)
Frag
me
nt
(%)
Co
mm
en
ts
- 683608 E 0.0 0.20 A YB SCL D 5 N - s.d. SAB Nil - -
- 6403522 N 0.20 0.8 B1 C RB LC T 4 N - w.d. SAB Nil - -
- 0.8 1.1 B2 C BR LC T N - Massive Nil - -
1 683969 E 0.0 0.20 A YB SCL D 1 N - w.d. SAB Nil - -
2 6403050 N 0.20 0.8 B D RB LC T 4 N - w.d. SAB Nil - -
3 0.8 1.1 C C BG W. rock T 2 N - Massive Y - -
- 683526 E 0.0 0.30 A YB SCL D 1 N - w.d. SAB Nil - -
- 6402913 N 0.30 1.2 B D RB LC T 4 Y B Massive Nil - -
1 68443 E 0.0 0.30 A RB SCL D 2 N - SAB Nil - -
2 6403354 N 0.30 0.7 B C BR CL OT 3 N - Massive Y 5 to 10 5
3 0.7 1.1 C C BG Rocky D R N - Decomp. Rock Y 5 to 30 80-90
- 684737 E 0.0 0.40 A RB SCL D 2 N - SAB Nil - -
- 6403828 N 0.40 1.3 B D BR LC T 4 N - Massive Y 5 to 20 30
1 684828 E 0.0 0.20 A +RB SCL T 3 N - SAB Nil - -
2 6403992 N 0.20 1.3 B +BR LC M 4 N - Massive Nil - -
- 684262 E 0 0.3 A YB SCL D 4 N - s.d. SAB Nil - -
- 6403895N 0.3 0.9 B1 D BR CL D 4 N - w.d. SAB Nil - -
- 0.9 1.2 B2 C R LC T 2 N - Massive Nil - -
SOIL SURVEY FIELD SHEET
Job No:
Project:
Site:
Bluestone fragments.32
30
29
31
33
34
35

Page 6 of 6
5040
Wellington Solar Farm
Goolma Road, Wellington NSW 2650
Site
Ide
nti
ty
Sam
ple
Co
-ord
inat
es
MG
A
GD
A9
4 z
55
Laye
r
Laye
r T
op
(m
)
Laye
r B
ott
om
(m
)
Ho
rizo
n
Bo
un
dar
y
Co
lou
r
Mu
nse
ll C
od
e
Text
ure
Mo
istu
re
Co
nsi
ste
nce
Mo
ttle
s
Mo
ttle
Typ
e
Stru
ctu
re
Co
arse
Fra
gme
nts
Frag
me
nt
Size
(mm
)
Frag
me
nt
(%)
Co
mm
en
ts
1 684844 E 0.0 0.2 A +RB SCL D 2 N s.d. SAB Nil - -
2 6403237 N 0.2 0.7 B D RB CL D/T 5 N w.d. SAB Nil - -
3 0.7 0.9 C D RBG W. rock D/T 3 Y G&B Decomp. Rock Y 5 to 10 20
- 685741 E 0.0 0.3 A RB SCL D 2 N w.d. SAB Nil - -
- 6403237 N 0.3 0.9 B D BR CL D/T 4 N Massive Y 5 to 20 5
- 685520 E 0.0 0.2 A RB SCL D 2 N w.d. SAB Nil - -
- 6403513 N 0.2 0.7 B C BR CL D/T 5 N Massive Nil - -
- 0.7 0.9 C D YB W. rock D/T 4 N Decomp. Rock Y 5 to 20 50
1 685490 E 0.0 0.3 A YB SCL D 3 N w.d. SAB Nil - -
2 6403929 N 0.3 0.8 B1 C RB LC T 5 N Massive Nil - -
- 0.8 1.3 B2 D BR LC T 4 N Massive Nil - -
- 685653 E 0.0 0.3 A YB SCL D 4 N w.d. SAB Nil - -
- 6403714 N 0.3 0.8 B1 D RB CL D 5 N w.d. SAB Nil - -
- 0.8 1.2 B2 D BR LC D/T 5 N Massive Nil - -
38
39
40
Hit bluestone 0.9m.
Hit rock 0.9m.
37
36 Small peds. Bluestone fragments.
SOIL SURVEY FIELD SHEET
Job No:
Project:
Site:

Monday, March 19, 2018
David McMahon
DM McMahon Pty Ltd
PO Box 6118 4A Norton Street
Wagga Wagga NSW 2650
Attention:
NATA Accredited Laboratory
Number: 9597
ENVIRONMENTAL AND ANALYTICAL
LABORATORIES
Locked Bag 588
Wagga Wagga NSW 2678
Tel: +61 2 6933 2849
Fax: +61 2 6933 2477
Email: [email protected]
www.csu.edu.au/faculty/science/eal
Accredited for compliance with
ISO/IEC 17025 - Testing
For all enquiries related to this report please quote document number: 1803-0079
Page 1 of 2
Report Number:1803-0079
LABORATORY ANALYSIS REPORT
Sample TypeCollected By Date Received
Alice Debney 16-March-2018
Facility:
Soil
Order #
EAL ID Client ID.
Date/Time sample taken
Test Result (units)Method Reference Limit of
Reporting
18Mar-0258 5040 2/2
16.03.18
Conductivity (1:5 soil/water) 36 1µS/cm LTM-S-003
pH (1:5 soil/water) 6.3 pH units LTM-S-004
18Mar-0259 5040 5/2
16.03.18
Conductivity (1:5 soil/water) 156 1µS/cm LTM-S-003
pH (1:5 soil/water) 6.2 pH units LTM-S-004
18Mar-0260 5040 10/2
16.03.18
Conductivity (1:5 soil/water) 131 1µS/cm LTM-S-003
pH (1:5 soil/water) 6.4 pH units LTM-S-004
18Mar-0261 5040 19/2
16.03.18
Conductivity (1:5 soil/water) 38 1µS/cm LTM-S-003
pH (1:5 soil/water) 7.3 pH units LTM-S-004
18Mar-0262 5040 21/2
16.03.18
Conductivity (1:5 soil/water) 231 1µS/cm LTM-S-003
pH (1:5 soil/water) 6.4 pH units LTM-S-004
18Mar-0263 5040 30/2
16.03.18
Conductivity (1:5 soil/water) 97 1µS/cm LTM-S-003
pH (1:5 soil/water) 6.8 pH units LTM-S-004
18Mar-0264 5040 30/3
16.03.18
Conductivity (1:5 soil/water) 230 1µS/cm LTM-S-003
pH (1:5 soil/water) 6.8 pH units LTM-S-004

Monday, March 19, 2018
David McMahon
DM McMahon Pty Ltd
PO Box 6118 4A Norton Street
Wagga Wagga NSW 2650
Attention:
NATA Accredited Laboratory
Number: 9597
ENVIRONMENTAL AND ANALYTICAL
LABORATORIES
Locked Bag 588
Wagga Wagga NSW 2678
Tel: +61 2 6933 2849
Fax: +61 2 6933 2477
Email: [email protected]
www.csu.edu.au/faculty/science/eal
Accredited for compliance with
ISO/IEC 17025 - Testing
For all enquiries related to this report please quote document number: 1803-0079
Page 2 of 2
Report Number:1803-0079
LABORATORY ANALYSIS REPORT
Sample TypeCollected By Date Received
Alice Debney 16-March-2018
Facility:
Soil
Order #
EAL ID Client ID.
Date/Time sample taken
Test Result (units)Method Reference Limit of
Reporting
18Mar-0265 5040 34/2
16.03.18
Conductivity (1:5 soil/water) 764 1µS/cm LTM-S-003
pH (1:5 soil/water) 7.0 pH units LTM-S-004
18Mar-0266 5040 39/2
16.03.18
Conductivity (1:5 soil/water) 41 1µS/cm LTM-S-003
pH (1:5 soil/water) 7.0 pH units LTM-S-004
18Mar-0267 5040 36/3
16.03.18
Conductivity (1:5 soil/water) 128 1µS/cm LTM-S-003
pH (1:5 soil/water) 7.2 pH units LTM-S-004
Note:
* NATA Accreditation does not cover the performance of this service.
All samples analysed as received.
All soil results are reported on a dry basis.
The EAL takes no responsibility for the end use of results within this report.
This report shall not be reproduced except in full.
This report replaces any previously issued report
Signed .................................................................... David Wade, Laboratory Manager.

Nutrient
Advantage®
Nutrient Advantage Advice® Nutrient Report
26/03/2018Report Print Date:
Phone:
Advisor/Contact:
Agent/Dealer:PO BOX 6118
WAGGA WAGGA
NSW 2650
D M MCMAHON PTY LTD
02 6931 0510
Purchase Order No: DM MCMAHON
D M MCMAHON PTY LTD ATF
Grower Name :
Sample No:
Nearest Town:
Test Code:
D M MCMAHON PTY LTD
022019480
Paddock Name: 2/1
Sample Name: 5040
WAGGA NORTH
E11
SoilSample Type:
16/03/2018Sampling Date:
Sample Depth (cm): 0 To 10
ValueAnalyte / Assay Units
pH (1:5 Water) 6.0
pH (1:5 CaCl2) 4.9
Elect. Conductivity (EC) dS/m 0.05
Chloride mg/kg <10
Nitrate Nitrogen mg/kg 3
Ammonium Nitrogen mg/kg 3
Phosphorus (Colwell) mg/kg 33
Phosphorus Buffer Index 88
Sulphur (KCl40) mg/kg 4
Cation Exch. Cap. (CEC) cmol(+)/kg 12.1
Calcium cmol(+)/kg 8.5
Magnesium cmol(+)/kg 1.8
Sodium cmol(+)/kg 0.04
Potassium cmol(+)/kg 1.80
Available Potassium mg/kg 690
Aluminium cmol(+)/kg <0.1
Aluminium % of Cations % <1.0
Calcium % of Cations % 70.0
Magnesium % of Cations % 15.0
Sodium % of Cations (ESP) % 0.33
Potassium % of Cations % 15.00
Calcium/Magnesium Ratio 4.7
Analyses conducted by Nutrient Advantage Laboratory Services
NATA Accreditation No:
Certificate of Analysis is available upon request.
Tel:
Email:
8 South Road, Werribee VIC 3030
11958 1800 803 453
Page 1 of 2Sample No: Version:022019480 1

Nutrient
Advantage®
Nutrient Advantage Advice® Nutrient Report
Grower Name :
Sample No:
Nearest Town:
Test Code:
D M MCMAHON PTY LTD
022019480
Paddock Name: 2/1
Sample Name: 5040
WAGGA NORTH
E11
SoilSample Type:
16/03/2018Sampling Date:
Sample Depth (cm): 0 To 10
The results reported pertain only to the sample submitted.
Analyses performed on soil dried at 40 degrees Celsius and ground to <2mm (excluding moisture assay)
* One or more components of this test are below their detection limit. The value used is indicative only.
Disclaimer: Laboratory analyses and fertiliser recommendations are made in good faith, based on the best technical information
available as at the date of this report. Incitec Pivot Limited, its officers, employees, consultants, Agents and Dealers do not accept
any liability whatsoever arising from or in connection with the analytical results, interpretations and recommendations provided, and
the client takes the analytical results, interpretations and recommendations on these terms. In respect of liability which cannot be
excluded by law, Incitec Pivot's liability is restricted to the re-supply of the laboratory analysis or the cost of having the analysis
re-supplied.
Page 2 of 2Sample No: Version:022019480 1
Nutrient
Advantage®
Nutrient Advantage Advice® Nutrient Report
26/03/2018Report Print Date:
Phone:
Advisor/Contact:
Agent/Dealer:PO BOX 6118
WAGGA WAGGA
NSW 2650
D M MCMAHON PTY LTD
02 6931 0510
Purchase Order No: DM MCMAHON
D M MCMAHON PTY LTD ATF
Grower Name :
Sample No:
Nearest Town:
Test Code:
D M MCMAHON PTY LTD
022019481
Paddock Name: 5/1
Sample Name: 5040
WAGGA NORTH
E11
SoilSample Type:
16/03/2018Sampling Date:
Sample Depth (cm): 0 To 10
ValueAnalyte / Assay Units
pH (1:5 Water) 5.9
pH (1:5 CaCl2) 5.2
Elect. Conductivity (EC) dS/m 0.26
Chloride mg/kg 38
Nitrate Nitrogen mg/kg 55
Ammonium Nitrogen mg/kg 28
Phosphorus (Colwell) mg/kg 140
Phosphorus Buffer Index 59
Sulphur (KCl40) mg/kg 39
Cation Exch. Cap. (CEC) cmol(+)/kg 10.1
Calcium cmol(+)/kg 6.1
Magnesium cmol(+)/kg 1.6
Sodium cmol(+)/kg 0.06
Potassium cmol(+)/kg 2.40
Available Potassium mg/kg 950
Aluminium cmol(+)/kg <0.1
Aluminium % of Cations % <1.0
Calcium % of Cations % 60.0
Magnesium % of Cations % 15.0
Sodium % of Cations (ESP) % 0.58
Potassium % of Cations % 24.00
Calcium/Magnesium Ratio 3.8
Analyses conducted by Nutrient Advantage Laboratory Services
NATA Accreditation No:
Certificate of Analysis is available upon request.
Tel:
Email:
8 South Road, Werribee VIC 3030
11958 1800 803 453
Page 1 of 2Sample No: Version:022019481 1

Nutrient
Advantage®
Nutrient Advantage Advice® Nutrient Report
Grower Name :
Sample No:
Nearest Town:
Test Code:
D M MCMAHON PTY LTD
022019481
Paddock Name: 5/1
Sample Name: 5040
WAGGA NORTH
E11
SoilSample Type:
16/03/2018Sampling Date:
Sample Depth (cm): 0 To 10
The results reported pertain only to the sample submitted.
Analyses performed on soil dried at 40 degrees Celsius and ground to <2mm (excluding moisture assay)
* One or more components of this test are below their detection limit. The value used is indicative only.
Disclaimer: Laboratory analyses and fertiliser recommendations are made in good faith, based on the best technical information
available as at the date of this report. Incitec Pivot Limited, its officers, employees, consultants, Agents and Dealers do not accept
any liability whatsoever arising from or in connection with the analytical results, interpretations and recommendations provided, and
the client takes the analytical results, interpretations and recommendations on these terms. In respect of liability which cannot be
excluded by law, Incitec Pivot's liability is restricted to the re-supply of the laboratory analysis or the cost of having the analysis
re-supplied.
Page 2 of 2Sample No: Version:022019481 1

Nutrient
Advantage®
Nutrient Advantage Advice® Nutrient Report
26/03/2018Report Print Date:
Phone:
Advisor/Contact:
Agent/Dealer:PO BOX 6118
WAGGA WAGGA
NSW 2650
D M MCMAHON PTY LTD
02 6931 0510
Purchase Order No: DM MCMAHON
D M MCMAHON PTY LTD ATF
Grower Name :
Sample No:
Nearest Town:
Test Code:
D M MCMAHON PTY LTD
022019482
Paddock Name: 10/1
Sample Name: 5040
WAGGA NORTH
E11
SoilSample Type:
16/03/2018Sampling Date:
Sample Depth (cm): 0 To 10
ValueAnalyte / Assay Units
pH (1:5 Water) 6.3
pH (1:5 CaCl2) 5.2
Elect. Conductivity (EC) dS/m 0.03
Chloride mg/kg 11
Nitrate Nitrogen mg/kg 2
Ammonium Nitrogen mg/kg 2
Phosphorus (Colwell) mg/kg 44
Phosphorus Buffer Index 45
Sulphur (KCl40) mg/kg 2
Cation Exch. Cap. (CEC) cmol(+)/kg 14.0
Calcium cmol(+)/kg 9.6
Magnesium cmol(+)/kg 3.8
Sodium cmol(+)/kg 0.07
Potassium cmol(+)/kg 0.42
Available Potassium mg/kg 160
Aluminium cmol(+)/kg <0.1
Aluminium % of Cations % <1.0
Calcium % of Cations % 69.0
Magnesium % of Cations % 27.0
Sodium % of Cations (ESP) % 0.49
Potassium % of Cations % 3.00
Calcium/Magnesium Ratio 2.5
Analyses conducted by Nutrient Advantage Laboratory Services
NATA Accreditation No:
Certificate of Analysis is available upon request.
Tel:
Email:
8 South Road, Werribee VIC 3030
11958 1800 803 453
Page 1 of 2Sample No: Version:022019482 1

Nutrient
Advantage®
Nutrient Advantage Advice® Nutrient Report
Grower Name :
Sample No:
Nearest Town:
Test Code:
D M MCMAHON PTY LTD
022019482
Paddock Name: 10/1
Sample Name: 5040
WAGGA NORTH
E11
SoilSample Type:
16/03/2018Sampling Date:
Sample Depth (cm): 0 To 10
The results reported pertain only to the sample submitted.
Analyses performed on soil dried at 40 degrees Celsius and ground to <2mm (excluding moisture assay)
* One or more components of this test are below their detection limit. The value used is indicative only.
Disclaimer: Laboratory analyses and fertiliser recommendations are made in good faith, based on the best technical information
available as at the date of this report. Incitec Pivot Limited, its officers, employees, consultants, Agents and Dealers do not accept
any liability whatsoever arising from or in connection with the analytical results, interpretations and recommendations provided, and
the client takes the analytical results, interpretations and recommendations on these terms. In respect of liability which cannot be
excluded by law, Incitec Pivot's liability is restricted to the re-supply of the laboratory analysis or the cost of having the analysis
re-supplied.
Page 2 of 2Sample No: Version:022019482 1

Nutrient
Advantage®
Nutrient Advantage Advice® Nutrient Report
26/03/2018Report Print Date:
Phone:
Advisor/Contact:
Agent/Dealer:PO BOX 6118
WAGGA WAGGA
NSW 2650
D M MCMAHON PTY LTD
02 6931 0510
Purchase Order No: DM MCMAHON
D M MCMAHON PTY LTD ATF
Grower Name :
Sample No:
Nearest Town:
Test Code:
D M MCMAHON PTY LTD
022019483
Paddock Name: 11/1
Sample Name: 5040
WAGGA NORTH
E11
SoilSample Type:
16/03/2018Sampling Date:
Sample Depth (cm): 0 To 10
ValueAnalyte / Assay Units
pH (1:5 Water) 5.3
pH (1:5 CaCl2) 4.6
Elect. Conductivity (EC) dS/m 0.14
Chloride mg/kg 26
Nitrate Nitrogen mg/kg 56
Ammonium Nitrogen mg/kg 6
Phosphorus (Colwell) mg/kg 13
Phosphorus Buffer Index 22
Sulphur (KCl40) mg/kg 7
Cation Exch. Cap. (CEC) cmol(+)/kg 5.3
Calcium cmol(+)/kg 3.5
Magnesium cmol(+)/kg 1.0
Sodium cmol(+)/kg <0.02
Potassium cmol(+)/kg 0.79
Available Potassium mg/kg 310
Aluminium cmol(+)/kg 0.1
Aluminium % of Cations % 2.1
Calcium % of Cations % 65.0
Magnesium % of Cations % 18.0
Sodium % of Cations (ESP) % <1.00
Potassium % of Cations % 15.00
Calcium/Magnesium Ratio 3.6
Analyses conducted by Nutrient Advantage Laboratory Services
NATA Accreditation No:
Certificate of Analysis is available upon request.
Tel:
Email:
8 South Road, Werribee VIC 3030
11958 1800 803 453
Page 1 of 2Sample No: Version:022019483 1

Nutrient
Advantage®
Nutrient Advantage Advice® Nutrient Report
Grower Name :
Sample No:
Nearest Town:
Test Code:
D M MCMAHON PTY LTD
022019483
Paddock Name: 11/1
Sample Name: 5040
WAGGA NORTH
E11
SoilSample Type:
16/03/2018Sampling Date:
Sample Depth (cm): 0 To 10
The results reported pertain only to the sample submitted.
Analyses performed on soil dried at 40 degrees Celsius and ground to <2mm (excluding moisture assay)
* One or more components of this test are below their detection limit. The value used is indicative only.
Disclaimer: Laboratory analyses and fertiliser recommendations are made in good faith, based on the best technical information
available as at the date of this report. Incitec Pivot Limited, its officers, employees, consultants, Agents and Dealers do not accept
any liability whatsoever arising from or in connection with the analytical results, interpretations and recommendations provided, and
the client takes the analytical results, interpretations and recommendations on these terms. In respect of liability which cannot be
excluded by law, Incitec Pivot's liability is restricted to the re-supply of the laboratory analysis or the cost of having the analysis
re-supplied.
Page 2 of 2Sample No: Version:022019483 1

Nutrient
Advantage®
Nutrient Advantage Advice® Nutrient Report
26/03/2018Report Print Date:
Phone:
Advisor/Contact:
Agent/Dealer:PO BOX 6118
WAGGA WAGGA
NSW 2650
D M MCMAHON PTY LTD
02 6931 0510
Purchase Order No: DM MCMAHON
D M MCMAHON PTY LTD ATF
Grower Name :
Sample No:
Nearest Town:
Test Code:
D M MCMAHON PTY LTD
022019484
Paddock Name: 19/1
Sample Name: 5040
WAGGA NORTH
E11
SoilSample Type:
16/03/2018Sampling Date:
Sample Depth (cm): 0 To 10
ValueAnalyte / Assay Units
pH (1:5 Water) 5.4
pH (1:5 CaCl2) 4.7
Elect. Conductivity (EC) dS/m 0.14
Chloride mg/kg 19
Nitrate Nitrogen mg/kg 52
Ammonium Nitrogen mg/kg 8
Phosphorus (Colwell) mg/kg 19
Phosphorus Buffer Index 61
Sulphur (KCl40) mg/kg 9
Cation Exch. Cap. (CEC) cmol(+)/kg 7.4
Calcium cmol(+)/kg 4.1
Magnesium cmol(+)/kg 1.9
Sodium cmol(+)/kg 0.06
Potassium cmol(+)/kg 1.30
Available Potassium mg/kg 500
Aluminium cmol(+)/kg 0.1
Aluminium % of Cations % 1.5
Calcium % of Cations % 55.0
Magnesium % of Cations % 25.0
Sodium % of Cations (ESP) % 0.81
Potassium % of Cations % 17.00
Calcium/Magnesium Ratio 2.2
Analyses conducted by Nutrient Advantage Laboratory Services
NATA Accreditation No:
Certificate of Analysis is available upon request.
Tel:
Email:
8 South Road, Werribee VIC 3030
11958 1800 803 453
Page 1 of 2Sample No: Version:022019484 1

Nutrient
Advantage®
Nutrient Advantage Advice® Nutrient Report
Grower Name :
Sample No:
Nearest Town:
Test Code:
D M MCMAHON PTY LTD
022019484
Paddock Name: 19/1
Sample Name: 5040
WAGGA NORTH
E11
SoilSample Type:
16/03/2018Sampling Date:
Sample Depth (cm): 0 To 10
The results reported pertain only to the sample submitted.
Analyses performed on soil dried at 40 degrees Celsius and ground to <2mm (excluding moisture assay)
* One or more components of this test are below their detection limit. The value used is indicative only.
Disclaimer: Laboratory analyses and fertiliser recommendations are made in good faith, based on the best technical information
available as at the date of this report. Incitec Pivot Limited, its officers, employees, consultants, Agents and Dealers do not accept
any liability whatsoever arising from or in connection with the analytical results, interpretations and recommendations provided, and
the client takes the analytical results, interpretations and recommendations on these terms. In respect of liability which cannot be
excluded by law, Incitec Pivot's liability is restricted to the re-supply of the laboratory analysis or the cost of having the analysis
re-supplied.
Page 2 of 2Sample No: Version:022019484 1

Nutrient
Advantage®
Nutrient Advantage Advice® Nutrient Report
26/03/2018Report Print Date:
Phone:
Advisor/Contact:
Agent/Dealer:PO BOX 6118
WAGGA WAGGA
NSW 2650
D M MCMAHON PTY LTD
02 6931 0510
Purchase Order No: DM MCMAHON
D M MCMAHON PTY LTD ATF
Grower Name :
Sample No:
Nearest Town:
Test Code:
D M MCMAHON PTY LTD
022019485
Paddock Name: 21/1
Sample Name: 5040
WAGGA NORTH
E11
SoilSample Type:
16/03/2018Sampling Date:
Sample Depth (cm): 0 To 10
ValueAnalyte / Assay Units
pH (1:5 Water) 7.1
pH (1:5 CaCl2) 6.1
Elect. Conductivity (EC) dS/m 0.04
Chloride mg/kg 11
Nitrate Nitrogen mg/kg 2
Ammonium Nitrogen mg/kg 1
Phosphorus (Colwell) mg/kg 8
Phosphorus Buffer Index 110
Sulphur (KCl40) mg/kg 3
Cation Exch. Cap. (CEC) cmol(+)/kg 13.4
Calcium cmol(+)/kg 9.6
Magnesium cmol(+)/kg 2.5
Sodium cmol(+)/kg 0.02
Potassium cmol(+)/kg 1.30
Available Potassium mg/kg 520
Aluminium cmol(+)/kg <0.1
Aluminium % of Cations % <1.0
Calcium % of Cations % 72.0
Magnesium % of Cations % 18.0
Sodium % of Cations (ESP) % 0.17
Potassium % of Cations % 9.90
Calcium/Magnesium Ratio 3.8
Analyses conducted by Nutrient Advantage Laboratory Services
NATA Accreditation No:
Certificate of Analysis is available upon request.
Tel:
Email:
8 South Road, Werribee VIC 3030
11958 1800 803 453
Page 1 of 2Sample No: Version:022019485 1

Nutrient
Advantage®
Nutrient Advantage Advice® Nutrient Report
Grower Name :
Sample No:
Nearest Town:
Test Code:
D M MCMAHON PTY LTD
022019485
Paddock Name: 21/1
Sample Name: 5040
WAGGA NORTH
E11
SoilSample Type:
16/03/2018Sampling Date:
Sample Depth (cm): 0 To 10
The results reported pertain only to the sample submitted.
Analyses performed on soil dried at 40 degrees Celsius and ground to <2mm (excluding moisture assay)
* One or more components of this test are below their detection limit. The value used is indicative only.
Disclaimer: Laboratory analyses and fertiliser recommendations are made in good faith, based on the best technical information
available as at the date of this report. Incitec Pivot Limited, its officers, employees, consultants, Agents and Dealers do not accept
any liability whatsoever arising from or in connection with the analytical results, interpretations and recommendations provided, and
the client takes the analytical results, interpretations and recommendations on these terms. In respect of liability which cannot be
excluded by law, Incitec Pivot's liability is restricted to the re-supply of the laboratory analysis or the cost of having the analysis
re-supplied.
Page 2 of 2Sample No: Version:022019485 1

Nutrient
Advantage®
Nutrient Advantage Advice® Nutrient Report
26/03/2018Report Print Date:
Phone:
Advisor/Contact:
Agent/Dealer:PO BOX 6118
WAGGA WAGGA
NSW 2650
D M MCMAHON PTY LTD
02 6931 0510
Purchase Order No: DM MCMAHON
D M MCMAHON PTY LTD ATF
Grower Name :
Sample No:
Nearest Town:
Test Code:
D M MCMAHON PTY LTD
022019486
Paddock Name: 30/1
Sample Name: 5040
WAGGA NORTH
E11
SoilSample Type:
16/03/2018Sampling Date:
Sample Depth (cm): 0 To 10
ValueAnalyte / Assay Units
pH (1:5 Water) 5.7
pH (1:5 CaCl2) 5.2
Elect. Conductivity (EC) dS/m 0.26
Chloride mg/kg 39
Nitrate Nitrogen mg/kg 79
Ammonium Nitrogen mg/kg 16
Phosphorus (Colwell) mg/kg 130
Phosphorus Buffer Index 69
Sulphur (KCl40) mg/kg 22
Cation Exch. Cap. (CEC) cmol(+)/kg 14.1
Calcium cmol(+)/kg 9.1
Magnesium cmol(+)/kg 2.4
Sodium cmol(+)/kg 0.08
Potassium cmol(+)/kg 2.50
Available Potassium mg/kg 970
Aluminium cmol(+)/kg <0.1
Aluminium % of Cations % <1.0
Calcium % of Cations % 65.0
Magnesium % of Cations % 17.0
Sodium % of Cations (ESP) % 0.60
Potassium % of Cations % 18.00
Calcium/Magnesium Ratio 3.8
Analyses conducted by Nutrient Advantage Laboratory Services
NATA Accreditation No:
Certificate of Analysis is available upon request.
Tel:
Email:
8 South Road, Werribee VIC 3030
11958 1800 803 453
Page 1 of 2Sample No: Version:022019486 1

Nutrient
Advantage®
Nutrient Advantage Advice® Nutrient Report
Grower Name :
Sample No:
Nearest Town:
Test Code:
D M MCMAHON PTY LTD
022019486
Paddock Name: 30/1
Sample Name: 5040
WAGGA NORTH
E11
SoilSample Type:
16/03/2018Sampling Date:
Sample Depth (cm): 0 To 10
The results reported pertain only to the sample submitted.
Analyses performed on soil dried at 40 degrees Celsius and ground to <2mm (excluding moisture assay)
* One or more components of this test are below their detection limit. The value used is indicative only.
Disclaimer: Laboratory analyses and fertiliser recommendations are made in good faith, based on the best technical information
available as at the date of this report. Incitec Pivot Limited, its officers, employees, consultants, Agents and Dealers do not accept
any liability whatsoever arising from or in connection with the analytical results, interpretations and recommendations provided, and
the client takes the analytical results, interpretations and recommendations on these terms. In respect of liability which cannot be
excluded by law, Incitec Pivot's liability is restricted to the re-supply of the laboratory analysis or the cost of having the analysis
re-supplied.
Page 2 of 2Sample No: Version:022019486 1

Nutrient
Advantage®
Nutrient Advantage Advice® Nutrient Report
26/03/2018Report Print Date:
Phone:
Advisor/Contact:
Agent/Dealer:PO BOX 6118
WAGGA WAGGA
NSW 2650
D M MCMAHON PTY LTD
02 6931 0510
Purchase Order No: DM MCMAHON
D M MCMAHON PTY LTD ATF
Grower Name :
Sample No:
Nearest Town:
Test Code:
D M MCMAHON PTY LTD
022019487
Paddock Name: 34/1
Sample Name: 5040
WAGGA NORTH
E11
SoilSample Type:
16/03/2018Sampling Date:
Sample Depth (cm): 0 To 10
ValueAnalyte / Assay Units
pH (1:5 Water) 7.4
pH (1:5 CaCl2) 7.3
Elect. Conductivity (EC) dS/m 5.90
Chloride mg/kg 11000
Nitrate Nitrogen mg/kg 34
Ammonium Nitrogen mg/kg 2
Phosphorus (Colwell) mg/kg 49
Phosphorus Buffer Index 120
Sulphur (KCl40) mg/kg 100
Cation Exch. Cap. (CEC) cmol(+)/kg 43.7
Calcium cmol(+)/kg 8.9
Magnesium cmol(+)/kg 18.0
Sodium cmol(+)/kg 16.00
Potassium cmol(+)/kg 0.98
Available Potassium mg/kg 380
Aluminium cmol(+)/kg <0.1
Aluminium % of Cations % <1.0
Calcium % of Cations % 20.0
Magnesium % of Cations % 41.0
Sodium % of Cations (ESP) % 36.00
Potassium % of Cations % 2.20
Calcium/Magnesium Ratio 0.5
Analyses conducted by Nutrient Advantage Laboratory Services
NATA Accreditation No:
Certificate of Analysis is available upon request.
Tel:
Email:
8 South Road, Werribee VIC 3030
11958 1800 803 453
Page 1 of 2Sample No: Version:022019487 1
Nutrient
Advantage®
Nutrient Advantage Advice® Nutrient Report
Grower Name :
Sample No:
Nearest Town:
Test Code:
D M MCMAHON PTY LTD
022019487
Paddock Name: 34/1
Sample Name: 5040
WAGGA NORTH
E11
SoilSample Type:
16/03/2018Sampling Date:
Sample Depth (cm): 0 To 10
The results reported pertain only to the sample submitted.
Analyses performed on soil dried at 40 degrees Celsius and ground to <2mm (excluding moisture assay)
* One or more components of this test are below their detection limit. The value used is indicative only.
Disclaimer: Laboratory analyses and fertiliser recommendations are made in good faith, based on the best technical information
available as at the date of this report. Incitec Pivot Limited, its officers, employees, consultants, Agents and Dealers do not accept
any liability whatsoever arising from or in connection with the analytical results, interpretations and recommendations provided, and
the client takes the analytical results, interpretations and recommendations on these terms. In respect of liability which cannot be
excluded by law, Incitec Pivot's liability is restricted to the re-supply of the laboratory analysis or the cost of having the analysis
re-supplied.
Page 2 of 2Sample No: Version:022019487 1

Nutrient
Advantage®
Nutrient Advantage Advice® Nutrient Report
26/03/2018Report Print Date:
Phone:
Advisor/Contact:
Agent/Dealer:PO BOX 6118
WAGGA WAGGA
NSW 2650
D M MCMAHON PTY LTD
02 6931 0510
Purchase Order No: DM MCMAHON
D M MCMAHON PTY LTD ATF
Grower Name :
Sample No:
Nearest Town:
Test Code:
D M MCMAHON PTY LTD
022019488
Paddock Name: 36/1
Sample Name: 5040
WAGGA NORTH
E11
SoilSample Type:
16/03/2018Sampling Date:
Sample Depth (cm): 0 To 10
ValueAnalyte / Assay Units
pH (1:5 Water) 6.3
pH (1:5 CaCl2) 5.7
Elect. Conductivity (EC) dS/m 0.27
Chloride mg/kg 140
Nitrate Nitrogen mg/kg 3
Ammonium Nitrogen mg/kg 2
Phosphorus (Colwell) mg/kg 38
Phosphorus Buffer Index 100
Sulphur (KCl40) mg/kg 5
Cation Exch. Cap. (CEC) cmol(+)/kg 19.3
Calcium cmol(+)/kg 14.0
Magnesium cmol(+)/kg 3.6
Sodium cmol(+)/kg 0.39
Potassium cmol(+)/kg 1.00
Available Potassium mg/kg 410
Aluminium cmol(+)/kg <0.1
Aluminium % of Cations % <1.0
Calcium % of Cations % 74.0
Magnesium % of Cations % 19.0
Sodium % of Cations (ESP) % 2.00
Potassium % of Cations % 5.40
Calcium/Magnesium Ratio 3.9
Analyses conducted by Nutrient Advantage Laboratory Services
NATA Accreditation No:
Certificate of Analysis is available upon request.
Tel:
Email:
8 South Road, Werribee VIC 3030
11958 1800 803 453
Page 1 of 2Sample No: Version:022019488 1

Nutrient
Advantage®
Nutrient Advantage Advice® Nutrient Report
Grower Name :
Sample No:
Nearest Town:
Test Code:
D M MCMAHON PTY LTD
022019488
Paddock Name: 36/1
Sample Name: 5040
WAGGA NORTH
E11
SoilSample Type:
16/03/2018Sampling Date:
Sample Depth (cm): 0 To 10
The results reported pertain only to the sample submitted.
Analyses performed on soil dried at 40 degrees Celsius and ground to <2mm (excluding moisture assay)
* One or more components of this test are below their detection limit. The value used is indicative only.
Disclaimer: Laboratory analyses and fertiliser recommendations are made in good faith, based on the best technical information
available as at the date of this report. Incitec Pivot Limited, its officers, employees, consultants, Agents and Dealers do not accept
any liability whatsoever arising from or in connection with the analytical results, interpretations and recommendations provided, and
the client takes the analytical results, interpretations and recommendations on these terms. In respect of liability which cannot be
excluded by law, Incitec Pivot's liability is restricted to the re-supply of the laboratory analysis or the cost of having the analysis
re-supplied.
Page 2 of 2Sample No: Version:022019488 1

Nutrient
Advantage®
Nutrient Advantage Advice® Nutrient Report
26/03/2018Report Print Date:
Phone:
Advisor/Contact:
Agent/Dealer:PO BOX 6118
WAGGA WAGGA
NSW 2650
D M MCMAHON PTY LTD
02 6931 0510
Purchase Order No: DM MCMAHON
D M MCMAHON PTY LTD ATF
Grower Name :
Sample No:
Nearest Town:
Test Code:
D M MCMAHON PTY LTD
022019489
Paddock Name: 39/1
Sample Name: 5040
WAGGA NORTH
E11
SoilSample Type:
16/03/2018Sampling Date:
Sample Depth (cm): 0 To 10
ValueAnalyte / Assay Units
pH (1:5 Water) 5.9
pH (1:5 CaCl2) 5.2
Elect. Conductivity (EC) dS/m 0.15
Chloride mg/kg 30
Nitrate Nitrogen mg/kg 47
Ammonium Nitrogen mg/kg 7
Phosphorus (Colwell) mg/kg 51
Phosphorus Buffer Index 57
Sulphur (KCl40) mg/kg 9
Cation Exch. Cap. (CEC) cmol(+)/kg 10.8
Calcium cmol(+)/kg 7.4
Magnesium cmol(+)/kg 1.8
Sodium cmol(+)/kg 0.03
Potassium cmol(+)/kg 1.60
Available Potassium mg/kg 640
Aluminium cmol(+)/kg <0.1
Aluminium % of Cations % <1.0
Calcium % of Cations % 68.0
Magnesium % of Cations % 16.0
Sodium % of Cations (ESP) % 0.29
Potassium % of Cations % 15.00
Calcium/Magnesium Ratio 4.1
Analyses conducted by Nutrient Advantage Laboratory Services
NATA Accreditation No:
Certificate of Analysis is available upon request.
Tel:
Email:
8 South Road, Werribee VIC 3030
11958 1800 803 453
Page 1 of 2Sample No: Version:022019489 1

Nutrient
Advantage®
Nutrient Advantage Advice® Nutrient Report
Grower Name :
Sample No:
Nearest Town:
Test Code:
D M MCMAHON PTY LTD
022019489
Paddock Name: 39/1
Sample Name: 5040
WAGGA NORTH
E11
SoilSample Type:
16/03/2018Sampling Date:
Sample Depth (cm): 0 To 10
The results reported pertain only to the sample submitted.
Analyses performed on soil dried at 40 degrees Celsius and ground to <2mm (excluding moisture assay)
* One or more components of this test are below their detection limit. The value used is indicative only.
Disclaimer: Laboratory analyses and fertiliser recommendations are made in good faith, based on the best technical information
available as at the date of this report. Incitec Pivot Limited, its officers, employees, consultants, Agents and Dealers do not accept
any liability whatsoever arising from or in connection with the analytical results, interpretations and recommendations provided, and
the client takes the analytical results, interpretations and recommendations on these terms. In respect of liability which cannot be
excluded by law, Incitec Pivot's liability is restricted to the re-supply of the laboratory analysis or the cost of having the analysis
re-supplied.
Page 2 of 2Sample No: Version:022019489 1


