
APPENDIX I: HYDROLOGY REPORT - Royal HaskoningDHV Majuba/App I - Hydrology.pdf · the farm...
33
APPENDIX I: HYDROLOGY REPORT
-
Upload
doannguyet -
Category
Documents
-
view
216 -
download
3
Transcript of APPENDIX I: HYDROLOGY REPORT - Royal HaskoningDHV Majuba/App I - Hydrology.pdf · the farm...

APPENDIX I: HYDROLOGY REPORT

February 2013
ESKOM HOLDINGS LIMITED
Surface water impact assessment for the Majuba Underground Coal Gasification Project
RE
PO
RT
Report Number. 11613755-11905-3
Distribution:
1 x copy Eskom Holdings Limited
1 x copy Golder Associates Africa project folder
1 x copy Golder Associates Africa Library
Submitted to:
Eskom Holding Limited Majuba Underground Coal Gasification (UCG) Amersfoort Mpumalanga

MAJUBA UCG PROJECT: SURFACE WATER IMPACT ASSESMENT
February 2013 Report No. 11613755-11905-3
Executive Summary
Golder Associates Africa (Pty) Ltd (GAA) was approached by Eskom Holding Limited, Majuba Underground
Coal Gasification Project, (Majuba UCG) to undertake a surface water impact assessment in and around the
trial site in south-eastern Mpumalanga Province.
An Environmental Scoping Study (Eskom, 2013) was undertaken for the UCG project and associated
infrastructure on the farm Roodekopjes 67 HS (Portions 1, 2, 3 and remaining extent), Portions 17 and 21 of
the farm Bergvliet 65HS and Portions 4 and 5 of the farm Rietfontein 66HS, in support of the co-firing of gas
at the Majuba Power Station. This surface water impact assessment report serves to support the
Environmental Impact Assessment (EIA) for the project.
The impact assessment has indicated that if mitigation and a comprehensive rehabilitation plan are put in
place the impacts on surface water will be low.
The main impact during construction and decommissioning is likely to be the run-off from the construction
area to the Geelklipspruit. This can be mitigated by staying out of the 1:50 year flood lines and following
good construction practice.
The impact during operation will potentially be medium to high:
Run-off from dirty areas such as workshop areas, roads and chemical storage areas;
Discharge of treated effluent from the wastewater treatment work;
Irrigation of treated condensate;
Overflow from contaminated storage dams;
Leaks from pipelines; and
Undermining.
The highest impact being that of irrigation of treated condensate where extremely high levels of sulphate
(1520 mg/l), fluoride (141 mg/l) and chloride (413 mg/l), well above the Resource Water Quality Objectives
(RWQOs) set for the catchment have been noted to be expected after ultrafiltration (Golder 2013). The
proposed irrigation plan should be followed to mitigate the potential impacts to the groundwater, wetland
areas and Geelklipspruit.
In order to ensure that the medium to high impacts are mitigated a storm water management plan that will
ensure that clean and dirty water are separated and that pollution control dams are adequately sized must
be put in place to comply with GN 704. Flood line delineation will help to ensure that the mine keeps all
infrastructure out of the 1:50 flood lines.
During construction and operation the surface water monitoring programme must be kept in place and kept
going until decommissioning. Monitoring should be done on a monthly basis for all the parameters that are
currently being undertaken and any further that would be written into a water use licence.

MAJUBA UCG PROJECT: SURFACE WATER IMPACT ASSESMENT
February 2013 Report No. 11613755-11905-3 i
Table of Contents
1.0 INTRODUCTION ........................................................................................................................................................ 1
1.1 Objectives ..................................................................................................................................................... 1
2.0 PROJECT DESCRIPTION ......................................................................................................................................... 1
2.1 Site location .................................................................................................................................................. 1
2.2 Background description ................................................................................................................................ 1
3.0 WATER USERS ......................................................................................................................................................... 5
4.0 SURFACE WATER .................................................................................................................................................... 5
5.0 RESOURCE QUALITY OBJECTIVES....................................................................................................................... 6
6.0 WATER QUALITY ..................................................................................................................................................... 7
6.1 Surface water monitoring points ................................................................................................................... 7
6.2 Chemical water quality ................................................................................................................................ 10
6.2.1 Water quality trends .............................................................................................................................. 12
6.2.2 Water quality of irrigation water (treated condensate water) ................................................................. 14
7.0 SURFACE WATER IMPACTS ................................................................................................................................. 16
7.1 Potential surface water impacts .................................................................................................................. 16
8.0 SURFACE WATER IMPACT ASSESSMENT ......................................................................................................... 16
8.1 Impact assessment methodology ............................................................................................................... 16
8.2 Surface water quality impacts ..................................................................................................................... 17
9.0 KEY FINDINGS AND CONCLUSIONS.................................................................................................................... 26
10.0 RECOMMENDATIONS ............................................................................................................................................ 26
11.0 REFERENCES ......................................................................................................................................................... 27
TABLES
Table 1: Major catchments and rivers ................................................................................................................................. 5
Table 2: Resource Water Quality Objectives: Grootdraai catchment .................................................................................. 7
Table 3: Surface water monitoring points in the study area................................................................................................. 7
Table 5: Quality of condensate water (as taken from Institute for Soil Climate and Water, Agricultural Research Council, South Africa (2013), Report No GW/A/2013/03). ................................................................................ 15
Table 6: Potential surface water impacts with respect to UCG project .............................................................................. 16
Table 7: Impact assessment criteria .................................................................................................................................. 16
Table 8: Impact assessment during construction, operation and at closure ...................................................................... 18
MAJUBA UCG PROJECT: SURFACE WATER IMPACT ASSESMENT
February 2013 Report No. 11613755-11905-3 ii
FIGURES
Figure 1: Site location.......................................................................................................................................................... 3
Figure 2: Catchment location .............................................................................................................................................. 4
Figure 3: Surface water monitoring points ........................................................................................................................... 9
Figure 4: Average TDS concentration at the four surface water sampling points .............................................................. 10
Figure 5: Average sulphate concentration at the four surface water sampling points ....................................................... 10
Figure 6: Witbankspruit TDS trends for the period January 2010 to August 2010 ............................................................. 12
Figure 7: Witbankspruit water quality trends for the period January 2010 to August 2010 ................................................ 12
Figure 8: Upstream TDS trends for the period January 2010 to July 2012 ....................................................................... 13
Figure 9: Upstream water quality trends (Calcium, magnesium and sulphate)for the period January 2010 to July 2012 ................................................................................................................................................................. 13
Figure 10: Upstream TDS trends for the period January 2010 to July 2012...................................................................... 14
Figure 11: Downstream water quality trends (Calcium, magnesium and sulphate) for the period January 2010 to July 2012 .......................................................................................................................................................... 14
APPENDICES
No table of contents entries found.

MAJUBA UCG PROJECT: SURFACE WATER IMPACT ASSESMENT
February 2013 Report No. 11613755-11905-3 1
1.0 INTRODUCTION
Golder Associates Africa (Pty) Ltd (GAA) was approached by Eskom Holding Limited, Majuba Underground
Coal Gasification Project, (Majuba UCG) to undertake a surface water impact assessment in and around the
trial site in south-eastern Mpumalanga Province.
In order to meet the fuel requirements for optimal power generation at the Majuba Power Station, Eskom
proposes the use of synthesis gas or syngas (15 000 Nm3/hr) produced by the UCG process as a
supplementary fuel source within the boilers at the Majuba Power Station. The 15 000 Nm3/hr plant will be
scaled up to 70 000 Nm3/hr and considering the results of the 70 000 Nm
3/hr may investigate the option of a
commercial size UCG technology power plant.
An Environmental Scoping Study (Eskom, 2013) was undertaken for the UCG project and associated
infrastructure on the farm Roodekopjes 67 HS (Portions 1, 2, 3 and remaining extent), Portions 17 and 21 of
the farm Bergvliet 65HS and Portions 4 and 5 of the farm Rietfontein 66HS, in support of the co-firing of gas
at the Majuba Power Station.
This surface water impact assessment report serves to support the Environmental Impact Assessment (EIA)
for the project.
1.1 Objectives
The main objectives of the surface water impact assessment are to get an understanding of:
Background to the catchment into which the site falls;
The hydrology of the site;
Baseline surface water quality; and
Potential surface water impacts from the UCG project during construction, operation and closure.
2.0 PROJECT DESCRIPTION
2.1 Site location
The Majuba UCG trial site is located about 10 km south-west of the town of Amersfoort and 35 km north-
north-west of the town of Volksrust in Mpumalanga on farm Roodekopjes 67 HS (Portions 1, 2, 3 and
remaining extent), Portions 17 and 21 of the farm Bergvliet 65HS and Portions 4 and 5 of the farm
Rietfontein 66HS (Figure 1). The UCG site is 5 km north-east of Eskom’s Majuba Power Station. The area
falls within the local administrative boundaries of Pixley ka Seme Local Municipality and the Gert Sibande
District Municipality.
The Majuba UCG trial site covers an area of approximately 60 ha on the eastern bank of the Witbankspruit
located in quaternary catchment C11J in the Upper Vaal Water Management Area (Figure 2). The
Witbankspruit flows south to north and to the west of the site and an unknown tributary flows east to west
past the site. The confluence of the two watercourses lies directly north of the site flowing to the
Geelklipspruit and ultimately the Vaal River.
The topography of the area is characterised by rolling steep-sided hills formed by erosion of the underlying
Karoo sediments and dolerite sill. The Majuba UCG lies at an altitude of approximately 1 710 mamsl.
2.2 Background description
Underground Coal Gasification (UCG) is a process whereby coal is converted in situ to combustible gas that
can be used for power generation. It is one of the cleaner coal technologies being developed for
implementation by Eskom. Over the past 11 years Eskom has undertaken considerable research into UCG
technology.

MAJUBA UCG PROJECT: SURFACE WATER IMPACT ASSESMENT
February 2013 Report No. 11613755-11905-3 2
The target coal seam is the Gus seam which is approximately 3-4 m thick and at a depth of about 280 m
below surface. The underground coal gasification is a process in which coal is burned underground to
produce a flammable product gas (syngas) that can be recovered for beneficial use. Syngas is a gas mixture
that contains varying amounts of carbon monoxide and hydrogen.
The UCG process involves the reaction of water and oxygen with the coal in the presence of heat to
generate syngas. The reaction takes place in an underground void, created by the combustion gasification
chamber or cavity termed the gasifier. Water for the process is supplied, either through groundwater inflow to
the gasifier from the coal seam and surrounding strata, or by pumping water into the gasifier through
injection boreholes.
Injection boreholes are also used to supply oxygen, in the form of compressed air, to the UCG process. The
oxygen flow guides the expansion of the cavity since the gasification process will migrate towards higher
oxygen concentrations. In this way the expansion of the gasifier can be controlled.
As described in the Scoping Report (Eskom, 2013) in the context of a primary energy supply option for utility
scale power generation, the following characteristics of UCG technology are attractive from Eskom’s
perspective:
UCG mining, in conjunction with a combined cycle gas turbine power station, is potentially a cleaner
method of coal-based power generation. Once Eskom has proven commercial feasibility, the exact
technology footprint will be compared to traditional coal power generation technologies;
The UCG process at commercial scale would likely create a large underground gas and heat storage
inventory, making the gas supply very stable and consistent;
Depending on the area and coal resource, the cavity created by UCG could provide a suitable CO2
sequestration option. This consideration is however still in an early phase and will be explored by
Eskom during further research;
A commercial scale UCG production plant is essentially made up of a number of modular underground
reactors with largely independent outputs. The coal extraction and overall gas output from the
gasification process may therefore be optimised by varying and then mixing the outputs of the individual
modules;
No ash or slag removal and handling are necessary as there is minimal particulate carry over in the
gas, and most of the solids remain underground;
The operating pressure of the underground gasifier is such that it maintains a negative hydraulic
gradient into the cavity, preventing contamination of surrounding aquifers in the underground
environment; and
Ground water influx into the gasifier creates an effective “steam jacket” around the reactor making the
heat loss in situ tolerably small.
UCG has the potential to extract coal resources previously regarded as either uneconomic or inaccessible due to depth, seam thickness, seam slope, seam fracturing and displacement, or other mining and safety considerations. UCG offers an opportunity for expanding South Africa’s mineable coal reserve base by extracting coal previously disregarded. The UCG concept therefore provides promising prospects for future energy supplies. A by-product of the gasification process is water condensate that contains organic and inorganic impurities. In terms of Section 21 of the National Water Act (Act 36 of 1998), Eskom is required to obtain a Water Use License in order to irrigate the water. Disposal of the water should be in a manner that is not detrimental to the environment in the longer term. Eskom proposes to dispose of the water by irrigation of farm land planted to predominately Eragrostis curvula. The expected volumes of water to be disposed of between now and 2017 range from 27m
3/d in 2013 and are expected to peak in 2017 at 126 m³/d.

MAJUBA UCG PROJECT: SURFACE WATER IMPACT ASSESMENT
February 2013 Report No. 11613755-11905-3 3
Figure 1: Site location

MAJUBA UCG PROJECT: SURFACE WATER IMPACT ASSESMENT
February 2013 Report No. 11613755-11905-3 4
Figure 2: Catchment location

MAJUBA UCG PROJECT: SURFACE WATER IMPACT ASSESMENT
February 2013 Report No. 11613755-11905-3 5
3.0 WATER USERS
The land-use in the area is primarily rural agricultural based, with an urban setting in the nearby town of
Amersfoort (Eskom, 2013):
Agriculture (covering the majority of the proposed development route);
Mix urban use (in town approximately 7km from proposed development area); and
Energy production (at Majuba opposite the proposed project area).
Amersfoort Town Area consists of Amersfoort, Perdekop, Daggakraal, Siyasenzele and Ezamokuhle
settlements and falls under the management of the Pixley ka Seme Local Municipality in Gert Sibande
District Municipality. The Pixley ka Seme Municipality serves as a Water Services Authority and Water
Services Provider for the area. The Water Services Development Plan (WSDP, 2009) indicates that
Amersfoort Town Area’s main water source is the local dam (Amersfoort Dam) from where water is
abstracted, purified and distributed. Amersfoort Dam is located on the Schulpspruit with a storage capacity
0.992 million m3 and a yield of 1.33 million m
3/annum. All water is abstracted from local resources.
The main water users in the area are therefore:
Urban related water users in the Pixley ka Seme Local Municipal area; and
Irrigation.
4.0 SURFACE WATER
The site straddles two quaternary catchments, both of which form part of the Grootdraai dam catchment of
the Upper Vaal Water Management Area (WMA), C11J and C11E. Of importance is that this area falls within
the Grootdraai catchment which is part of the integrated system of water supply to Eskom Power Stations
and the Sasol Secunda Complex and is therefore strategically critical to the county’s economy.
The Upper Vaal WMA covers approximately 55 562 km2 including parts of Gauteng, Mpumalanga, Free
State and North West Provinces. It consists of the C1, C2 and C8 secondary drainage regions. The main
rivers in the secondary drainage regions are listed in Table 1. There are three large dams in the WMA:
Grootdraai Dam, Vaal Dam and Sterkfontein Dam.
Table 1: Major catchments and rivers
Primary Catchment
Sub-catchment area Quaternary catchments Average gross area (km
2)
C
Wilge C81A-M; C82AH; C83A-M 18 167
Klip (Free State) C13A-H 5 182
Grootdraai C11A-L 7 995
Grootdraai to Vaal Dam C11M; C12A-L 7 294
Suikerbosrand C12A-G 3 541
Klip (Gauteng) C22A-E 2 282
Rietspruit C22J and C22H 1 123
Leeu/Taaiboschspruit C22F; C22G; C22K 1 705
Mooi C23D-K 4 494
Vaal Barrage to Mooi C23A-C; C23L 3 239
The area that is currently being assessed falls within catchment C11J, part of which is drained by the
Witbankspruit, a stream that forms a tributary of the Upper Vaal River to the north of the site (the

MAJUBA UCG PROJECT: SURFACE WATER IMPACT ASSESMENT
February 2013 Report No. 11613755-11905-3 6
Witbankspruit flows from north to south across the site). All wetlands on the Roodekopjes Site drain into the
Witbankspruit (Eskom, 2012).
A small part of Roodekopjes property, and the Rietfontein and Bergvliet properties, fall within quaternary
catchment C11E. The major rivers/streams in the area are the Skulpspruit (into which all wetlands located in
this part of the site drain) and forms a tributary of the Rietspruit, itself a tributary of the Upper Vaal. These
properties however, relate to potential future prospecting and are not dealt with in this study.
5.0 RESOURCE QUALITY OBJECTIVES
Classification of the Upper Vaal started in March 2011 and was completed in September 2012 as part of the
study for the ‘Classification of Significant Water Resources (River, Wetlands, Groundwater and Lakes) in the
Upper, Middle and Lower Vaal Water Management Areas (WMA) 8,9,10’ undertaken by WRP Consulting
Engineers (Pty) Ltd in association with DMM Development Consultants CC, Rivers for Africa eFlows
Consulting (Pty) Ltd, Conningarth Economists, Koekemoer Aquatic Services and Zitholele Consulting (Pty)
Ltd.
The management classes have however not yet been gazetted. Resource Quality Objectives (RQOs) have
not yet been set. The project to determine the RQOs commenced in September 2012 and it is expected that
RQOs will be available in 2014.
The classification study has proposed the Management Class for the Grootdraai catchment as a MC II, where MCII is defined as: Moderately used (configuration of ecological categories moderately altered from its predevelopment condition).
As part of the development of an Integrated Water Quality Management Plan for the Upper and Middle Vaal
(DWAF, 2009) strategic monitoring points were identified within the Vaal River System that would be
strategically located and sufficiently widespread to provide an adequate indication of the prevailing water
quality status for the development of interim Resource Water Quality Objectives (RWQOs). Strategic
monitoring points were identified at two levels:
Level 1: Points on the Vaal River from its origin to Douglas Barrage; and
Level 2: Points on the major tributaries of the Vaal River just upstream of their confluences.
Level 1 strategic monitoring points refer to the monitoring points that are located on the Vaal River of which
nine are located in the Upper Vaal). Level 2 strategic monitoring points refer to the monitoring points that are
located on the major tributaries of the Vaal River, just upstream of their confluences. Fifteen strategic points
were identified in the Upper Vaal. The Geelklipspruit falls within that portion of the Vaal River downstream of Rietspruit confluence with the Vaal River and upstream of the Blesbokspruit confluence with the Vaal River.
As part of the development of an Integrated Water Quality Management Plan for the Upper and (DWAF, 2009) the existing RWQO (
Table 2) set for the Vaal main stem and the major tributaries in the Water Management Areas (WMA) were
collated and reviewed. The review indicated that the RWQO had been set in isolation on a priority catchment
basis. Subsequently the initial set of RWQO was revised. The workshop identified total dissolved solids
(TDS), total phosphorus (TP) and Escherichia coli (E coli) as the key water quality variables of concern for
which RWQOs were set.
Total dissolved solids (TDS): 150 mg/l
Total phosphorus (TP): 50 µg/l, and

MAJUBA UCG PROJECT: SURFACE WATER IMPACT ASSESMENT
February 2013 Report No. 11613755-11905-3 7
Escherichia coli (E coli): < 300 Colony forming units (CFU)/100ml.
Table 2: Resource Water Quality Objectives: Grootdraai catchment
Variable Unit Ideal Acceptable Tolerable Unacceptable
Conductivity mS/m < 10 10 - 15 15 - 25 > 25
Alkalinity (CaCO3) mg/l < 20 20 - 45 45 - 75 > 75
pH pH units < 6.4 & > 8.5
Phosphate (PO4) mg/l < 0.05 0.05 - 0.08 0.08 - 1 > 1
Sulphate (SO4) mg/l < 10 10 - 20 20 - 30 > 30
Nitrate (NO3) mg/l < 0.05 0.05 - 0.25 0.25 - 0.50 > 0.50
Ammonia (NH4) mg/l < 0.02 0.02 - 0.5 0.5 - 1 > 1
SAR < 4 4 - 8 8 - 12 > 12
Chloride (Cl) mg/l < 10 10 - 15 15 - 20 > 20
Chemical Oxygen Demand (COD) mg/l < 10 10 - 15 15 - 25 > 25
6.0 WATER QUALITY
The dominant potential impactors in the Grootdraai catchment are:
Coal mining activities: abandoned and operational mines in the Ermelo area;
Camden and Majuba power stations;
Domestic wastewater treatment works; and
Large scale agriculture is also thought to contribute to the nutrient and sediment loads in the river
system.
6.1 Surface water monitoring points
There are four surface water monitoring points (Table 3) that will indicate potential pollution from the site.
The surface water was sampled consistently throughout the monitoring period from four points shown in
Figure 3:
The Witbankspruit (2010 data only);
Upstream at a non-perennial stream;
Downstream at a non-perennial stream; and
The cooling water dam.
Sampling from monitoring points such as WS1 to WS3 was discontinued and therefore are not included in
this analysis.
The samples were collected by Eskom personnel and chemical analysis was done by the UIS laboratory.
The analytical results from the surface water samples are compared against the RWQOs set out in Section
5.0 or against the water quality guidelines (DWAF, 1996) for irrigation and aquatic systems where RWQOs
are not available.

MAJUBA UCG PROJECT: SURFACE WATER IMPACT ASSESMENT
February 2013 Report No. 11613755-11905-3 8
Table 3: Surface water monitoring points in the study area
Site Co-ordinates
Latitude Longitude
Witbankspruit -27.05878328100 29.79855009400
Upstream -27.06117004900 29.80556199900
Downstream -27.05776316500 29.80159599300
Cooling Water Dam -27.06560543100 29.80135761800

MAJUBA UCG PROJECT: SURFACE WATER IMPACT ASSESMENT
February 2013 Report No. 11613755-11905-3 9
Figure 3: Surface water monitoring points

MAJUBA UCG PROJECT: SURFACE WATER IMPACT ASSESMENT
February 2013 Report No. 11613755-11905-3 10
6.2 Chemical water quality
The surface water quality is presented in Table 4. The average values are compared against the acceptable
level RWQOs available (Section 5.0) or against the stricter of the water quality guidelines (DWAF, 1996) for
aquatic, irrigation or domestic water use. Figure 4 and Figure 5 indicate that there is an impact from the site
with average TDS at the upstream at a concentration of 127 mg/l and that at the downstream site 257 mg/l.
the same is noted for the average sulphate concentration of 25 mg/l and 37 mg/l at the respective up and
downstream sites. The data in Table 4 also indicates increases at the downstream site of alkalinity, calcium,
chloride and nitrate.
Figure 4: Average TDS concentration at the four surface water sampling points
Figure 5: Average sulphate concentration at the four surface water sampling points

MAJUBA UCG PROJECT: SURFACE WATER IMPACT ASSESMENT
February 2013 Report No. 11613755-11905-3 11
Table 4: Water quality results
Sampling point pH TDS T Alk Ca Mg Na K F Cl NO3-N SO4 Al Fe Mn
6.4-8.5 < 150 < 45 32(D)
30(D)
70(I)
50(D)
0.7(D)
< 15 < 0.25 < 20 0.01(A)
0.1(D)
0.02(I)
Witbankspruit (Jan 2010 to Sept 2010)
Min 7.4 83 - 30 28 5 1 0 4.5 0 13 0 0 -
Max 8.2 309 - 86 115 26 4.3 0.2 27 1.4 33 0.9 0.2 -
95% 8.2 296 - 72 92 16 3.6 0.2 19 1.1 27 0.8 0.2 -
Ave 8 194 - 59 55 10 2.6 0.1 15 0.4 18 0.3 0.11 -
n 30 30 - 30 30 30 30 30 30 30 30 30 30 -
Upstream (January 2010 to September 2012)
Min 7.1 49 55 10 7 2 0.8 0 3 0 7 0 0 0
Max 8.6 222 83 64 58 24 2.6 0.4 10 9 56 1.1 0.6 0.5
95% 8.4 213 82 60 53 19 2.5 0.4 10 8 48 0.7 0.6 0.4
Ave 7.8 128 65 31 23 10 1.8 0.1 7 2 25 0.1 0.22 0.07
n 21 21 10 21 21 21 21 21 21 21 21 21 21 21
Downstream (January 2010 to September 2012)
Min 7.3 57 140 18 25 5 0.4 0 4 0 10 0 0 0
Max 8.5 414 222 89 76 34 17 0.5 39 9 116 1 0.6 0.2
95% 8.4 393 220 84 54 27 3.3 0.3 28 3.5 71 0.6 0.39 0.1
Ave 7.9 272 189 48 36 19 2.3 0.2 20 1.2 38 0.2 0.16 0.04
n 31 31 20 31 31 31 31 29 31 17 31 21 23 13
Cooling Water Dam (Jan 2010 to Sept 2010)
Min 8 99 - 32 18 14 2.3 0.1 14 0 13 - 0 -
Max 8 99 - 32 18 14 2.3 0.1 14 0 13 - 0 -
95% 9.1 222 - 62 63 32 5.5 0.3 24 1.3 24 - 0.1 -
Ave 8.5 155 - 42 39 21 3.8 0.2 19 0.4 19 - 0.03 -
n 9 9 - 9 9 9 9 9 9 9 9 9 9 -
D: domestic; A: aquatic; I: Irrigation

MAJUBA UCG PROJECT: SURFACE WATER IMPACT ASSESMENT
February 2013 Report No. 11613755-11905-3 12
6.2.1 Water quality trends
Witbankspruit
Figure 6: Witbankspruit TDS trends for the period January 2010 to August 2010
Figure 7: Witbankspruit water quality trends for the period January 2010 to August 2010

MAJUBA UCG PROJECT: SURFACE WATER IMPACT ASSESMENT
February 2013 Report No. 11613755-11905-3 13
Water quality for the period January 2010 to August 2010 indicated that the stream is being impacted on by
upstream activities, very likely from overflows from the pollution control dam located east of Majuba Power
Station.
Upstream sampling site
Figure 8: Upstream TDS trends for the period January 2010 to July 2012
Figure 9: Upstream water quality trends (Calcium, magnesium and sulphate)for the period January 2010 to July 2012
The water quality at the upstream site has improved considerably since May 2011. It is not clear what would
have caused the spike in 2010/2011.

MAJUBA UCG PROJECT: SURFACE WATER IMPACT ASSESMENT
February 2013 Report No. 11613755-11905-3 14
Downstream sampling site
Figure 10: Upstream TDS trends for the period January 2010 to July 2012
Figure 11: Downstream water quality trends (Calcium, magnesium and sulphate) for the period January 2010 to July 2012
6.2.2 Water quality of irrigation water (treated condensate water)
A study entitled; A critical evaluation of the soil and water quality in developing an irrigation management
plan for ESKOM for a farm near Amersfoort, Report number Report No GW/A/2013/03 was undertaken to
assess the potential for irrigation of treated condensate water.
The water will be collected in a centrally located raw water dam and then treated using ultra filtration (UF) to
remove the bulk of the organic impurities to improve the quality. A water treatment plant has been designed
by SISTEMA AZUD, S.A. based on laboratory trials that were carried out on actual condensate samples by
Eskom Research and development staff. The objective of the laboratory trials was to remove all the

MAJUBA UCG PROJECT: SURFACE WATER IMPACT ASSESMENT
February 2013 Report No. 11613755-11905-3 15
particulate organic components from the condensate, but not the inorganic compounds. This will leave what
could be considered a liquid fertilizer containing ammonium sulphate, potassium and low concentrations of
other elements that could be used for irrigation.
The results have indicated that treated water exhibits a drastic decrease in Polycyclic Aromatic Compounds from the “Raw Feed” to the “UF Product” water to the extent that the Polycyclic Aromatic Compounds cannot be considered as problematic for supplementary irrigation. Of the inorganic compounds remaining in the treated water some, such as ammonium sulphate, potassium and other elements will be beneficial to plant growth, while some, such as fluoride, chloride, boron, and sulphate are present in such high concentrations that they can be considered as problematic for plant growth. If the South African Water Quality Guidelines for Agriculture (DWAF, 1996) are used, both fluoride and chloride concentrations exceed the Irrigation target water quality guideline ranges, and normally are not recommended for use as irrigation water, except under a very specific management regime. The boron concentration falls within the irrigation sensitive water target water guideline range, also normally not recommended for use as irrigation water, except under a very specific management regime. No irrigation target water quality guideline range specification is available for sulphate, but the very high value of 1 520 mg/l is definitely problematic. The table below is taken from the Institute for Soil Climate and Water, Agricultural
Research Council, South Africa. (2013) report, Report No GW/A/2013/03 and shows the inorganics water quality results. Table 5: Quality of condensate water (as taken from Institute for Soil Climate and Water, Agricultural Research Council, South Africa (2013), Report No GW/A/2013/03).

MAJUBA UCG PROJECT: SURFACE WATER IMPACT ASSESMENT
February 2013 Report No. 11613755-11905-3 16
7.0 SURFACE WATER IMPACTS
7.1 Potential surface water impacts
The potential surface water impacts from the project, both direct and indirect, are summarised in Table 6. In
summary these potential impacts contribute to overall surface water impacts of:
Surface water quality; and
Erosion of the streams due to potential run-off and discharge.
The surface water quality impacts will ultimately impact on the downstream water users.
Table 6: Potential surface water impacts with respect to UCG project
Aspect Key Environmental Issue / Potential Impact
Run-off (roads, buildings, paving)
Spillage of fuels, lubricants and other chemicals; and
Flow modification due to increased run-off
Discharge of treated water to a water resource
The discharge of treated wastewater may affect the quality of the
resource to which it is discharged and may therefore impact on
downstream water users;
Erosion of the watercourse may occur due to the discharge; and
Flow modification due to discharge
Run-off from irrigation Poor quality irrigation water may impact water quality
Overflow from contaminated storage dams
Overflow of contaminated water;
Flow modification due to spillages
8.0 SURFACE WATER IMPACT ASSESSMENT
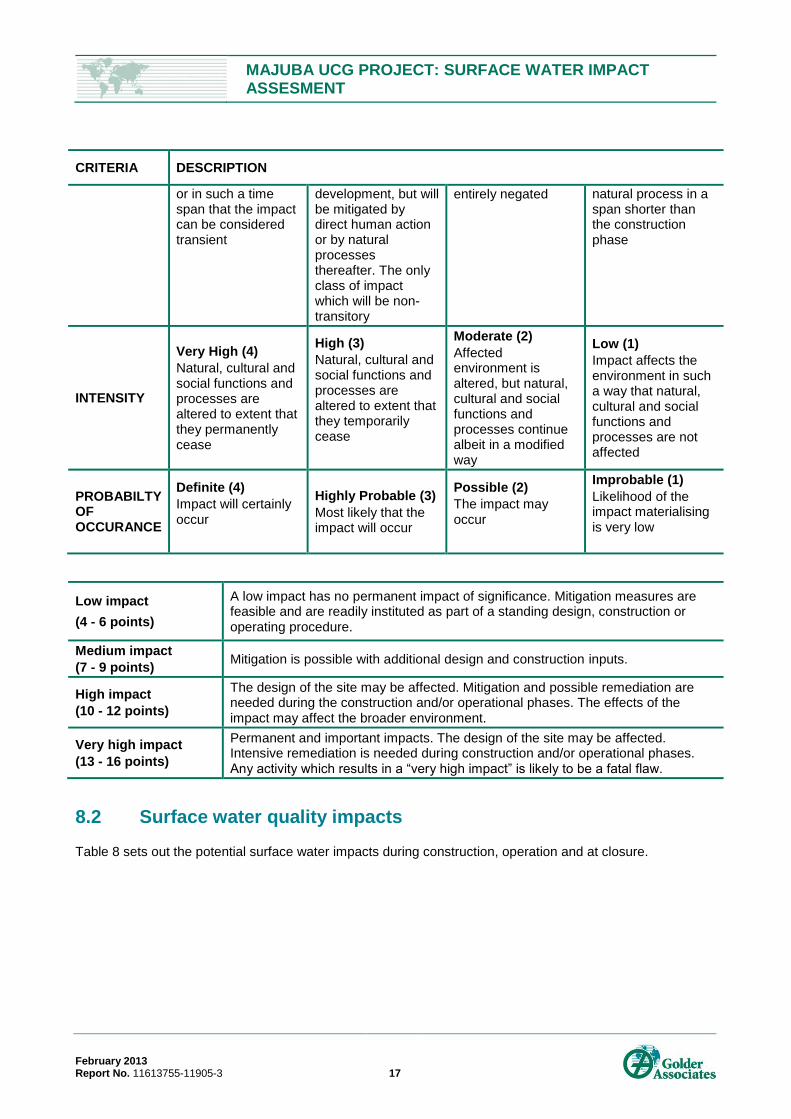
8.1 Impact assessment methodology
The significance of the impacts identified during the impact assessment phase was determined using the
approach described. Table 7 provides the method for defining intensity, geographic extent and duration.
Table 7: Impact assessment criteria
CRITERIA DESCRIPTION
EXTENT
National (4)
The whole of South Africa
Regional (3)
Provincial and parts of neighbouring provinces
Local (2)
Within a radius of 2 km of the construction site
Site (1)
Within the construction site
DURATION
Permanent (4)
Mitigation either by man or natural process will not occur in such a way
Long-term (3)
The impact will continue or last for the entire operational life of the
Medium-term (2)
The impact will last for the period of the construction phase, where after it will be
Short-term (1)
The impact will either disappear with mitigation or will be mitigated through
MAJUBA UCG PROJECT: SURFACE WATER IMPACT ASSESMENT
February 2013 Report No. 11613755-11905-3 17
CRITERIA DESCRIPTION
or in such a time span that the impact can be considered transient
development, but will be mitigated by direct human action or by natural processes thereafter. The only class of impact which will be non-transitory
entirely negated
natural process in a span shorter than the construction phase
INTENSITY
Very High (4)
Natural, cultural and social functions and processes are altered to extent that they permanently cease
High (3)
Natural, cultural and social functions and processes are altered to extent that they temporarily cease
Moderate (2)
Affected environment is altered, but natural, cultural and social functions and processes continue albeit in a modified way
Low (1)
Impact affects the environment in such a way that natural, cultural and social functions and processes are not affected
PROBABILTY OF OCCURANCE
Definite (4)
Impact will certainly occur
Highly Probable (3)
Most likely that the impact will occur
Possible (2)
The impact may occur
Improbable (1)
Likelihood of the impact materialising is very low
Low impact
(4 - 6 points)
A low impact has no permanent impact of significance. Mitigation measures are feasible and are readily instituted as part of a standing design, construction or operating procedure.
Medium impact
(7 - 9 points) Mitigation is possible with additional design and construction inputs.
High impact
(10 - 12 points)
The design of the site may be affected. Mitigation and possible remediation are needed during the construction and/or operational phases. The effects of the impact may affect the broader environment.
Very high impact
(13 - 16 points)
Permanent and important impacts. The design of the site may be affected. Intensive remediation is needed during construction and/or operational phases. Any activity which results in a “very high impact” is likely to be a fatal flaw.
8.2 Surface water quality impacts
Table 8 sets out the potential surface water impacts during construction, operation and at closure.

MAJUBA UCG PROJECT: SURFACE WATER IMPACT ASSESMENT
February 2013 Report No. 11613755-11905-3 18
Table 8: Impact assessment during construction, operation and at closure
Aspect Potential Impact Extent Duration Intensity Probability Impact Notes
CONSTRUCTION PHASE
Run-off
Spillage of fuels, lubricants
and other chemicals;
Inadequate storm water
management around the
site; the dumping of
construction material,
including fill or excavated
material into, or close to
surface water features that
may then be washed into
these features;
Construction-related
activities such as cement
batching
Construction equipment,
vehicles and workshop areas
will be a likely source of
pollution as a non-point
source.
Lack of provision of ablutions
that may lead to the
conducting of ‘informal
ablutions’ within or close to a
surface water;
1 2 2 2 7
medium
It is expected that without mitigation a
medium negative impact can be
expected. Mitigation will include:
Bunded areas to store chemicals;
Clean-up of spills as soon as they
occur;
Keep construction activities away
from the Geelklipspruit;
Adequate ablutions for
construction employees.
The significance of the impact after
mitigation is likely to decrease to a low
negative impact.

MAJUBA UCG PROJECT: SURFACE WATER IMPACT ASSESMENT
February 2013 Report No. 11613755-11905-3 19
Aspect Potential Impact Extent Duration Intensity Probability Impact Notes
Construction of pipelines
Potential impacts relating to the construction of pipelines through wetlands could be:
the pollution of water within
the wetland, through
construction activities;
the incorrect re-instatement
of wetland vegetation that
may result in the exposing
and erosion of wetland soils
that can lead to downstream
sedimentation; and
the compaction of wetland
soils through the use of
machinery in the wetland.
2 2/3 2 2 8/9
medium
A medium impact can be expected.
The construction phase needs to have
strict rules in place regarding the
wetland areas. A Rehabilitation Plan
will need to be developed upfront of
any construction starting to
accompany the Water Use Licence
Application to Department of Water
Affairs.
Mitigation could reduce the impact to
low.
OPERATIONAL PHASE
Run-off from dirty areas
Workshop areas;
Chemical storage areas;
Access roads
1 2 2 2 7
medium
It is expected that without mitigation a
medium negative impact can be
expected. Mitigation will include:
Adequate storm water management
around the site to comply with GN704.
This will mean that clean runoff from
the site will be diverted away from dirty
areas to the river and that run-off from
dirty areas will be contained in an
adequately sized (1:50) pollution
MAJUBA UCG PROJECT: SURFACE WATER IMPACT ASSESMENT
February 2013 Report No. 11613755-11905-3 20
Aspect Potential Impact Extent Duration Intensity Probability Impact Notes
control dam for evaporation and reuse.
Chemical storage areas will be bunded
so that if a spill occurs the chemical
will be contained.
A Storm Water Management Plan will
need to accompany the Water Use
Licence application to Department of
Water Affairs.
The significance of the impact after
mitigation is likely to decrease to a low
negative impact.
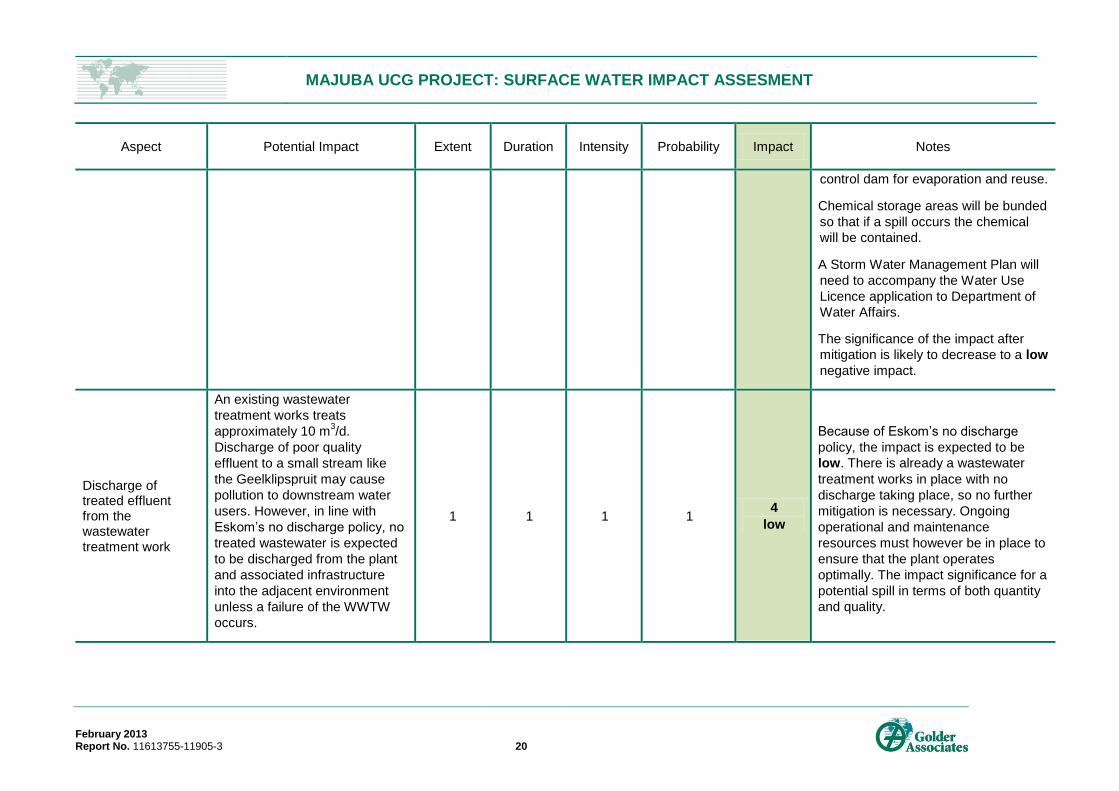
Discharge of treated effluent from the wastewater treatment work
An existing wastewater
treatment works treats
approximately 10 m3/d.
Discharge of poor quality
effluent to a small stream like
the Geelklipspruit may cause
pollution to downstream water
users. However, in line with
Eskom’s no discharge policy, no
treated wastewater is expected
to be discharged from the plant
and associated infrastructure
into the adjacent environment
unless a failure of the WWTW
occurs.
1 1 1 1 4
low
Because of Eskom’s no discharge
policy, the impact is expected to be
low. There is already a wastewater
treatment works in place with no
discharge taking place, so no further
mitigation is necessary. Ongoing
operational and maintenance
resources must however be in place to
ensure that the plant operates
optimally. The impact significance for a
potential spill in terms of both quantity
and quality.

MAJUBA UCG PROJECT: SURFACE WATER IMPACT ASSESMENT
February 2013 Report No. 11613755-11905-3 21
Aspect Potential Impact Extent Duration Intensity Probability Impact Notes
Erosion of the watercourse 1 1 1 1 4
low
Irrigation of condensate
Irrigation of condensate from the
gas treatment plant may cause
run-off of contaminated water to
the river if the treatment is not
done adequately.
The condensate recovered from the gas treatment plant and gas pipeline is pumped into a process water dam (12 000 m
3).
The dam is lined and has monitoring wells in place to provide an early warning system. UCG condensate from gasifier unit 1 is currently piped to this dam. Once gasifier unit 2 is in operation, the condensate will also be routed to this dam. At the 70 000 Nm
3/hr gas
production scale, the expected quantity of condensate produced is 46 000 m
3/a. The condensate
will be treated to a quality suitable to either:
Support local irrigation
activities;
Re-inject the water into the
2 3 3 3 11
high
The irrigation of treated water of the quality indicated in GAA Report No. 11613755/11857/2, Management Plan for the disposal of condensate water by irrigation may cause serious pollution to the resource if irrigation takes place in an uncontrolled manner, with a potential high impact. If irrigation is done according to the Management Plan proposed by the Report, GAA Report No. 11613755/11857/2, then it is likely that impact could be reduced to low. As a safety precaution, a dam with sufficient capacity will be constructed in order to cater for down-time of the water treatment plant. It is envisaged that for the option of supplying the water for irrigation purposes, the plant will consist of solid sludge filtration, followed by the removal of organic compounds with the use of activated carbon. The resulting largely organic free condensate will pass through a micro-filtration unit after which it will be made available for irrigation purposes.
MAJUBA UCG PROJECT: SURFACE WATER IMPACT ASSESMENT
February 2013 Report No. 11613755-11905-3 22
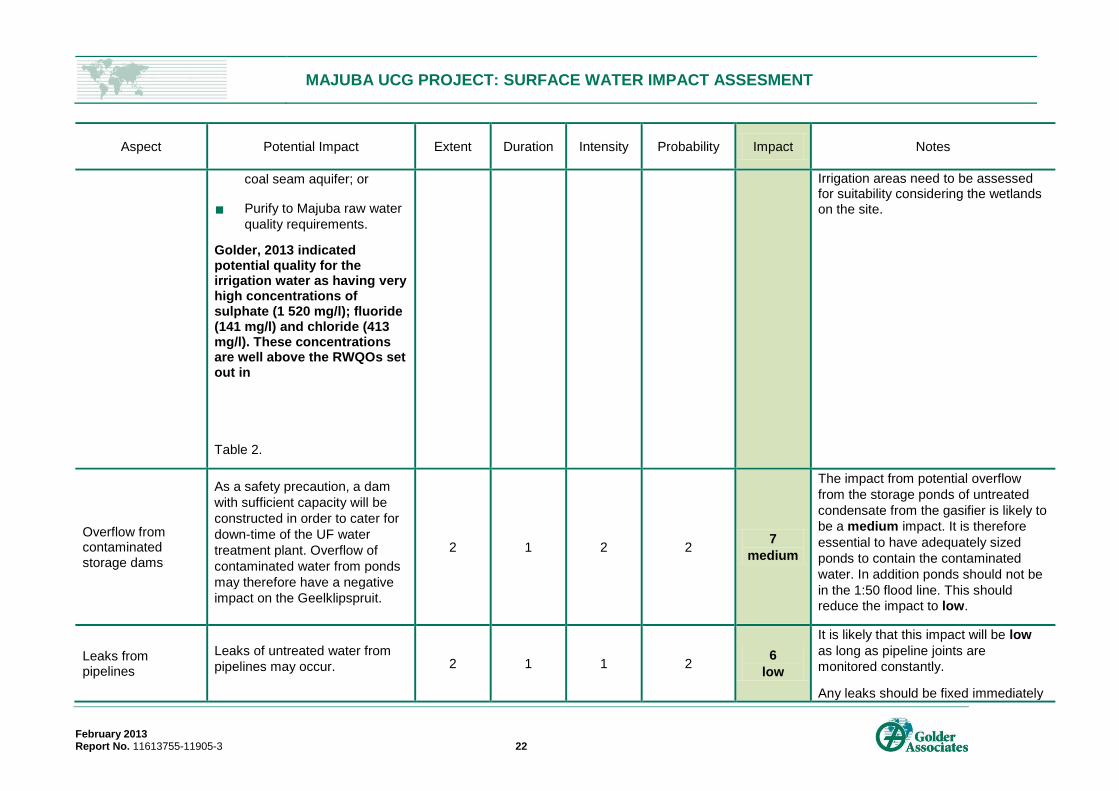
Aspect Potential Impact Extent Duration Intensity Probability Impact Notes
coal seam aquifer; or
Purify to Majuba raw water
quality requirements.
Golder, 2013 indicated potential quality for the irrigation water as having very high concentrations of sulphate (1 520 mg/l); fluoride (141 mg/l) and chloride (413 mg/l). These concentrations are well above the RWQOs set out in
Table 2.
Irrigation areas need to be assessed for suitability considering the wetlands on the site.
Overflow from contaminated storage dams
As a safety precaution, a dam
with sufficient capacity will be
constructed in order to cater for
down-time of the UF water
treatment plant. Overflow of
contaminated water from ponds
may therefore have a negative
impact on the Geelklipspruit.
2 1 2 2 7
medium
The impact from potential overflow
from the storage ponds of untreated
condensate from the gasifier is likely to
be a medium impact. It is therefore
essential to have adequately sized
ponds to contain the contaminated
water. In addition ponds should not be
in the 1:50 flood line. This should
reduce the impact to low.
Leaks from pipelines
Leaks of untreated water from
pipelines may occur. 2 1 1 2 6
low
It is likely that this impact will be low
as long as pipeline joints are
monitored constantly.
Any leaks should be fixed immediately

MAJUBA UCG PROJECT: SURFACE WATER IMPACT ASSESMENT
February 2013 Report No. 11613755-11905-3 23
Aspect Potential Impact Extent Duration Intensity Probability Impact Notes
and areas rehabilitated as needed.
Undermining
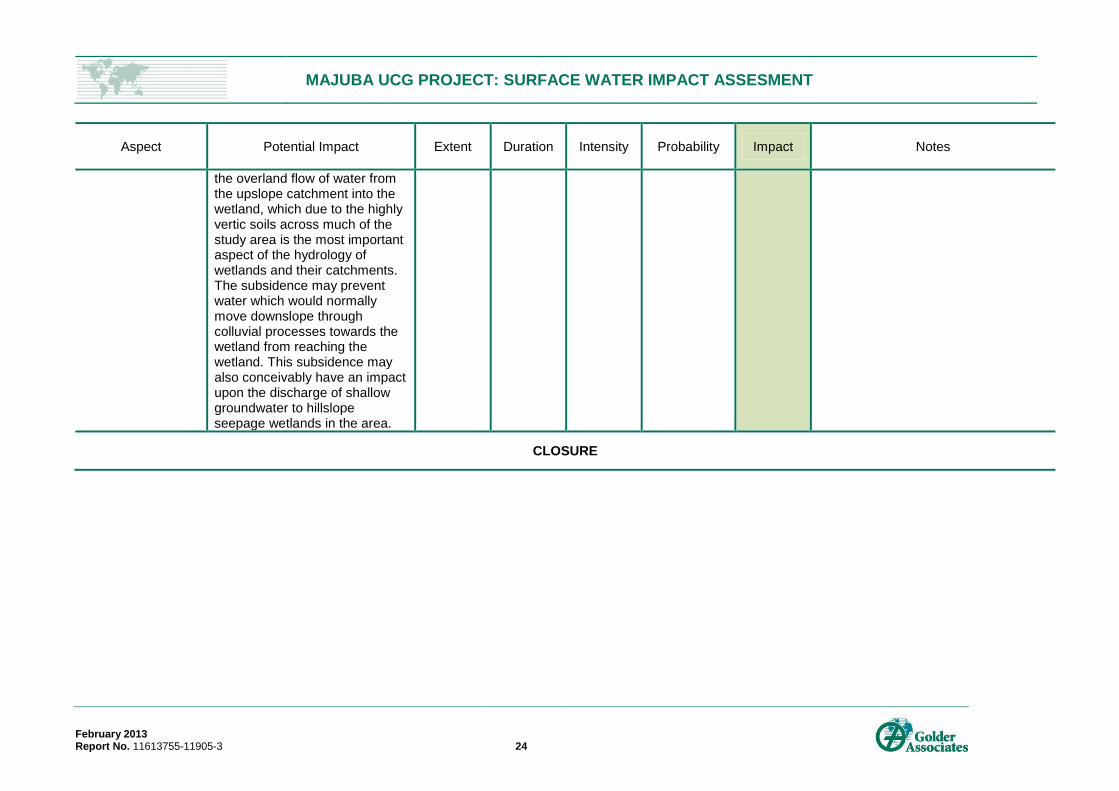
Potential subsidence of the ground in areas above mining operations. Under a worst-case scenario, the subsidence of ground at the surface may be up to 75 cm below original ground level. It is not known how widely this subsidence would take place across mining areas, and whether it would be localised; however when the policy of non-undermining of wetland areas and associated buffer zones is taken into account this may result in localised variations in micro-topography in certain parts of the catchments of wetlands. This may have significant impacts on the water inputs to the wetland from the catchment as the subsidence could conceivably result in a ‘ridge’ or embankment forming within part of the wetland’s immediate catchment whereby the ‘upslope’ areas could be lower than the downslope areas. This effect could significantly disrupt
2 3/4 3 2 10/11
High
The impact of potential subsidence to
the surface water component would be
high. However, the dynamics of the
potential subsidence are unknown at
this stage, and will need to be
quantified in order to allow the
potential impact on wetlands and local
catchment hydrological inputs to
wetlands in the study area to be further
investigated and quantified.
MAJUBA UCG PROJECT: SURFACE WATER IMPACT ASSESMENT
February 2013 Report No. 11613755-11905-3 24
Aspect Potential Impact Extent Duration Intensity Probability Impact Notes
the overland flow of water from the upslope catchment into the wetland, which due to the highly vertic soils across much of the study area is the most important aspect of the hydrology of wetlands and their catchments. The subsidence may prevent water which would normally move downslope through colluvial processes towards the wetland from reaching the wetland. This subsidence may also conceivably have an impact upon the discharge of shallow groundwater to hillslope seepage wetlands in the area.
CLOSURE

MAJUBA UCG PROJECT: SURFACE WATER IMPACT ASSESMENT
February 2013 Report No. 11613755-11905-3 25
Aspect Potential Impact Extent Duration Intensity Probability Impact Notes
Pollution of water resources due to infrastructure decommissioning
Decommissioning of infrastructure such as buildings in the workshop and plant area would contain materials which could potentially act as pollutants to surface water resources, including fuel/hydrocarbon storage tanks or wastewater storage dams.
The risk of this impact depends on the proximity of infrastructure to surface water receptors, and to links between groundwater and surface water resources in the case of seepage of pollutants into the ground that may pollute groundwater.
Residual impacts of mining activities such as development of soil erosion or improperly maintained roads may result in secondary impacts on water resources through the extension of erosion into the wetland or other surface water resources resulting in deposition silt.
2 2 2 2 8
medium
The impact during decommissioning is likely to be medium. Proper post-operation rehabilitation, removal and disposal of any material that could cause pollution of water resources through seepage or storm water runoff is important if the potential impact is to be reduced to low.

MAJUBA UCG PROJECT: SURFACE WATER IMPACT ASSESMENT
February 2013 Report No. 11613755-11905-3 26
9.0 KEY FINDINGS AND CONCLUSIONS
The impact assessment has indicated that if mitigation and a comprehensive rehabilitation plan are put in
place the impacts on surface water will be low.
The main impact during construction and decommissioning is likely to be the run-off from the construction
area to the Geelklipspruit. This can be mitigated by staying out of the 1:50 year flood lines.
The impact during operation will potentially be medium to high:
Run-off from dirty areas;
Discharge of treated effluent from the wastewater treatment work;
Irrigation of condensate;
Overflow from contaminated storage dams;
Leaks from pipelines; and
Undermining.
The highest impact being that of irrigation of treated condensate where extremely high levels of sulphate,
fluoride and chloride, well above the RWQOs were noted (Golder 2013). The proposed irrigation plan should
be followed to mitigate the potential impacts to the Geelklipspruit.
10.0 RECOMMENDATIONS
In order to ensure that the medium to high impacts are mitigated a storm water management plan that will
ensure that clean and dirty water are separated and that pollution control dams are adequately sized must
be put in place. Flood line delineation will help to ensure that the mine keeps all infrastructure out of the 1:50
flood line.
During construction and operation the surface water monitoring programme must be kept in place and kept
going until after decommissioning. Monitoring should be done on a monthly basis for all the parameters that
are currently being undertaken and any further that would be written into a water use licence.

MAJUBA UCG PROJECT: SURFACE WATER IMPACT ASSESMENT
February 2013 Report No. 11613755-11905-3 27
11.0 REFERENCES
Eskom Holdings SOC Limited (2013). Environmental Scoping Report for the Underground Coal Gasification
Project and Associated Infrastructure in support of co-firing of gas at the Majuba Power Station, Amersfoort,
Mpumalanga, E02.JNB.000308
Eskom Holdings SOC Limited (2012). Underground Coal Gasification Project – Wetlands Report – Scoping
Phase. SSI Report Number: E02.JNB.000308
Golder Associates Africa (2013). Management Plan for the disposal of condensate water by irrigation. Report
number: 11613775/11857/2
Institute for Soil Climate and Water, Agricultural Research Council, South Africa. (2013). A critical evaluation of the soil and water quality in developing an irrigation management plan for ESKOM for a farm near Amersfoort, Report number Report No GW/A/2013/03
Water Services Development Plan for Pixley ka Seme Local Municipality, prepared as per guidelines from
the Department of Water Affairs, draft December 2009. Prepared by Pixley ka Seme Municipality with
assistance from Kwezi V3 Engineers
GOLDER ASSOCIATES AFRICA (PTY) LTD.
Lee Boyd Priya Moodley
Water Resource Scientist Water Resource Scientist
LB/TJC/lb
Reg. No. 2002/007104/07
Directors: SAP Browns, L Greyling, RA Heath, FR Sutherland
Golder, Golder Associates and the GA globe design are trademarks of Golder Associates Corporation.
g:\projects\11613755 - eskom hydrogeological services\4_reports\11613755_11905_3 sw impact assessment.docx

Golder Associates Africa (Pty) Ltd.
PO Box 6001
Halfway House, 1685
Thandanani Park
Matuka Close
Halfway Gardens
Midrand
South Africa
T: [+27] (11) 254 4800
Caption Text