APPENDIX H CRUSHER AREA - Hornsby · PDF fileThe area designated as Part 3 of the Hornsby...
26
PSM1059.TR1 APPENDIX H CRUSHER AREA
Transcript of APPENDIX H CRUSHER AREA - Hornsby · PDF fileThe area designated as Part 3 of the Hornsby...

PSM1059.TR1
APPENDIX H
CRUSHER AREA

PSM1059.TR1 Appendix H
APPENDIX H
CRUSHER AREA H1. INTRODUCTION
The area designated as Part 3 of the Hornsby Quarry site comprises the site of the former crusher and the steep fill slopes to the north and east. Figure H1 shows the extent of Part 3. The area of Part 3 can be described as having the following boundaries: • Southern extent formed by the property boundary. • Western extent located along the upslope (or eastern) side of the existing access
road. • Eastern extent located about 10m west of the existing creek that runs between
Part 2 and Part 3. • PSM have set this boundary at 35m south of the existing crest to the quarry1.
This boundary is located part way up the fill batters between the main access road around the quarry and the former crusher plant location.
• The north eastern corner is defined by the location of the existing cemetery site.
1 The implications of the interpreted location of the geological boundary or contact, between the volcanic rocks of the quarry itself and the surrounding Hawkesbury Sandstone are discussed in detail later in this Appendix and in Appendix E. However, the basis for setting the northern extent of Part 3 is the location of the contact between the breccia and the Hawkesbury sandstone which is typically between about 32m and 36m behind (south of) the crest of the quarry and the orientation of the quarry faces.

2
PSM1059.TR1 Appendix H
Figure H1: Extent of Part 3. The flat area to the immediate north and east of the former crusher plant, and the site of the plant itself, covers an area of about 1.1 Hectares (Ha). The total area of Part 3 covers an area of about 2.1 Ha. Two access tracks currently extend onto the flat part of the area. These comprise a short track from Quarry road at the eastern side of the former crusher and a track that cuts across the northern fill batter. This later track provides access from the main track/road around the quarry. Aerial photographs indicate construction of the crusher plant site commenced between 1956 and 1961. Indications are that only minor changes to the topography had occurred by 1961 with most of the earth works in this area up to this time being associated with the main access road. A vertical concrete wall is located at the western side of Part 3, adjacent to the main access road. This was most likely used for loading trucks with quarry product. H2. HISTORICAL FEATURES
There are two Historical features adjacent to the Part 3 area. These are: a. The site of the original valley settlers home (Higgins) about midway along the
northern side of Part 3, and b. The cemetery adjacent to the north eastern corner of Part 3. Both these sites are tended by the located Historical Society and are considered to be outside Part 3.

3
PSM1059.TR1 Appendix H
H3. INVESTIGATIONS AND MATERIALS
Three test pits were excavated in the flat area of Part 3. These pits were designated TP1, TP2 and TP3 and their locations are shown on Figure H1. Fill logs of the test pits are included in Appendix A to this report. The following summarises the materials encountered: 1. Surface up to 1.2m depth Well graded silty sandy GRAVEL (dolerite derived)
in a medium dense condition. Dry. 2. 1.2m to >5.5m thickness Clayey sandy GRAVEL and gravely SANDS.
Materials in a loose and loose to medium dense condition. Dolerite gravels with some cobbles and boulders of 0.7m to 1.0m size. Occasional sandstone boulders also to 1m size. Dry.
Zone also contained zones of silty SAND to 0.8m
thick (TP1) and poorly graded sandy GRAVELS (TP1).
3. Sandstone bedrock Only encountered in test pit TP2 at 2m-3m depth. 4. Fill extended to >5.5m and >4.0m depth in test pits TP1 and TP3. Two samples taken from test pits TP1 and TP3 indicated pH of the fill tested was between 8.1 and 8.2. Sulphate content was between 280mg/kg and 430mg/kg. Approximate contours of fill thickness in the crusher plant area have been prepared by comparing the 1961 and 2006 contours plans. The results are shown on Drawing PSM1059-20 and in Figure H2 below:
Figure H2: Isopachs of fill thickness.

4
PSM1059.TR1 Appendix H
H4. INTERPRETED GEOTECHNICAL MODEL
Three cross sections show profiles through Part 3. The location of the cross sections is shown in Figure H3. Drawings PSM1059-12, PSM1059-13 and PSM1059-16 show the full cross sections. Figures H3 and H4 show the interpreted geotechnical model at cross sections 7 and 11 respectively.
Figure H3: Interpreted geotechnical model at Section 7.
Figure H4: Interpreted geotechnical model at Section 11. The figures indicate depths of fill ranging up to 12m to 15m. The extent and depth of filling was assessed by comparison of contours developed from aerial photographs for 1961 and for 2006. This work was done partly by AAM Hatch Pty Ltd then supplemented through test pit excavations, and observations of aerial photographs (stereopairs). Underlying the fill materials in Part 3 are residual sandstone and weathered sandstone rock. The residual sandstone vary from about 4.5m/5.5m thick at the western side of Part 3 up to between 7m and 8.5m in the central and eastern areas. Sandstone rock underlying the residuals is highly weathered (HW) then moderately weathered (MW). Slightly weathered (SW) and fresh (FR) sandstone rock is present at between about 18m and 25m depth.

5
PSM1059.TR1 Appendix H
The reader should note that the toe area of the main fill batters at the northern boundary to Part 3 are underlain by residual and volcanic breccia rock. Fill Batters Fill batters in, and extending to the immediate north of Part 3, typically vary between about 30° and 40° to the horizontal. Some sections of batter are steeper at up to nearly 50° adjacent to the former crusher plant and at the toe of the batter slope adjacent to the main access road. Groundwater No specific groundwater information was available for Part 3 of the site. However, fill materials in test pits and the lack of any observed seepage from the toe of the fill batters or upper parts of the nearby quarry faces indicates that only a deep groundwater table in the rock is permanently present. Notwithstanding the above, it is expected that infiltration of rainfall and stormwater runoff from along Quarry road and the slopes above the area would result in a transient water table in the fill materials. Under the current dry conditions being experienced in the region a low water table in the fill is considered appropriate. A water table at the base of the fills, typically up to 0.5m to 1m deep has been adopted for stability analyses. In extreme rainfall events, periods of prolonged rainfall or major water leakages from nearby water supply lines a ‘design’ water table that saturates the majority of the fills should also be considered. H5. MATERIAL PARAMETERS
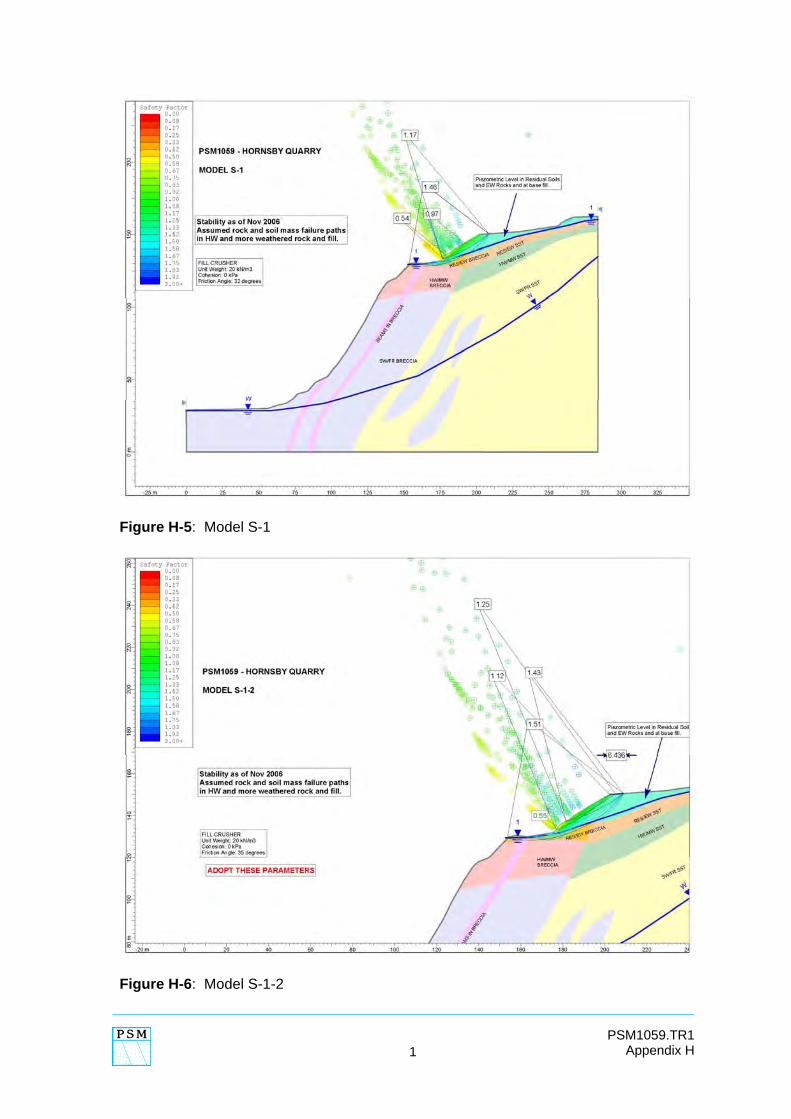
Material parameters adopted for this stability assessment have been set out in Appendix B to this report. For Part 3 of the site, the main parameters relate to the fill materials for which the following shear strength values adopted are: Cohesion 0 kPa Friction Angle 35° Unit Weight 20kN/m3 The friction angle above was based on back analysis of the stability of the fill slopes at Section 11 shown in Figure H4. The results are presented in Section H6 below as models 5-1 and 5-1-2.
6
PSM1059.TR1 Appendix H
H6. STABILITY ANALYSES
H6.1. Results
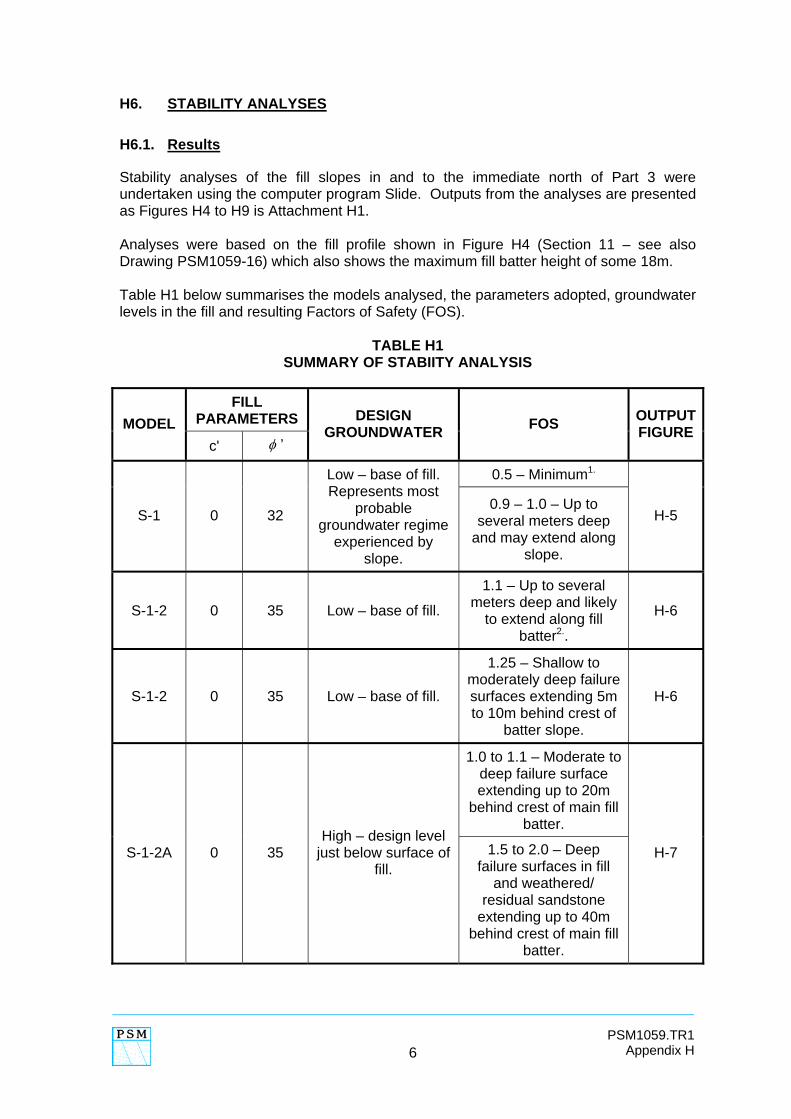
Stability analyses of the fill slopes in and to the immediate north of Part 3 were undertaken using the computer program Slide. Outputs from the analyses are presented as Figures H4 to H9 is Attachment H1. Analyses were based on the fill profile shown in Figure H4 (Section 11 – see also Drawing PSM1059-16) which also shows the maximum fill batter height of some 18m. Table H1 below summarises the models analysed, the parameters adopted, groundwater levels in the fill and resulting Factors of Safety (FOS).
TABLE H1 SUMMARY OF STABIITY ANALYSIS
FILL
PARAMETERS MODEL c' φ ’
DESIGN GROUNDWATER FOS OUTPUT
FIGURE
0.5 – Minimum1.
S-1 0 32
Low – base of fill. Represents most
probable groundwater regime
experienced by slope.
0.9 – 1.0 – Up to several meters deep
and may extend along slope.
H-5
S-1-2 0 35 Low – base of fill.
1.1 – Up to several meters deep and likely
to extend along fill batter2..
H-6
S-1-2 0 35 Low – base of fill.
1.25 – Shallow to moderately deep failure surfaces extending 5m to 10m behind crest of
batter slope.
H-6
1.0 to 1.1 – Moderate to deep failure surface extending up to 20m
behind crest of main fill batter.
S-1-2A 0 35 High – design level
just below surface of fill.
1.5 to 2.0 – Deep failure surfaces in fill
and weathered/ residual sandstone
extending up to 40m behind crest of main fill
batter.
H-7

7
PSM1059.TR1 Appendix H
FILL PARAMETERS MODEL
c' φ ’
DESIGN GROUNDWATER FOS OUTPUT
FIGURE
S-2 0 35 Low Reworked fill platform
with new batter at 2H:IV. FOS – 1.4.
H-8
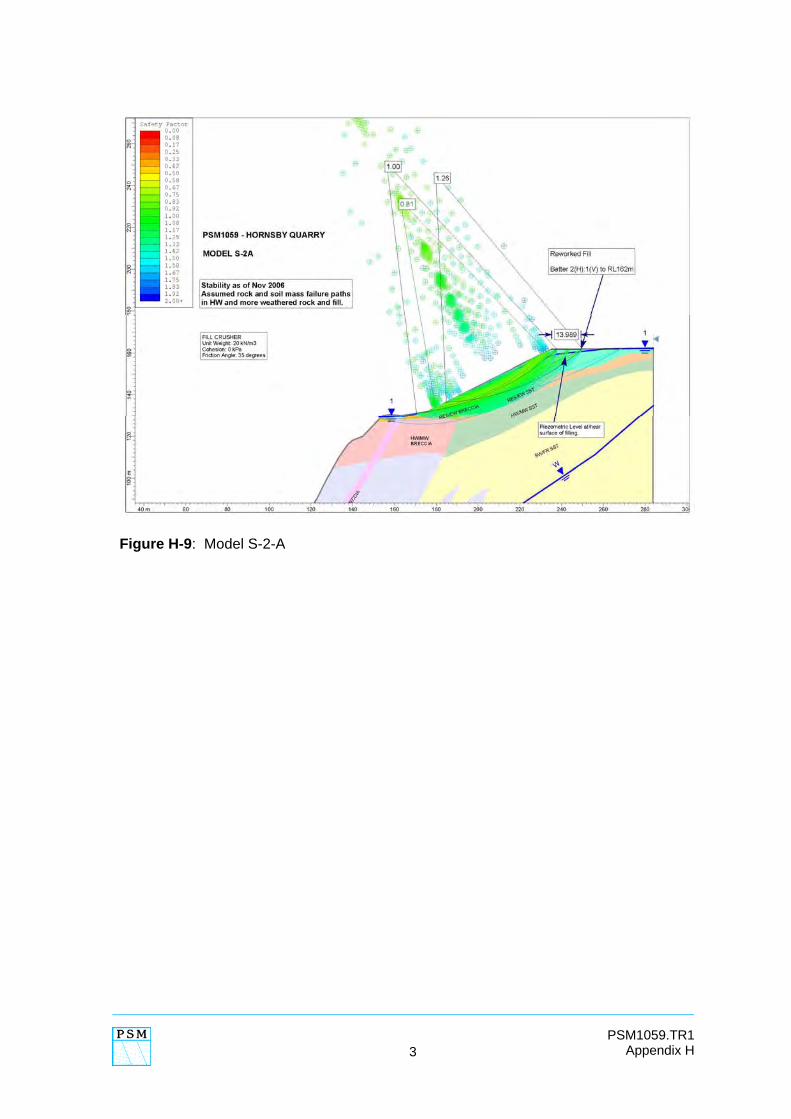
S-2-A 0 35 High
0.8 – Minimum. 1.0 – Moderately deep
surface. 1.2 to 1.3 – Deep
surface extending up to 15m behind crest of re-
worked batter.
H-9
Notes: 1. Sacrificial failure surfaces – typically extend less than 1, below the surface of the fill. Likely to represent very localised features along the length of the fill batter. 2. AOS ≈ 1.1 considered appropriate for back analyses of the existing fill batters. These values adopted for overall fill mass in stability analyses.
H6.2. Target Factor of Safety
A minimum design FOS of 1.5 was adopted for the assessment of slopes of the quarry and surrounding areas. This value is considered to be acceptable for normal civil engineering projects. A FOS ≥ 1.5 is appropriate where the risk to the public due to slope failure must be sufficiently low to allow continual or frequent occupancy/access. H6.3. Assessment of Safety
The existing fill cannot be considered to be an engineered fill as it was not placed in a controlled manner. Stability assessments indicate a number of points. 1. Under current groundwater conditions (water table deep at base of fill) the
existing northern area eastern fill batters have computed factors of safety less than would normally be accepted for permanent fill structures.
2. Possible failure surfaces in the fills (current low groundwater regime) are likely to
impact the face of the main fill batter and extend up to 10m beyond the crest of the batter. Failures are likely to cover the existing access road. Under current conditions, only limited access to the roadway below these slopes is recommended. That is, the existing access road alignment is not suitable for permanent public access unless stabilisation measures are provided for the fills above the road.
It should also be noted that permanent public use of the existing road alignment in this area is also not appropriate without stabilisation of the quarry faces below the roadway (refer to Appendix E).

8
PSM1059.TR1 Appendix H
Appropriate access may comprise: a. Infrequent users such as the historical society or Council workers
inspecting the site. b. Transit of vehicles such as trucks, excavators or dozers. Implementation of a suitable monitoring regime or slopes above and below the roadway, and/or provision of structures/measures to mitigate the risk to roadway users are likely to be required for activities such as quarry backfilling where regular truck traffic may use the existing access road.
3. Under high, ‘design’ groundwater conditions (saturated fill) the main fill batter
presents a high risk of failure. 4. Flattened fill batters formed at no steeper than 2(H):1(V) would be required under
current groundwater conditions to provide for continued use of the existing roadway. However, as the groundwater regime rises to the high, ‘design’, level the slope stability would again become unacceptable for a permanent fill.

9
PSM1059.TR1 Appendix H
H7. FINDINGS
H7.1. Useable Land
In terms of useable land, Part 3 provides for a relatively small area. In order to maximise the useable space some form of retention works such as those indicated in Figure H10 below would be required.
Figure H10: Possible retaining wall layouts for Reinforced Earth Walls
Works such as those depicted above may provide a useable area of up to 1.8 to 2.0 Ha depending on details such as building locations and other loadings such as vehicle access and/or parking. The conceptual design for the retention works comprises the following: • Reinforced earth (RE) wall structure – considered the most economical for walls
of up to a maximum height of about 30m. Design comprises steel straps and geotextile grids embedded in the new, compacted fill.
• RE wall batter at about 70 degrees to the horizontal.

10
PSM1059.TR1 Appendix H
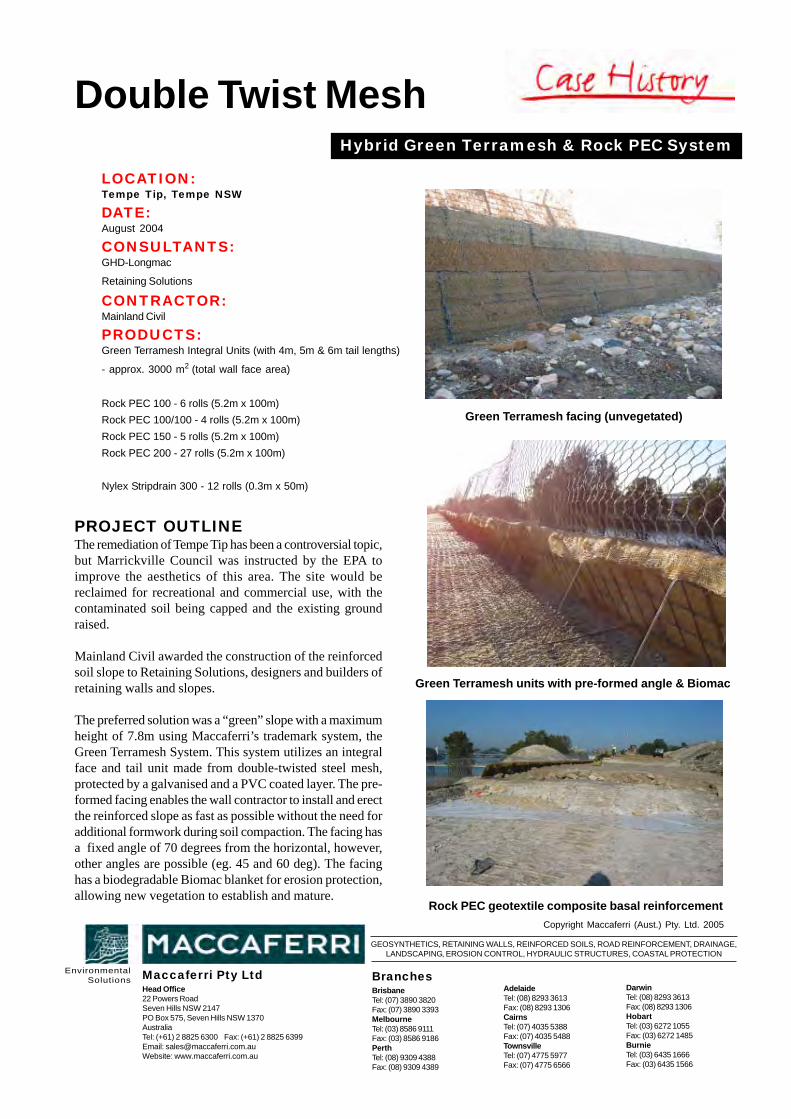
• The wall could be faced with vegetation by providing a growing medium such a Maccaferri Green Terramesh system2. Design could also adopt methods to face the wall such as gabion baskets (nominally 1m deep) or keystone facing but these would be expected to be more costly.
• New wall founded in weathered sandstone rock. Limitations on such works would include: i. A set back limit from the crest of the wall for location of buildings on vehicle loads. ii. Piling may be required for heavily loaded buildings and/or for buildings near the
crest of the wall. iii. Cost to excavate the wall foundation. iv. Costs to source good quality fill for RE wall. v. Costs to source and compact fill behind new reinforced earth wall. vi. Source of rock for gabion facing – could possibly derive from the existing fill
materials. Indicative costs for such a project are given in table H2 below. The estimate is based on the first layout shown in Figure H10.
TABLE H2 REINFORCED EARTH WALL COST ESTIMATE
ITEM QUANTITY COST ESTIMATE
Excavate and prepare foundations 300lm $0.15 million
Construct R.E. wall includes reinforcement and fill in wall itself
$2.5 million
Place new fill behind wall 30,000m3 $0.3 million*
Drainage works – surface and subsurface
allow say $0.1 million
Detailed design Allow $0.1 million
TOTAL ESTIMATE $3.15 million
* PSM have adopted a price of $10/m3 for compacted fill, including contractor set up. The cost to design and construct the second option presented in Figure H10 is estimated at about $4.5 to 5 million.
2 Examples of Green Terramesh are given in Attachment 2. Examples include works at a site known as the Tempe tip, which is now a vegetated slope along Qantas Drive near the airport.
11
PSM1059.TR1 Appendix H
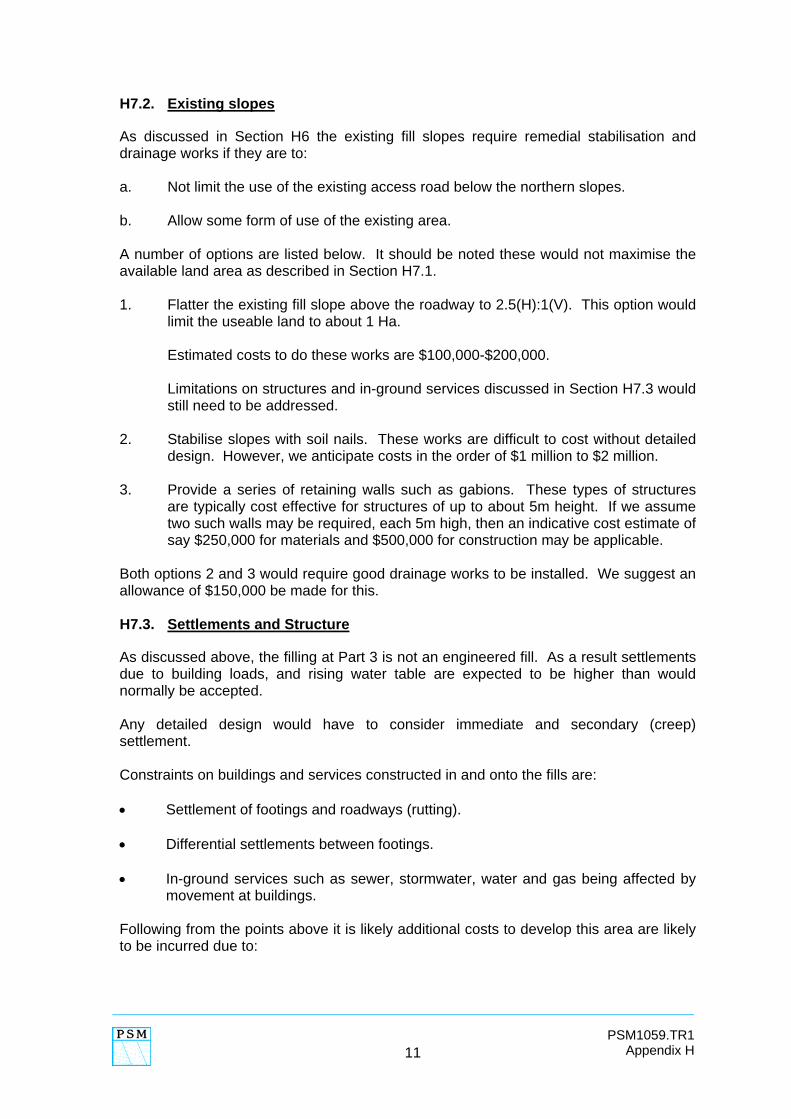
H7.2. Existing slopes
As discussed in Section H6 the existing fill slopes require remedial stabilisation and drainage works if they are to: a. Not limit the use of the existing access road below the northern slopes. b. Allow some form of use of the existing area. A number of options are listed below. It should be noted these would not maximise the available land area as described in Section H7.1. 1. Flatter the existing fill slope above the roadway to 2.5(H):1(V). This option would
limit the useable land to about 1 Ha. Estimated costs to do these works are $100,000-$200,000. Limitations on structures and in-ground services discussed in Section H7.3 would
still need to be addressed. 2. Stabilise slopes with soil nails. These works are difficult to cost without detailed
design. However, we anticipate costs in the order of $1 million to $2 million. 3. Provide a series of retaining walls such as gabions. These types of structures
are typically cost effective for structures of up to about 5m height. If we assume two such walls may be required, each 5m high, then an indicative cost estimate of say $250,000 for materials and $500,000 for construction may be applicable.
Both options 2 and 3 would require good drainage works to be installed. We suggest an allowance of $150,000 be made for this. H7.3. Settlements and Structure
As discussed above, the filling at Part 3 is not an engineered fill. As a result settlements due to building loads, and rising water table are expected to be higher than would normally be accepted. Any detailed design would have to consider immediate and secondary (creep) settlement. Constraints on buildings and services constructed in and onto the fills are: • Settlement of footings and roadways (rutting). • Differential settlements between footings. • In-ground services such as sewer, stormwater, water and gas being affected by
movement at buildings. Following from the points above it is likely additional costs to develop this area are likely to be incurred due to:

12
PSM1059.TR1 Appendix H
i. Provision of piles to sandstone bedrock. It is expected piles would extend into HW/MW sandstone with the result that piles would be between at least 5m and 15m long.
ii. Provision of stiff, waffle raft slabs. iii. Drainage measures to ensure surface and ground waters do not impact on the fill. iv. Provision of flexible couplings for services may, in some instances cope with
settlements of buildings. Other methods may require provision of footings for services or treatment of the existing fill. This last point is discussed further in Section H7.4.
v. Locate structures toward the southern boundary of Part 3 to minimise the depth
of fill that may cause settlements. H7.4. Fill Treatment
Settlement of buildings and movement of in-ground services may be limited through in-situ treatment of the existing fill. Possible methods are summarised in Table H3.
TABLE H3 IN-SITU FILL TREATMENT OPTIONS
OPTION DESCRIPTION REMARKS
1 Preloading with fill re other mass such as concrete blocks
Time consuming. May require loading period of many years depending on the desired impact and level of pre-load able to be achieved.
Likely to be cheapest option and would be effective. Probably provide the greatest level of confidence in results.
2 Heavy and deep compaction with impact rollers
Most efficient in terms of time. Costs would be moderate and depend on the level of compaction and surface preparation required.
Require specialist design and monitoring and be most suited to a development comprising light weight structures, inground services and lightly loaded results.
3 Deep vibro compaction/ soil mixing
Specialist equipment and expertise required from firms such as Frank:(Keller) or Menard Soltraitement. Costs not known but likely to be highest of the options listed.

13
PSM1059.TR1 Appendix H
H7.5. Potential Uses of Fill
The existing fills are considered suitable for the following uses: 1. As dumped fill in works to backfill the quarry void. No sorting or other treatments
required. 2. Sort fill into (a) boulders and cobbles and (b) dirty gravels. Boulders and Cobbles could be used for construction of erosion protection
measures, broken down (crushed) into gravels for general filling or as backfill to drainage lines or behind drained retaining walls.
Dirty Gravels could be used for general filling and landscape works. 3. Crush and sort/size materials into a product suitable for use as a structural fill
behind retaining walls or below light weight structures. It is likely the most cost effective uses of the fill are: A. Left in-situ with/without treatment depending on final land use. B. Used as dumped fill in backfill works to quarry.
14
PSM1059.TR1 Appendix H
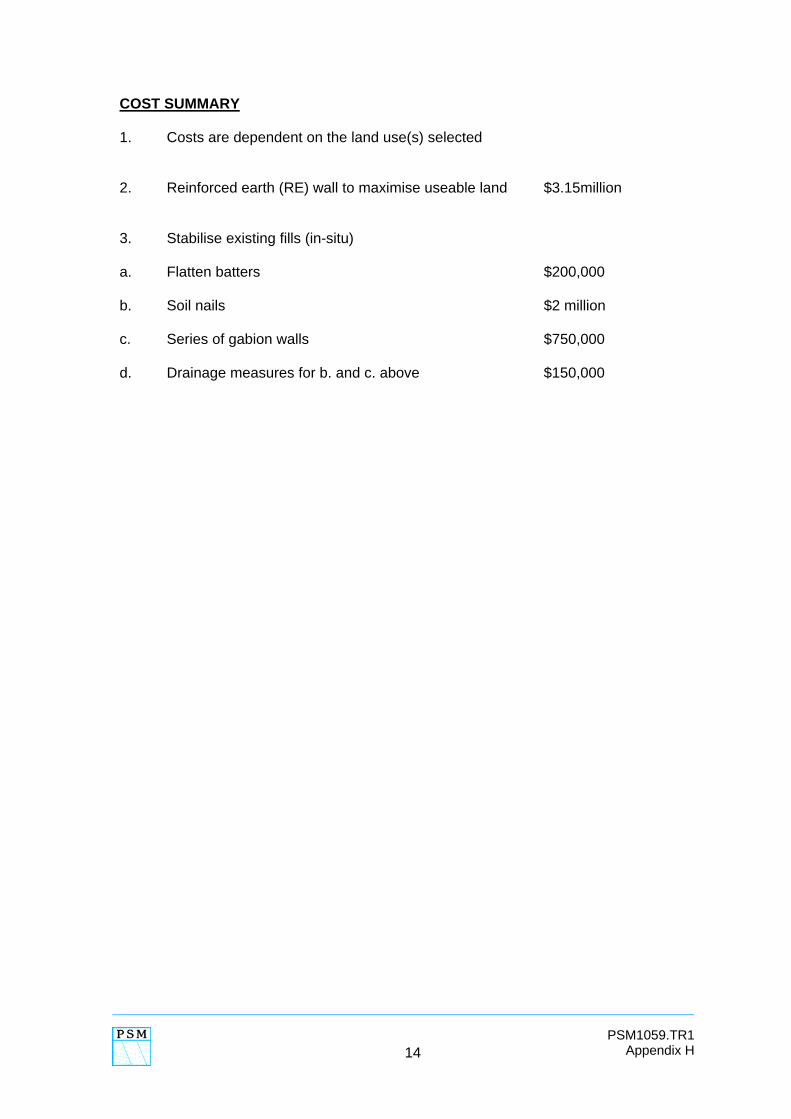
COST SUMMARY 1. Costs are dependent on the land use(s) selected
2. Reinforced earth (RE) wall to maximise useable land $3.15million 3. Stabilise existing fills (in-situ) a. Flatten batters $200,000 b. Soil nails $2 million c. Series of gabion walls $750,000 d. Drainage measures for b. and c. above $150,000

PSM1059.TR1 Appendix H
ATTACHMENT H1 STABILITY ASSESSMENT
1
PSM1059.TR1 Appendix H
Figure H-5: Model S-1
Figure H-6: Model S-1-2

2
PSM1059.TR1 Appendix H
Figure H-7: Model S-1-2A
Figure H-8: Model S-2
3
PSM1059.TR1 Appendix H
Figure H-9: Model S-2-A

PSM1059.TR1 Appendix H
ATTACHMENT H2 EXAMPLES OF REINFORCED EARTH WALLS

Maccaferri Green Terramesh www.maccaferri.com.au
MACCAFERRI GREEN TERRAMESH™ - PROJECT EXAMPLES
2005. Kuranda Range, Cairns. 36m long x 5.4m high Green Terramesh™ reinforced slope.
Photos were taken soon after installation.
June 2006. Kuranda Range, Cairns. 36m long x 5.4m high Green Terramesh™ reinforced
slope. Photos showing the rapid growth of vegetation on the face.

Maccaferri Green Terramesh www.maccaferri.com.au
2004. Tempe Tip, Sydney. 900m long x 6.6m high Green Terramesh™ reinforced slope. Photos
were taken during installation, prior to hydro seeding of the face.
2005. Democratic of Congo. 545m long x 8.55m high Green Terramesh™ reinforced slope.
Photos were taken soon after installation.

Maccaferri Green Terramesh www.maccaferri.com.au
2005. East London, South Africa. Green Terramesh™ reinforced slope. Photos were taken
during installation.
2001. Knysna, South Africa. Green Terramesh™ reinforced slope before and after planting

Maccaferri Green Terramesh www.maccaferri.com.au
International Examples
EnvironmentalSolutions
LOCATION:Tempe Tip, Tempe NSW
DATE:August 2004
CONSULTANTS:GHD-Longmac
Retaining Solutions
CONTRACTOR:Mainland Civil
PRODUCTS:Green Terramesh Integral Units (with 4m, 5m & 6m tail lengths)
- approx. 3000 m2 (total wall face area)
Rock PEC 100 - 6 rolls (5.2m x 100m)Rock PEC 100/100 - 4 rolls (5.2m x 100m)Rock PEC 150 - 5 rolls (5.2m x 100m)Rock PEC 200 - 27 rolls (5.2m x 100m)
Nylex Stripdrain 300 - 12 rolls (0.3m x 50m)
Green Terramesh facing (unvegetated)
Hybrid Green Terramesh & Rock PEC System
Double Twist Mesh
PROJECT OUTLINEThe remediation of Tempe Tip has been a controversial topic,but Marrickville Council was instructed by the EPA toimprove the aesthetics of this area. The site would bereclaimed for recreational and commercial use, with thecontaminated soil being capped and the existing groundraised.
Mainland Civil awarded the construction of the reinforcedsoil slope to Retaining Solutions, designers and builders ofretaining walls and slopes.
The preferred solution was a “green” slope with a maximumheight of 7.8m using Maccaferri’s trademark system, theGreen Terramesh System. This system utilizes an integralface and tail unit made from double-twisted steel mesh,protected by a galvanised and a PVC coated layer. The pre-formed facing enables the wall contractor to install and erectthe reinforced slope as fast as possible without the need foradditional formwork during soil compaction. The facing hasa fixed angle of 70 degrees from the horizontal, however,other angles are possible (eg. 45 and 60 deg). The facinghas a biodegradable Biomac blanket for erosion protection,allowing new vegetation to establish and mature.
Copyright Maccaferri (Aust.) Pty. Ltd. 2005
GEOSYNTHETICS, RETAINING WALLS, REINFORCED SOILS, ROAD REINFORCEMENT, DRAINAGE,LANDSCAPING, EROSION CONTROL, HYDRAULIC STRUCTURES, COASTAL PROTECTION
Green Terramesh units with pre-formed angle & Biomac
Maccaferri Pty LtdHead Office22 Powers RoadSeven Hills NSW 2147PO Box 575, Seven Hills NSW 1370AustraliaTel: (+61) 2 8825 6300 Fax: (+61) 2 8825 6399Email: [email protected]: www.maccaferri.com.au
BranchesBrisbaneTel: (07) 3890 3820Fax: (07) 3890 3393MelbourneTel: (03) 8586 9111Fax: (03) 8586 9186PerthTel: (08) 9309 4388Fax: (08) 9309 4389
AdelaideTel: (08) 8293 3613Fax: (08) 8293 1306CairnsTel: (07) 4035 5388Fax: (07) 4035 5488TownsvilleTel: (07) 4775 5977Fax: (07) 4775 6566
DarwinTel: (08) 8293 3613Fax: (08) 8293 1306HobartTel: (03) 6272 1055Fax: (03) 6272 1485BurnieTel: (03) 6435 1666Fax: (03) 6435 1566
Rock PEC geotextile composite basal reinforcement

Env i ronmenta lSo lu t ions
Nylex Stripdrain 300 for sub-surface drainage
Hybrid Green Terramesh & Rock PEC System
Double Twist Mesh
PROJECT OUTLINE (cont.)
Copyright Maccaferri (Aust.) Pty. Ltd. 2005
GEOSYNTHETICS, RETAINING WALLS, REINFORCED SOILS, ROAD REINFORCEMENT, DRAINAGE,LANDSCAPING, EROSION CONTROL, HYDRAULIC STRUCTURES, COASTAL PROTECTION
Typical Cross Section - 7.8m high showing Green Terrameshintegral units and Rock PEC basal reinforcement
Maccaferri Pty LtdHead Office22 Powers RoadSeven Hills NSW 2147PO Box 575, Seven Hills NSW 1370AustraliaTel: (+61) 2 8825 6300 Fax: (+61) 2 8825 6399Email: [email protected]: www.maccaferri.com.au
BranchesBrisbaneTel: (07) 3890 3820Fax: (07) 3890 3393MelbourneTel: (03) 8586 9111Fax: (03) 8586 9186PerthTel: (08) 9309 4388Fax: (08) 9309 4389
AdelaideTel: (08) 8293 3613Fax: (08) 8293 1306CairnsTel: (07) 4035 5388Fax: (07) 4035 5488TownsvilleTel: (07) 4775 5977Fax: (07) 4775 6566
DarwinTel: (08) 8984 3522Fax: (08) 8984 3606HobartTel: (03) 6272 1055Fax: (03) 6272 1485BurnieTel: (03) 6435 1666Fax: (03) 6435 1566
Green Terramesh integral tails (pre-determined lengths)
The subsurface condition of Tempe Tip was poor and highlyvariable, so it was necessary to provide additional soilreinforcement for foundation improvement and global stability.To achieve this objective, Maccaferri also supplied Rock PEChigh-strength geotextiles. Rock PEC is a geotextile compositeideal for soil reinforcement in marginal, semi-cohesive, poordraining soils. The non-woven geotextile allows for rapid in-plane pore water dissipation and separation, while the hightenacity polyester yarns provide superior long-term strength.
In addition to the basal reinforcement provided by Rock PEC,Nylex Stripdrain was also used at regular spacings forsubsurface drainage at the rear of the reinforced soil slopeblock.
The project will be completed in 2005 with local residents tobenefit from the converted waste tip.
For further information, please call your local Maccaferridistributor or our Head Office in Sydney on (02) 8825 6300.Alternatively, visit our website at www.maccaferri.com.au.