APPENDIX E - Home - THE FUNDÃO TAILINGS DAM...
21
Fundão Tailings Dam Review Panel Report on the Immediate Causes of the Failure of the Fundão Dam August 25, 2016 APPENDIX E Samarco Field Monitoring Data
Transcript of APPENDIX E - Home - THE FUNDÃO TAILINGS DAM...

Fundão Tailings Dam Review Panel Report on the Immediate Causes of the Failure of the Fundão Dam
August 25, 2016
APPENDIX E Samarco Field Monitoring Data

Fundão Tailings Dam Review Panel Report on the Immediate Causes of the Failure of the Fundão Dam
August 25, 2016 Page E-i
Appendix E Samarco Field Monitoring Data
TABLE OF CONTENTS
E1 INTRODUCTION .............................................................................................................................. 1
E2 PIEZOMETERS AND WATER LEVEL INDICATORS ............................................................................ 2 E2.1 General .............................................................................................................................. 2 E2.2 Data Presentation .............................................................................................................. 3
E2.2.1 General ............................................................................................................... 3 E2.2.2 16LI017 ............................................................................................................... 4 E2.2.3 16PI026 ............................................................................................................... 5 E2.2.4 16LI018 ............................................................................................................... 5 E2.2.5 PA-017 and PA-018 ............................................................................................. 6
E2.3 Instrument Measurement Spreadsheet ............................................................................ 6 E2.3.1 General ............................................................................................................... 6 E2.3.2 Overlapping Data ................................................................................................ 7 E2.3.3 Additional Piezometers and Water Level Indicators ........................................ 10
E3 FLOWS .......................................................................................................................................... 11
E4 SURVEY MONUMENTS ................................................................................................................. 11 E4.1 General ............................................................................................................................ 11 E4.2 Survey Monuments on the Setback ................................................................................ 12
E4.2.1 December, 2014 to August, 2015 Records ....................................................... 12 E4.2.2 August, 2014 Records ....................................................................................... 14
E4.3 Survey Monuments in the Starter Dam ........................................................................... 16
E5 INCLINOMETERS .......................................................................................................................... 18
List of Tables
Table E2-1 Instruments with overlapping records ............................................................................. 7 Table E2-2 Summary of extraneous instruments from instrument measurement spreadsheet ..... 10 Table E4-1 Setback displacement marker summary ........................................................................ 13 Table E4-2 Starter Dam displacement marker summary ................................................................. 17
List of Figures
Figure E2-1 Zoom of Samarco instrumentation plan showing 16LI018 .............................................. 6 Figure E2-2 Piezometer data comparison for 24LI017 ........................................................................ 9 Figure E2-3 Piezometer data comparison for 24LI020 ........................................................................ 9

Fundão Tailings Dam Review Panel
Report on the Immediate Causes of the Failure of the Fundão DamAppendix E - Samarco Field Monitoring Data
TABLE OF CONTENTS (continued)
August 25, 2016 Page E-ii
Figure E2-4 Piezometer data comparison for 16LI003 ...................................................................... 10 Figure E4-1 Setback survey monument plan and total displacement ............................................... 13 Figure E4-2 Setback survey monument plan and total displacement with stripped ground
contours .......................................................................................................................... 14 Figure E4-3 Location of survey monuments from Samarco’s August, 2014 incident report[52] ........ 15 Figure E4-4 Displacement plots from Samarco’s August, 2014 incident report[52] ........................... 16 Figure E4-5 Starter Dam survey monument plan and total displacement ........................................ 17
List of Attachments
Attachment E1 Dike 1 Piezometer Plan Attachment E2 Sections Attachment E3 Piezometer Records, Reservoir Level, and Rainfall Plots Attachment E4 List of Piezometers and Water Level Indicators at Dike 1 Attachment E5 Flow Data Attachment E6 Survey Monument Data

Fundão Tailings Dam Review Panel
Report on the Immediate Causes of the Failure of the Fundão DamAppendix E - Samarco Field Monitoring Data
August 25, 2016 Page E-1
E1 INTRODUCTION
This appendix presents the Samarco field monitoring data reviewed by the Panel. The instrument types installed at Dike 1 were Casagrande and vibrating wire piezometers, water level indicators (standpipes), survey monuments, and flow monitoring stations. Inclinometers were installed in the Starter Dam but were destroyed in 2009 during the remediation of Dike 1. The main source of data are Samarco’s monthly instrumentation reports, described in Appendix A. Instruments installed in Dike 2 are not included in this appendix as they were not used in the Panel’s seepage or stability analyses.
Casagrande piezometer and water level indicator readings were reported in the monthly instrumentation reports. These reports are organized by cross section, as shown in plan in Attachment E1. Prior to 2014 there were nine cross sections named AA, BB, DD, FF, HH, JJ, LL, MM, and NN from the right abutment (west) to the left abutment (east). JJ is the highest section. New piezometers were installed on the left abutment setback after the August, 2014 incident. The setback piezometers were added to the monthly instrumentation reports after August, 2014 and were organized along three new sections, 01 (west), 02 (center), and 03 (east).
Additional piezometers were installed for specific purposes and were not grouped along the instrumentation report section lines. The “spillway” group was installed after the 2015 seepage incident at the right abutment to monitor the piezometric levels in the area of the El. 860 m and El. 855 m local surface drains. The “toe” group was installed to monitor artesian pressures downstream of the Fundão toe drain (ground El. 792 m). The “left abutment” group (one piezometer) was installed at the same time as the setback piezometers and is located east of Section 03 through schist. The piezometers in these three groups were reported in the monthly instrumentation reports for the “Spillway Section”, “Toe of the Fundão Dam”, and “Return Axis” (left abutment setback).
In 2011 and 2012, vibrating wire piezometers were installed to monitor the performance of the El. 826 m blanket drain. These piezometers are numbered PA-001 through PA-039. They are organized along three section lines named A, B, and C, parallel to those in the instrumentation reports but at different locations along Dike 1. In each of the sections, piezometers were installed above and below the El. 826 m blanket drain[41]. Many of the instruments were damaged shortly after installation and the remainder were not read after May, 2015 because the readout box was stolen and had not been replaced prior to the dam failure. The data is presented in the sections below, but section lines A, B, and C are not shown to avoid confusion with the instrumentation report section lines.
The El. 826 m blanket drain was drained with 27 pipes (“Kananets®”) that discharged to a concrete channel on the El. 820 m bench. The flow from the drain was monitored using a flume located at the end of the concrete channel on the right abutment. Flow monitoring data from the Kananets® and five other locations at the Fundão Dam were reported in Samarco’s weekly reports (described in Appendix A) and in the monthly instrumentation reports.

Fundão Tailings Dam Review Panel
Report on the Immediate Causes of the Failure of the Fundão DamAppendix E - Samarco Field Monitoring Data
August 25, 2016 Page E-2
Survey monuments were installed on the left abutment after the August, 2014 incident and were included in the same Samarco spreadsheets as were used to create the monthly instrumentation reports. Survey monuments were also installed in the Starter Dam.
E2 PIEZOMETERS AND WATER LEVEL INDICATORS
E2.1 General
The Panel reviewed the following data sources:
Samarco monthly instrumentation reports.
These reports are organized along section lines. They include plots for each of the piezometers along the section, cross sections and plan views showing the instruments referenced in the report, and raw data. Some of the reports also include flow monitoring data and survey monument data, discussed in Sections E3 and E4, respectively. In some cases, piezometers damaged prior to the date of the instrumentation report are still included in the report for reference.
The most recent monthly instrumentation reports are from November, 2015 with the exception of the “toe” group. The data for this group was obtained from the October, 2015 instrumentation report.
Instrumentation report records are discussed in Section E2.2.1.
Vibrating wire piezometer1 readings in Samarco’s Microsoft Excel document.
Vibrating wire piezometer readings are included in some early instrumentation reports. Vibrating wire piezometer data were not included in the 2015 instrumentation reports but are available in a separate Microsoft Excel document (as described in Appendix A Attachment A1). The vibrating wire piezometers have records up to May 7, 2015. After this date the readout box was stolen and not replaced prior to the dam failure.
An earlier version of this Excel document contains almost identical records but the period on record ends on February 20, 2014. The earlier version includes readings from two dates (February 14 and 20, 2015) that are not included in the later version. The data from the later version is presented in the appendix because it has a longer period on record. The two extra dates from 2014 given in the earlier version are not included.
Vibrating wire piezometer records are discussed in Section E2.2.1.
Samarco’s instrumentation plan[42] shows an additional piezometer, 16LI018, discussed in Section E2.2.4.
1 Because field installation records were not reviewed, it is not known whether vibrating wire piezometers were installed directly in test holes or later to monitor water levels remotely in standpipes/Casagrande piezometers.

Fundão Tailings Dam Review Panel
Report on the Immediate Causes of the Failure of the Fundão DamAppendix E - Samarco Field Monitoring Data
August 25, 2016 Page E-3
A secondary source, referred to as the Instrument Measurement Spreadsheet, also contains piezometer readings. This document is described in Appendix A Attachment A1. The readings from this document are discussed in Section E2.3.
Installation records for the instruments were reviewed to obtain the installation date and to verify locations, when available. An additional Samarco spreadsheet[41] also contains installation dates. The installation dates for the vibrating wire piezometers were obtained from [44].
MDGEO’s Hydrogeological Study on the 940 m Raise[7] and Samarco’s 2012 OMS Manual[1] were used to verify locations of instruments.
In general, instruments with the letters “LI” in the name are water level indicators, meaning that they were constructed using perforated plastic pipe for the full depth of the instrument. Readings from water level indicators give the depth of the phreatic surface at the instrument location. Instruments with the letters “PI” in the name are Casagrande piezometers, meaning that they have perforated pipe only at the base of the instrument, creating a sealed cell at that depth. Readings from Casagrande piezometers give the pore-water pressure at the location of the cell. Vibrating wire piezometers (reported in a Samarco spreadsheet[45]) are named “PA-0XX”. Readings from vibrating wire piezometers give the pore-water pressure at the location of the piezometer tip.
Readings for 22 of the Casagrande piezometers and water level indicators were automatic. The remainder of the instruments, including the left setback piezometers and the vibrating wire piezometers, were read manually. Instruments with automatic readings are listed in a Samarco spreadsheet[46] and are identified in Attachment E4. In a March, 2016 interview, a Samarco employee stated readings from some automatic piezometers were also taken manually due to discrepancies with the automatic readings. It is not known which piezometers showed this discrepancy between manual and automatic readings. Maintenance was in progress on the automatic piezometers between November 2, 2015 and November 5, 2015. No automatic readings are available from this period.
All functioning piezometers, whether manual or automatic, were read on October 26, 2015. This is the most complete data set prior to failure. Some automatic readings from November 2, 2015 were recovered after the failure.
E2.2 Data Presentation
E2.2.1 General
The Samarco piezometer records have been reorganized and are presented in four attachments to this appendix. The attachments provide records for 47 Casagrande piezometers, 30 water level indicators, and 39 vibrating wire piezometers.
The attachments and assumptions or limitations are as follows:
Attachment E1 – Dike 1 Piezometer Plan:

Fundão Tailings Dam Review Panel
Report on the Immediate Causes of the Failure of the Fundão DamAppendix E - Samarco Field Monitoring Data
August 25, 2016 Page E-4
Instruments listed in the most recent Samarco instrumentation reports and vibrating wire piezometers are shown. Additional piezometers, as described in the sections below, are also included for reference.
Vibrating wire piezometers installed at the same location in plan are grouped in “clusters”.
In some instances, different types of instruments (water level indicators, Casagrande piezometers, and vibrating wire piezometers) are located next to each other such that one symbol type overlaps the other. Water level indicators (blue) are shown on top, Casagrande piezometers (green) are below, and vibrating wire piezometers (orange) are on the bottom.
Refer to Attachment E4 for a full list of piezometer names and types.
Attachment E2 – Sections:
Sections were taken along the same alignments as used in Samarco’s monthly instrumentation reports.
Piezometers not located along an instrumentation report section line are not included in this attachment. This includes the spillway, toe, and left abutment groups, as well as the vibrating wire piezometers.
Readings shown in the sections are the most recent reading for each instrument prior to failure on November 5, 2015. Instruments with no readings in October or November, 2015 are shown in grey.
Attachment E3 – Piezometer Records, Reservoir Level, and Rainfall Plots:
Data sources for each instrument are listed in Attachment E4.
The reservoir rate of rise was estimated using monthly topography surveys and aerial images as described in Appendix B.
Rainfall records were provided in a Samarco spreadsheet[47] and in the monthly instrumentation reports.
Vibrating wire piezometers installed at the same location in plan are grouped in “clusters” as shown in Attachments E1 and E4.
Attachment E4 – List of Piezometers and Water Level Indicators at Dike 1:
Lists instrument type, identifies automatic or manual readings, and gives period on record, installation dates, and data sources for all piezometers included in this appendix.
E2.2.2 16LI017
Water level indicator 16LI017, located on Section 02, has been labelled as “unreliable” in Attachments E2 through E4. Readings from this instrument are consistently 10 m to 13 m below those from neighboring piezometers 16PI014 and 16PI015, when it should give higher readings. Post-failure interviews and information provided by Samarco indicate that the top of hole elevation given

Fundão Tailings Dam Review Panel
Report on the Immediate Causes of the Failure of the Fundão DamAppendix E - Samarco Field Monitoring Data
August 25, 2016 Page E-5
for this piezometer was in error. An updated elevation was provided. However, the data from this piezometer was not used by the Panel.
E2.2.3 16PI026
Casagrande piezometer 16PI026, from the “spillway” group, has been labelled as “unreliable” in Attachments E3 and E4. The coordinates from the instrumentation report and the installation log[48] do not match. The plan view in the instrumentation report shows the piezometer on the El. 857 m bench and the report states that the top of pipe is El. 865 m. The installation log puts the piezometer on the El. 861 m bench and reports a ground elevation of 860.69 m and a top of pipe elevation of 861.75 m. The similarity between the elevation from the installation log and the topographic survey indicates that the piezometer is likely at this location, and it has been shown as such in this appendix.
However, the top of pipe elevation given in the instrumentation reports, used to calculate the piezometric level, is El. 865 m. This is much higher than the ground elevation at either location. The data from this piezometer is therefore considered unreliable and was not used by the Panel.
E2.2.4 16LI018
Water level indicator 16LI018, located on Section 02, appears in Samarco’s instrumentation plan[42]. This instrument is not shown in plan or section in the November, 2015 instrumentation report for the left abutment and does not have readings in this document or in the Instrument Measurement Spreadsheet (described in Section E2.3). This instrument is located beside the functioning Casagrande piezometer 16PI007. The lack of records from 16LI018 does not influence the Panel’s analysis. The instrument is circled below on Figure E 2-1.

Fundão Tailings Dam Review Panel
Report on the Immediate Causes of the Failure of the Fundão DamAppendix E - Samarco Field Monitoring Data
August 25, 2016 Page E-6
Figure E 2-1 Zoom of Samarco instrumentation plan showing 16LI018
E2.2.5 PA-017 and PA-018
Vibrating wire piezometer locations PA-017 and PA-018 each have two sets of records[44], as follows:
The first data set for both piezometers has records from February 8, 2011 to October 9, 2014. This data is saved on the tabs “PA-017” and “PA-018” of the Samarco spreadsheet.
The second data set for both piezometers has records from February 8, 2011 to July 5, 2012. This data is saved on the tabs “PA-017 (2)” and “PA-018 (2)” of the Samarco spreadsheet.
There is only one installation log available for each piezometer. Both data sets report common tip elevations for the same piezometers. The records for the overlapping period between data sets do not match. There is no consistent offset between the data sets. It is unclear why there are two sets of readings for these piezometers. Both data sets are included in Attachment E3 for reference.
E2.3 Instrument Measurement Spreadsheet
E2.3.1 General
Piezometer readings from 53 instruments at Dike 1 are included in a secondary Samarco file separate from the instrumentation reports. The Panel reviewed the data included in this file for completeness. Of the 53 instruments:

Fundão Tailings Dam Review Panel
Report on the Immediate Causes of the Failure of the Fundão DamAppendix E - Samarco Field Monitoring Data
August 25, 2016 Page E-7
46 instruments with the same name are reported in the instrumentation reports with a different period on record. See Section E2.3.2.
7 instruments are listed that are not included in the instrumentation reports. See Section E2.3.3.
E2.3.2 Overlapping Data
Records from 22 piezometers and 24 water level indicators included in the November, 2015 instrumentation reports are also included in the Instrument Measurement Spreadsheet. These instruments and their period on record from the Instrument Measurement Spreadsheet are listed in Table E 2-1.
Table E 2-1 Instruments with overlapping records
Name Period on Record from the Instrument Measurement Spreadsheet
(YYYY-MM-DD) Start End
16LI001 2013-06-11 2015-08-31 16LI002 2013-06-11 2015-08-31 16LI003 2013-06-11 2014-12-29 16LI004 2013-06-11 2015-09-28 16LI005 2013-06-11 2015-01-12 16LI006 2013-06-11 2015-01-12 16LI007 2013-06-11 2014-08-04 16LI008 2013-06-11 2015-01-12 16LI012 2014-08-21 2014-12-01 16LI014 2014-10-20 2015-07-22 16PI016 2014-11-20 2015-07-22 16PI019 2015-03-10 2015-08-31 16PI027 2015-03-18 2015-08-31 24LI017 2010-04-05 2015-08-31 24LI018 2015-05-06 2015-08-31 24LI019 2010-10-07 2015-05-18 24LI020 2010-05-06 2015-01-30 24LI021 2010-06-24 2015-09-16 24LI022 2010-06-24 2015-02-06 24LI023 2010-06-24 2015-02-06 24LI024 2010-04-21 2015-02-06 24LI025 2010-06-24 2012-02-06 24LI026 2010-04-23 2015-02-06 24LI027 2010-05-15 2015-01-12 24LI028 2015-05-28 2014-09-29 24LI029 2010-04-15 2013-09-09 24LI030 2010-04-17 2014-09-29 24PI039 2010-01-14 2015-09-10 24PI041 2010-01-14 2015-09-28 24PI044 2010-03-23 2015-05-11 24PI045 2010-03-19 2015-09-10

Fundão Tailings Dam Review Panel
Report on the Immediate Causes of the Failure of the Fundão DamAppendix E - Samarco Field Monitoring Data
August 25, 2016 Page E-8
Name Period on Record from the Instrument Measurement Spreadsheet
(YYYY-MM-DD) Start End
24PI046 2010-08-31 2015-09-16 24PI047 2010-08-31 2015-09-16 24PI048 2010-03-10 2015-02-03 24PI049 2010-08-12 2014-12-01 24PI050 2010-08-12 2014-12-01 24PI051 2010-03-05 2014-08-04 24PI052 2010-07-26 2014-11-13 24PI053 2010-07-26 2014-12-01 24PI054 2010-03-01 2014-11-24 24PI055 2010-07-15 2014-11-24 24PI056 2010-07-15 2014-12-01 24PI058 2010-07-07 2014-12-01 24PI059 2010-07-07 2014-12-01 24PI060 2010-03-30 2014-12-01 24PI062 2010-05-28 2012-12-01
The Panel plotted data from three of the overlapping data sets. The comparison plots are shown below. The general trend and number of data points for the overlapping period were the same. There was a constant vertical offset in the plots for two of the three locations (24LI017 and 16LI003) that is attributed to a different top of pipe elevation in the two data sources. The data from the Instrument Measurement Spreadsheet includes some errant points as seen in the plots for 24LI017 and 24LI020. The Panel therefore chose to use the data from the instrumentation reports. The remainder of the overlapping data from the Instrument Measurement Spreadsheet is not presented as part of this appendix.

Fundão Tailings Dam Review Panel
Report on the Immediate Causes of the Failure of the Fundão DamAppendix E - Samarco Field Monitoring Data
August 25, 2016 Page E-9
Figure E 2-2 Piezometer data comparison for 24LI017
Figure E 2-3 Piezometer data comparison for 24LI020
Tip Elevation of 24LI017, installed on 2010-04-05.
795
800
805
810
815
820
825
830
835
840
845
850
855
860
865
870
875
880
885
890
895
0
100
200
300
400
500
600
700
800
Piez
omet
ric Le
vel /
Res
ervo
ir El
evat
ion
(m)
Rain
fall
(mm
)
Rainfall Reservoir El. 24LI017 (Instrumentation Report) 24LI017 (Instrument Measurement Spreadsheet)
Tip Elevation of 24LI020, installed on 2010-04-05.
780
785
790
795
800
805
810
815
820
825
830
835
840
845
850
855
860
865
870
875
880
885
890
895
0
100
200
300
400
500
600
700
800
Piez
omet
ric Le
vel /
Res
ervo
ir El
evat
ion
(m)
Rain
fall
(mm
)
Rainfall Reservoir El. 24LI020 (Instrumentation Report) 24LI020 (Instrument Measurement Spreadsheet)
Fundão Tailings Dam Review Panel
Report on the Immediate Causes of the Failure of the Fundão DamAppendix E - Samarco Field Monitoring Data
August 25, 2016 Page E-10
Figure E 2-4 Piezometer data comparison for 16LI003
E2.3.3 Additional Piezometers and Water Level Indicators
Five additional piezometers and two additional water level indicators were included in the Instrument Measurement Spreadsheet. The readings from these instruments were not included in the November, 2015 instrumentation reports but some of the locations were shown in plan and section. The seven additional instruments are summarized in Table E 2-2. The data from these instruments, with the exception of 24LI039, is included in Attachment E3 and the locations are shown in Attachments E1 and E2. Data from 24LI039 was not included because its location and installation records were not available.
Table E 2-2 Summary of extraneous instruments from instrument measurement spreadsheet
Name Closest Section
Coordinate Source
Bottom of Hole
El. (m)
Included in plan from November 2015 Monthly
Instrumentation Report?
Included in section from November 2015 Monthly
Instrumentation Report?
Period on Record from Instrument Measurement
Spreadsheet (YYYY-MM-DD)
Start End
16LI009 02 2013
Instrumentation Plan[50]
827.9 No No 2013-06-11 2015-01-12
24LI039 Unknown - - - - 2011-03-24 2011-04-12
24PI042 FF 2012 OMS Manual[1] 810.7(1) Yes Yes 2010-01-14 2011-10-04
24PI043 JJ 2012 OMS Manual 781.3 Yes No 2009-02-09 2014-05-27
Tip Elevation of 16LI003, first reading on 2013-06-11.
780
785
790
795
800
805
810
815
820
825
830
835
840
845
850
855
860
865
870
875
880
885
890
895
0
100
200
300
400
500
600
700
800
Piez
omet
ric Le
vel /
Res
ervo
ir El
evat
ion
(m)
Rain
fall
(mm
)
Rainfall Reservoir El. 16LI003 (Instrumentation Report) 16LI003 (Instrument Measurement Spreadsheet)

Fundão Tailings Dam Review Panel
Report on the Immediate Causes of the Failure of the Fundão DamAppendix E - Samarco Field Monitoring Data
August 25, 2016 Page E-11
Name Closest Section
Coordinate Source
Bottom of Hole
El. (m)
Included in plan from November 2015 Monthly
Instrumentation Report?
Included in section from November 2015 Monthly
Instrumentation Report?
Period on Record from Instrument Measurement
Spreadsheet (YYYY-MM-DD)
Start End
24PI057 LL 2012 OMS Manual 797.5 Yes Yes 2010-03-26 2013-04-03
24PI061 JJ 2012 OMS Manual 793.5 Yes No 2010-06-14 2012-12-07
24PI063 JJ 2012 OMS Manual(2) 787.3 Yes No 2010-12-20 2014-10-27
1. Value from Instrument Measurement Spreadsheet. OMS Manual states bottom elevation 811.51 m. Value from Instrument Measurement Spreadsheet was used for plotting in Attachment E3.
2. Mislabeled in OMS Manual as 24PI062.
E3 FLOWS
Flow measurements were recorded at six locations near Dike 1. Locations are numbered 1 through 6 according to the numbering system used in Samarco’s weekly reports, as follows:
Location 1: Fundão Toe Drain Location 2: El. 826 m Drain Location 3: Grota da Vale Location 4: El. 855 m Drain Location 5: El. 860 m Drain Location 6: Borehole
Measurements were reported in Samarco’s monthly instrumentation reports and weekly reports. Details on each location are summarized in Attachment E5. The data from the weekly reports and October, 2015 instrumentation reports are provided for all six locations. Measurements from Locations 1 and 2 (El. 826 m Drain and Fundão Toe Drain) were also reported in MDGEO’s Hydrogeological Study on the 940 m Raise[7] and are included in Attachment E5. The locations are shown in plan on Figure E.E5-1.
E4 SURVEY MONUMENTS
E4.1 General
Data is available from twelve survey monuments located on the left abutment setback. These monuments are 2 m long pins pushed 0.7 m into the ground. In a June 2016 interview, a Samarco employee stated the elevation and coordinates of the pins were surveyed using conventional survey. The survey monuments were installed after the August, 2014 incident to monitor slope movements. The most recent OMS manual[1] was issued in 2012 before the survey monuments were installed. The manual does not have a reading frequency for this type of instrument. Section E4.2 describes the available data from the twelve survey monuments.

Fundão Tailings Dam Review Panel
Report on the Immediate Causes of the Failure of the Fundão DamAppendix E - Samarco Field Monitoring Data
August 25, 2016 Page E-12
Survey monuments were also installed in the Starter Dam and were read between November, 2008 and August, 2009. The Starter Dam instruments are described in Section E4.3 and the data is plotted in Attachment E6 for reference. The readings were not used by the Panel.
E4.2 Survey Monuments on the Setback
E4.2.1 December, 2014 to August, 2015 Records
Survey data for nine survey monuments located on the left abutment setback is available in Samarco’s October, 2015 instrumentation report for the left abutment. The monuments are numbered P01 through P09 and are located on three benches on the setback. Three additional survey monuments (P01A, P02A, and P03A) are located downstream of the first nine instruments and are documented separately from the instrumentation reports[51]. The period on record for these three survey monuments is much shorter. The two spreadsheets include coordinates (northing and easting) and elevations of the survey monuments for each survey date. They also include calculations of the horizontal and vertical displacement over time.
The displacement data is summarized in Table E 4-1. Markers with similar elevations were grouped in benches. Figure E 4-1 shows the locations of the survey monuments in plan and the total displacement for the period on record. Horizontal displacement vectors are shown for the initial to final reading.
Displacements on the setback are generally to the southwest, away from the left abutment. The direction of displacement follows the dip direction of the stripped ground as shown on Figure E 4-2. All monuments on the El. 885 m and El. 880 m benches saw vertical displacement (settlement) on August 3, 2015. The reason for this is unknown and does not appear to correspond to changes in topography.
There is a large gap in readings from December, 2014 to June, 2015 (see Attachment E6). This is more than 50% of the period on record. For all instruments the rate of movement during the gap is different than the rate of movement before and after the gap. The readings are therefore considered inconsistent and were not used by the Panel.

Fundão Tailings Dam Review Panel
Report on the Immediate Causes of the Failure of the Fundão DamAppendix E - Samarco Field Monitoring Data
August 25, 2016 Page E-13
Table E 4-1 Setback displacement marker summary
Bench El. Name Total Vertical Displacement
(mm)
Total Horizontal Displacement
(mm)
Beginning of Reading End of Reading Reason for End of
Reading
870 P01A 6 8 2014-12-01 2014-12-18
Setback infilling 870 P02A 10 13 2014-12-01 2014-12-18
870 P03A 16 14 2014-12-01 2014-12-18
875 P01 33 48 2014-12-01 2015-06-22 Bench raised from
875 m to 877 m 875 P02 56 58 2014-12-01 2015-06-22
875 P03 66 67 2014-12-01 2015-06-22
880 P04 30 57 2014-12-01 2015-08-22
Preparation for setback raise
880 P05 64 70 2014-12-01 2015-08-22
880 P06 90 78 2014-12-01 2015-08-22
885 P07 522 88 2014-12-01 2015-08-22
885 P08 118 81 2014-12-01 2015-08-22
885 P09 522 27 2014-12-01 2015-08-22
Figure E 4-1 Setback survey monument plan and total displacement

Fundão Tailings Dam Review Panel
Report on the Immediate Causes of the Failure of the Fundão DamAppendix E - Samarco Field Monitoring Data
August 25, 2016 Page E-14
Figure E 4-2 Setback survey monument plan and total displacement with stripped ground contours
E4.2.2 August, 2014 Records
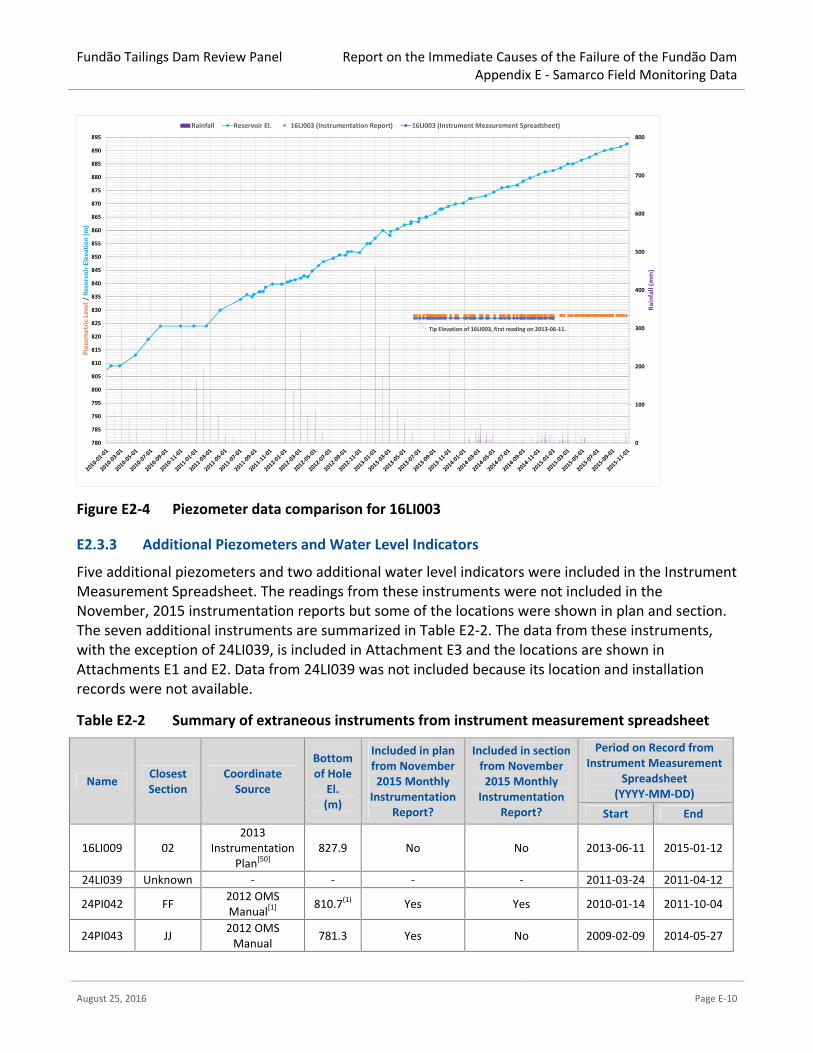
The Panel noted that the twelve survey monuments described in Section E4.2.1 were also monitored by Samarco from August 29, 2014 to September 1, 2014, during the period immediately after installation in response to the August, 2014 incident. This data was not included in the sources listed in the section above, but was included in Samarco’s report on the August, 2014 incident[52].
The location plan of the survey monuments from the incident report is shown on Figure E 4-3 and the displacement plots are shown on Figure E 4-4. These figures use a different naming convention for the survey monuments than the data sources in Section E4.2.1. The twelve survey monuments shown in the Samarco figures are believed to be the same as those described in Section E4.2.1 based on their locations in plan.
Figure E 4-3 is an exact replica of a Samarco drawing[52]. Their interpretation is that the direction of movement was towards the SE. This is different than the displacement seen in the December, 2014 to August, 2015 records, which is away from the left abutment and in the downslope direction of the stripped ground surface.
Fundão Tailings Dam Review Panel
Report on the Immediate Causes of the Failure of the Fundão DamAppendix E - Samarco Field Monitoring Data
August 25, 2016 Page E-15
Figure E 4-3 Location of survey monuments from Samarco’s August, 2014 incident report[52]

Fundão Tailings Dam Review Panel
Report on the Immediate Causes of the Failure of the Fundão DamAppendix E - Samarco Field Monitoring Data
August 25, 2016 Page E-16
Figure E 4-4 Displacement plots from Samarco’s August, 2014 incident report[52]
E4.3 Survey Monuments in the Starter Dam
Eleven survey monuments were installed in the Starter Dam and were monitored in 2008 and 2009. The records are included in a Samarco spreadsheet[53] and are summarized in the table below. The data was not used by the Panel but is plotted in Attachment E6 for reference. The displacement data is summarized in Table E 4-2. The survey monuments and total displacements over the period on record are shown on Figure E 4-5.

Fundão Tailings Dam Review Panel
Report on the Immediate Causes of the Failure of the Fundão DamAppendix E - Samarco Field Monitoring Data
August 25, 2016 Page E-17
Table E 4-2 Starter Dam displacement marker summary
Name Total Vertical Displacement
Total Horizontal Displacement Beginning of Reading End of Reading
MS09 12 116 2008-11-24 2009-08-17
MS11 -43 10 2008-11-24 2008-12-09
MS17 4 113 2008-11-24 2009-08-17
MS18 34 117 2008-11-24 2009-07-03
MS19 31 111 2008-11-24 2009-07-06
MS28 -5 109 2008-11-24 2009-08-17
MS29 41 103 2008-11-24 2009-07-16
MS30 -25 121 2008-11-24 2009-06-30
MS31 43 108 2009-11-24 2009-04-06
MS32 -10 20 2009-03-24 2009-08-11
MS33 22 112 2008-11-24 2009-08-17
Figure E 4-5 Starter Dam survey monument plan and total displacement

Fundão Tailings Dam Review Panel
Report on the Immediate Causes of the Failure of the Fundão DamAppendix E - Samarco Field Monitoring Data
August 25, 2016 Page E-18
E5 INCLINOMETERS
Inclinometer data at Fundão is limited. The records provided to the Panel include the following information:
Location of inclinometers installed around the Starter Dam[50]. Three inclinometers were installed in natural ground (24IN001, 24IN003, 24IN004) and one inclinometer was installed on the Starter Dam (24IN002). No readings are available.
Location and readings for two inclinometers on the downstream face of the Starter Dam. Two readings are available for March and April, 2009[54].
Location of six planned inclinometers at Dike 1 are shown in a 2012 drawing[55]. Four are shown in natural ground and two are on an upstream raise. No readings or installation logs are available.
Location of one inclinometer installed on the downstream face of Dike 1 in 2014 (16NI003). The Fugro installation log is available[56] but there are no readings. The elevation of this inclinometer is 820 m (on the Starter Dam).
Additional inclinometers installed by Fugro during 2014 were located in Germano. Installation logs are available.
Inclinometers that were installed in the Starter Dam were destroyed in the 2009 piping incident and during subsequent remediation measures. Samarco’s most recent OMS Manual (issued in 2012) does not list any inclinometers in Dike 1[1]. A Samarco employee stated that no inclinometers were installed at Fundão after the original Starter Dam instruments were destroyed in 2009.