Appendix E. Embankment Sample Report E...Appendix E. Embankment Sample Report PLEASE NOTE A sample...
17
12/10/2013 GEOTECHNICAL MANUAL Appendix E. Embankment Sample Report PLEASE NOTE A sample foundations report is included here for reference. It is provided as an example of content, format, and organization representative of a typical Foundation Investigation and Recommendation Report for an embankment. As site conditions vary widely, the investigation means and methods, and report content (including recommendations), may differ for other projects. Note that the selection and inclusion of this report as a sample does not imply that it is guaranteed to be free of errors. Please contact the Foundations Unit with any questions when interpreting a geotechnical report issued by this office or if you have any questions with respect to preparing geotechnical reports for MnDOT. The information presented here is intended for use as a resource by geotechnical engineering professionals. MnDOT makes no warranty as to the suitability of engineering reports in the style of this sample report, for other geotechnical needs, purposes, clients, or projects. NOTE: SPT boring logs, cross sections or CPT logs typically included at the end of the Foundation Investigation and Recommendation Report have been removed for this example.
Transcript of Appendix E. Embankment Sample Report E...Appendix E. Embankment Sample Report PLEASE NOTE A sample...

12/10/2013 GEOTECHNICAL MANUAL
Appendix E. Embankment Sample Report PLEASE NOTE A sample foundations report is included here for reference. It is provided as an example of content, format, and organization representative of a typical Foundation Investigation and Recommendation Report for an embankment. As site conditions vary widely, the investigation means and methods, and report content (including recommendations), may differ for other projects. Note that the selection and inclusion of this report as a sample does not imply that it is guaranteed to be free of errors. Please contact the Foundations Unit with any questions when interpreting a geotechnical report issued by this office or if you have any questions with respect to preparing geotechnical reports for MnDOT. The information presented here is intended for use as a resource by geotechnical engineering professionals. MnDOT makes no warranty as to the suitability of engineering reports in the style of this sample report, for other geotechnical needs, purposes, clients, or projects. NOTE: SPT boring logs, cross sections or CPT logs typically included at the end of the Foundation Investigation and Recommendation Report have been removed for this example.

Minnesota Department of Transportation Office of Materials & Road Research 1400 Gervais Avenue, Maplewood, MN 55109
MemoTO: Tom Highum, Project Manager
District 3, Baxter
FROM: Rich Lamb, Foundations Project Engineer Foundations Unit
Concur: Gary Person, Foundations Engineer Foundations Unit
DATE: June 10, 2010
SUBJECT: SP 0503-75 TH 23 Roadway Embankment Station 336+00 – 351+00 TH 23 WB Located near Foley Subsurface Investigation and Geotechnical Recommendations
Project Summary
This letter is in response to a request by the District to provide Foundation Recommendations for a segment of roadway embankment to be constructed just south of Foley on proposed westbound TH 23. The proposed embankment in this area passes through a low, swampy area and initial District auger borings revealed the presence of potentially deep organic deposits. This new embankment is part of the widening of TH 23 from two to four lanes from the junction of TH 95 to the junction of TH 25 in Foley.
Subsurface Investigation
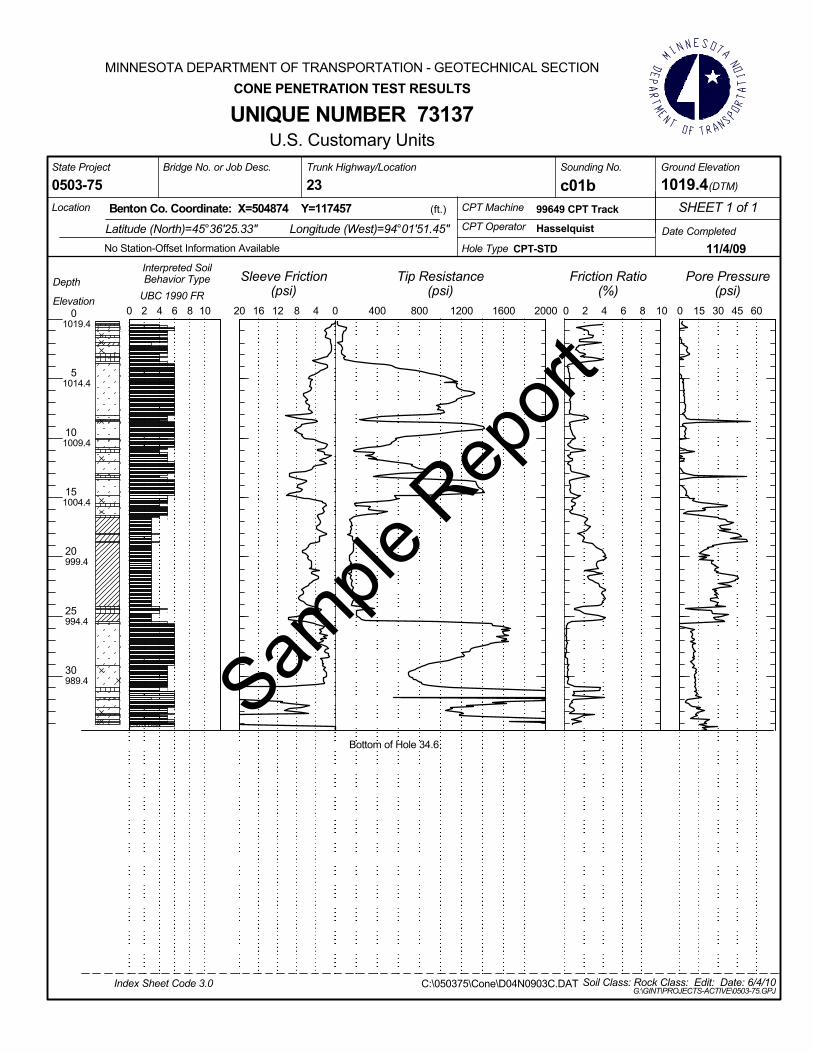
The Foundations Unit mobilized several times to the site with several types of equipment in an effort to determine the depth and lateral extent of the swamp deposits in the area. Eleven Standard Penetration Test (SPT) borings, forty-eight Cone Penetration Test (CPT) soundings and fourteen Flat Plate Dilatometer (DMT) soundings were taken from October 2009 to April 2010. In addition, two Resistivity Surveys were performed by our Geology Unit in the fall of 2009 to get an initial idea on the swamp deposit limits. A copy of the boring and sounding logs is included with this report.
The foundation soils at the site consist of layers and seams of sand with variable depth layers of organic material, silty clays and clayey soils. Organic material was found to depths of almost 40 ft. in some areas. Water was measured between elevations 1010-1015 during normal drilling operations. Please refer to the attached boring and sounding logs for a more complete description of the foundation soils.
Page 1 of 5
Sample
Rep
ort

SP 0503 75 TH 23 RoadwayFoundation Recommendations
June 10, 2010
Figure 1: Soil Profile
Lab Testing Results
Routine lab tests showed that the organic soils may be classified as organic and highly organic Silt Loam. This material has organic contents ranging from 10-20% and moisture contents of 80-130%. In addition to these simple tests, fourteen one dimensional consolidation tests were performed on representative samples of the organic and silty soils. These tests revealed that the organic material is highly compressible but will drain quickly as a result of numerous sand and silt seams found throughout.
Material e0 Cc Cr Cv (ft2/day)
horg Silt Loam
2.4 1.0 0.15 0.1 – 0.4
org Silt Clay 1.6 0.5 0.01 1
Table 1: Consolidation Test Results (averages)
Page 2 of 5
Sample
Rep
ort

SP 0503 75 TH 23 RoadwayFoundation Recommendations
June 10, 2010
Geotechnical Analysis
Our Geotechnical analysis for this project consisted of looking at the following:
Embankment Settlement, including both primary and secondary settlement and time rateof primary and secondary settlement
Global Stability
Embankment Settlement
Embankment settlement was computed assuming 9-12 ft. of fill, an embankment top width of 50 ft. and 1:4 side slopes. In addition, a unit weight of fill of 120 pcf was used in the analysis. Based on these assumptions and utilizing the results from the consolidation tests, we estimate that the organic and silty clayey soils will experience 1-2 ft. of primary settlement and as much as 1-4 in. of secondary consolidation long after the project is completed. Our estimate for time rate of settlement for primary consolidation is 2-6 months whereas the secondary compression may occur over a period of several decades.
Surcharge Option
In an effort to decrease the primary consolidation period, a soil surcharge was considered to be added to the proposed embankment. As an initial design, a 5 ft. surcharge was selected and analyzed for primary and secondary settlement. As expected, the additional fill material will reduce the waiting period for the target settlement and also take out most of the long term settlement.
Partial Excavation Option
In addition to a soil surcharge, we considered digging out some of the organic material to reduce the overall settlement of the new embankment. Initially, a complete dig option was considered for this project, whereby all of the organic soils would be completely removed and replaced with granular material. However, this option was considered very costly, as it would require deep sheet piling and extensive dewatering efforts. As a compromise, we are recommending removing the top 8-10 ft. of material to reduce the overall settlements of the embankments.
Assuming a partial excavation as mentioned above, revised settlement calculations were then performed. The results are shown on the following table.
Page 3 of 5
Sample
Rep
ort

SP 0503 75 TH 23 RoadwayFoundation Recommendations
June 10, 2010
Station
FillHt.(ft.)
computedprimarysettlement
Estimatedrange ofPrimarySettlement
Time forPrimarySettlement
Time forPrimarySettlementwith 5'Surcharge
SecondarySettlement
Time forSecondarySettlement Assumptions
337+00 10 8.1 in. 6 8 in. 30 days 10 days 1 in. 50 years no digging
339+00 12 25.5 in. 18 24 in. 60 days 30 days 2 4 in. 50 years no digging
20 in. 16 20 in. dig 10 ft.
344+00 10 25.8 in. 18 24 in. 80 days 30 days 2 4 in. 50 years no digging
20 in. 16 20 in. dig 10 ft.
348+00 9 5.8 in. 4 6 in. 180 days 60 days 0.5 in. 50 years dig 3.5 ft.Table 2: Revised Settlement Estimates with Excavation/Surcharge Option
Slope Stability Analysis
A preliminary slope stability analysis was also performed to see if an embankment could be constructed over the poor foundation soils without any ground improvement. The results showed that the slopes would be marginally stable if loaded quickly. However, the foundation soils will drain and gain strength if they are loaded slowly enough and provide for stable embankment. As evidence of this, the existing embankment has been stable for decades after being constructed over the same materials.
Geotechnical Recommendations
Based on review of the existing conditions and proposed construction, we recommend the following:
1. The upper 7-10 ft. of material below the existing ground below proposed TH 23 WB should be excavated down to elevation 1010. This excavation applies from Stations 335+50 to 351+00.
2. Place a geosynthetic separator (3733 Type V) at the bottom of the excavation as shown on the attached typical section.
3. Place and compact alternating layers of Select Granular Borrow (3149.2B2) and geosynthetic reinforcement (3733 Type V1) for three layers as shown on the attached
Page 4 of 5
Sample
Rep
ort

SP 0503 75 TH 23 RoadwayFoundation Recommendations
June 10, 2010
Page 5 of 5
otechnical Instrumentation including piezometers and settlement gages as
fill in 2 ft. lifts for remaining fill height. In between lifts, observe a
rade in similar fashion (2
period of 3-6 months before removing surcharge
fforts may be required to successfully excavate to the
ttachments: ng Plan
ection
Plan and Location Details
s
c: G. Engstrom
olnau
typical section. The Select Granular Borrow should be compacted to 95% of Standard Proctor. The Type VI geosynthetic reinforcement should have a minimum long term design strength of 350 lbs./ft.
4. Place 2 ft. of Granular Borrow (3149.2B1) and compact to 95% of Standard Proctor.5. Install Ge
shown on the attached typical section. Please note that piezometers and settlement gage system should be installed at five cross sections as shown on the attached instrumentation plan.
6. Place Granular Borrowminimum waiting period of 1 week to allow underlying cohesive soils to drain and gain strength. Actual settlement waiting period between lifts should be determined by Engineer based on results of Geotechnical Instrumentation.
7. Place additional 5 ft. surcharge fill above top of final pavement gft. lifts and waiting periods).
8. Monitor embankment settlement over afill and paving roadway.
9. Please note that some dewatering erequired depths and place the specified geosynthetic materials.
ABoring/SoundiGeotechnical Typical SGeotechnical Cross Sections Geotechnical Instrumentation SPT Boring Logs CPT Sounding LogDMT Sounding Logs
c T. Kempenich C. DeMenge A. Pitan, K. M
Sample
Rep
ort

Sample
Rep
ort

SP 0503-75 TH 23Geotechnical Instrumenation Plan
Installation Location Gage ID Gage Type Gage ElvevationsP01 338+00 WB CL P01a VW Piezo 1008
P01b VW Piezo 1003P01c VW Piezo 984
P02 338+00 WB 25 ft. Rt. P02a VW Piezo 1008P02b VW Piezo 1003P02c VW Piezo 984
P03 339+00 WB CL P03a VW Piezo 1003P03b VW Piezo 991P03c VW Piezo 981
P04 339+00 WB 20 ft. Lt. P04a VW Piezo 1003P04b VW Piezo 991P04c VW Piezo 981
P05 342+00 WB CL p05a VW Piezo 1005P05b VW Piezo 993
P06 342+00 WB 25 ft. Rt. P06a VW Piezo 1005p06b VW Piezo 993P06c VW Piezo 985
P07 344+00 WB CL P07a VW Piezo 1008P07b VW Piezo 997P07c VW Piezo 990
P08 344+00 WB 25 ft. Rt. P08a VW Piezo 1008P08b VW Piezo 997P08c VW Piezo 990
P09 344+00 WB 20 ft. Lt. P09a VW Piezo 1008P09b VW Piezo 997P09c VW Piezo 988
P10 348+00 WB CL P10a VW Piezo 1005P10b VW Piezo 990P10c VW Piezo 984
P11 348+00 WB 20 ft. Lt. P11a VW Piezo 1003p11b VW Piezo 983
S01338+00 WB 70
ft. Lt. - 30 ft. Rt. S01 Horz. Inclin. 1015
S02339+00 WB 70
ft. Lt. - 30 ft. Rt. S02 Horz. Inclin. 1015
S03342+00 WB 70
ft. Lt. - 30 ft. Rt. S03 Horz. Inclin. 1015
S04344+00 WB 70
ft. Lt. - 30 ft. Rt. S04 Horz. Inclin. 1015
S05348+00 WB 70
ft. Lt. - 30 ft. Rt. S05 Horz. Inclin. 1015
Sample
Rep
ort

Installation Location Gage ID Gage Type Gage ElvevationsP01 338+00 WB CL P01a VW Piezo 1008
P01b VW Piezo 1003P01c VW Piezo 984
P02 338+00 WB 25 ft. Rt. P02a VW Piezo 1008P02b VW Piezo 1003P02c VW Piezo 984
P03 339+00 WB CL P03a VW Piezo 1003P03b VW Piezo 991P03c VW Piezo 981
P04 339+00 WB 20 ft. Lt. P04a VW Piezo 1003P04b VW Piezo 991P04c VW Piezo 981
P05 342+00 WB CL p05a VW Piezo 1005P05b VW Piezo 993
P06 342+00 WB 25 ft. Rt. P06a VW Piezo 1005p06b VW Piezo 993P06c VW Piezo 985
P07 344+00 WB CL P07a VW Piezo 1008P07b VW Piezo 997P07c VW Piezo 990
P08 344+00 WB 25 ft. Rt. P08a VW Piezo 1008P08b VW Piezo 997P08c VW Piezo 990
P09 344+00 WB 20 ft. Lt. P09a VW Piezo 1008P09b VW Piezo 997P09c VW Piezo 988
P10 348+00 WB CL P10a VW Piezo 1005P10b VW Piezo 990P10c VW Piezo 984
P11 348+00 WB 20 ft. Lt. P11a VW Piezo 1003p11b VW Piezo 983
S01338+00 WB
40 ft. Lt. - 30 ft. Rt. S01 Horz. Inclin. 1015
S02339+00 WB
40 ft. Lt. - 30 ft. Rt. S02 Horz. Inclin. 1015
S03342+00 WB
40 ft. Lt. - 30 ft. Rt. S03 Horz. Inclin. 1015
S04344+00 WB
40 ft. Lt. - 30 ft. Rt. S04 Horz. Inclin. 1015
S05348+00 WB
40 ft. Lt. - 30 ft. Rt. S05 Horz. Inclin. 1015Sam
ple R
eport

Sample
Rep
ort

Sample
Rep
ort

Vane Shear Test Washed Sample (Collected during plug drilling)
Minnesota Department of Transportation Geotechnical Section
Boring Log Descriptive Terminology (English Units)
USER NOTES, ABBREVIATIONS AND DEFINITIONS - Additional information available in Geotechnical Manual. This boring was made by ordinary and conventional methods and with care deemed adequate for the Department's design purposes. Since this boring was not taken to gather information relating to the construction of the project, the data noted in the field and recorded may not necessarily be the same as that which a contractor would desire. While the Department believes that the information as to the conditions and materials reported is accurate, it does not warrant that the information is necessarily complete. This information has been edited or abridged and may not reveal all the information which might be useful or of interest to the contractor. Consequently, the Department will make available at its offices, the field logs relating to this boring. Since subsurface conditions outside each borehole are unknown, and soil, rock and water conditions cannot be relied upon to be consistent or uniform, no warrant is made that conditions adjacent to this boring will necessarily be the same as or similar to those shown on this log. Furthermore, the Department will not be responsible for any interpretations, assumptions, projections or interpolations made by contractors, or other users of this log. Water levels recorded on this log should be used with discretion since the use of drilling fluids in borings may seriously distort the true field conditions. Also, water levels in cohesive soils often take extended periods of time to reach equilibrium and thus reflect their true field level. Water levels can be expected to vary both seasonally and yearly. The absence of notations on this log regarding water does not necessarily mean that this boring was dry or that the contractor will not encounter subsurface water during the course of construction. WATER MEASUREMENT
Augered Plug Drilled Split Tube Sample (SPT N60 2 in. spilt tube with liners) Thin Wall Sample (3 in. Shelby Tube) Core Drilled (NV Core Barrel unless otherwise noted) Continuous Soil Sample Augered & Jetted Jetted Augered & Plug Drilled
WS
PD
CS
A/J Jet A/P
AB ........................ After Bailing AC ........................ After Completion AF......................... After Flushing w/C ....................... with Casing
Index Sheet No. 3.0 March 2003 G:\geotech\Public\Forms\INDEX30.doc
w/M ...................... with Mud WSD ..................... While Sampling/Drilling w/AUG.................. with Hollow Stem Auger MISCELLANEOUS NA ........................ Not Applicable w/ ......................... with w/o ....................... with out sat ........................ saturated DRILLING OPERATIONS AUG ................. Augered CD .................... Core Drilled DBD.................. Disturbed by Drilling DBJ .................. Disturbed by Jetting PD .................... Plug Drilled ST..................... Split Tube (SPT test) TW.................... Thinwall (Shelby Tube) WS.................... Wash Sample NSR.................. No Sample Retrieved
WH ................... Weight of Hammer WR ................... Weight of Rod Mud.................. Drilling Fluids in Sample CS .................... Continuous Sample SOIL/CORE TESTS SPT N60 ............ ASTM D1586 Modified Blows per foot with 140 lb. hammer and a standard energy of 210 ft-lbs. This energy represents 60% of the potential energy of the system and is the average energy provided by a Rope & Cathead system. MC.................... Moisture Content COH ................. Cohesion γ ....................... Sample Density LL..................... Liquid Limit PI...................... Plasticity Index Φ ...................... Phi Angle REC.................. Percent Core Recovered RQD ................. Rock Quality Description (Percent of total core interval consisting of unbroken pieces 4 inches or longer) ACL .................. Average Core Length (Average length of core that is greater than 4 inches long) Core Breaks .... Number of natural core breaks per 2-foot interval. DISCONTINUITY SPACING Fractures Distance Bedding Very Close........ <2 inches ............Very Thin Close ................ 2-12 inches .........Thin Mod. Close ....... 12-36 inches .......Medium Wide................. >36 inches ..........Thick DRILLING SYMBOLS
RELATIVE DENSITY Compactness - Granular Soils BPF
very loose....................................0-4 loose ...........................................5-10 medium dense ............................11-24 dense ..........................................25-50 very dense...................................>50
Consistency - Cohesive Soils BPF
very soft.......................................0-1 soft ..............................................2-4 firm ..............................................5-8 stiff ..............................................9-15 very stiff.......................................16-30 hard.............................................31-60 very hard .....................................> 60
COLOR blk .................. Black wht ...........White grn ................. Green brn............Brown orng ............... Orange yel.............Yellow dk ................... Dark lt ...............Light IOS ................. Iron Oxide Stained GRAIN SIZE /PLASTICITY VF............. Very Fine pl ............Plastic F ............... Fine slpl .........Slightly Cr ............. Coarse Plastic SOIL/ROCK TERMS C............... Clay Lmst .......Limestone L ............... Loam Sst ..........Sandstone S............... Sand Dolo........Dolostone Si.............. Silt wx...........weathered G .............. Gravel (No. 10 Sieve to 3 inches) Bldr .......... Boulder (over 3 inches) T ............... till (unsorted, nonstratified glacial deposits) Mn/DOT Triangular Textural Soil Classification System
100%
100%
C
90807060 50 40 302010
90
80
70
60
50
40
30
20
10
(plastic)
(slightly plastic)
SC
SCL CL
L SL SiL
Si
SiCL
LSS Si
90
80
70
60
50
40
30
20
10
100 %
% Sand % Clay
% Silt
Sample
Rep
ort

3.01015.9
5.01013.9
10.01008.912.5
1006.4
25.0993.927.5991.430.0988.9
154
37.5981.4
slightly organic plastic Loam, brown and very moist
42.5976.4
52.0966.9
3
W/H
4
W/H
W/H
2
35.0983.9
34
42
33
45organic plastic Loam with roots, black and moist
Loamy Fine Sand, light gray and saturated
Fine Sand with a few thin seams of slightly plastic Fine SandLoam, light gray and wet
Sand with traces osf organic Loamy Fine Sand, grays andsaturated
organic plastic Silt Loam, gray and wet
Loamy Sand with some wood, gray and saturated
Sand, gray-brown and saturated
highly organic plastic Silt Loam with a few roots and shellfragments, thin seams of Sand at 16.0'; grays and wet
highly organic slightly plastic Silt Loam, gray-brown and moist
slightly organic Clay Loam with some roots, grays and moist
3
26
W/H
W/H
9
W/H
W/H
W/R
4
17
Soi
l
30
18
12
U.S. Customary UnitsUNIQUE NUMBER 73484
Formation
60N (pcf)
(ft)
Silty Clay Loam with traces if Silt, grays and moist
(%)
5
10
15
20
25
30
35
40
45
50
55
(%)
SPT
Elev.
Or Remarks
Breaks
Soil Class:DSB Rock Class: Edit: Date: 6/4/10
COHDepth
(Continued Next Page)
70
(psf)
DE
PTH
Roc
k
C:\PROJECTS\TH23\0503-75\MASTER0503-75.GPJIndex Sheet Code 3.0
CoreRQD
MC
Dril
ling
Ope
ratio
n
ACLREC
MINNESOTA DEPARTMENT OF TRANSPORTATION - GEOTECHNICAL SECTIONLABORATORY LOG & TEST RESULTS - SUBSURFACE EXPLORATION
Other Tests
ClassificationLith
olog
y
49
(ft.)
26
38
Trunk Highway/Location
1018.9
57
(%)
94
Boring No.
MN Trunk Highway 23 (DTM)
29
Ground Elevation
T03
24
28
Bridge No. or Job Desc.State Project
29
25
0503-75
No Station-Offset Information Available
Longitude (West)=94°01'56.91"
20
SHEET 1 of 2Benton Co. Coordinate: X=504485 Y=116789
Latitude (North)=45°36'18.74"
Drill Machine 207184 CME 850 Track
or Member
122
Hammer
Location
165
CME Automatic CalibratedDrilling 3/8/10
89
Completed
%org-7.1
high Silt content
%org-5.4
%org-6.6
%org-10.7
%org-23.1
%org-10.8
%org-21.5
%org-3.0
%org-4.3
%org-2.9
%org-9.6
%org-15.2
Sample
Rep
ort

Minnesota Department of Transportation Geotechnical Section
Cone Penetration Test Index Sheet 1.0 (CPT 1.0)
USER NOTES, ABBREVIATIONS AND DEFINITIONS This Index sheet accompanies Cone Penetration Test Data. Please refer to the Boring Log Descriptive Terminology Sheet for information relevant to conventional boring logs. This Cone Penetration Test (CPT) Sounding follows ASTM D 5778 and was made by ordinary and conventional methods and with care deemed adequate for the Department's design purposes. Since this sounding was not taken to gather information relating to the construction of the project, the data noted in the field and recorded may not necessarily be the same as that which a contractor would desire. While the Department believes that the information as to the conditions and materials reported is accurate, it does not warrant that the information is necessarily complete. This information has been edited or abridged and may not reveal all the information which might be useful or of interest to the contractor. Consequently, the Department will make available at its offices, the field logs relating to this sounding. Since subsurface conditions outside each CPT Sounding are unknown, and soil, rock and water conditions cannot be relied upon to be consistent or uniform, no warrant is made that conditions adjacent to this sounding will necessarily be the same as or similar to those shown on this log. Furthermore, the Department will not be responsible for any interpretations, assumptions, projections or interpolations made by contractors, or other users of this log. Water pressure measurements and subsequent interpreted water levels shown on this log should be used with discretion since they represent dynamic conditions. Dynamic Pore water pressure measurements may deviate substantially from hydrostatic conditions, especially in cohesive soils. In cohesive soils, water pressures often take extended periods of time to reach equilibrium and thus reflect their true field level. Water levels can be expected to vary both seasonally and yearly. The absence of notations on this log regarding water does not necessarily mean that this boring was dry or that the contractor will not encounter subsurface water during the course of construction. CPT Terminology CPT .............Cone Penetration Test CPTU...........Cone Penetration Test with Pore Pressure measurements SCPTU.........Cone Penetration Test with Pore Pressure and Seismic measurements Piezocone...Common name for CPTU test (Note: This test is not related to the Dynamic Cone Penetrometer DCP) qT TIP RESISTANCE The resistance at the cone corrected for water pressure. Data is from cone with 60 degree apex angle and a 10 cm2 end area. fs SLEEVE FRICTION RESISTANCE The resistance along the sleeve of the penetrometer. FR Friction Ratio
Ratio of sleeve friction over corrected tip resistance. FR = fs/qt Vs Shear Wave Velocity A measure of the speed at which a siesmic wave travels through soil/rock. PORE WATER MEASUREMENTS Pore water measurements reported on CPT Log are representative of water pressures measured at the U2 location, just behind the cone tip, prior to the sleeve, as shown in the figure below. These measurements are considered to be dynamic water pressures due to the local disturbance caused by the cone tip. Dynamic water pressure decay and Static water pressure measurements are reported on a Pore Water Pressure Dissipation Graph.
SBT SOIL BEHAVIOR TYPE Soil Classification methods for the Cone Penetration Test are based on correlation charts developed from observations of CPT data and conventional borings. Please note that these classification charts are meant to provide a guide to Soil Behavior Type and should not be used to infer a soil classification based on grain size distribution. The numbers corresponding to different regions on the charts represent the following soil behavior types: 1. Sensitive, Fine Grained 2. Organic Soils - Peats 3. Clays - Clay to Silty Clay 4. Silt Mixtures - Clayey Silt to Silty Clay 5. Sand Mixtures - Silty Sand to Sandy Silt 6. Sands - Clean Sand to Silty Sand 7. Gravelly Sand to Sand 8. Very Stiff Sand to Clayey Sand 9. Very Stiff, Fine Grained Note that engineering judgment, and comparison with conventional borings is especially important in the proper interpretation of CPT data in certain geo-materials. The following charts are used to provide a Soil Behavior Type for the CPT Data. Robertson CPT 1990 Soil Behavior type based on friction ratio
Robertson CPTU 1990 Soil Behavior type based on pore pressure
U2
where ... .......................... normalized cone resistance QT
.......................... pore pressure ratio BBq
........................... Normalized friction ratio Fr
........................ overburden pressure σvo
σ’vo ....................... effective over burden pressure u .......................... measured pore pressure 2
.......................... equilibrium pore pressure u0 G:\GEOTECH\PUBLIC\FORMS\CPTINDEX.DOC January 30, 2002
Sample
Rep
ort
End of Data
Bottom of Hole 34.6
UNIQUE NUMBER 73137
0
5
10
15
20
25
30
CONE PENETRATION TEST RESULTS
Soil Class: Rock Class: Edit: Date: 6/4/10
MINNESOTA DEPARTMENT OF TRANSPORTATION - GEOTECHNICAL SECTION
Benton Co. Coordinate: X=504874 Y=117457
Index Sheet Code 3.0
Date CompletedHole Type
CPT Operator
0 15 30 45 600 2 4 6 8 10
C:\050375\Cone\D04N0903C.DAT
400 800 1200 1600 2000 0 2 4 6 8 10
U.S. Customary Units
1019.4
1014.4
1009.4
1004.4
999.4
994.4
989.4
G:\GINT\PROJECTS-ACTIVE\0503-75.GPJ
(ft.)
20 16 12 8 4 0
Longitude (West)=94°01'51.45"
c01bGround Elevation
Elevation
Sounding No.
Pore Pressure(psi)UBC 1990 FR
Tip Resistance(psi)
Bridge No. or Job Desc.State Project
Depth
11/4/09Latitude (North)=45°36'25.33"
99649 CPT Track
CPT-STD
SHEET 1 of 1Hasselquist
Trunk Highway/Location
No Station-Offset Information Available
CPT MachineLocation
1019.4
Sleeve Friction(psi)
Interpreted SoilBehavior Type Friction Ratio
(%)
0503-75 23 (DTM)
Sample
Rep
ort

Minnesota Department of Transportation Geotechnical Section
Flat Plate Dilatometer Test (DMT) Index Sheet
USER NOTES, ABBREVIATIONS AND DEFINITIONS
This Index sheet accompanies Flat Plate Dilatometer (DMT) data. This DMT Sounding follows ASTM Standard Test Method D6635-01 and was made by ordinary and conventional methods and with care deemed adequate for the Department's design purposes. Since this DMT sounding was not taken to gather information relating to the construction of the project, the data noted in the field and recorded may not necessarily be the same as that which a contractor would desire. While the Department believes that the information as to the conditions and materials reported is accurate, it does not warrant that the information is necessarily complete. This information has been edited or abridged and may not reveal all the information which might be useful or of interest to the contractor. Consequently, the Department will make available at its offices, the field logs relating to this sounding. Since subsurface conditions outside each DMT Push are unknown, and soil, rock and water conditions cannot be relied upon to be consistent or uniform, no warrant is made that conditions adjacent to this DMT push will necessarily be the same as or similar to those shown on this log. Furthermore, the Department will not be responsible for any interpretations, assumptions, projections or interpolations made by contractors, or other users of this log. Water pressure measurements and subsequent interpreted water levels shown on this log should be used with discretion since they represent dynamic conditions. Dynamic Pore water pressure measurements may deviate substantially from hydrostatic conditions, especially in cohesive soils. In cohesive soils, water pressures often take extended periods of time to reach equilibrium and thus reflect their true field level. Water levels can be expected to vary both seasonally and yearly. The absence of notations on this log regarding water does not necessarily mean that this boring was dry or that the contractor will not encounter subsurface water during the course of construction. DMT Terminology DMT…………………DilatoMeTer Test, original Italian name for Flate Plate Dilatometer Test A-Pressure (po)……gas pressure against the inside of the membrane when center of membrane has lifted above its support and moved horizontally 0.05 (+0.02,-0.00) mm into the soil surrounding the vertical blade. B-Pressure (p1)…….gas pressure against the inside of the membrane when the center of the membrane has lifted above its support and moved horizontally 1.10 ±0.03 mm into the soil surrounding the vertical blade. C-Pressure (p2)………Gas pressure against the inside of the membrane obtained by slowly deflating the membrane (after A and B pressure readings) until contact is reestablished (membrane is flushed with the side of the blade).
Test Equipment The flat dilatometer blade is made from stainless steel and includes an expandable steel membrane that is mounted flush on the face. Expansion of the membrane is measured with a three position electric switch. The blade is approximately 235 mm long and 95 mm wide and has a thickness of 15 mm. The steel membrane is 60 mm in diameter. Test Procedure The test consists of pushing a flat blade attached to the end of push rods into the soil to a desired test depth. Once the test depth is reached, the operator uses gas pressure (nitrogen) to inflate a bladder within the blade that pushes out a steel membrane horizontally into the soil. The operator increases the gas pressure and records two readings (A-pressure and B-pressure). The operator then deflates the membrane and records a third pressure (C-Pressure). The blade is then pushed to the next test depth. Material Index IDSoil Classification methods for the DMT are based on correlation charts developed from observations of DMT data and conventional borings. The soil type is presented as a Material Index (ID). Please note that these classification charts are meant to provide a guide to Material Type and should not be used to infer a soil classification based on grain size distribution. The following table shows the different Material Index for different soil types (from Marchetti 1980): Soil Type Material Index Peat/Sensitive Clay <0.10 Clay 0.10-0.35 Silty Clay 0.35-0.60 Clayey Silt 0.60-0.90 Clayey Silt 0.90-1.20 Silt 1.20-1.80
Silty Sand 1.80-3.30 Sand >3.30 Note that engineering judgment, and comparison with conventional borings is especially important in the proper interpretation of DMT data in certain geo-materials. Interpretation of Data Many engineering soil parameters can be obtained from the DMT through various correlations. The reliability of these parameters is only as good as the size of the data base used to develop them and the correlations with local site geology. The following are some of the more common parameters derived from the DMT. Dilatometer stress index KD
Membrane Dimensionless dilatometer horizontal stress index, KD=(po-uo)/σ’v. Coefficient of lateral earth pressure Ko Ratio of the in-situ horizontal effective stress at the depth of the center of the blade membrane to the computed effective stress at the same point. This value is only approximate because it assumes an undisturbed condition, which is not possible with the insertion of the blade.
Drained Friction Angle, φ’ The penetration of the DMT blade in sands represents a drained bearing capacity failure approximating a plain strain condition. Drained Constrained Modulus, M Constrained modulus of soil compressibility. Also referred to as the tangent modulus, as found from the vertical effective stress versus vertical strain curve obtained in a 1-dimensional oedometer laboratory test. Undrained Shear Strength, SuUndrained shear strength of cohesive soils, based on correlations versus unconfined compression and field vane tests. Dilatometer Modulus, EDModulus based on linear elastic theory Preconsolidation Pressure, p’cThe vertical effective stress in one-dimensional compression at which the soil structure changes relatively abruptly and becomes more compressible than at lower pressures. Overconsolidation Ratio, OCR Ratio of preconsolidation pressure versus existing effective vertical pressure.
Sample
Rep
ort

2 4 6 8 10
Depth
Ground ElevationBridge No. or Job Desc.State Project
Elevation
MATERIAL INDEX
(ft.)
(from Plan)0503-75DMT Push No.
1017.8D01
8 16 24 32 40.5 1 5 10Id
.1
No Station-Offset Information Available
100 200 300 400 500
Trunk Highway/Location
Dilatometer Modulus(tsf)
Horizontal StressIndex
Po P1
PRESSURE READINGS(tsf)
Kd
CLAY SILT SAND
Ed
MINNESOTA DEPARTMENT OF TRANSPORTATION - GEOTECHNICAL SECTION
Soil Class: Rock Class: Edit: Date: 6/4/10
0
5
10
15
20
25
30
35
40
45
0
5
10
15
20
25
30
35
40
45
0
5
10
15
20
25
30
35
40
45
23
UNIQUE NUMBER 73557DILATOMETER (DMT) TEST RESULTS
Remarks
U.S. Customary Units
0
5
10
15
20
25
30
35
40
45
1017.8
1012.8
1007.8
1002.8
997.8
992.8
987.8
982.8
977.8
972.8
G:\GINT\PROJECTS-ACTIVE\0503-75.GPJ
Latitude (North)=45°36'19.47"
Index Sheet Code 3.0
Location CPT Machine 209332 GeoProbe SHEET 1 of 1
Longitude (West)=94°01'56.57"DMT 4/6/10
HasselquistDMT Operator
Hole TypeDate Completed
Benton Co. Coordinate: X=504510 Y=116864
Sample
Rep
ort