APPENDIX D WATER TREATMENT COST BASIS AND ESTIMATE€¦ ·...
44
I:\07\80007\0400\Chinoccp-24Aug07\Flypgs_Chinoccp-28Aug07.Doc Golder Associates APPENDIX D WATER TREATMENT COST BASIS AND ESTIMATE
Transcript of APPENDIX D WATER TREATMENT COST BASIS AND ESTIMATE€¦ ·...

I:\07\80007\0400\Chinoccp-24Aug07\Flypgs_Chinoccp-28Aug07.Doc Golder Associates
APPENDIX D
WATER TREATMENT COST BASIS AND ESTIMATE

OFFICES ACROSS AFRICA, ASIA, AUSTRALIA, EUROPE, NORTH AMERICA AND SOUTH AMERICA
CHINO CLOSURE/CLOSEOUT PLAN 2007 UPDATE
BASIS OF COST ESTIMATE FOR WATER TREATMENT WITH COMMINGLING
August 2007 073-80007

August 2007 -i- 073-80007
I:\07\80007\0400\ChinoCCP-24Aug07\AppD-WtrTrtmtCost\AppD-WtrTrtmtCostBasis.doc Golder Associates
i
TABLE OF CONTENTS
1.0 INTRODUCTION.............................................................................................................. 1
2.0 QUANTITY AND QUALITY OF WATER TO BE TREATED.................................... 3 2.1 North Mining Area (NMA) Sources ...................................................................................... 3 2.2 South Mining Area (SMA) Sources....................................................................................... 3
3.0 BASIS FOR COST ESTIMATE–NMA LIME/HDS TREATMENT ............................. 5 3.1 Capital Cost Estimate............................................................................................................. 5 3.2 Basis for NMA Operations and Maintenance Costs .............................................................. 6 3.3 NMA Lime/HDS Treatment Estimated Life Cycle O&M Cost............................................. 8
4.0 BASIS FOR COST ESTIMATE–EVAPORATIVE TREATMENT SYSTEM ............. 9 4.1 Capital Cost Estimate............................................................................................................. 9 4.2 Basis for Evaporative Treatment System Operations & Maintenance (O&M) Costs............ 9 4.3 Evaporative Treatment System Estimated Life Cycle O&M Costs....................................... 9
5.0 BASIS FOR COST ESTIMATE–LAKE ONE LIME/HDS TREATMENT ................ 10 5.1 Capital Cost Estimate........................................................................................................... 10 5.2 Basis for Lake One Operations and Maintenance (O&M) Costs......................................... 11 5.3 Lake One Lime/HDS Treatment Estimated Life Cycle O&M Cost .................................... 12
6.0 BASIS FOR COST ESTIMATE–COMMINGLING EQUIPMENT ............................ 13 6.1 Capital Cost Estimate........................................................................................................... 13 6.2 Basis for Commingling Operations and Maintenance (O&M) Costs .................................. 14 6.3 Commingling Equipment Estimated Life Cycle O&M Cost ............................................... 14
7.0 BASIS FOR COST ESTIMATE–WATER COLLECTION AND CONVEYANCE ..15 7.1 Capital Cost Estimate........................................................................................................... 15 7.2 Basis for Collection and Conveyance Operations and Maintenance (O&M) Costs ............ 15 7.3 Collection and Conveyance Equipment Estimated Life Cycle O&M Cost ......................... 16
8.0 BASIS FOR COST ESTIMATE–SLUDGE DISPOSAL FACILITY........................... 17 8.1 Capital Cost Estimate........................................................................................................... 17 8.2 Basis for Sludge Disposal Facility Operations and Maintenance (O&M) Costs ................. 17 8.3 Sludge Disposal Facility Estimated Life Cycle O&M Cost ................................................ 17
9.0 TOTAL COST ESTIMATE FOR TREATMENT WITH COMMINGLING .............. 19
10.0 REFERENCES................................................................................................................. 20

August 2007 -ii- 073-80007
I:\07\80007\0400\ChinoCCP-24Aug07\AppD-WtrTrtmtCost\AppD-WtrTrtmtCostBasis.doc Golder Associates
LIST OF TABLES
Table 1 NMA Leached Flows as Influent to Lime/HDS Treatment Table 2 SMA Source Flows and Water Quality Table 3 Capital Cost Estimate for NMA Lime/HDS Treatment Facility Table 4 Operating Cost—NMA Lime/HDS Plant Year 1 Table 5 Operating Cost—NMA Lime/HDS Plant Year 5 Table 6 Operating Cost—NMA Lime/HDS Plant Year 10 Table 7 Operating Cost—NMA Lime/HDS Plant Year 15 Table 8 Operating Cost—NMA Lime/HDS Plant Year 25 Table 9 Operating Cost—NMA Lime/HDS Plant Year 32 Table 10 Operating Cost—NMA Lime/HDS Plant Year 40 Table 11 Total Constructed Cost Estimate for the Lake One Lime/HDS Treatment Facility Table 12 Annual Operating Cost Estimate for Lake One Lime/HDS Treatment Table 13 Total Constructed Cost Estimate for Effluent Commingling Table 14 Total Constructed Cost Estimate for Water Collection and Conveyance Table 15 Capital and O&M Cost Summary
LIST OF FIGURES Figure 1 Overall Flow Diagram—Water Treatment with Commingling Approach Figure 2 Process Flow Diagram—NMA Lime/HDS Treatment System

August 2007 -1- 073-80007
I:\07\80007\0400\ChinoCCP-24Aug07\AppD-WtrTrtmtCost\AppD-WtrTrtmtCostBasis.doc Golder Associates
1.0 INTRODUCTION
This report presents the cost estimate bases for the proposed mine-wide water treatment portion of the
Chino Mines Company (Chino) Closure/Closeout Plan (CCP) Update. The water treatment approach
involves lime treatment and high-density sludge (lime/HDS) technology, along with commingling of
the effluent with unimpacted waters and treatment system effluents to meet regulatory criteria for the
discharge. This is the approach currently included in the Supplemental Discharge Plan for Closure
DP-1340 (DP-1340) and has been previously presented in the 2001 CCP (M3, 2001a). This approach
generally consists of the following principal elements:
• long-term collection of impacted water from NMA sources (groundwater inflow and runoff in the Santa Rita Pit, NMA interceptor wells, and runoff and seepage from stockpiles) with conveyance to the NMA water treatment facility;
• short-term collection of process solutions, runoff from uncovered stockpiles and pit walls and seepage with conveyance to a process solution elimination system (evaporative treatment system);
• conveyance of impacted water from the Cobre mining operations, north of Chino, to the NMA water treatment facility;
• conveyance of treated effluent from the NMA water treatment facility to the South Mine Area (SMA);
• commingling of the NMA water treatment facility effluent, treated Lake One water effluent, tailing interceptor well water and the SMA production well water such that the NMWQCC discharge criteria are met; and
• discharge of final effluents.
Figure 1 depicts the overall flow diagram for the Water Treatment with Commingling approach.
Cost estimates for initial capital and long-term operations and maintenance (O&M) associated with
this scenario were developed, and include two treatment plants:
• a lime/HDS process for a variety of source waters in the NMA; and
• a lime/HDS plant at the former Hurley Smelter site in the Hurley Operations Area for treatment of Lake One waters.
In addition to the two treatment plants, it is assumed the evaporative treatment system (ETS) will be
used during post-closure years 1 through 5. This system will be constructed to work off the process
water inventory existing at closure, estimated at approximately 2.5 billion gallons (M3, 2004). In

August 2007 -2- 073-80007
I:\07\80007\0400\ChinoCCP-24Aug07\AppD-WtrTrtmtCost\AppD-WtrTrtmtCostBasis.doc Golder Associates
addition to the process water inventory, the runoff and seepage from the uncovered leached stockpiles
will be conveyed to the ETS. At the end of year 5, as the leach stockpiles are covered and draindown
has decreased significantly, the runoff and seepage will be re-routed to the NMA lime/HDS plant for
treatment. Treated effluents from the NMA and the SMA lime/HDS plants will then be commingled
with tailing interceptor well water and SMA make-up water in a mixing pond prior to discharge.
There are six subsystems that make up the Treatment with Commingling System as follows: the two
lime/HDS treatment facilities, the ETS for process solutions elimination, treated water commingling
system, influent water collection, and conveyance and sludge disposal. The cost estimation bases for
each of these six subsystems are described below. Total capital and O&M costs are arrived at by
summing the subsystem costs.

August 2007 -3- 073-80007
I:\07\80007\0400\ChinoCCP-24Aug07\AppD-WtrTrtmtCost\AppD-WtrTrtmtCostBasis.doc Golder Associates
2.0 QUANTITY AND QUALITY OF WATER TO BE TREATED
2.1 North Mining Area (NMA) Sources
The estimated quantities and qualities for the NMA at years 0, 10, 15, 25, 32, 40, and 100 were
developed using a variety of dynamic system modeling (DSM) runs and calculation techniques. As
noted above, it was assumed the process solutions and unleached sources will be segregated. Table 1
presents a summary of the modeled flow rates, TDS concentrations, and sulfate concentrations in
years 0, 5, 10, 15, 25, 32, 40, and 100 for process solutions and unleached sources. In years 0 through
5 the ETS will be utilized for treatment of the process solutions and the lime/HDS treatment systems
for the balance of the flows. No changes in water quality or flow were predicted by modeling after
year 40.
The predicted quantity of water to be treated is 1,025 gallons per minute (gpm) on average through
the course of year 1, with an increase to 1,121 gpm in year 5, and a gradual decrease from that point
onward. For capital cost estimating purposes, a nominal treatment throughput capacity of 1,200 gpm
was used. Operations and maintenance (O&M) costs are based on the projected flow rates and water
quality characterizations at the designated time steps.
2.2 South Mining Area (SMA) Sources
There are three sources of water from the SMA including impacted tailing interceptor well water and
Lake One water, and unimpacted production well water. Available data and assumptions regarding
each source are summarized as follows and shown on Table 2.
Tailing Interceptor Well Water. Four references were reviewed for data on tailing interceptor well
water as follows.
• 2001 CCP (M3, 2001) Appendix G, a report by SRK (SRK, 2001);
• Lake One Alternatives Analysis Report (Golder, 2004);
• 2006 Interceptor Well Sampling Data (Golder, 2006); and
• Gary Van Riper calculations (GVR, 2007).
The individual tailing interceptor well data and the flow-weighted averages for sulfate and TDS
concentrations from each source are summarized as follows.

August 2007 -4- 073-80007
I:\07\80007\0400\ChinoCCP-24Aug07\AppD-WtrTrtmtCost\AppD-WtrTrtmtCostBasis.doc Golder Associates
Data Source
Flow gpm
TDS mg/L
Sulfate mg/L
SRK, 2001 2,820 1,532 1,065 Golder, 2004 2,820 1,532 1,066 Golder, 2006 2,312 1,725 1,027 GVR, 2007 -- 1,800 1,100
Based on this data, the conditions and chemistry of the tailing water have not changed significantly
(less than 20%) over the past several years. The flow rate and chemistry developed by Golder in
2006 will be used for the purposes of this CCP Update.
Flow rates from each of these sources are for year 0. Golder (2004) summarized tailing flow changes
with time. These flow rates were used for purposes of this CCP Update.
Lake One. Available data for Lake One quantity and quality include the following:
• 2001 CCP (M3, 2001) Appendix G, a report by SRK (SRK, 2001); and
• Lake One Closure Alternatives Analysis Report (Golder, 2004).
The analytical data from the individual sources is a summarized as follows:
Source
Flow gpm
TDS mg/L
Sulfate mg/L
SRK, 2001, T3.1 200 3,250 2,320 SRK, 2001, T4.1 500 2,000 1,000 Golder, 2004 100 3,188 2,196
It is unknown why there was a discrepancy in the SRK reported values. However, the values from
the Golder (2004) became the basis for the CCP Update for the Lake One area. In addition, the
Golder values are based on statistical analysis of a larger data set than used by SRK. Therefore, the
values from Golder (2004) will be used to represent flow from Lake One.
South Mine Area Water Well Make-up Water. This is the unimpacted source of water used to
ensure that NMWQCC discharge criteria are achieved. The 2001 CCP (M3, 2001) and the Lake One
Closure Alternatives Analysis Report (Golder, 2004) use a sulfate concentration of 30 mg/L and a
TDS of 310 mg/L for this source. These values were used for the purposes of the CCP Update.

August 2007 -5- 073-80007
I:\07\80007\0400\ChinoCCP-24Aug07\AppD-WtrTrtmtCost\AppD-WtrTrtmtCostBasis.doc Golder Associates
3.0 BASIS FOR COST ESTIMATE–NMA LIME/HDS TREATMENT
3.1 Capital Cost Estimate
The primary source for capital cost estimation for the NMA lime/HDS system is an earlier cost
estimate developed for the Summitville Mine site (RTG, 2004). Summitville is a “Superfund”
cleanup site, with long-term water treatment being jointly funded by the U.S. Environmental
Protection Agency (USEPA) and the Colorado Department of Public Health and Environment
(CDPHE). The RTG (2004) cost estimate was for a new treatment system, replacing an existing
system and based on a series of treatability studies to determine optimal treatment pH and HDS
system design parameters. The Summitville design and estimate exhibit parallels to Chino’s,
including nominal flow rate and water quality characterization, and utilizes similar technology for
removal of mining-derived contaminants with a permitted effluent discharge to surface water (RTG,
2004). The similarities in process between the Summitville and the Chino Treatment with
Commingling designs, level of detail, and relatively recent preparation lend viability to the
Summitville estimate as a basis for the Chino estimate.
A process flow diagram and equipment list for Chino’s NMA lime/HDS plant were generated
(Figure 2 and Table 3). Costs for common process components such as reaction tanks, mixers,
flocculation tanks, reagent tanks, pumps, lime addition subsystem components, sludge tanks and
ancillary equipment were scaled from the Summitville estimate and escalated for inflation (2004
dollars escalated to 2007). The clarifier and belt press are subject to cost impacts other than inflation,
and new estimates were obtained for these items (Sepco, 2007). Utility and ancillary equipment items
were estimated as lump sums and include the following: electrical equipment, pipe, fittings, valves,
instrumentation, and controls.
Equipment installation and site construction were estimated based on craft personnel, labor hours and
prevailing wage rate. Other costs, including mobilization/demobilization, freight, and commissioning
were estimated as lump sums. These costs are estimated based on engineer’s judgment and previous
Golder experience with treatment plant construction and equipment installation projects.
Finally indirect costs including contingency, subcontractor overhead and profit, design, construction
management, and New Mexico Reclamation Fee were applied at project standard factors of the total
direct cost. The capital cost estimate for the NMA lime/HDS plant is presented in Table 3.

August 2007 -6- 073-80007
I:\07\80007\0400\ChinoCCP-24Aug07\AppD-WtrTrtmtCost\AppD-WtrTrtmtCostBasis.doc Golder Associates
3.2 Basis for NMA Operations and Maintenance (O&M) Costs
Operations and maintenance (O&M) costs include labor, reagents, sludge disposal, capital for
equipment replacement, routine maintenance parts cost, sampling and analysis costs, and electrical
power. The cost bases for these items are as follows.
Labor. Operations labor (six full-time equivalents, or FTE), supervision (one FTE), and maintenance
staffing (2 FTE) levels were estimated based on Golder experience with operations of similar
treatment plants. Labor rates and markup for benefits for all categories were based on previous Chino
(M3, 2001a) and Tyrone (M3, 2001b) CCPs. Overtime was estimated based on Golder experience
with operations of similar facilities.
Reagents. Reagents needed for lime/HDS processing include lime, flocculent and acid. Lime is
required for chemical precipitation of dissolved metals and sulfate in the influent water. Projected
lime consumption in the O&M cost estimate was based on calculations utilizing water chemistry data
and treatability studies. The precipitated metals and sulfate are separated in the clarifier into the
sludge underflow, leaving a clarified water overflow that has greatly reduced contaminant
concentrations. Lime unit cost is based on a vendor quote (Chemical Lime Company, 2007).
The lime cost is based on the projected lime consumption values, and it is possible that a discounted
price could be negotiated with a vendor.
Flocculent is added to increase the settling rate of precipitated solids and later in the process to
increase the efficiency of sludge densification (water removal) in the belt press. A relatively small
amount of flocculent is required as a settling aid, while a much greater quantity is required at the belt
press. The trade-off in cost benefit is in final sludge disposal volume. A final sludge waste that is
approximately 50 percent solids can be produced in a flocculent-aided belt press on a continuous
basis. The alternative is to dewater the sludge in a filter press with no flocculent addition. Utilization
of a filter press is more labor intensive, requiring batch-wise operation of filling and emptying the
press and it produces a final sludge waste that may be lower in solids content and higher in volume
than the final sludge from the belt press. Flocculent cost was obtained by vendor quote and usage
rates were based on operational experience at other mine sites and vendor recommendations
(Ciba, 2007).
Sulfuric acid is used to adjust effluent pH of the lime treated clarified water. Lime treatment for
precipitation of metals and sulfate requires a pH of approximately 10. The effluent discharge limit for

August 2007 -7- 073-80007
I:\07\80007\0400\ChinoCCP-24Aug07\AppD-WtrTrtmtCost\AppD-WtrTrtmtCostBasis.doc Golder Associates
pH requires a range of 6 to 9. Acid is added and mixed inline to control effluent pH within the
discharge limit range. Since the treated water from the lime/HDS system is to be mixed with a
number of other sources of lower pH the acid consumption will be lower than a typical lime/HDS
effluent. Usage is based on plant flow rate, lime addition, residual sulfate, the characteristics of the
other water sources at the commingling pond and experience at other sites. The unit cost is based on
the low end of the typical range for similar type systems. The low end of the range is utilized due to
the commingling with other lower pH sources.
Sludge disposal. The cost of sludge disposal is estimated at $0.13 per cubic foot of 50 percent solids
sludge. This cost includes loading, hauling and unloading of sludge in an onsite sludge disposal
facility. The sludge volume is calculated based on the results of treatability studies and modeling for
predicted plant influent in years 1, 5, 10, 15, 25, 32, and 40 at the NMA lime/HDS treatment plant.
The computer modeling predictions show lower flow rates and changes in water chemistry which
decrease the rate of sludge production through the operational life of the treatment plant. The
“out-year” O&M costs account for the gradual reduction in sludge production.
Capital replacement and routine maintenance parts. Through the duration of plant operations,
equipment will be routinely maintained by replacing “wear” parts and by less frequently replacing
entire components (pumps, mixers, etc) due to life cycle failure. Capital replacement and routine
maintenance parts are estimated as percentages of the capital cost estimate. Routine maintenance
parts are factored at 1 percent of the estimated total constructed cost and capital replacement is
factored at 1.5 percent of the estimated total constructed cost. These factors are based on experience
at other sites and the estimates completed for the Summitville Mine site (RTG, 2004).
Sampling and analysis. Sampling and analysis is required for compliance with effluent discharge
permit conditions and for measurement of plant performance. Analyses required by permit and the
frequency at which the analyses are to be performed are incorporated into the O&M cost estimate.
Through the duration of water treatment operations, the frequency of sampling and analysis required
drops from quarterly to semi-annually to annually. The change in number of samples collected and
analyzed is accounted for in the long-term O&M cost estimate. No labor cost is assigned to the
sampling effort. It is assumed that the sampling will be a routine duty for plant operators and does
not need an additional cost associated. Analytical costs are estimated based on laboratory pricing
guide (Energy Laboratories Inc., 2007). Costs are inclusive of packaging, handling, shipping, quality
assurance/quality control and lab results report preparation.

August 2007 -8- 073-80007
I:\07\80007\0400\ChinoCCP-24Aug07\AppD-WtrTrtmtCost\AppD-WtrTrtmtCostBasis.doc Golder Associates
Electrical power consumption. Electrical power is estimated based on development of a motor list,
motor efficiency and operating diversity (run time), similar to methodology used in the Tyrone CCP
(M3, 2001b). Total kilowatt-hours (kWh) per year are calculated and summed, and a unit cost of
$0.06 per kWh is used to estimate total electrical power cost in year one of operations. In out-years,
the power consumption is scaled down in direct proportion to the decreasing flow rate through the
plant.
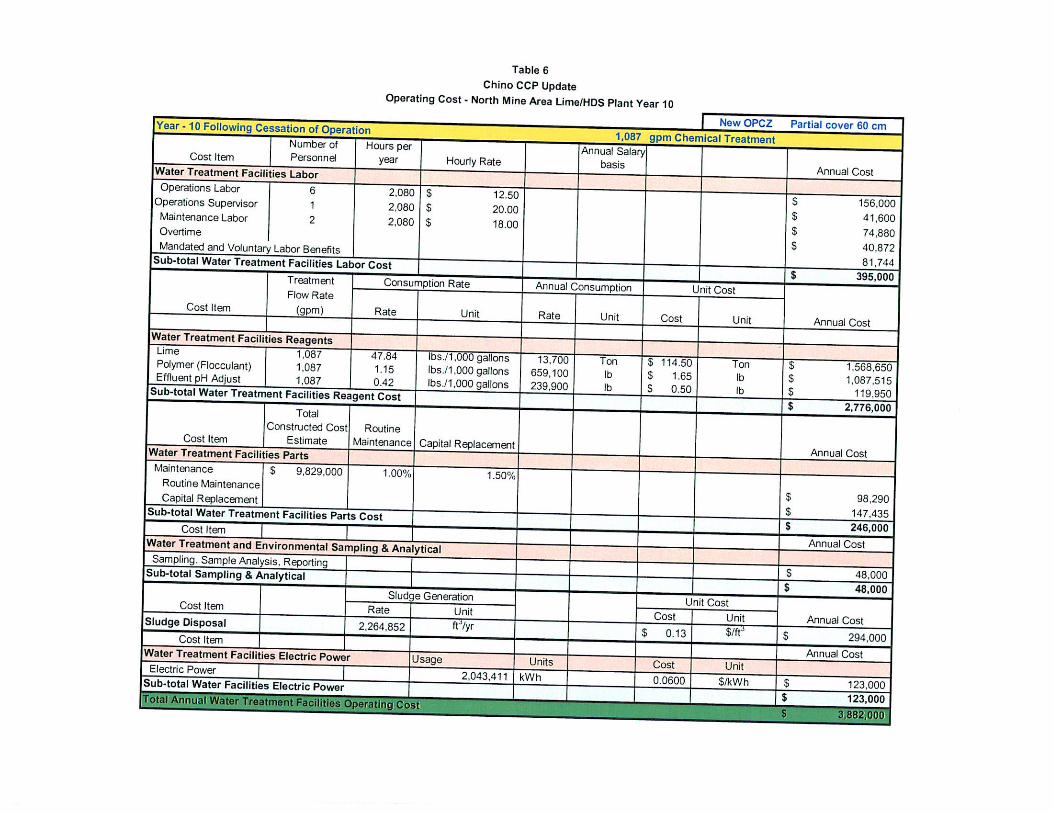
3.3 NMA Lime/HDS Treatment Estimated Life Cycle O&M Cost
The O&M costs as described above were calculated for operational years 1, 5, 10, 15, 25, 32, and 40.
Changes in flow rate and water chemistry, as predicted by dynamic system modeling (DSM), are
carried into the calculation of reagent use and electrical power consumption. At year 40 it is assumed
that no further changes in flow or water quality will occur and the plant will continue to operate
through year 100 in steady state for flow rate and water quality. O&M costs for these years are
presented in Tables 4 through 10.
A total estimated O&M current cost was calculated by multiplying the “time step” year’s annual cost
by the number of years to the next step. This calculation also provided an annual O&M cost estimate
for interim years between time steps (years 2 through 4, years, 6 through 9, years, 11 through 14, etc).
The subsystem O&M cost estimate summed for 100 years of operation for the NMA lime/HDS
treatment plant is $204,733,000.

August 2007 -9- 073-80007
I:\07\80007\0400\ChinoCCP-24Aug07\AppD-WtrTrtmtCost\AppD-WtrTrtmtCostBasis.doc Golder Associates
4.0 BASIS FOR COST ESTIMATE–EVAPORATIVE TREATMENT SYSTEM
The evaporative treatment system (ETS) for process solution elimination may also be used to treat
segregated NMA sources from leached stockpiles runoff and toe seepage. These sources are
predicted to display higher concentrations of metals, sulfate and total dissolved solids than the other
NMA sources. A significant contaminant load can be eliminated from active treatment (NMA
lime/HDS) by segregating the high concentration sources and routing them to the ETS for the
duration of ETS operations. Utilizing the ETS for treatment of the leached sources provides a cost
benefit. The ETS is needed for process solution elimination, but can also accommodate treatment of
leached sources for the first 5 years after closure. This approach effectively reduces the O&M costs
associated with the NMA lime/HDS system.
4.1 Capital Cost Estimate
Previous study (M3, June 2004) has documented alternatives for process solution elimination and
capital cost estimates for each alternative. The total constructed cost of the Pit Option Evaporation
Treatment System (ETS) was estimated at $5,496,210. Escalating this estimate to 2007 dollars
provides the current capital cost estimate of $6,036,000.
4.2 Basis for Evaporative Treatment System Operations & Maintenance (O&M) Costs
The Process Solution Elimination Study (M3, 2004) also provides an estimate of annual operations
cost for the ETS at $645,800 for year 1 and $228,000 annually for years 2 through 5. As with the
capital cost estimate, escalation of the ETS O&M costs to 2007 dollars results in an estimate of
$709,200 for year 1, and $250,400 for years 2 through 5.
4.3 Evaporative Treatment System Estimated Life Cycle O&M Costs
The ETS will operate only as long as necessary to eliminate the bulk of the process solutions in
inventory at the cessation of mining operations. This operational period is estimated at 5 years. The
total O&M cost estimate is derived by summing the estimated annual O&M costs as described above.
The life cycle O&M cost estimate for the ETS is $1,710,800. Upon shutdown of the ETS and
reclamation of the leached stockpiles, long-term seepage will be treated through the NMA lime/HDS
treatment facility.

August 2007 -10- 073-80007
I:\07\80007\0400\ChinoCCP-24Aug07\AppD-WtrTrtmtCost\AppD-WtrTrtmtCostBasis.doc Golder Associates
5.0 BASIS FOR COST ESTIMATE–LAKE ONE LIME/HDS TREATMENT
The Lake One lime/HDS treatment plant is located at the former Hurley Smelter site (now referred to
as the Hurley Operations Area). Modeling predictions of long-term flow rate and water quality
characterizations indicate that a constant flow rate and constant water quality characterization (i.e., no
changes in water chemistry through time) are applicable. Cost estimating is based on a constant flow
rate of 100 gallons per minute (gpm) and water quality parameters that affect lime consumption and
sludge production, including influent concentrations of metals, sulfate and total dissolved solids.
Much of the process equipment required for the Lake One lime/HDS treatment plant is in place due to
previous treatment of former Hurley smelter discharge waters. The capital cost estimate accounts for
re-use of existing equipment and infrastructure.
5.1 Capital Cost Estimate
The Lake One lime/HDS capital costs include concrete and structural additions to existing buildings,
provision of a new polymer feed building, and upgrades or new installation of process equipment,
piping, electrical subsystems/components, instrumentation and controls. The current cost estimate is
based on a previous (2004) estimate and was escalated for inflation to the 2007 cost estimate.
The estimate subtotal for direct capital cost was then used to develop total cost by applying factors for
the following:
• contingency;
• subcontractor overhead;
• subcontractor profit;
• design;
• construction management/controls; and
• New Mexico Reclamation fee.
The Lake One capital cost estimate is presented in Table 11.

August 2007 -11- 073-80007
I:\07\80007\0400\ChinoCCP-24Aug07\AppD-WtrTrtmtCost\AppD-WtrTrtmtCostBasis.doc Golder Associates
5.2 Basis for Lake One Operations and Maintenance (O&M) Costs
O&M costs include labor, reagents, sludge disposal, capital for equipment replacement, routine
maintenance parts cost, and electrical power. The basis for these items is as follows.
Labor. Operations labor and supervision for the Lake One lime/HDS plant is assumed covered by
the operators and supervisor at the NMA lime/HDS plant. Maintenance labor is estimated at 320
hours per year (approximately 6 hours per week). Staffing levels were estimated based on Golder
experience with operations of similar treatment plants. Labor rates and markup for benefits for all
categories were based on previous Chino and Tyrone CCP updates. Overtime was estimated based on
Golder experience with operations of similar facilities.
Reagents. Reagents needed for lime/HDS processing include lime, flocculent, and acid. The bases
for estimated reagent costs for the Lake One plant are the same as discussed above, for the NMA
plant.
Sludge disposal. The cost of sludge disposal is estimated at $0.13 per cubic foot of 50 percent solids
sludge. This cost includes loading and unloading of sludge in an onsite sludge disposal facility.
An additional sludge transportation cost of $300 per week is included for Lake One sludge disposal,
assuming that the sludge disposal facility is located near the NMA plant requiring a longer haul from
the Lake One site. The Lake One plant does not include a belt press or filter press for dewatering, so
the sludge to be hauled will be of a greater volume (lower density) due to the lower percent solids.
Capital replacement and routine maintenance parts. Through the duration of plant operations,
equipment will be routinely maintained by replacing “wear” parts and by less frequently replacing
components (pumps, mixers, etc) due to life cycle failure. Capital replacement and routine
maintenance parts are estimated as percentages of the capital cost estimate. Routine maintenance
parts are estimated at 1 percent of the initial capital cost and capital replacement is estimated at
1.5 percent of initial capital cost. These factors have basis in experience on other operations projects,
including the Summitville Mine (RTG, 2004).
Sampling and Analysis. The cost estimate basis for sampling and analysis at Lake One is the same
as described above for the NMA.

August 2007 -12- 073-80007
I:\07\80007\0400\ChinoCCP-24Aug07\AppD-WtrTrtmtCost\AppD-WtrTrtmtCostBasis.doc Golder Associates
Electrical power consumption. Electrical power is estimated with two bases: 1) power required for
pumping from various locations (extraction wells, stormwater sumps, and barrier wall pumps) to the
headworks of the Lake One Treatment plant; and 2) power required for operation of the treatment
processing equipment. The treatment process power estimate is scaled based on flow rate, from an
estimate developed for a similar process operated at 1,200 gpm. Total kilowatt-hours (kWh) per year
are calculated and summed, and a unit cost of $0.06 per kWh is used to estimate total electrical power
cost in year one of operations. Flow to the Lake One treatment plant is constant throughout the life of
the plant at 100 gpm, and the power consumption is likewise assumed to be level in years one through
cessation.
The Lake One O&M cost estimate for year 1 through cessation of operations is presented in Table 12.
5.3 Lake One Lime/HDS Treatment Estimated Life Cycle O&M Cost
The O&M costs as described above were calculated for operational year 1. No changes in flow rate
and water chemistry are predicted. The estimate of O&M annual current cost for year one was
multiplied by 100 to develop a total current cost for 100 years of Lake One treatment operations.
The subsystem O&M cost estimate summed for 100 years of operation for the Lake One lime/HDS
treatment plant is $13,200,000.

August 2007 -13- 073-80007
I:\07\80007\0400\ChinoCCP-24Aug07\AppD-WtrTrtmtCost\AppD-WtrTrtmtCostBasis.doc Golder Associates
6.0 BASIS FOR COST ESTIMATE–COMMINGLING EQUIPMENT
6.1 Capital Cost Estimate
The primary source for capital cost estimation for the commingling equipment is the 2001 Chino CCP
(M3, 2001a). The projected commingling sources and flow rates have not changed appreciably since
the 2001 CCP was prepared. The 2001 CCP equipment and piping cost estimates were escalated to
2007 dollars. Items included in the capital cost estimate for commingling are:
• pivots;
• irrigation piping sized for a flow of 10,000 gpm;
• irrigation piping sized for a flow of 2,000 gpm;
• pipe-fittings (tees, ells, cleanouts, etc.);
• computerized modules;
• 10,000-gallon capacity mixing tanks;
• power supply;
• commingling pond; and
• first year crops.
Pumps for the commingling system are in place as part of mining water/wastewater operations.
No new capital cost will be incurred for pumps. Costs calculated by factors of the capital equipment
include:
• contingency;
• subcontractor overhead;
• subcontractor profit;
• design;
• construction management/controls; and
• New Mexico Reclamation fee.
The capital cost estimate for commingling equipment is presented in Table 13.

August 2007 -14- 073-80007
I:\07\80007\0400\ChinoCCP-24Aug07\AppD-WtrTrtmtCost\AppD-WtrTrtmtCostBasis.doc Golder Associates
6.2 Basis for Commingling Operations and Maintenance (O&M) Costs
O&M costs for commingling equipment include electrical power only. An operating load of
447 kilowatts (kW) for pumping was estimated. This load is applied continuously, with an assumed
uptime ratio of 95 percent (8,322 runtime hours annually). The unit cost is $0.06 per kWh.
O&M line item costs assumed to be covered in the NMA and Lake One estimates include labor,
capital replacement and routine maintenance parts.
O&M line items which are not applicable to the commingling equipment include reagents, sludge
disposal and sampling and analysis.
6.3 Commingling Equipment Estimated Life Cycle O&M Cost
The O&M costs as described above were calculated for operational year 1. No significant changes in
flow rate for the commingling equipment are predicted. The estimate of O&M annual current cost for
year one was multiplied by 100 to develop a total current cost for 100 years of commingling
equipment operations. The subsystem O&M cost estimate summed for 100 years of operation for the
commingling equipment is $22,320,000.

August 2007 -15- 073-80007
I:\07\80007\0400\ChinoCCP-24Aug07\AppD-WtrTrtmtCost\AppD-WtrTrtmtCostBasis.doc Golder Associates
7.0 BASIS FOR COST ESTIMATE–WATER COLLECTION AND CONVEYANCE
7.1 Capital Cost Estimate
The primary source for capital cost estimation for the water collection and conveyance are site maps
and proximal locations of collection points. Estimates of pipeline lengths are based on review of
locations, and pipeline sizes are based on predicted flows from influent sources. Pipeline estimates
are as follows:
• Santa Rita Pit to NMA treatment plant - 20,000 feet;
• Reservoir 8 to NMA treatment plant - 33,420 feet; and
• Reservoir 7 to NMA treatment plant - 250 feet.
In addition to the pipelines, a one million gallon influent pond at the NMA treatment plant and a 1-
million-gallon lift pond in the Santa Rita Pit are included in the capital cost estimate for collection
and conveyance.
Pumps for the collection and conveyance system are assumed to be in place as part of mining
water/wastewater operations. No new capital cost will be incurred for pumps. Costs calculated by
factors of the capital equipment include:
• contingency;
• subcontractor overhead;
• subcontractor profit;
• design;
• construction management/controls; and
• New Mexico Reclamation fee.
The capital cost estimate for collection and conveyance is presented in Table 14.
7.2 Basis for Collection and Conveyance Operations and Maintenance (O&M) Costs
For the purpose of this estimate, the O&M costs for collection and conveyance equipment include
electrical power only. An operating load of 257 kilowatts (kW) for pumping was estimated. This

August 2007 -16- 073-80007
I:\07\80007\0400\ChinoCCP-24Aug07\AppD-WtrTrtmtCost\AppD-WtrTrtmtCostBasis.doc Golder Associates
load is applied continuously, with an assumed uptime ratio of 95 percent (8,322 runtime hours
annually). The unit cost for power is $0.06 per kWh.
O&M line item costs assumed to be covered in the NMA and Lake One estimates include labor,
capital replacement and routine maintenance parts.
7.3 Collection and Conveyance Equipment Estimated Life Cycle O&M Cost
The O&M costs as described above were calculated for operational year 1. No significant changes in
flow rate for the collection and conveyance equipment are predicted for subsequent years. The
estimate of O&M annual current cost for year one was, therefore, multiplied by 100 to develop a total
current cost for 100 years of commingling equipment operations. The subsystem O&M cost estimate
summed for 100 years of operation for the water collection and conveyance equipment is
$12,900,000.

August 2007 -17- 073-80007
I:\07\80007\0400\ChinoCCP-24Aug07\AppD-WtrTrtmtCost\AppD-WtrTrtmtCostBasis.doc Golder Associates
8.0 BASIS FOR COST ESTIMATE–SLUDGE DISPOSAL FACILITY
8.1 Capital Cost Estimate
The sludge disposal facility will be developed on site. The capacity of the disposal facility is
adequate for sludge produced for 100 years of operation of the NMA and Lake One lime/HDS
treatment plants. The capital cost is estimated by scaling from known cost for a similar proposed
sludge disposal facility at Tyrone.
8.2 Basis for Sludge Disposal Facility Operations and Maintenance (O&M) Costs
The O&M costs for the sludge disposal facility are incorporated into the NMA and Lake One
lime/HDS treatment plant O&M costs as described above.
8.3 Sludge Disposal Facility Estimated Life Cycle O&M Cost
NMA lime/HDS treatment plant. The O&M costs developed for sludge disposal within the NMA
lime/HDS plant O&M costs were calculated for operational years 1, 5, 10, 15, 25, 32, and 40. Sludge
quantities were calculated based on water flow rate and chemistry, and treatability studies. Changes
in flow rate and water chemistry as predicted by DSM modeling are carried into the calculation of
sludge production. At year 40 it is assumed that no further changes in flow or water quality will
occur and the plant will continue to operate through year 100 in steady state for flow rate and water
quality.
A total estimated sludge disposal O&M current cost was calculated by multiplying the “time step”
year’s annual cost by the number of years to the next step. This calculation also provided an annual
O&M cost estimate for interim years between time steps (years 2 through 4, years, 6 through 9, years,
11 through 14).
Lake One lime/HDS treatment plant. The O&M costs developed for sludge disposal within the
Lake One lime/HDS plant O&M costs were calculated for operational year 1 only. No changes in
flow rate or influent water quality characterization are predicted for Lake One. The 100-year O&M
current cost estimate for sludge disposal from Lake One is obtained by multiplying the annual cost by
100.

August 2007 -18- 073-80007
I:\07\80007\0400\ChinoCCP-24Aug07\AppD-WtrTrtmtCost\AppD-WtrTrtmtCostBasis.doc Golder Associates
The subsystem O&M cost estimate for sludge generated at both the NMA and Lake One facilities,
summed for 100 years of operation is $13,144,000.

August 2007 -19- 073-80007
I:\07\80007\0400\ChinoCCP-24Aug07\AppD-WtrTrtmtCost\AppD-WtrTrtmtCostBasis.doc Golder Associates
9.0 TOTAL COST ESTIMATE FOR TREATMENT WITH COMMINGLING
Capital cost estimates for each of the six subsystems that together comprise the Treatment with
Commingling system were summed to generate a total capital cost estimate.
O&M cost estimates were developed for operational years 1, 5, 10, 15, 25, 32, and 40 for the NMA
lime/HDS treatment plant. No changes in flow rate or influent water quality characterization are
predicted to occur from year 40 to year 100. Interim year O&M annual costs were held level with the
time step cost (i.e., year one cost is used in years 1, 2, 3, and 4; year 5 cost is used in years 5, 6, 7, 8,
and 9, etc.). The current cost for 100 years of operation is then summed from the capital cost
estimates applied in year one and all O&M annual cost estimates (year 1 through 100). Summary
capital and current costs for 100 years of O&M are presented in Table 15.

August 2007 -20- 073-80007
I:\07\80007\0400\ChinoCCP-24Aug07\AppD-WtrTrtmtCost\AppD-WtrTrtmtCostBasis.doc Golder Associates
10.0 REFERENCES
Chemical Lime Company, 2007. Personal communication with Brett Tanner, June 20, 2007.
Ciba Specialty Chemicals, 2007. Personal communication with Jerry Goelge, July 6, 2007.
Energy Laboratories, Inc, 2007. Published price list for analytical work. Available via internet at www.energylab.com.
Gary Van Riper (GVR), 2007. Personal communication re:calculations.
Golder, 2004. Lake One Closure Alternatives Analysis Report. February, 2004.
Golder, 2006. Interceptor Well Sampling Data.
M3 Engineering and Technology Corporation (M3). 2001a. Chino Closure/Closeout Plan. March 17, 2001.
M3. 2001b. Tyrone Closure/Closeout Plan. May 8, 2001.
M3, 2004. Process Solution Elimination Study. June 2004.
RTG, 2004. Summitville Mine Superfund Site Operable Unit 5 Water Treatment Plant Construction Documents Report.
Sepco, 2007. Personal communication with John Smith.
Steffen, Robertson and Kirsten (SRK), 2001. See M3 Engineering and Technology Corporation (M3). 2001a. for Appendix G.

I:\07\80007\0400\ChinoCCP-24Aug07\AppD-WtrTrtmtCost\AppD-WtrTrtmtCostBasis.doc Golder Associates
TABLES


I:\07\80007\0400\ChinoCCP-24Aug07\AppD-WtrTrtmtCost\AppD-WtrTrtmtCostBasis.doc Golder Associates
FIGURES


Reaction Tank
Flocculation Tank
Lime
Silo
Lime Slaker
Lime
Makedown Mixing
Tank
Polymer
Storage and
Makedown Thickener/Clarifier
Clearwell
Sludge
Belt Filter Press
Sludge
To Disposal
Polymer
Storage
And Makedown
Metering
Pump
Metering
Pump
J:\07JOBS\073-80007 Chino CCP\chino pfd.vsd2
Not To Scale
8/22/2007DRAWN
CHECKED
REVIEWED
Process Flow Diagram
North Mine Area Lime/HDS Treatment System
PCS
EPB
BCH
073-80007
NAChino Mine Closure/Closeout Plan
Plant
Water
Bulk Polymer
Bulk Lime
Grit
Disposal
Bulk Polymer
pH
Adjustment
(if necessary)
Effluent
to
SMAInfluent
Storage
Sludge
Storage Tank
Process
Water
NMA
Influent