APPENDIX D NOISE MEASUREMENT REPORT - Federal Aviation Administration€¦ · APPENDIX D NOISE...
39
APPENDIX D NOISE MEASUREMENT REPORT
Transcript of APPENDIX D NOISE MEASUREMENT REPORT - Federal Aviation Administration€¦ · APPENDIX D NOISE...

APPENDIX D
NOISE MEASUREMENT REPORT

NY/NJ/PHL Airspace Redesign EIS Noise Measurement Report
Landrum & Brown Appendix D September, 2005 TOC D-1
Table of Contents I. Purpose............................................................................................................................ D-1
II. Procedures/Instrumentation ............................................................................................ D-1
III. Site Locations.................................................................................................................. D-2
IV. Descriptions and Noise Level Results ............................................................................ D-6
V. Summary ....................................................................................................................... D-38
Tables Table 1 - Noise Measurement Site Location Summary ........................................................... D-4
Table 2 - Noise Event Threshold Settings ............................................................................... D-7
Table 3 - Noise Measurement Summary ............................................................................... D-39
Table 4 - Aircraft Event Noise Correlation Summary ........................................................... D-40
Exhibits Exhibit 1 - Noise Measurement Site Map.......................................................................After D-4

NY/NJ/PHL Airspace Redesign EIS Noise Measurement Report
Landrum & Brown Appendix D September, 2005 Page D-1
Noise Measurement Report I. Purpose While FAA Order 1050.1E requires that the evaluation of aircraft noise be conducted based on approved computer noise model calculations, it is valuable to consider the noise modeling results in the context of the local ambient noise environment. To that end, a field noise measurement program was conducted at select sites throughout the New York/New Jersey/Philadelphia Airspace Redesign EIS study area to provide a sample of ambient and cumulative noise values for consideration. The primary focus of the measurement program was to collect and calculate the day/night average noise levels (DNL) at each specific site. The noise measurements contain all noise recorded at a site, and have been parsed into the noise contributions from both aircraft and non-aircraft sources. The findings provide context of background and cumulative noise levels in which any changes in modeled noise exposure resulting from an airspace alteration can be considered. This report provides a general description of the measurement process, a description of the specific sites selected for noise measurement, a summary of the onsite observations made during the measurement period, and a quantitative analysis of the noise measurement results. In addition to the total DNL at each monitoring site, several other metrics were also computed from the measured data as supplemental information. These include the following:
L50 – Sound level at which 50% of the measured 1-second samples are above and 50% are below. This is generally considered to be an estimation of background noise levels by FAA.
Aircraft DNL – The DNL value of only the noise events that were correlated with
aircraft overflights based on the radar flight track data.
Non-Aircraft DNL – The DNL value of noise resulting from the subtraction of the Aircraft DNL value from the Total DNL measured at each site.
Aircraft Lmax – Range of maximum sound level associated with correlated aircraft
events.
Average number of aircraft noise events per day.
Most common types of aircraft noise events. II. Procedures/Instrumentation The noise measurement program was conducted in two phases. The first phase of noise measurements was performed between December 3 and December 21, 2001. Measurements

NY/NJ/PHL Airspace Redesign EIS Noise Measurement Report
Landrum & Brown Appendix D September, 2005 Page D-2
were conducted at 15 sites throughout the study area, for a continuous 3 to 4 day period for each site. The second phase of measurements was conducted between August 12 and August 30, 2002. Measurement was conducted at 16 sites for a 3 to 4 day period. In general, the Phase II sites were the same or in close proximity to their first phase location. An additional site was added for the second phase because access could not be coordinated at the time of the Phase I measurements. The equipment used to measure noise levels at the sites included a high-quality microphone with a weather resistant microphone screen, a B&K 2236 Type 1 noise monitor, and a HP 200 LX palmtop computer. The microphone was mounted on a tripod, and the noise monitor was connected to a standard marine battery. The noise monitor was set to continuously measure instantaneous noise levels (dBA) throughout the measurement period. The computer recorded output from the monitor in one second intervals for the entire period of measurement. At each site the noise monitors were calibrated with certified acoustical calibrators immediately before measurement commenced and immediately after measurement ended. Between four and six similar units were deployed in the field at any give time during the program. As with any technical field effort where electronic instrumentation is exposed to the elements for an extended period of time, electrical and mechanical malfunctions can, and often do, occur. This effort was no exception. Thus, during each measurement period, the monitors were checked periodically by a two-person crew. Where malfunctions were observed, field repairs were undertaken. In most cases the crews were able to restore system functionality with minimal data loss. In some cases, however, some data was lost as the equipment was reset. These instances are noted in the site descriptions. The crew also made qualitative assessments while observing and logging noise events and noise patterns for a total of 6 hours at each site. At most sites, photographs were taken to verify correct setup of the monitor, and to document the location and surroundings. III. Site Locations While there is no end to the number of potential noise measurement sites in a 30,000+ square mile study area, issues such as cost and time often create a practical limit to the scope of any noise measurement program. Accordingly, this noise measurement program focused on collecting a sample of data within strategic areas that were directly related to the range of

NY/NJ/PHL Airspace Redesign EIS Noise Measurement Report
Landrum & Brown Appendix D September, 2005 Page D-3
alternatives evaluated and the local land uses within the Study Area. Key components used in evaluating site locations included:
Areas that will could potentially be over-flown by new procedures proposed by each alternative airspace configuration;
Areas that have existing overflights, but where the traffic volume may change based
on operation mode or utilization;
Noise sensitive and/or 4f/historic sites that may be identified within the two previous areas indicated;
Typical traffic patterns conducted by uncontrolled-VFR operations to/from local
airports (typically low-traffic facilities) within the study area;
Provide a wide range of analysis across the geographical study area;
Other public/FAA input. Sites were chosen in order to assess noise in a variety of settings. Rural and urban sites were monitored as well as public parks, historic sites, and residential neighborhoods. The sites were also chosen to span the study area, with particular attention paid to noise sensitive areas and areas where there have been aircraft noise complaints. Table 1 provides a summary of the measurement locations while Figure 1 illustrates a map of the site locations within the study area. IV. Site Descriptions and Noise Level Results This section provides both qualitative descriptions and quantitative analysis for each measurement site. First, site descriptions are given based primarily on qualitative observations made by the two-person crews who were on site for a minimum of 6 hours during each phase of measurements. The data detailed for each site include measurement period, site location, nearby land use, ambient noise patterns, non-aircraft noise sources, and aircraft noise sources. Second, the quantitative results are presented. These results include total DNL, aircraft DNL, non-aircraft DNL, L50 noise level, range of Lmax for aircraft noise events, average number of aircraft noise events per day, and the most common types of aircraft noise events. The computation process for quantitative results merits some discussion. Total DNL at each site was directly calculated using the collected one-second dBA data. The maximum number of continuous 24 hour periods measured at each site was used, beginning with the first full hour of measurement for each phase. The number of continuous days varied by site both because of varied nature of start and stop times, and because of intermittent equipment failure for some sites. L50 was calculated using the same 24 hour periods as DNL.

NY/NJ/PHL Airspace Redesign EIS Noise Measurement Report
Landrum & Brown Appendix D September, 2005 Page D-4
Table 1 Noise Measurement Site Location Summary
Site Name Location Latitude Longitude Land UseDates
Measured Dates
Measured
Site 1aSaugerties Residence Saugerties, NY 42.0766 -74.0617 Rural Residential
12/3/01 - 12/7/01 N/A
Site 1bStone Ridge Residence Stone Ridge, NY 41.8554 -74.1552 Rural Residential N/A
8/19/02 - 8/23/02
Site 2Oliverea Residence Oliverea, NY 42.0130 -74.4154 Rural Park
12/3/01 - 12/7/01
8/20/02 - 8/23/02
Site 3Beaver Dam Sanctuary Katonah, NY 41.2469 -73.6661 Suburban Park
12/3/01 - 12/7/01
8/19/02 - 8/23/02
Site 4Stamford Residence Stamford, CT 41.0533 -73.5047 Suburban Residential
12/3/01 - 12/7/01 N/A
Site 5Robert Moses State Park Fire Island, NY 40.6292 -73.2283 Rural Park
12/18/01 - 12/21/01
8/12/02 - 8/15/02
Site 6 Harbor Island Park Mamaroneck, NY 40.9446 -73.7324 Suburban Park12/3/01 - 12/7/01
8/19/02 - 8/23/02
Site 7aStaten Island Residence(a) Staten Island, NY 40.6385 -74.1662 Urban Residential
12/17/01 - 12/21/01 N/A
Site 7bStaten Island Residence(b) Staten Island, NY 40.6394 -74.1686 Urban Residential N/A
8/12/02 - 8/16/02
Site 8 Carteret Residence Carteret, NJ 40.5873 -74.2299 Suburban Residential N/A8/12/02 - 8/16/02
Site 9 Tourne Park Boonton, NJ 40.9084 -74.4353 Suburban Park12/10/01 - 12/14/01
8/26/02 - 8/30/02
Site 10Morristown Nat. Hist. Park Morristown, NJ 40.7618 -74.5436 Rural Park
12/10/01 - 12/14/01
8/26/02 - 8/30/02
Site 11 BWZ VOR Schooley's Mtn, NJ 40.7985 -74.8233 Rural12/11/01 - 12/14/01
8/26/02 - 8/30/02
Site 12Twin Lights Historic Site Highlands, NJ 40.3968 -73.9854 Suburban Park
12/10/01 - 12/14/01
8/26/02 - 8/30/02
Site 13Brandywine Battlefield Park Chadds Ford, PA 39.8750 -75.5713 Rural Park
12/18/01 - 12/21/01
8/14/02 - 8/16/02
Site 14Colts Neck Residence Colts Neck, NJ 40.3113 -74.1990 Suburban Residential
12/10/01 - 12/14/01
8/26/02 - 8/30/02
Site 15Ardencroft Residence Ardencroft, DE 39.8043 -75.4840 Suburban Residential
12/17/01 - 12/21/01
8/13/02 - 8/16/02
Site 16Garden City Residence Garden City, NY 40.7182 -73.6750 Urban Residential
12/17/01 - 12/21/01
8/12/02 - 8/16/02

NEW YORK
Study A
rea B
ound
ary
SWF
HPN
ISP
12
7a7b
Ulster
Oneida
Delaware
Worcester
Herkimer
Berks
Otsego
Sussex
Pike
Kent
Sullivan
Suffolk
Orange
Wayne
Luzerne
Bucks
Ocean
Litchfield
Berkshire
LancasterChester
Saratoga
Franklin
Greene
Broome
Chenango
DutchessHartford
Windham
Fulton
Cheshire
Monroe
Schuylkill
Fairfield
MadisonOnondaga
Burlington
Albany
Sussex
Morris
Cecil
Washington
Hillsborough
Columbia
Atlantic
Hampden
Schoharie
Susquehanna
Rensselaer
Bennington
Tolland
Harford
Cortland
Windham
Salem
New London
New Haven
Carbon
Lehigh
Warren
Hampshire
Monmouth
Talbot
Wyoming
Montgomery
Westchester
Nassau
Mercer
Montgomery
Putnam
Essex
Delaware
Kent
NewCastle
Cumberland
Hunterdon
Middlesex
Lackawanna
Bergen
Middlesex
Somerset
Gloucester
Washington
Northampton
Camden
Passaic
QueenAnne's
Cape May
Rockland
Union
Schenectady
QueensKings
Philadelphia
Bronx
Hudson
Richmond
NewYork
NEW
JER
SEY
DE
LA
WA
RE
MASSACHUSETTS
CONNECTICUT
VERMONT
RH
OD
E IS
LA
ND
PENNSYLVANIA
ATLANTICOCEANPoint Pleasant
Cape May
Asbury Park
Jones Inlet
Barne
gat B
ay
Garde
n Stat
e Park
way
NJ Turn
pike
LONG ISLAND SOUND
CDW
HVN
MMU
LDJ
9
8
6
5
4
3
2
16
15
14
13
1110
1b
1a
N E W Y O R K / N E W J E R S E Y / P H I L A D E L P H I A M E T R O P O L I T A N A I R S P A C E R E D E S I G N P R O J E C T
Noise Measurement Site Locations
E N V I R O N M E N T A L I M P A C T S T A T E M E N T
Exhibit1
Noise MeasurementSite Location
State Boundary
Major Airport
Satellite Airport
LEGEND
Statute Miles
Nautical Miles0 20 40
0 20 40
Prohibited, Restricted, and Warning Area
LGA
TEB
EWRJFK
LGA
PHL
Source: Landrum & Brown / Metron Inc. Analysis, 2002

NY/NJ/PHL Airspace Redesign EIS Noise Measurement Report
Landrum & Brown Appendix D September, 2005 Page D-5
In order to quantify the noise levels attributable specifically to aircraft, a noise correlation process was undertaken using FAA radar data collected during each measurement period. The analysis brought together the elements needed to evaluate what noise is attributable to aircraft as opposed to other noise sources. These elements include the one-second dBA noise level data from the measurements, radar flight data for the measurement periods, and geographical positions of each measurement site. The analysis process goes as follows:
1. The one-second dBA data is analyzed to determine when there are noise events. A noise event occurs when the noise level increases by a fixed threshold dBA level above the hourly L90 for a minimum duration. These thresholds and durations are presented in Table 2.
2. For the times when there are noise events, the geographical area surrounding each site is
scanned to determine if there are any aircraft within a ground distance at which an aircraft could conceivably create noise at the site location. If there are aircraft within the vicinity, the noise event is attributed to the closest aircraft. If there are no aircraft, the noise event is assumed to be the result of some other source. All noise events categorized as aircraft events were accumulated to determine the DNL due to aircraft only for the measurement sites.
Table 2 Noise Event Threshold Settings
Site Minumum dBA above L90
Minimum Duration (s)
1a 8 15 1b 8 15 2 8 15 3 8 15 4 6 15 5 5 15 6 7 20 7a 9 14 7b 9 14 8 6 15 9 5 20 10 6 20 11 5 15 12 5 15 13 6 20 14 6 20 15 7 15 16 8 20

NY/NJ/PHL Airspace Redesign EIS Noise Measurement Report
Landrum & Brown Appendix D September, 2005 Page D-6
Site 1a – Saugerties Residence – Site Description Measurement period Phase 1 measurement began Monday 12/3/01, and concluded Friday 12/7/01. Location Site 1a was a residence on Stoll Road; Saugerties, NY. This location is near Catskill State Park, approximately 95 miles north of the 3 major NYC airports. The monitor was placed in the yard, about 15 yards east of the east wall of the home, in an open area amongst a few tall pine trees. Land Use The area was as rural residential, with houses generally very widely spaced and settled within the rolling, wooded terrain. There were two other houses within a 300 yard radius. Predominant roadways near the site were as follows:
1. Stoll Road – Very lightly traveled rural road located approximately 60 yards north of noise monitor.
2. Route 212 Highway – Rural highway with some traffic located approximately 1 mile southeast of monitor.
3. Route 33 Highway – Very lightly traveled rural highway located approximately ½ mile west of monitor.
Ambient Noise In general, this site was very quiet. During heavy traffic periods, minor background noise could be associated to Route 212 highway in the distance and to a lesser degree Route 33 Highway. Non-Aircraft Noise Sources Occasionally cars would pass on Stoll Road (3 - 4 per hour) creating noise events of 20 – 30 seconds. The owner of the house would leave and return a few times a day. Wildlife especially birds occasionally made noise. Two of the three observation days, a large truck made some minor noise working in the distance. Aircraft Noise Sources At Site 1a, there was a variety of routes flown by both propeller and jet aircraft, with aircraft events logged about 12 times per hour. The most prevalent route was a south bound path, typically flown approximately one mile to the west of the site, presumably an approach route to NYC. The route was usually flown by large jets, at a high altitude. Approximately ½ of the air traffic in the area was associated with this route. It is possible that some of the air traffic in the area could be attributed to Albany, but it is unclear how much.
NY/NJ/PHL Airspace Redesign EIS Noise Measurement Report
Landrum & Brown Appendix D September, 2005 Page D-7
Site 1a – Saugerties Residence – Noise Level Results
Site 1a - Cumulative Statistics Total Days 4 Total DNL 40.5 Aircraft DNL 25.5 Non-Aircraft DNL 40.3 L50 31.0 Aircraft Events / Day 15 Aircraft Lmax range 37.6 - 67.1
Site 1a - 10 Most Common Aircraft Noise Events Aircraft Type Operation Type Airport Number of Events B772 A KEWR 4 GLF4 A KTEB 4 A306 A KEWR 2 B72Q D KPHL 2 B762 A KEWR 2 BE58 A KLDJ 2 C650 A KTEB 2 DH8A A KLGA 2 GLF3 A KTEB 2 H25C A KTEB 2
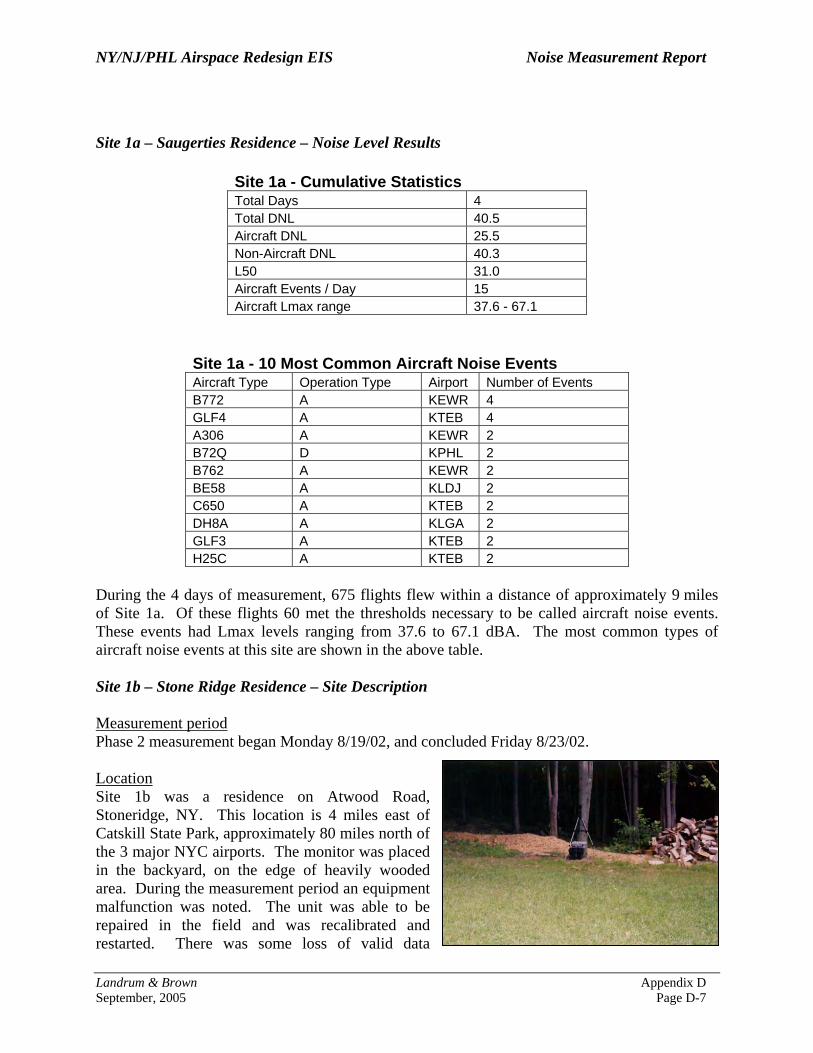
During the 4 days of measurement, 675 flights flew within a distance of approximately 9 miles of Site 1a. Of these flights 60 met the thresholds necessary to be called aircraft noise events. These events had Lmax levels ranging from 37.6 to 67.1 dBA. The most common types of aircraft noise events at this site are shown in the above table. Site 1b – Stone Ridge Residence – Site Description Measurement period Phase 2 measurement began Monday 8/19/02, and concluded Friday 8/23/02. Location Site 1b was a residence on Atwood Road, Stoneridge, NY. This location is 4 miles east of Catskill State Park, approximately 80 miles north of the 3 major NYC airports. The monitor was placed in the backyard, on the edge of heavily wooded area. During the measurement period an equipment malfunction was noted. The unit was able to be repaired in the field and was recalibrated and restarted. There was some loss of valid data

NY/NJ/PHL Airspace Redesign EIS Noise Measurement Report
Landrum & Brown Appendix D September, 2005 Page D-8
resulting in only two full 24-hour periods of valid data. Land Use The area was rural residential. Atwood Road had many cars passing throughout the observation period. Stone Ridge Main Street was located approximately 0.75 miles east of the site. Ambient Noise Main sources of ambient noise included insects and light background auto traffic. Non-Aircraft Noise Sources Children playing in the neighborhood were observed, as well as dogs barking. Some wildlife noise was noted, and many short duration noise events were noted from cars passing on Atwood Road. Aircraft Noise Sources Aircraft events were logged at a rate of 7 per hour during times of observation. A mixture of jets and props were noted, with many of the events being barely audible, and aircraft very high or not visible. Site 1b – Stone Ridge Residence – Noise Level Results
Site 1b - Cumulative Statistics Total Days 2 Total DNL 62.7 Aircraft DNL 26.9 Non-Aircraft DNL 62.7 L50 47.0 Aircraft Events / Day 5 Aircraft Lmax range 54.3 - 64.8
Site 1b - 10 Most Common Aircraft Noise Events Aircraft Type Operation Type Airport Number of Events E135 A KHPN 2 E145 A KHPN 2 B764 A KEWR 1 DC93 A KHPN 1 F100 A KHPN 1 F100 A KSWF 1 GLF4 A KHPN 1
During the 2 days of measurement, 440 flights flew within a distance of approximately 9 miles of Site 1b. Of these flights 10 met the thresholds necessary to be called aircraft noise events. These events had Lmax levels ranging from 54.3 to 64.8 dBA. The most common types of aircraft noise events at this site are shown in the above table.

NY/NJ/PHL Airspace Redesign EIS Noise Measurement Report
Landrum & Brown Appendix D September, 2005 Page D-9
Site 2 – Oliverea Residence – Site Description Measurement period Phase 1 measurement began Monday 12/3/01, and concluded Friday 12/7/01. Location Site 2 was located in the Caskill State Park region, on the west side of Route 47 (Oliverea Road) in Oliverea, NY. This location is approximately 95 miles north-northwest of the 3 major NYC airports. The property consisted of a small log cabin rental unit, a tall garage for equipment, and a residence. The sign at the driveway entrance indicated that the location was also used for business purposes. The monitor was placed approximately 40 yards north of the wood cabin, within the densely wooded area. Land Use The site was located within the mountains of Catskill State Park, a rural setting. Directly across the road, approximately 250 yards from the monitor was the Winnisook Club with 10-15 condominium buildings. The one substantial roadway near the site was Route 47 highway approximately 60 yards east of the monitor. Traffic levels were very low, with approximately 10 cars an hour passing during peak times. Ambient Noise The ambient noise level was very low at this site. A creek could be heard running very softly in the distance. Occasionally, wind picked up to moderate levels, adding to the ambient level. Non-Aircraft Noise Sources The major source of non-aircraft noise was the construction work being done across the road at the Winnisook Club. Some heavy machinery was being operated during the workday including what sounded like tractors and chainsaws. Also, the resident at the site location would occasionally do some work with a small tractor in the driveway. Cars passed on Oliverea Road approximately 10 times an hour creating an event of about 30 seconds. Aircraft Noise Sources Air traffic in the area was light with only about 6 aircraft events per hour. Some large jet traffic was observed in the distance, but the noise was usually not substantial. Flight paths for the large jets were usually located to the south of the site with traffic moving eastward, or to the east of the site with traffic moving southward. Propeller aircraft were also observed on these routes, but they would also occasionally fly closer to the measurement site and sometimes directly overhead.

NY/NJ/PHL Airspace Redesign EIS Noise Measurement Report
Landrum & Brown Appendix D September, 2005 Page D-10
Site 2 – Oliverea Residence – Noise Level Results
Site 2 - Cumulative Statistics Total Days 6 Total DNL 46.6 Aircraft DNL 23.2 Non-Aircraft DNL 46.6 L50 34.5 Aircraft Events / Day 3 Aircraft Lmax range 44.3 - 65.4
Site 2 - 10 Most Common Aircraft Noise Events Aircraft Type Operation Type Airport Number of Events C750 A KTEB 2 B733 O BWI 1 BE33 O XOVR 1 BE35 O XOVR 1 C182 O XOVR 1 C206 A KPNE 1 DH8A A KLGA 1 DH8A A KPHL 1 DH8A O BOS 1 F900 A KTEB 1
During the 6 days of measurement, 1295 flights flew within a distance of approximately 9 miles of Site 2. Of these flights 15 met the thresholds necessary to be called aircraft noise events. These events had Lmax levels ranging from 44.3 to 65.4 dBA. The most common types of aircraft noise events at this site are shown in the above table. Site 3 – Beaver Dam Sanctuary – Site Description Measurement period Phase 1 measurement began Monday 12/3/01, and concluded Friday 12/7/01. Phase 2 measurement began Monday 8/19/02, and concluded Friday 8/23/02. Location Site 3 was located at the north edge of Beaver Dam Sanctuary (Park) in Katonah, NY. This site is 34 miles north-northeast of La Guardia (LGA). The monitor was placed about 50 yards north of Beaver Dam Road just west of a horse riding trail in an area of vegetation overgrowth. Land Use The 220 acre Beaver Dam Sanctuary county park was located about 50 yards south of the monitor. A few homes were located about 50 yards east of the monitor, but the site was not a major residential area. Notable roadways in the vicinity were as follows:

NY/NJ/PHL Airspace Redesign EIS Noise Measurement Report
Landrum & Brown Appendix D September, 2005 Page D-11
1. Interstate 684 – major thoroughfare with heavy traffic 1/3 mile west of the monitor. 2. Beaver Dam Road – medium traffic road about 50 yards south of monitor. 3. Route 22 Highway – 300 yards northeast of monitor.
Ambient Noise The dominating aspect of the ambient noise during observation periods was the automobile traffic on I-684. Non-Aircraft Noise Sources Cars passed by on Beaver Dam Road at a frequent pace (about 45 per hour) creating events between 15 and 30 seconds in duration. Beaver Dam Road seemed to be on a route for work trucks – possibly going to a landfill. During Phase 1, many brief events were logged as “metal banging” and “construction”. Some short noise events could be contributed to the homes near the monitor. Aircraft Noise Sources Aircraft activity was observed with moderate frequency at this location, with about 18 events logged per hour. However, much of the aircraft noise was reported as indistinguishable from the traffic noise from I-684. The only substantial aircraft noise events were propeller driven aircraft at low altitudes. Site 3 – Beaver Dam Sanctuary – Noise Level Results
Site 3 - Cumulative Statistics Total Days 7 Total DNL 59.7 Aircraft DNL 46.2 Non-Aircraft DNL 59.5 L50 51.0 Aircraft Events / Day 39 Aircraft Lmax range 50.6 - 72.0
Site 3 - 10 Most Common Aircraft Noise Events Aircraft Type Operation Type Airport Number of Events A320 A LGA 6 E145 A LGA 6 B738 A LGA 5 AT43 A EWR 4 AEST D TEB 3 AEST A TEB 3 BE58 D TEB 3 BE58 A TEB 3 AT43 D EWR 2 BE19 D HPN 2

NY/NJ/PHL Airspace Redesign EIS Noise Measurement Report
Landrum & Brown Appendix D September, 2005 Page D-12
During the 7 days of measurement, 2165 flights flew within a ground distance of 3.8 miles of Site 3. Of these flights 276 met the thresholds necessary to be called aircraft noise events. These events had Lmax levels ranging from 50.6 to 72.0 dBA. The most common types of aircraft noise events at this site are shown in the above table. A large number of noise events were attributable to airport HPN, but did not have identifiable aircraft types. Site 4 – Stamford Residence – Site Description Measurement period Phase 1 measurement began Monday 12/3/01, and concluded Friday 12/7/01. Phase 2 measurement began Monday 8/19/02, and concluded Friday 8/23/02. Location Site 4 was a residence located on Cambridge Road; Stamford, CT. The site was located approximately 11 miles east of Westchester County Airport (HPN) and 27 miles northeast of LGA. The monitor was placed in the small backyard. During the summer measurement period an equipment malfunction was noted. The unit was able to be repaired in the field and was recalibrated and restarted. There was some loss of valid data resulting in 21-hours of valid data during Phase 2. Land Use The residence was located on the east edge of a fairly dense suburban neighborhood (about 2 homes per acre). To the east, there was one home and about 70 yards between the residence and the 200 acre Holly Pond. Nearby roadways were:
1. Weed Avenue – street about 50 yards east of monitor with heavy traffic. 2. Interstate 95 – located 3/5 mile northwest of monitor. 3. State Highway 1 – located ½ mile northeast of monitor.
Ambient Noise Weed Avenue received heavy traffic during the observation periods, causing the most background noise. Other nearby highway noise also contributed. The ambient was reported to consistently remain in the 50 – 60 dBA range. Non-Aircraft Noise Sources During Phase 1, the neighboring house was being remodeled creating periods of construction noise. Also, dogs barked occasionally during aircraft noise events. Only road traffic was noted during Phase 2. Aircraft Noise Sources The site received a moderate amount of air traffic (about 15 events logged per hour) much of which was small general aviation aircraft. Several identifiable traffic patterns were observed seemingly belonging to various airports.

NY/NJ/PHL Airspace Redesign EIS Noise Measurement Report
Landrum & Brown Appendix D September, 2005 Page D-13
Site 4 – Stamford Residence – Noise Level Results
Site 4 - Cumulative Statistics Total Days 3 Total DNL 54.2 Aircraft DNL 44.1 Non-Aircraft DNL 53.7 L50 46.0 Aircraft Events / Day 22 Aircraft Lmax range 53.7 - 72.8
Site 4 - 10 Most Common Aircraft Noise Events Aircraft Type Operation Type Airport Number of Events DH8A A LGA 5 B738 D LGA 3 DH8A D LGA 3 B190 A HPN 2 B744 D JFK 2 C560 A HPN 2 CL60 A HPN 2 JS41 A HPN 2 LJ35 A HPN 2 A319 D LGA 1
During the 3 days of measurement, 651 flights flew within a ground distance of 4.1 miles of Site 4. Of these flights 67 met the thresholds necessary to be called aircraft noise events. These events had Lmax levels ranging from 53.7 to 72.8 dBA. The most common types of aircraft noise events at this site are shown in the above table. Site 5 – Robert Moses State Park – Site Description Measurement period Phase 1 measurement began Monday 12/17/01, and concluded Friday 12/21/01. Phase 2 measurement began Monday 8/12/02, and concluded Friday 8/16/02. Location Site 5 was located on Fire Island, New York in Robert Moses State Park. This location is approximately 29 miles east of JFK, 12 miles southeast of Republic (FRG), and 13 miles south-southwest of Islip (ISP). The monitor was placed amongst some vegetation about 5 yards east of parking lot 5, and about 600 yards west of the Fire Island Lighthouse.

NY/NJ/PHL Airspace Redesign EIS Noise Measurement Report
Landrum & Brown Appendix D September, 2005 Page D-14
Land Use Fire Island is bordered by the Atlantic Ocean on the south and the Great South Bay on the north. The monitor was placed in the approximate north-south midpoint of the island with about 400 yards to either shore. Aside from the parking lot and boardwalk, the area is undeveloped, populated only by wildlife. The only applicable roadway was the extended Robert Moses Causeway which received very light traffic. Ambient Noise The surf of the ocean and the wind contributed to the ambient level which was reported to typically be between 45 and 50 dBA. Non-Aircraft Noise Sources There was very little non-aircraft noise generated at this site. Cars starting and moving in the parking lot were the source of most noise not attributable to aircraft, and these were infrequent occurrences. Also the weather station near the lighthouse created some noise. Frequent wind gusts were recorded several days during measurement. Aircraft Noise Sources Aircraft events were recorded with a frequency of 10-15 per hour. Most events were logged as high altitude with a high proportion being propeller driven aircraft. Site 5 – Robert Moses State Park – Noise Level Results
Site 5 - Cumulative Statistics Total Days 5 Total DNL 67.3 Aircraft DNL 45.1 Non-Aircraft DNL 67.3 L50 59.0 Aircraft Events / Day 12 Aircraft Lmax range 53.3 - 73.4

NY/NJ/PHL Airspace Redesign EIS Noise Measurement Report
Landrum & Brown Appendix D September, 2005 Page D-15
Site 5 - 10 Most Common Aircraft Noise Events Aircraft Type Operation Type Airport Number of Events B744 A JFK 6 B772 A JFK 6 DV20 O UNK 5 J328 A JFK 4 B763 A JFK 3 B737 O UNK 2 C172 O UNK 2 E135 A JFK 2 PA32 O UNK 2 A346 A JFK 1
During the 5 days of measurement, 595 flights flew within a ground distance of 3.8 miles of Site 5. Of these flights 59 met the thresholds necessary to be called aircraft noise events. These events had Lmax levels ranging from 53.3 to 73.4 dBA. The most common types of aircraft noise events at this site are shown in the above table. Site 6 – Harbor Island Park – Site Description Measurement period Phase 1 measurement began Monday 12/3/01, and concluded Friday 12/7/01. Phase 2 measurement began Monday 8/19/02, and concluded Friday 8/23/02. Location Site 6 was located in Harbor Island Park in Mamaroneck, NY. The site location was 8 miles south of Westchester (HPN) and 14 miles north-northeast of La-Guardia (LGA). The monitor was placed in a central location of the park, south of the tennis courts, next to an out building and a fence. A playground was located about 50 yards southeast of the monitor. Land Use Harbor Island Park is a community park with tennis courts, baseball fields, and playgrounds. It is about 40 acres in area and is bordered on 3 sides by Mamaroneck Harbor with docks for boats. The closest shore was about 100 yards southwest of the monitor. Nearby roadways were:
1. The small park roads and parking lots used by visitors to navigate through the park.
2. Boston Post Road – medium traffic road 300 yards northwest of monitor.

NY/NJ/PHL Airspace Redesign EIS Noise Measurement Report
Landrum & Brown Appendix D September, 2005 Page D-16
Ambient Noise The playground in the park was usually busy and created a steady background noise, along with the other noise typically made by people in the park. Roadway traffic noise along Boston Post Road also had some effect. Non-Aircraft Noise Sources Boats motoring in the harbor created several noise events. During Phase 1, some construction work was occurring near the park intermittently. During Phase 2, lawn mower noise was observed. Aircraft Noise Sources Air traffic was very heavy, with most events being air carrier traffic associated with one airport, probably La Guardia. About 30 aircraft events were logged per hour. There was a significant variety in the altitudes of the aircraft as they passed. Site 6 – Harbor Island Park – Noise Level Results
Site 6 - Cumulative Statistics Total Days 7 Total DNL 57.3 Aircraft DNL 47.8 Non-Aircraft DNL 56.8 L50 47.3 Aircraft Events / Day 71 Aircraft Lmax range 48.1 - 81.4
Site 6 - 10 Most Common Aircraft Noise Events Aircraft Type Operation Type Airport Number of Events DH8A A LGA 59 B738 A LGA 44 A320 A LGA 42 A319 A LGA 32 B738 D LGA 20 E145 A LGA 19 B190 A LGA 14 B752 A LGA 14 E135 A LGA 12 B735 D EWR 11
During the 7 days of measurement, 3052 flights flew within a ground distance of 3.1 miles of Site 6. Of these flights 494 met the thresholds necessary to be called aircraft noise events. These events had Lmax levels ranging from 48.1 to 81.4 dBA. The most common types of aircraft noise events at this site are shown in the above table.

NY/NJ/PHL Airspace Redesign EIS Noise Measurement Report
Landrum & Brown Appendix D September, 2005 Page D-17
Site 7a – Staten Island Residence (a) – Site Description Measurement period Phase 1 measurement began Monday 12/17/01, and concluded Friday 12/21/01. Location Site 7a was a residence in northwest Staten Island on South Avenue; Staten Island, NY. This location is 4 miles south-southeast of Newark Airport (EWR) and 4 miles east-northeast of Linden Airport (LDJ). The monitor was located near a fence behind the house on the edge of the driveway. During the measurement period an equipment malfunction was noted. The unit was able to be repaired in the field and was recalibrated and restarted. There was some loss of valid data resulting in only two full 24-hour periods of valid data. Land Use The neighborhood is very densely developed area with 3 - 4 homes per acre. The site is located about 300 yards south of Newark Bay across which is Newark Airport. Major roadways near the site were:
1. South Avenue – major arterial street located 30 yards east of site. 2. Interstate 278 – located about 1 mile southwest of site. 3. State Highway 440 – located about 1 mile east of site. 4. Many neighboring local streets.
Ambient Noise The ambient noise was primarily generated by road traffic around the site. Also, ground noise at Newark airport contributed to background noise. The ambient was reported as typically between 44 and 47 dBA during observation times. Non-Aircraft Noise Sources The vehicular traffic on South Avenue was heavy, but not consistent enough to create a constant background. About 200 vehicles passed per hour, usually around 40 mph. Aircraft Noise Sources This site received an abundance of air traffic, much of which was presumably associated with Newark. A wide variety of aircraft flew departure and arrival routes as recorded by the observers. On average, about 30 flights/hour were logged during observation times.

NY/NJ/PHL Airspace Redesign EIS Noise Measurement Report
Landrum & Brown Appendix D September, 2005 Page D-18
Site 7a – Staten Island Residence (a) – Noise Level Results
Site 7a - Cumulative Statistics Total Days 2 Total DNL 67.6 Aircraft DNL 66.3 Non-Aircraft DNL 61.5 L50 52.0 Aircraft Events / Day 308 Aircraft Lmax range 57.3 - 88.0
Site 7a - 10 Most Common Aircraft Noise Events Aircraft Type Operation Type Airport Number of Events B735 D EWR 60 B752 D EWR 58 E145 D EWR 34 B738 D EWR 30 MD80 D EWR 25 B72Q D EWR 22 B733 D EWR 20 E145 A EWR 20 B73G D EWR 16 B752 A EWR 16
During the 2 days of measurement, 1296 flights flew within a ground distance of 2.4 miles of Site 7a. Of these flights 615 met the thresholds necessary to be called aircraft noise events. These events had Lmax levels ranging from 57.3 to 88.0 dBA. The most common types of aircraft noise events at this site are shown in the above table. Site 7b – Staten Island Residence (b) – Site Description Measurement period Phase 2 measurement began Monday 8/12/02, and concluded Friday 8/16/02. Location Site 7b was a residence in northwest Staten Island on Martineau; Staten Island, NY. This location is 4 miles south-southeast of Newark Airport (EWR) and 4 miles east-northeast of Linden Airport (LDJ). The monitor was located in the backyard of the house. This location is only about 250 yards west of Site 7a.

NY/NJ/PHL Airspace Redesign EIS Noise Measurement Report
Landrum & Brown Appendix D September, 2005 Page D-19
Land Use The neighborhood is very densely developed area with 3-4 homes per acre. The site is located about 300 yards south of Newark Bay across which is Newark Airport. Major roadways near the site were:
1. Interstate 278 – located about 1 mile southwest of site. 2. State Highway 440 – located about 1 mile east of site. 3. Many neighboring local streets.
Ambient Noise The ambient noise was primarily generated by insect noise and road traffic around the site. The ambient was reported as typically in the middle 50’s. Non-Aircraft Noise Sources Construction in the neighborhood was noted on each day of observation. Other sources of noise from the neighborhood were music from apartment buildings, children playing, and barking dogs. Aircraft Noise Sources This site received an abundance of air traffic, most of which were jet departures from Newark. On average, about 37 flights/hour were logged during observation times. Site 7b – Staten Island Residence (b) – Noise Level Results
Site 7b - Cumulative Statistics Total Days 3 Total DNL 64.1 Aircraft DNL 62.7 Non-Aircraft DNL 58.7 L50 51.0 Aircraft Events / Day 244 Aircraft Lmax range 59.9 - 86.6
Site 7b - 10 Most Common Aircraft Noise Events Aircraft Type Operation Type Airport Number of Events B752 D EWR 76 MD80 D EWR 61 B735 D EWR 54 B738 D EWR 48 B733 D EWR 34 B72Q D EWR 27 DC93 D EWR 25 A306 D EWR 22 DC10 D EWR 22 B762 D EWR 21

NY/NJ/PHL Airspace Redesign EIS Noise Measurement Report
Landrum & Brown Appendix D September, 2005 Page D-20
During the 3 days of measurement, 3723 flights flew within a ground distance of 2.4 miles of Site 7b. Of these flights 732 met the thresholds necessary to be called aircraft noise events. These events had Lmax levels ranging from 59.9 to 86.8 dBA. The most common types of aircraft noise events at this site are shown in the above table. Site 8 – Carteret Residence – Site Description Measurement period Phase 2 measurement began Monday 8/12/02, and concluded Friday 8/16/02. Location Site 8 was a residence in northern Carteret, NJ on Charlotte Street. This location is 7.5 miles south-southwest of Newark Airport (EWR). The monitor was located in the backyard of the property. During the measurement period an equipment malfunction was noted. The unit was able to be repaired in the field and was recalibrated and restarted. There was some loss of valid data resulting in only two full 24-hour periods of valid data. Land Use The neighborhood is a suburban region with fairly densely spaced housing. The predominant roadway in the area is I-95 which is located about 0.4 miles west of the site. Ambient Noise The ambient sources noted by the observers were insect noise, faint roadway traffic, and air conditioning units of residences in the area. The ambient was observed to be typically in the upper 40’s and low 50’s. Non-Aircraft Noise Sources Typical sources of suburban neighborhood noise were observed including barking dogs, passing cars, and lawn mowers. Aircraft Noise Sources This site received an abundance of air traffic, much of which was presumably associated with Newark. Mostly departure routes were recorded by the observers. On average, about 20 flights/hour were logged during observation times.

NY/NJ/PHL Airspace Redesign EIS Noise Measurement Report
Landrum & Brown Appendix D September, 2005 Page D-21
Site 8 – Carteret Residence – Noise Level Results
Site 8 - Cumulative Statistics Total Days 2 Total DNL 66.1 Aircraft DNL 57.5 Non-Aircraft DNL 65.4 L50 52.0 Aircraft Events / Day 149 Aircraft Lmax range 55.1 - 83.1
Site 8 - 10 Most Common Aircraft Noise Events Aircraft Type Operation Type Airport Number of Events B738 D EWR 37 B735 D EWR 34 B752 D EWR 31 E145 D EWR 24 B733 D EWR 22 MD80 D EWR 14 B737 D EWR 10 DC93 D EWR 9 B722 D EWR 7 DC10 D EWR 7
During the 2 days of measurement, 1032 flights flew within a ground distance of 3.1 miles of Site 8. Of these flights 298 met the thresholds necessary to be called aircraft noise events. These events had Lmax levels ranging from 55.1 to 83.1 dBA. The most common types of aircraft noise events at this site are shown in the above table. Site 9 – Tourne Park – Site Description Measurement period Phase 1 measurement began Monday 12/10/01, and concluded Friday 12/14/01. Phase 2 measurement began Monday 8/26/02, and concluded Friday 8/30/02. Location Site 9 was located in Tourne Park in Boonton, NJ. This location is 8 miles north of Morristown (MMU) and 20 miles northwest of Newark (EWR). The monitor was in a central location of the park in the woods, about 100 yards from a baseball field and a small road through the park.

NY/NJ/PHL Airspace Redesign EIS Noise Measurement Report
Landrum & Brown Appendix D September, 2005 Page D-22
Land Use Tourne Park is a local park providing wilderness trails and some recreational facilities. The closest suburban area to the monitor was a residential neighborhood about 600 yards southeast of the monitor. There were no major roadways in the immediate vicinity. Ambient Noise Generally the site was quiet. Only weather, wildlife, and faint distant traffic noise contributed to the ambient levels. During Phase 2, insects were a major contributor. Non-Aircraft Noise Sources During both phases, construction events were reported ranging from 1 to 30 second intervals. On rare occasions cars would pass on the park road. Aircraft Noise Sources Aircraft events were rare with only 10-12 being recorded per hour. It was reported that most of these were only visual, and when aircraft noise was distinguishable, it was very faint. Most aircraft were high altitude and some distance away. Site 9 – Tourne Park – Noise Level Results
Site 9 - Cumulative Statistics Total Days 6 Total DNL 61.0 Aircraft DNL 48.5 Non-Aircraft DNL 60.8 L50 43.8 Aircraft Events / Day 124 Aircraft Lmax range 39.2 - 79.1
Site 9 - 10 Most Common Aircraft Noise Events Aircraft Type Operation Type Airport Number of Events B735 D EWR 28 B752 A EWR 24 B735 A EWR 17 E145 D EWR 16 GLF4 D TEB 16 B738 A EWR 15 B752 D EWR 15 E145 A EWR 14 DC93 D EWR 13 B733 A EWR 12
During the 6 days of measurement, 2880 flights flew within a ground distance of 3.1 miles of Site 9. Of these flights 744 met the thresholds necessary to be called aircraft noise events. These

NY/NJ/PHL Airspace Redesign EIS Noise Measurement Report
Landrum & Brown Appendix D September, 2005 Page D-23
events had Lmax levels ranging from 39.2 to 79.1 dBA. The most common types of aircraft noise events at this site are shown in the above table. Site 10 – Morristown National Historic Park – Site Description Measurement period Phase 1 measurement began Monday 12/10/01, and concluded Friday 12/14/01. Phase 2 measurement began Monday 8/26/02, and concluded Friday 8/30/02. Location Site 10 was located in the Jockey Hollow area of Morristown National Historic Park in Morristown, NJ. The site was located 7 miles west-southwest of Morristown (MMU) and 19 miles west-northwest of Newark (EWR). The monitor was placed approximately 100 yards northeast of the visitors center, in a wooded area surrounded by open fields, nature trails, and very lightly traveled roads. Land Use Jockey Hollow is located in the southwest corner of Morristown National Historic Park which spans approximately 2500 acres. The area is mostly wilderness and generally quiet. There was approximately 1 mile between the monitor and developed land in both the east and the west direction. The only major roadway was Interstate 287 located approximately 1 mile southeast of the site. Ambient Noise The ambient noise level was generally low. Contributors to the ambient were weather, wildlife, and traffic on I-287. During Phase 2, insects were a major contributor. Non-Aircraft Noise Sources Non-aircraft noise events were rarely reported. Occasionally, cars of park visitors would pass. Sometimes noise from pedestrian visitors or wildlife occurred. For one day during Phase 2, some heavy trucks were occasionally hauling loads through the park roads. Aircraft Noise Sources About 20 aircraft events were recorded per hour during observation times, with most being faint events. A fairly even mix of propeller and jet aircraft was noted.

NY/NJ/PHL Airspace Redesign EIS Noise Measurement Report
Landrum & Brown Appendix D September, 2005 Page D-24
Site 10 – Morristown National Historic Park – Noise Level Results
Site 10 - Cumulative Statistics Total Days 5 Total DNL 57.8 Aircraft DNL 47.4 Non-Aircraft DNL 57.4 L50 43.5 Aircraft Events / Day 126 Aircraft Lmax range 44.8 - 76.0
Site 10 - 10 Most Common Aircraft Noise Events Aircraft Type Operation Type Airport Number of Events B735 A EWR 50 E145 A EWR 37 MD80 D EWR 31 B752 A EWR 23 B733 A EWR 22 B735 D EWR 16 B738 A EWR 16 B772 A EWR 15 B73G A EWR 14 B738 D EWR 13
During the 5 days of measurement, 2054 flights flew within a ground distance of 2.4 miles of Site 10. Of these flights 632 met the thresholds necessary to be called aircraft noise events. These events had Lmax levels ranging from 44.8 to 76.0 dBA. The most common types of aircraft noise events at this site are shown in the above table. Site 11 – BWZ VOR – Site Description Measurement period Phase 1 measurement began Monday 12/10/01, and concluded Friday 12/14/01. Phase 2 measurement began Monday 8/26/02, and concluded Friday 8/30/02. Location Site 11 was the Broadway (BWZ) VOR/DME located on Schooley’s Mountain in New Jersey. The site is located 34 miles west-northwest of Newark (EWR). The monitor was placed on top of a hill in an open field surrounded by small wooded areas. The VOR/DME was located about 100 yards northeast of the monitor.

NY/NJ/PHL Airspace Redesign EIS Noise Measurement Report
Landrum & Brown Appendix D September, 2005 Page D-25
Land Use The monitor was in a rural location surrounded by woodlands and farmland. There were a few rural roads near the location but none received significant traffic. Ambient Noise Most of the time the site was quiet, with only wildlife and weather providing background noise. Insects were predominant during the second phase, as was a large amount of rainfall. Non-Aircraft Noise Sources During both phases, events were created by distant construction and farm equipment. Very few non-aircraft noise events were observed. On one day during the first phase a grain hopper ran constantly at a nearby farm creating a noise level consistently above 60 dB. Aircraft Noise Sources The site predictably received many overflights (22 per hour), dominated by commercial airline traffic. Most were traveling west at high altitude and created faint noise events of approximately 90 seconds in duration. Site 11 – BWZ VOR – Noise Level Results
Site 11 - Cumulative Statistics Total Days 5 Total DNL 60.7 Aircraft DNL 42.3 Non-Aircraft DNL 60.7 L50 47.3 Aircraft Events / Day 54 Aircraft Lmax range 46.8 - 75.6
Site 11 - 10 Most Common Aircraft Noise Events Aircraft Type Operation Type Airport Number of Events B735 A EWR 27 B752 A EWR 18 B738 A EWR 17 MD80 A EWR 16 B733 A EWR 15 E145 A EWR 15 DC10 A EWR 12 B73G A EWR 9 B752 D EWR 8 B72Q A EWR 6
During the 5 days of measurement, 1218 flights flew within a ground distance of 2.4 miles of Site 11. Of these flights 272 met the thresholds necessary to be called aircraft noise events.

NY/NJ/PHL Airspace Redesign EIS Noise Measurement Report
Landrum & Brown Appendix D September, 2005 Page D-26
These events had Lmax levels ranging from 46.8 to 75.6 dBA. The most common types of aircraft noise events at this site are shown in the above table. Site 12 – Twin Lights Historic Site – Site Description Measurement period Phase 1 measurement began Monday 12/10/01, and concluded Friday 12/14/01. Phase 2 measurement began Monday 8/26/02, and concluded Friday 8/30/02. Location Site 12 was located at the Twin Lights Historic Site in Highlands, NJ. This site is 20 miles south-southwest of JFK and 23 miles south-southeast of Newark (EWR). The monitor was located near an abandoned home on a wooded hillside east of the lighthouse building. Land Use The Twin Lights Historic Site is a 3-acre property with two lighthouses and visitor accommodations. The site is 400 yards west of the Sandy Hook Bay, and about 800 yards west of the Atlantic Ocean. To the south and southwest, the area is mostly wooded residential, while to the north is suburban development. The most prominent roadway was state highway 36 located approximately 200 yards northeast of the monitor. Ambient Noise The ambient noise could be partially attributed to auto traffic from nearby highway 36. Also, during both phases, there was some rainy, windy weather which contributed to the ambient noise. There was a substantial amount of insect noise during Phase 2. Non-Aircraft Noise Sources There was some noise attributable to boats in the bay east of the site. During the second phase, there was intermittent construction on the lighthouse towers. Aircraft Noise Sources About 12 aircraft events per hour were recorded during observation hours. The traffic was dominated by jets, most traveling north, presumably arrivals to NYC airports. Some aircraft were observed traveling south, possibly Newark or JFK departures.

NY/NJ/PHL Airspace Redesign EIS Noise Measurement Report
Landrum & Brown Appendix D September, 2005 Page D-27
Site 12 – Twin Lights Historic Site – Noise Level Results
Site 12 - Cumulative Statistics Total Days 7 Total DNL 62.2 Aircraft DNL 52.7 Non-Aircraft DNL 61.7 L50 52.5 Aircraft Events / Day 126 Aircraft Lmax range 49.8 - 93.3
Site 12 - 10 Most Common Aircraft Noise Events Aircraft Type Operation Type Airport Number of Events A320 A JFK 44 A320 D JFK 32 B762 D JFK 30 B744 A JFK 27 JS41 D JFK 26 B763 A JFK 25 B752 D JFK 22 B752 A JFK 22 B763 D JFK 22 A306 A JFK 17
During the 7 days of measurement, 2737 flights flew within a ground distance of 4.1 miles of Site 12. Of these flights 880 met the thresholds necessary to be called aircraft noise events. These events had Lmax levels ranging from 49.8 to 93.3 dBA. The most common types of aircraft noise events at this site are shown in the above table. Site 13 – Brandywine Battlefield Park – Site Description Measurement period Phase 1 measurement began Tuesday 12/18/01, and concluded Friday 12/21/01. Phase 2 measurement began Monday 8/12/02, and concluded Friday 8/16/02. Location Site 13 was located in the 500-acre Brandywine Battlefield Park in Chadds Ford, PA. This location is 17 miles west of Philadelphia International (PHL). The monitor was placed in the northeast corner of the park in an elevated open clearing.

NY/NJ/PHL Airspace Redesign EIS Noise Measurement Report
Landrum & Brown Appendix D September, 2005 Page D-28
Land Use The area surrounding the monitor was a state park with mostly hilly, wooded terrain. There were 3 residences located adjacent to the park perimeter. Approximately 1/3 mile to the south of the monitor was state highway 1, which was heavily traveled. There was one park access road, receiving very little traffic, and there was a railroad about 2/3 mile south of the monitor, which was used infrequently. Ambient Noise The main contributor to the ambient noise was the constant flow of traffic on highway 1. In addition, there was some rustling of tree and bush limbs during windy conditions. Insect noise was predominant in Phase 2. Non-Aircraft Noise Sources Very few non-aircraft events were reported. Occasionally a car would pass on the very lightly traveled access road. Wildlife and weather also contributed to a lesser degree. Aircraft Noise Sources About 12 aircraft events occurred per observation hour. The traffic was dominated by jets heading west, presumably departures from Philadelphia. Site 13 – Brandywine Battlefield Park – Noise Level Results
Site 13 - Cumulative Statistics Total Days 5 Total DNL 64.4 Aircraft DNL 53.2 Non-Aircraft DNL 64.1 L50 55.5 Aircraft Events / Day 31 Aircraft Lmax range 50.9 - 75.6
Site 13 - 10 Most Common Aircraft Noise Events Aircraft Type Operation Type Airport Number of Events B72Q D PHL 7 B722 D PHL 3 DC8Q D PHL 3 B735 A EWR 2 B741 D PHL 2 C208 O UNK 2 DH8A D LGA 2 A320 A LGA 1 A333 A JFK 1 B733 D PHL 1

NY/NJ/PHL Airspace Redesign EIS Noise Measurement Report
Landrum & Brown Appendix D September, 2005 Page D-29
During the 5 days of measurement, 1398 flights flew within a ground distance of 3.1 miles of Site 13. Of these flights 156 met the thresholds necessary to be called aircraft noise events. These events had Lmax levels ranging from 50.9 to 75.6 dBA. The most common types of aircraft noise events at this site are shown in the above table. A large number of aircraft noise events were attributable to airport PHL, but had unidentifiable aircraft types. Site 14 – Colts Neck Residence – Site Description Measurement period Phase 1 measurement began Monday 12/10/01, and concluded Friday 12/14/01. Phase 2 measurement began Monday 8/26/02, and concluded Friday 8/30/02. Location Site 14 was a residence located on Westminster Drive; Colts Neck, NJ. This location is 26 miles south of Newark (EWR). The monitor was placed in the back yard. Land Use The area was a sparsely populated residential setting, with about 10 homes in a 15 acre area. Most of the area was covered with wooded terrain or undeveloped cleared land. The most prominent roadway was Crine Road, a local road located about 250 yards north of the site. Ambient Noise Local traffic on nearby roads contributed to the ambient noise. During Phase 2, insect noise heavily influenced the ambient. Non-Aircraft Noise Sources Most non-aircraft noise events were caused by automobiles on Westminster Dr., or on Crine Road. These events were recorded 8 to 10 times an hour. There were some events resulting from nearby sawing and lawn mowing. During the second phase, the swimming pool filter periodically turned on providing a boosted ambient level. Aircraft Noise Sources The site received a fairly high amount of air traffic with about 20 aircraft events logged per hour. Planes were observed at a variety of altitudes, and most were bearing west. There seemed to be a wide variety of propeller and jet aircraft.

NY/NJ/PHL Airspace Redesign EIS Noise Measurement Report
Landrum & Brown Appendix D September, 2005 Page D-30
Site 14 – Colts Neck Residence – Noise Level Results
Site 14 - Cumulative Statistics Total Days 7 Total DNL 59.2 Aircraft DNL 43.0 Non-Aircraft DNL 59.1 L50 43.0 Aircraft Events / Day 79 Aircraft Lmax range 41.0 - 75.0
Site 14 - 10 Most Common Aircraft Noise Events Aircraft Type Operation Type Airport Number of Events B762 D JFK 51 MD80 D LGA 38 B763 D JFK 27 B752 D JFK 24 B752 D EWR 22 A320 D JFK 20 B738 D EWR 20 MD80 D JFK 14 B73Q D JFK 11 B735 D EWR 10
During the 7 days of measurement, 2551 flights flew within a ground distance of 3.1 miles of Site 14. Of these flights 551 met the thresholds necessary to be called aircraft noise events. These events had Lmax levels ranging from 41.0 to 75.0 dBA. The most common types of aircraft noise events at this site are shown in the above table. Site 15 – Ardencroft Residence – Site Description Measurement period Phase 1 measurement began Monday 12/17/01, and concluded Friday 12/21/01. Phase 2 measurement began Monday 8/12/02, and concluded Friday 8/16/02. Location The monitor was placed in the backyard of a residence on Upsand Downs Lane.; Ardencroft, DE. This location is 14 miles west-southwest of Philadelphia International (PHL). Land Use The residence was on the south end of a typical suburban neighborhood. Sparse woods surrounded the area. A school was located about 300 yards to the west and a railroad was located about 300 yards to the southeast. Relevant roadways were:

NY/NJ/PHL Airspace Redesign EIS Noise Measurement Report
Landrum & Brown Appendix D September, 2005 Page D-31
1. Interstate 95 – about 400 yards southeast of monitor. 2. Upsand Downs Lane – small residential street located approximately 40 yards from
monitor with very little traffic. 3. Veale Road – more heavily traveled city street located about 200 yards northeast of
monitor. 4. Harvey Road – more heavily traveled city street located about 200 yards northwest of
monitor. 5. Several other small city streets around the measurement area.
Ambient Noise The ambient noise in the area was primarily generated by the local road traffic around the site. During Phase 2, insects heavily influenced the ambient. Non-Aircraft Noise Sources Intermittent sources of noise included train and local vehicular traffic, distant hammering, intermittent distant leaf blowing, tree rustling sound due to winding conditions. The resident mowed the lawn on one afternoon during Phase 2. Aircraft Noise Sources Approximately 10 aircraft events were recorded per hour. Jet traffic dominated, with most flights being identifiable as arrival or departure routes to or from Philadelphia. Site 15 – Ardencroft Residence – Noise Level Results
Site 15 - Cumulative Statistics Total Days 6 Total DNL 60.9 Aircraft DNL 49.4 Non-Aircraft DNL 60.6 L50 51.3 Aircraft Events / Day 57 Aircraft Lmax range 50.5 - 86.1

NY/NJ/PHL Airspace Redesign EIS Noise Measurement Report
Landrum & Brown Appendix D September, 2005 Page D-32
Site 15 - 10 Most Common Aircraft Noise Events Aircraft Type Operation Type Airport Number of Events B733 D PHL 19 B733 A PHL 15 MD80 D PHL 11 B72Q D PHL 10 A319 A PHL 8 A320 A PHL 8 A319 D PHL 5 B734 D PHL 5 B734 A PHL 5 B752 D PHL 5
During the 6 days of measurement, 3052 flights flew within a ground distance of 3.8 miles of Site 15. Of these flights 339 met the thresholds necessary to be called aircraft noise events. These events had Lmax levels ranging from 50.5 to 86.1 dBA. The most common types of aircraft noise events at this site are shown in the above table. A large number of aircraft noise events were attributable to airport PHL, but had unidentifiable aircraft types. Site 16 – Garden City Residence – Site Description Measurement period Phase 1 measurement began Monday 12/17/01, and concluded Friday 12/21/01. Phase 2 measurement began Monday 8/12/02, and concluded Friday 8/16/02. Location Site 16 was a residence on Dartmouth Street; Garden City, NY. This location is 8 miles northeast of JFK and 11 miles east-southeast of La Guardia (LGA). The monitor was placed in the backyard. Land Use Garden City is a densely populated suburban area with 3-4 homes per acre. JFK airport is approximately 7 miles southwest and La Guardia is located approximately 10 miles northwest of the monitor. A city train route was located about ½ mile north of the site. There were no major highways near the monitor, but certainly the site is surrounded by a grid of fairly well traveled local streets.

NY/NJ/PHL Airspace Redesign EIS Noise Measurement Report
Landrum & Brown Appendix D September, 2005 Page D-33
Ambient Noise The ambient noise was caused mostly by auto traffic around the site, along with the background noise sources typical of a dense suburban neighborhood. Insects were a major contributor to ambient noise during the second phase. Non-Aircraft Noise Sources The main non-aircraft noise sources were cars passing by on Dartmouth Street and trains. Trains passed about 10 times per hour, usually creating noise events with maximums of about between 50 and 55 dBA. Aircraft Noise Sources About 10 aircraft events were logged per hour. It is unclear whether distinct routes could be identified and also unclear what distribution of aircraft types caused events. Site 16 – Garden City Residence – Noise Level Results
Site 16 - Cumulative Statistics Total Days 6 Total DNL 59.0 Aircraft DNL 52.6 Non-Aircraft DNL 57.8 L50 49.0 Aircraft Events / Day 61 Aircraft Lmax range 43.0 - 82.6
Site 16 - 10 Most Common Aircraft Noise Events Aircraft Type Operation Type Airport Number of Events B763 A JFK 39 B772 A JFK 25 B744 A JFK 17 A343 A JFK 14 B742 A JFK 14 SF34 D JFK 14 SF34 A JFK 13 A332 A JFK 9 A333 A JFK 9
During the 6 days of measurement, 1475 flights flew within a ground distance of 3.8 miles of Site 16. Of these flights 367 met the thresholds necessary to be called aircraft noise events. These events had Lmax levels ranging from 43.0 to 82.6 dBA. The most common types of aircraft noise events at this site are shown in the above table.

NY/NJ/PHL Airspace Redesign EIS Noise Measurement Report
Landrum & Brown Appendix D September, 2005 Page D-34
V. Summary A two-phase noise measurement program was conducted as part of the NY/NJ/PHL/ Airspace Redesign EIS study. The program was undertaken to provide samples of real field noise levels at 16 sites throughout a 30,000+ square mile study are for both winter and summer conditions. In most cases the exact same locations were measured for both the summer and winter phases of the program; however, due to logistical issues, two locations were measured at slightly different sites during the second phase along with one new site that was unavailable during the first phase. The primary focus of the measurement program was to collect and calculate a sampling of day/night average noise levels (DNL) at each specific site. In addition to the total DNL at each monitoring site, several other metrics were also computed from the measured data as supplemental information. Radar flight track data was also collected during the measurement periods so that aircraft overflights could be correlated with noise levels on the ground at each site. Table 3 provides a summary of the noise levels recorded during the measurement period for each site. The data for each site is presented in terms of the average DNL values for each phase of the measurement program, as well as the cumulative DNL value for the entire measurement duration at the site. Similarly, the L50 values for each site are also presented.
Table 3 Noise Measurement Summary
Measured DNL Measured L50
Site Phase I
Phase II Avg
Phase I
Phase II Avg
1a 40.5 N/A 40.5 31.0 N/A 31.0 1b N/A 62.7 62.7 N/A 47.0 47.0 2 44.1 48.2 46.6 34.0 35.0 34.5 3 60.5 58.8 59.7 53.0 49.0 51.0 4 54.2 N/A 54.2 46.0 N/A 46.0 5 68.9 64.8 67.3 63.0 55.0 59.0 6 56.9 57.7 57.3 49.5 45.0 47.3 7a 67.6 N/A 67.6 52.0 N/A 52.0 7b N/A 64.1 64.1 N/A 51.0 51.0 8 N/A 66.1 66.1 N/A 52.0 52.0 9 50.5 63.9 61.0 40.0 47.5 43.8 10 50.7 60.4 57.8 41.0 46.0 43.5 11 50.7 63.5 60.7 41.5 53.0 47.3 12 57.4 64.5 62.2 51.0 54.0 52.5 13 57.1 67.0 64.4 51.0 60.0 55.5 14 47.1 62.0 59.2 39.0 47.0 43.0 15 55.4 63.3 60.9 47.5 55.0 51.3 16 56.1 60.7 59.0 45.0 53.0 49.0 Source: Landrum & Brown Analysis, 2002-05

NY/NJ/PHL Airspace Redesign EIS Noise Measurement Report
Landrum & Brown Appendix D September, 2005 Page D-35
It should be noted that both the measured Total DNL and the L50 values collected during Phase II tended to be somewhat higher than the Phase I values at most sites. A detailed analysis of the data and the site observation logs indicate that insect noise (primarily cicadas) during the summer measurement period was a significant contributor to the higher noise level recordings. Table 4 presents a summary of the noise levels associated with the correlated aircraft radar track events for each measurement site. The number of days correlated, the average number of aircraft events correlated, and the range of the maximum aircraft noise levels are presented along with the DNL noise values. The time and duration of each correlated aircraft event was used to separate out the aircraft noise from other noise recorded during each observation period. This allowed for the calculation of the DNL noise levels associated with only the aircraft events for comparison against the DNL levels from other sources during the observation periods. Table 4 Aircraft Event Noise Correlation Summary
Site Days Correlated
Avg Aircraft Correlated per Day
Aircraft LAMAX Range (dBA)
Aircraft DNL
Non Aircraft DNL
Total Site DNL
1a 4 15 37.6 – 67.1 25.5 40.3 40.5 1b 2 5 54.3 – 64.8 26.9 62.7 62.7 2 6 3 44.3 -65.4 23.2 46.6 46.6 3 7 39 50.6 - 72.0 46.2 59.5 59.7 4 3 22 53.7 - 72.8 44.1 53.7 54.2 5 5 12 53.3 - 73.4 45.1 67.3 67.3 6 7 71 48.1 - 81.4 47.8 56.8 57.3 7a 2 308 57.3 - 88.0 66.3 61.5 67.6 7b 3 244 59.9 - 86.6 62.7 58.7 64.1 8 2 149 55.1 - 83.1 57.5 65.4 66.1 9 6 124 39.2 - 79.1 48.5 60.8 61.0 10 5 126 44.8 - 76.0 47.4 57.4 57.8 11 5 54 46.8 - 75.6 42.3 60.7 60.7 12 7 126 49.8 - 93.3 52.7 61.7 62.2 13 5 31 50.9 - 75.6 53.2 64.1 64.4 14 7 79 41.0 - 75.0 43.0 59.1 59.2 15 6 57 50.5 - 86.1 49.4 60.6 60.9 16 6 61 43.0 - 82.6 52.6 57.8 59.0
Source: Landrum & Brown Analysis, 2002-05 Overall, the program collected some 88 site-day’s of noise level data throughout the two phases of the program. During the measurement periods there were some 32,289 aircraft overflights near the measurement sites with some 6,567 of those being correlated to measured noise events at the time of the overflights. For all of the sites, through both phases of measurements, the maximum noise levels correlated to aircraft overflights ranged from 37.6dB to 93.3 dB. The site average for the lower end of the range was 48.9 dB and 77.7 dB for the upper end of the range.

NY/NJ/PHL Airspace Redesign EIS Noise Measurement Report
Landrum & Brown Appendix D September, 2005 Page D-36
These findings provide general context of background and cumulative noise levels in which any changes in modeled noise exposure resulting from an airspace alteration can be considered. Although the noise levels presented represent actual measured noise, it should be noted that they are merely samples of noise for relative small periods of time at a limited number of locations.