Appendix D: Geotechnical Investigation and Paleontological ...
78
South Bascom Gateway Station Initial Study/Mitigated Negative Declaration City of San José June 2019 Appendix D: Geotechnical Investigation and Paleontological Records Search
Transcript of Appendix D: Geotechnical Investigation and Paleontological ...

South Bascom Gateway Station Initial Study/Mitigated Negative Declaration City of San José June 2019
Appendix D: Geotechnical Investigation and Paleontological Records
Search

THIS PAGE INTENTIONALLY LEFT BLANK
South Bascom Gateway Station Initial Study/Mitigated Negative Declaration City of San José June 2019
D-1: Geotechnical Investigation

THIS PAGE INTENTIONALLY LEFT BLANK

Prepared for Bay West Development
GEOTECHNICAL INVESTIGATION
PROPOSED MIXED-USE DEVELOPMENT
1410 SOUTH BASCOM AVENUE
SAN JOSE, CALIFORNIA
UNAUTHORIZED USE OR COPYING OF THIS DOCUMENT IS STRICTLY
PROHIBITED BY ANYONE OTHER THAN THE CLIENT FOR THE SPECIFIC
PROJECT
March 23, 2018
Project No. 18-1437

March 23, 2018
Project No. 18-1437
Mr. Pete Beritzhoff
Bay West Development
2 Henry Adams Street
Suite #2M-33
San Francisco, CA 94103
Subject: Geotechnical Investigation Report
Proposed Mixed Use Development
1410 South Bascom Avenue
San Jose, California
Dear Mr. Beritzhoff:
We are pleased to present the results of our geotechnical investigation for the proposed
mixed-use development to be constructed at 1410 South Bascom Avenue in San Jose,
California. Our services were provided in accordance with our proposal dated January 9,
2018.
The site is triangular shaped parcel encompassing an area of about 6.4 acres. It is
bordered by South Bascom Avenue to the west, VTA rail tracks and station platform to
the southeast, and commercial and residential properties to the north. The site is
currently occupied by multiple single-story commercial buildings and an asphalt-paved
parking lot. The ground surface elevation at the site varies by about five feet, sloping
downward gently to the north.
Based on our review of the preliminary project drawings, titled Gateway Station –
Planned Development Zoning, PDZ Application Submittal, prepared by WRNS Studio
and KTGY Architects, dated October 12, 2017, we understand plans are to construct an
eight-story residential building (“Building A”) on the northern half of the site and a six-
story office building (“Building B”) on the southern portion of the site. The residential
building will consist of five stories of wood-framed residential units over a four-story
concrete podium with one below-grade level. The lower three levels of the podium
structure will mostly house parking and the upper level of the podium structure will
contain residential units. The office building will consist of six levels of office space
over two below-grade parking levels. The below-grade parking associated with the office
building will also extend beneath an at-grade plaza area in the central portion of the site,
between the residential and office structures. The below-grade levels beneath the
buildings will be constructed adjacent to each other. The development plan also includes
plazas, landscaping areas, and exterior concrete flatwork.

Mr. Pete Beritzhoff
Bay West Development
March 23, 2018
Page 2
From a geotechnical standpoint, we conclude the site can be developed as planned,
provided the recommendations presented in this report are incorporated into the project
plans and specifications and implemented during construction. The primary geotechnical
issues affecting the proposed development include providing adequate foundation support
for the proposed buildings and providing suitable lateral support for the proposed
excavation while minimizing impacts to the surrounding improvements, including
neighboring buildings, sidewalks, rail tracks, and roadways.
Provided the estimated settlements in this report are acceptable, we conclude the
buildings may be supported on a shallow foundation system consisting of either
conventional spread footings with a slab-on-grade or on a stiffened mat foundation.
Feasible methods of temporary shoring during excavation include soil nails and soldier
pile-and-lagging system. The most appropriate method will depend on the final
excavation depth and setback from adjacent property lines.
Our report contains specific recommendations regarding earthwork and grading,
foundation design, and other geotechnical issues. The recommendations contained in our
report are based on limited subsurface exploration. Consequently, variations between
expected and actual soil conditions may be found in localized areas during construction.
Therefore, we should be engaged to observe foundation and shoring installation, grading,
and fill placement, during which time we may make changes in our recommendations, if
deemed necessary.
We appreciate the opportunity to provide our services to you on this project. If you have
any questions, please call.
Sincerely,
ROCKRIDGE GEOTECHNICAL, INC.
Clayton J. Proto, P.E. Logan D. Medeiros, P.E., G.E.
Project Engineer Senior Engineer
Enclosure

TABLE OF CONTENTS
1.0 INTRODUCTION ...............................................................................................................1
2.0 SCOPE OF SERVICES .......................................................................................................2
3.0 FIELD INVESTIGATION ..................................................................................................2 3.1 Cone Penetration Tests ............................................................................................3 3.2 Test Borings .............................................................................................................3
3.3 Laboratory Testing ...................................................................................................5
4.0 SUBSURFACE CONDITIONS AND SITE GEOLOGY ...................................................5
4.1 Subsurface Soil Conditions ......................................................................................5 4.2 Groundwater Conditions ..........................................................................................5
5.0 SEISMIC CONSIDERATIONS ..........................................................................................6
5.1 Regional Seismicity and Faulting ............................................................................6 5.2 Geologic Hazards .....................................................................................................9
5.2.1 Ground Shaking .........................................................................................10 5.2.2 Liquefaction and Associated Hazards ........................................................10 5.2.3 Cyclic Densification...................................................................................10
5.2.4 Fault Rupture .............................................................................................11
6.0 DISCUSSION AND CONCLUSIONS .............................................................................11 6.1 Foundations and Settlement ...................................................................................11 6.2 Excavation Support ................................................................................................12
6.3 Construction Considerations ..................................................................................14 6.4 Soil Corrosivity ......................................................................................................14
7.0 RECOMMENDATIONS ...................................................................................................15 7.1 Site Preparation and Grading .................................................................................15
7.1.1 Fill Materials and Compaction Criteria .....................................................16 7.1.2 Soil Subgrade Stabilization ........................................................................17 7.1.3 Utility Trench Excavations and Backfill ....................................................18
7.1.4 Drainage and Landscaping .........................................................................19 7.2 Foundation Design .................................................................................................20
7.2.1 Spread Footings .........................................................................................20 7.2.2 Mat Foundations ........................................................................................21
7.3 Floor Slabs .............................................................................................................21 7.4 Permanent Below-Grade Walls ..............................................................................23 7.5 Temporary Cut Slopes and Shoring .......................................................................24
7.5.1 Soil Nail Walls ...........................................................................................25

7.5.2 Soldier Pile-and-Lagging Shoring System.................................................28 7.5.3 Construction Monitoring ............................................................................31
7.6 Seismic Design.......................................................................................................31
8.0 GEOTECHNICAL SERVICES DURING CONSTRUCTION ........................................32
9.0 LIMITATIONS ..................................................................................................................32
REFERENCES
FIGURES
APPENDIX A – Cone Penetration Test Results
APPENDIX B – Logs of Borings
APPENDIX C – Laboratory Test Results
LIST OF FIGURES
Figure 1 Site Location Map
Figure 2 Site Plan
Figure 3 Regional Geologic Map
Figure 4 Regional Fault Map
Figure 5 Seismic Hazards Zone Map
APPENDIX A
Figures A-1 Cone Penetration Test Results CPT-1
through A-8 through CPT-8
APPENDIX B
Figures B-1 Logs of Borings B-1
through B-3 through B-3
Figure B-4 Classification Chart
APPENDIX C
Figure C-1 Plasticity Chart
Corrosivity Test Results

18-1437 1 March 23, 2018
GEOTECHNICAL INVESTIGATION
PROPOSED MIXED-USE DEVELOPMENT
1410 SOUTH BASCOM AVENUE
San Jose, California
1.0 INTRODUCTION
This report presents the results of the geotechnical investigation performed by Rockridge
Geotechnical, Inc. for the proposed mixed-use development to be constructed at 1410 South
Bascom Avenue in San Jose, California. The site is a triangular shaped parcel encompassing an
area of about 6.4 acres. It is bordered by South Bascom Avenue to the west, VTA rail tracks and
station platform to the southeast, and commercial and residential properties to the north, as
shown on Figure 1, Site Location Map. The site is currently occupied by multiple single-story
commercial buildings and an asphalt-paved parking lot. The ground surface elevation at the site
varies by about five feet, sloping downward gently to the north.
Based on our review of the preliminary project drawings, titled Gateway Station – Planned
Development Zoning, PDZ Application Submittal, prepared by WRNS Studio and KTGY
Architects, dated October 12, 2017, we understand plans are to construct an eight-story
residential building (“Building A”) on the northern half of the site and a six-story office building
(“Building B”) on the southern portion of the site. The residential building will consist of five
stories of wood-framed residential units over a four-story concrete podium with one below-grade
level. The lower three levels of the podium structure will mostly house parking and the upper
level of the podium structure will contain residential units. The office building will consist of six
levels of office space over two below-grade parking levels. The below-grade parking associated
with the office building will also extend beneath an at-grade plaza area in the central portion of
the site, between the residential and office structures. The below-grade levels beneath the
buildings will be constructed adjacent to each other. The development plan also includes plazas,
landscaping areas, and exterior concrete flatwork.

18-1437 2 March 23, 2018
2.0 SCOPE OF SERVICES
Our geotechnical investigation was performed in accordance with our proposal dated January 9,
2018. The objective of our investigation was to evaluate subsurface conditions at the site and
develop conclusions and recommendations regarding the geotechnical aspects of the proposed
project. Our scope of work consisted of evaluating subsurface conditions at the site by drilling
three exploratory borings, advancing eight cone penetration tests (CPTs) and performing
engineering analyses to develop conclusions and recommendations regarding:
soil and groundwater conditions beneath the site
site seismicity and seismic hazards, including the potential for liquefaction and
liquefaction-induced ground failure
the most appropriate foundation type(s) for the proposed buildings
design criteria for the recommended foundation type(s), including vertical and lateral
capacities
estimates of static and seismically-induced foundation settlement
subgrade preparation for pavements and exterior concrete flatwork
recommended design groundwater elevation
site grading and excavation, including criteria for fill quality and compaction
excavation shoring design parameters
soil corrosivity
2016 California Building Code (CBC) site class and design spectral response acceleration
parameters
construction considerations
3.0 FIELD INVESTIGATION
Subsurface conditions at the site were investigated by drilling three borings, advancing eight
CPTs, and performing laboratory testing on select soil samples. Prior to our field investigation,
we contacted Underground Service Alert (USA) to notify them of our work, as required by law,
and retained Precision Locating, LLC, a private utility locator, to check that the boring and CPT
18-1437 3 March 23, 2018
locations were clear of existing underground utilities. Details of the field investigation and
laboratory testing are described below.
3.1 Cone Penetration Tests
CPT-1 through CPT-8 were advanced on January 25, 2018 by Middle Earth Geo Testing, Inc.
(Middle Earth) of Orange, California. The approximate locations of the CPTs are shown on the
Site Plan, Figure 2. CPT-1 was advanced to a depth of 44-1/2 feet bgs, however, the remaining
seven CPTs encountered practical refusal at depths between 29 and 42 feet bgs
The CPTs were performed using a truck-mounted rig hydraulically pushing a 1.7-inch-diameter
cone-tipped probe into the ground. The probe measured tip resistance, pore water pressure, and
frictional resistance on a sleeve behind the cone tip. Electrical sensors within the cone
continuously measured these parameters for the entire depth advanced, and the readings were
digitized and recorded by a computer. Accumulated data were processed by computer to provide
engineering information such as soil behavior types, correlated strength characteristics, and
estimated liquefaction resistance of the soil encountered. The CPT logs, showing normalized tip
resistance, friction ratio, pore water pressure, and soil behavior type, are attached in Appendix A.
Upon completion, the CPT holes were backfilled with neat cement grout and the pavement was
patched with cold-mix asphalt.
3.2 Test Borings
Subsurface conditions at the site were explored by drilling three geotechnical borings, each to a
depth of 44-1/2 feet. The borings, designated B-1 through B-3, were drilled on January 23, 2018
by Exploration GeoServices of San Jose, California at the approximate locations on the Site Plan,
Figure 2. Exploration GeoServices drilled the borings using a Mobile B-56 truck-mounted drill
rig equipped with hollow-stem augers. During drilling, our field engineer logged the soil
encountered and obtained representative samples for visual classification and laboratory testing.
The boring logs are presented in Appendix B on Figures B-1 through B-3. The soil encountered
in the borings was classified in accordance with the classification chart shown on Figure B-4.

18-1437 4 March 23, 2018
Soil samples were obtained using the following samplers:
Sprague and Henwood (S&H) split-barrel sampler with a 3.0-inch outside diameter and
2.5-inch inside diameter, lined with 2.43-inch inside diameter stainless steel tubes
Standard Penetration Test (SPT) split-barrel sampler with a 2.0-inch outside and 1.5-inch
inside diameter, without liners.
Shelby Tube (ST) thin-walled stainless steel tubes with 2.875-inch inside diameter.
The type of sampler used was selected based on soil type and the desired sample quality for
laboratory testing. In general, the S&H sampler was used to obtain samples in medium stiff to
very stiff cohesive soil and the SPT sampler was used to evaluate the relative density of granular
soils. The Shelby tubes were used to obtain relatively undisturbed samples of medium stiff to
stiff fine-grained soils. The S&H and SPT samplers were driven with a 140-pound, downhole,
wireline hammer falling about 30 inches per drop. The samplers were driven up to 18 inches and
the hammer blows required to drive the samplers were recorded every six inches and are
presented on the boring logs. A “blow count” is defined as the number of hammer blows per six
inches of penetration or 50 blows for six inches or less of penetration. The blow counts required
to drive the S&H and SPT samplers were converted to approximate SPT N-values using factors
of 0.7 and 1.2, respectively, to account for sampler type, approximate hammer energy, and the
fact that the SPT sampler was designed to accommodate liners, but liners were not used. The
blow counts used for this conversion were the last two blow counts. The converted SPT N-
values are presented on the boring logs. The Shelby tubes were slowly advanced using the
weight of the drill rods and hydraulic pressure, as needed.
Upon completion, the borings were backfilled with cement grout and the pavement surface was
patched with quickset concrete. The drilling spoils generated during drilling were drummed and
temporarily stored onsite. A representative sample of the drum contents was submitted to a
laboratory for analytical testing, found to be non-hazardous, and scheduled for disposal at an
appropriate landfill facility.

18-1437 5 March 23, 2018
3.3 Laboratory Testing
We re-examined each soil sample in the office to confirm the field classification and select
representative samples for laboratory testing. Geotechnical laboratory tests were performed on
soil samples to assess their engineering properties and physical characteristics. Soil samples
were tested by B. Hillebrandt Soils Testing, Inc. of Alamo, California to measure moisture
content, dry density, plasticity (Atterberg limits), and fines content. Corrosivity testing of a
sample of near-surface soil was performed by Project X Corrosion of Murrieta, California. The
results of the geotechnical laboratory tests are presented on the boring logs in Appendix A and in
Appendix C.
4.0 SUBSURFACE CONDITIONS AND SITE GEOLOGY
This section summarizes subsurface conditions at the site based on available geologic data from
others and subsurface information from this investigation.
4.1 Subsurface Soil Conditions
As presented on Figure 3, the Regional Geologic Map, the site is mapped in a zone of alluvial
deposits (Qha) of the Holocene epoch (11 thousand years ago to present) (Graymer, 2006).
Alluvial fan deposits generally consist of a mixture of fine-grained and coarse-grained deposits.
Based on the results of our geotechnical investigation, we conclude that the site is generally
underlain by clay with varying sand content to a depth ranging from about 24 to 29 feet bgs. The
clay is typically stiff to very stiff with occasional soft to medium stiff zones. The clay is
underlain by dense to very dese sands and gravels to the maximum depth explored of 44-1/2 feet.
4.2 Groundwater Conditions
Groundwater was not encountered during our investigation. According to the document titled
Seismic Hazard Zone Report for the San Jose West 7.5-Minute Quadrangle, Santa Clara County,
California, prepared by the California Geological Survey (CGS) and dated 2002, the historic

18-1437 6 March 23, 2018
high groundwater level at the site is deeper than 50 feet bgs, the maximum depth included in the
report.
To help estimate the highest potential groundwater level at the site, we reviewed information on
the State of California Water Resources Control Board GeoTracker website
(http://geotracker.waterboards.ca.gov/). The closest monitoring well with groundwater data on
the GeoTracker website is near the intersection of Hamilton and Leigh avenues, approximately
3,000 feet southeast of the site (Well ID: 07S01W25L001M). The groundwater level at this well
was measured at 1- to 3-month intervals from 2011 to 2016. Measured groundwater levels
ranged from 74 to 137 feet bgs. The next-closest site listed on GeoTracker is located at 1030
Leigh Avenue, approximately 3,200 feet northeast of the 1410 South Bascom Avenue site. The
shallowest observed groundwater at this location is approximately 73 feet bgs.
5.0 SEISMIC CONSIDERATIONS
The San Francisco Bay Area is considered to be one of the more seismically active regions in the
world. We evaluated the potential for earthquake-induced geologic hazards including ground
shaking, ground surface rupture, liquefaction,1 lateral spreading,2 cyclic densification3. The
results of our evaluation regarding seismic considerations for the project site are presented in the
following sections.
5.1 Regional Seismicity and Faulting
The site is located in the Coast Ranges geomorphic province of California that is characterized
by northwest-trending valleys and ridges. These topographic features are controlled by folds and
faults that resulted from the collision of the Farallon plate and North American plate and
1 Liquefaction is a phenomenon where loose, saturated, cohesionless soil experiences temporary
reduction in strength during cyclic loading such as that produced by earthquakes. 2 Lateral spreading is a phenomenon in which surficial soil displaces along a shear zone that has
formed within an underlying liquefied layer. Upon reaching mobilization, the surficial blocks are
transported downslope or in the direction of a free face by earthquake and gravitational forces. 3 Cyclic densification is a phenomenon in which non-saturated, cohesionless soil is compacted by
earthquake vibrations, causing ground-surface settlement.

18-1437 7 March 23, 2018
subsequent strike-slip faulting along the San Andreas fault system. The San Andreas fault is
more than 600 miles long from Point Arena in the north to the Gulf of California in the south.
The Coast Ranges province is bounded on the east by the Great Valley and on the west by the
Pacific Ocean.
The major active faults in the area are the Monte Vista-Shannon, San Andreas, and Hayward
faults. These and other faults of the region are shown on Figure 4. The fault systems in the Bay
Area consist of several major right-lateral strike-slip faults that define the boundary zone
between the Pacific and the North American tectonic plates. Numerous damaging earthquakes
have occurred along these fault systems in recorded time. For these and other active faults
within a 50-kilometer radius of the site, the distance from the site and estimated mean
characteristic moment magnitude4 [Working Group on California Earthquake Probabilities
(WGCEP, 2008) and Cao et al. (2003)] are summarized in Table 1.
4 Moment magnitude is an energy-based scale and provides a physically meaningful measure of the
size of a faulting event. Moment magnitude is directly related to average slip and fault rupture area.
18-1437 8 March 23, 2018
TABLE 1
Regional Faults and Seismicity
Fault Segment
Approximate
Distance from
Site (km)
Direction from
Site
Mean
Characteristic
Moment
Magnitude
Monte Vista-Shannon 6.6 Southwest 6.50
N. San Andreas - Peninsula 14 Southwest 7.23
N. San Andreas (1906 event) 14 Southwest 8.05
N. San Andreas - Santa Cruz 15 Southwest 7.12
Total Calaveras 19 East 7.03
Total Hayward 19 Northeast 7.00
Total Hayward-Rodgers Creek 19 Northeast 7.33
Zayante-Vergeles 24 South 7.00
San Gregorio Connected 38 West 7.50
Greenville Connected 41 East 7.00
Monterey Bay-Tularcitos 45 Southwest 7.30
Mount Diablo Thrust 49 North 6.70
In the past 200 years, four major earthquakes (i.e., Magnitude > 6) have been recorded on the
San Andreas fault. In 1836, an earthquake with an estimated maximum intensity of VII on the
Modified Mercalli (MM) Intensity Scale occurred east of Monterey Bay on the San Andreas fault
(Toppozada and Borchardt, 1998). The estimated moment magnitude, Mw, for this earthquake is
about 6.25. In 1838, an earthquake occurred on the Peninsula segment of the San Andreas fault.
Severe shaking occurred with an MM of about VIII-IX, corresponding to an Mw of about 7.5.
The San Francisco Earthquake of 1906 caused the most significant damage in the history of the
Bay Area in terms of loss of lives and property damage. This earthquake created a surface
rupture along the San Andreas fault from Shelter Cove to San Juan Bautista approximately 470
kilometers in length. It had a maximum intensity of XI (MM), an Mw of about 7.9, and was felt

18-1437 9 March 23, 2018
560 kilometers away in Oregon, Nevada, and Los Angeles. The Loma Prieta Earthquake of
October 17, 1989 had an Mw of 6.9 and occurred about 30 kilometers south of the site. On
August 24, 2014 an earthquake with an estimated maximum intensity of VIII (severe) on the
MM scale occurred on the West Napa fault. This earthquake was the largest earthquake event in
the San Francisco Bay Area since the Loma Prieta Earthquake. The Mw of the 2014 South Napa
Earthquake was 6.0.
In 1868, an earthquake with an estimated maximum intensity of X on the MM scale occurred on
the southern segment (between San Leandro and Fremont) of the Hayward fault. The estimated
Mw for the earthquake is 7.0. In 1861, an earthquake of unknown magnitude (probably an Mw of
about 6.5) was reported on the Calaveras fault. The most recent significant earthquake on this
fault was the 1984 Morgan Hill earthquake (Mw = 6.2).
The U.S. Geological Survey's 2014 Working Group on California Earthquake Probabilities has
compiled the earthquake fault research for the San Francisco Bay area in order to estimate the
probability of fault segment rupture. They have determined that the overall probability of
moment magnitude 6.7 or greater earthquake occurring in the San Francisco Region during the
next 30 years (starting from 2014) is 72 percent. The highest probabilities are assigned to the
Hayward fault, Calaveras fault, and the northern segment of the San Andreas fault. These
probabilities are 14.3, 7.4, and 6.4 percent, respectively.
5.2 Geologic Hazards
During a major earthquake on a segment of one of the nearby faults, strong to very strong ground
shaking is expected to occur at the project site. Strong shaking during an earthquake can result
in ground failure such as that associated with soil liquefaction, lateral spreading, and cyclic
densification. We used the results of the borings and CPTs to evaluate the potential of these
phenomena occurring at the project site.

18-1437 10 March 23, 2018
5.2.1 Ground Shaking
The ground shaking intensity felt at the project site will depend on: 1) the size of the earthquake
(magnitude), 2) the distance from the site to the fault source, 3) the directivity (focusing of
earthquake energy along the fault in the direction of the rupture), and 4) subsurface conditions.
The site is less than seven kilometers from the Monte Vista-Shannon fault and less than 15
kilometers from the San Andreas fault. Therefore, the potential exists for a large earthquake to
induce strong to very strong ground shaking at the site during the life of the project.
5.2.2 Liquefaction and Associated Hazards
When a saturated, cohesionless soil liquefies, it experiences a temporary loss of shear strength
created by a transient rise in excess pore pressure generated by strong ground motion. Soil
susceptible to liquefaction includes loose to medium dense sand and gravel, low-plasticity silt,
and some low-plasticity clay deposits. Flow failure, lateral spreading, differential settlement,
loss of bearing strength, ground fissures and sand boils are evidence of excess pore pressure
generation and liquefaction. The site is not in a mapped liquefaction hazard zone, as shown on
Figure 5 from the map titled State of California, Seismic Hazard Zones, San Jose West
Quadrangle, Official Map, dated February 7, 2002 and prepared by the California Geological
Survey (CGS).
Considering the historic high groundwater depth is greater than 50 feet bgs, we conclude the
potential for liquefaction-induced damage to the proposed development is very low. We also
conclude the risk of lateral spreading and other types of ground failure associated with
liquefaction occurring at the site is very low.
5.2.3 Cyclic Densification
Cyclic densification (also referred to as differential compaction) of non-saturated sand (sand
above groundwater table) can occur during an earthquake, resulting in settlement of the ground
surface and overlying improvements. In boring B-2, very loose to loose silty sand was
encountered in the upper 5 feet, which is susceptible to cyclic densification. The remaining
18-1437 11 March 23, 2018
borings and CPTs encountered material which is either sufficiently dense or cohesive to resist
cyclic densification. Based on these findings, we conclude there is potential for up to 1/2 inch of
ground surface settlement in isolated areas of the site resulting from cyclic densification. This
material will be removed where a basement is installed; therefore, we anticipate there will be
negligible amounts of cyclic densification settlement beneath the proposed buildings.
5.2.4 Fault Rupture
Historically, ground surface displacements closely follow the trace of geologically young faults.
The site is not within an Earthquake Fault Zone, as defined by the Alquist-Priolo Earthquake
Fault Zoning Act, and no known active or potentially active faults exist on the site. We therefore
conclude the risk of fault offset at the site from a known active fault is very low. In a seismically
active area, the remote possibility exists for future faulting in areas where no faults previously
existed; however, we conclude the risk of surface faulting and consequent secondary ground
failure from previously unknown faults is also very low.
6.0 DISCUSSION AND CONCLUSIONS
From a geotechnical standpoint, we conclude the site can be developed as planned, provided the
recommendations presented in this report are incorporated into the project plans and
specifications and implemented during construction. The primary geotechnical issues affecting
the proposed development include providing adequate foundation support for the proposed
buildings and providing suitable lateral support for the proposed excavation while minimizing
impacts to the surrounding improvements. These and other issues are discussed in more detail
below.
6.1 Foundations and Settlement
Based on the current conceptual design drawings, we anticipate the foundations will be
approximately 12 to 22 feet below grade, depending on the number of below-grade levels and
foundation thickness. We anticipate medium stiff to very stiff clay with varying sand content
will be exposed at foundation level. These soils have moderate strength and are moderately

18-1437 12 March 23, 2018
compressible. Based on the results of our investigation and engineering analyses, we conclude
the proposed buildings can be supported on shallow foundations consisting of either spread
footings or a mat foundation, provided that the estimated settlements are acceptable from a
structural standpoint.
Our settlement analyses indicate total settlement of a mat foundation under static load
conditions—assuming an average contact pressure of about 1,200 psf—will be about 1 inch. We
anticipate most of the settlement will occur during construction. The amount of differential
settlement between columns will be a function of the mat stiffness and hence its ability to spread
the loads between columns, however, we expect the mat can be designed to limit differential
settlements to about 1/2 inch in 30 feet. For properly constructed spread footings designed in
accordance with the recommendations in Section 7.2, we anticipate about 1 inch of total static
settlement, most of which will occur during construction. Differential static settlement is
estimated to be about 3/4 inch or less in 30 feet.
6.2 Excavation Support
Considering the proposed below-grade parking will extend as much as two levels below existing
grades, construction will require an excavation extending as much as about 22 feet below the
existing ground surface (including anticipated foundation thickness). Where the proposed
buildings will include only one below-grade level, the excavation will likely be about 12 feet
deep. The setbacks of the proposed buildings from the property lines varies from about 40 feet
along the northern boundary, between 25 and 45 feet from the property line along the VTA
tracks to the southeast, and minimal setback from the western property line along South Bascom
Avenue.
Depending on the final basement layout and required excavation depth, portions of the
excavation may be cut at temporary slopes and subsequently backfilled following construction of
the below-grade walls. However, in locations where adjacent improvements (such as
neighboring structures, sidewalks, utilities, roadways, and railway tracks) are within about two-

18-1437 13 March 23, 2018
times the proposed excavation height, the will need to be supported by a temporary shoring
system.
There are several key considerations in selecting a suitable shoring system. Those we consider
of primary concern are:
protection of surrounding improvements, including structures, underground utilities,
pavements, rail tracks, and sidewalks
proper construction of the shoring system to reduce potential for ground movement,
cost.
Several methods of shoring are available; we have qualitatively evaluated the following systems:
soil nails,
soldier pile-and-lagging with tiebacks, and
cantilevered soldier pile-and-lagging.
Soil nail shoring systems consist of reinforcing bars, which are grouted in predrilled holes
through the face of the excavation, and a reinforced shotcrete facing. Soil nail systems require a
certain amount of ground movement to mobilize their lateral resistance, and therefore are only
appropriate in locations where the excavation is not immediately adjacent to existing structures
or critical underground utilities. In addition, where the excavation is close to the property line
and there is insufficient setback, soil nails may need to extend beneath the neighboring property,
which would require an encroachment agreement with neighboring property owners.
Soldier pile-and-lagging shoring systems usually consists of steel H-beams and concrete placed
in predrilled holes extending below the bottom of the excavation. Wood lagging is placed
between the piles as the excavation proceeds from the top down, in maximum five-foot-thick
lifts. Continuous soil-cement mixing reinforced with steel H-beams may be used in lieu of wood
lagging. Where the required total cut is less than about 12 feet, a soldier pile-and-lagging system
can typically provide economical shoring without tiebacks, and therefore will not encroach
beyond the property line. Where cuts exceed about 12 feet in height, soldier pile-and-lagging
systems are typically more economical if they include tieback anchors. Tiebacks consist of post-

18-1437 14 March 23, 2018
tensioned steel strands or bars that are grouted into predrilled holes through the excavation face.
Generally, tie-backs are installed in conjunction with a soldier pile-and-lagging (or soil-cement
mix) system. However, tieback anchors will likely extend beneath the neighboring properties.
Where there is insufficient property line set-back to accommodate soil nails or tiebacks, and an
encroachment agreement is not possible, internal bracing will be required. Another alternative is
to construct a cantilevered shoring system combined with partial slope-cuts, in order to reduce
the vertical retained height.
Considering the depth and location of the excavation have not been finalized, both soil nails or
soldier pile-and-lagging system—or a combination of both—may be the most economical
shoring for the excavation. Recommendations for the design and construction of both soil nail
walls and tiedback soldier pile-and-lagging shoring are presented in Section 7.5.
6.3 Construction Considerations
The soil to be excavated consists primarily of clay, which can be excavated with conventional
earth-moving equipment such as loaders and backhoes. If larger concrete debris is encountered,
removal will require equipment capable of breaking concrete, such as a hoe-ram.
6.4 Soil Corrosivity
Corrosivity analyses were performed by Project X Corrosion on a sample of native soil from
Boring B-1 at a depth of 3 feet bgs. The results of the tests are presented in Appendix C.
Based on the results of the corrosivity analyses, we conclude the near-surface soil at this site is
“moderately corrosive” with respect to resistivity. Accordingly, all buried iron, steel, cast iron,
ductile iron, galvanized steel and dielectric-coated steel or iron should be protected against
corrosion depending upon the critical nature of the structure. If it is necessary to have metal in
contact with soil, a corrosion engineer should be consulted to provide recommendations for
corrosion protection. The test results indicate that sulfate ion concentrations are sufficiently low
to not pose a threat to buried concrete. In addition, the chloride ion concentrations are
insufficient to adversely impact steel reinforcement in concrete structures below ground.

18-1437 15 March 23, 2018
7.0 RECOMMENDATIONS
Recommendations for site grading, foundation design, shoring design and construction, and
seismic design are presented in this section of the report.
7.1 Site Preparation and Grading
Site clearing should include removal of all existing pavements, former foundation elements, and
underground utilities. Chunks of concrete and asphalt larger than 3 inches in greatest dimension
that cannot be broken down by compaction equipment should be segregated and disposed of off-
site. Any vegetation and organic topsoil (if present) should be stripped in areas to receive
improvements (i.e., building, pavement, or flatwork). Tree roots with a diameter greater than
1/2 inch within three feet of building or flatwork subgrade should be removed. Demolished
asphalt concrete should be taken to an asphalt recycling facility. Aggregate base beneath
existing pavements may be re-used as select fill if carefully segregated and approved by the
environmental consultant.
In general, abandoned underground utilities should be removed to the property line or service
connections and properly capped or plugged with concrete. Where existing utility lines are
outside of the building footprints and will not interfere with the proposed construction, they may
be abandoned in-place provided the lines are filled with lean concrete or cement grout to the
property line. Voids resulting from demolition activities should be properly backfilled with
engineered fill following the recommendations provided later in this section.
During excavation for the below-grade parking levels, portions of the excavation may encounter
perched groundwater in isolated areas. If perched groundwater is encountered near the final
subgrade, or if excavation is performed during the rainy season, the subgrade will be sensitive to
disturbance, especially under construction equipment wheel loads. The potential for subgrade
disturbance can be minimized by using tracked equipment when the excavation approaches two
feet of the building subgrade. If soft areas are encountered in the slab subgrade or footing
excavations, subgrade stabilization measures may be required. Recommendations for various
subgrade stabilization options are presented below in Section 7.1.2.

18-1437 16 March 23, 2018
7.1.1 Fill Materials and Compaction Criteria
Fill should consist of on-site soil or imported soil (select fill) that is free of organic matter,
contains no rocks or lumps larger than four inches in greatest dimension, has a liquid limit of less
than 40 and a plasticity index lower than 12, and is approved by the Geotechnical Engineer.
Samples of proposed imported fill material should be submitted to the Geotechnical Engineer at
least three business days prior to use at the site. The grading contractor should provide analytical
test results or other suitable environmental documentation indicating the imported fill is free of
hazardous materials at least three days before use at the site. If this data is not available, up to
two weeks should be allowed to perform analytical testing on the proposed imported material.
Fill should be placed in horizontal lifts not exceeding eight inches in uncompacted thickness,
moisture-conditioned to above optimum moisture content, and compacted to at least 90 percent
relative compaction5. Fill consisting of clean sand or gravel (defined as soil with less than 10
percent fines by weight) should be compacted to at least 95 percent relative compaction. Fill
greater than five feet in thickness or placed within the upper foot of pavement soil subgrade
should also be compacted to at least 95 percent relative compaction, and be non-yielding.
Where the above recommended compaction requirements are in conflict with the City of San
Jose standard details for pavements and sidewalks within the public right-of-way, the City
Engineer or inspector should determine which compaction requirements should take precedence.
Aggregate Base Material
Imported aggregate base (AB) material may be used as general fill, trench backfill (above
bedding materials), or as select fill beneath pavements, exterior concrete flatwork, or the garage
slab. AB beneath pavements should meet the requirements in the 2015 Caltrans Standard
Specifications, Section 26, for Class 2 Aggregate Base (3/4 inch maximum).
5 Relative compaction refers to the in-place dry density of soil expressed as a percentage of the
maximum dry density of the same material, as determined by the ASTM D1557 laboratory
compaction procedure.
18-1437 17 March 23, 2018
Controlled Low Strength Material
Controlled low strength material (CLSM) may be considered as an alternative to soil fill beneath
structures or pavement. CLSM should meet the requirements in the 2015 Caltrans Standard
Specifications. It is an ideal backfill material when adequate room is limited or not available for
conventional compaction equipment, or when settlement of the backfill must be minimized. No
compaction is required to place CLSM. CLSM should have a minimum 28-day unconfined
compressive strength of at least 50 pounds per square inch (psi) and no more than 100 psi.
7.1.2 Soil Subgrade Stabilization
In some areas, soft, wet soil (resulting from perched groundwater) may be encountered in
localized areas during grading, causing the subgrade to deflect and rut under the weight of
grading equipment. Furthermore, if the excavation subgrade is exposed during periods of heavy
rain, it will become soft and unstable. In these areas, some form of subgrade stabilization may
be required. Several options for stabilizing subgrade, if needed, are presented below.
Aeration
Aeration consists of mixing and turning the soil to naturally lower the moisture content to an
acceptable level. Aeration typically requires several days to a week of warm, dry weather to
effectively dry the material. Material to be dried by aeration should be scarified to a depth of at
least 12 inches; the scarified material should be turned at least twice a day to promote uniform
drying. Once the moisture content of the aerated soil has been reduced to acceptable levels, the
soil should be compacted in accordance with our previous recommendations. Aeration is
typically the least costly subgrade stabilization alternative; however, it generally requires the
most time to complete and may not be effective if the soft material extends to great depths.
Overexcavation
Another method of achieving suitable subgrade in areas where soft, wet soil is exposed is to
overexcavate the soft subgrade soil and replace it with drier, granular material. If the soft
material extends to great depths, the upper 18 to 24 inches of soft material may be overexcavated
18-1437 18 March 23, 2018
and a geotextile tensile fabric (Mirafi 500X or equivalent) placed beneath the granular backfill to
help span over the weaker material. The fabric should be pulled tight and placed at the base of
the overexcavation, extending at least two feet laterally beyond the limits of the overexcavation
in all directions. The fabric should be overlapped by at least two feet at all seams. Granular
material such as Class 2 aggregate base should then be placed and compacted over the geotextile
tensile fabric.
Chemical Treatment
Lime and/or cement have been successfully used to dry and stabilize fine-grained soils with
varying degrees of success. Lime- and/or cement-treatment will generally decrease soil density,
change its plasticity properties, and increase its strength. The degree to which lime will react
with soil depends on such variables as type of soil, mineralogy, quantity of lime, and length of
time the lime-soil mixture is cured. Cement is generally used when a significant amount of
granular material or low-plasticity silt is present in the soil. The quantity of lime and/or cement
added generally ranges from 3 to 7 percent by weight and should be determined by laboratory
testing. The specialty contractor performing the chemical treatment should select the most
appropriate additive and quantity for the soil conditions encountered.
If chemical treatment is used to stabilize soft subgrade, a treatment depth of about 12 to 18
inches below the final soil subgrade will likely be required. The soil being treated should be
scarified and thoroughly broken up to full depth and width. The treated soil should not contain
rocks or soil clods larger than three inches in greatest dimension. Treated soil should be
compacted to at least 90 percent relative compaction.
7.1.3 Utility Trench Excavations and Backfill
Excavations for utility trenches can be readily made with a backhoe. All trenches should
conform to the current CAL-OSHA requirements. All temporary excavations used in
construction should be designed, planned, constructed, and maintained by the contractor and
should conform to all state and/or federal safety regulations and requirements, including those of
CAL-OSHA.

18-1437 19 March 23, 2018
To provide uniform support, pipes or conduits should be bedded on a minimum of four inches of
clean sand or fine gravel. After the pipes and conduits are tested, inspected (if required) and
approved, they should be covered to a depth of six inches with clean sand or fine gravel, which
should be mechanically tamped. Backfill for utility trenches and other excavations is also
considered fill, and should be placed and compacted as according to the recommendations
previously presented. If imported clean sand or gravel (defined as soil with less than 10 percent
fines) is used as backfill, it should be compacted to at least 95 percent relative compaction.
Jetting of trench backfill should not be permitted. Special care should be taken when backfilling
utility trenches in pavement areas. Poor compaction may cause excessive settlements, resulting
in damage to the pavement section.
The bottom of foundations for the proposed building should be below an imaginary line
extending up at a 1.5:1 (horizontal to vertical) inclination from the base of utility trenches.
Alternatively, the portion of the utility trench (excluding bedding) that is below the 1.5:1 line can
be backfilled with CLSM (see Section 7.1.1 for material requirements). If utility trenches are to
be excavated below this zone-of-influence line after construction of the building foundations, the
trench walls need to be fully supported with shoring until CLSM is placed.
7.1.4 Drainage and Landscaping
Positive surface drainage should be provided around the building to direct surface water away
from foundations and below-grade walls. To reduce the potential for water ponding adjacent to
the building, we recommend the ground surface within a horizontal distance of five feet from the
building slope down away from the building with a surface gradient of at least two percent in
unpaved areas and one percent in paved areas. In addition, roof downspouts should be
discharged into controlled drainage facilities to keep the water away from the foundation and
below-grade walls.

18-1437 20 March 23, 2018
7.2 Foundation Design
Provided the estimated total and differential settlements presented in Section 6.1 are acceptable,
the buildings may be supported on spread footings with a slabs-on-grade or on mat foundations
bearing on undisturbed, native soil. Specific recommendations for the design and construction of
each foundation type are presented in the following sections.
7.2.1 Spread Footings
Continuous and isolated spread footings should be at least three feet wide and bottomed at least
18 inches below the adjacent soil subgrade. Footings to be constructed near underground
utilities should be bottomed below an imaginary line extending up at an inclination of 1.5:1
(horizontal:vertical) from the bottom of the utility trench. The footings may be designed using
allowable bearing pressures of 3,000 psf for dead plus live loads and 4,000 psf for total design
loads, which include wind or seismic forces.
Lateral loads may be resisted by a combination of passive pressure on the vertical faces of the
footings and friction between the bottoms of the footings and the supporting soil. To compute
passive resistance for transient loading, we recommend using an allowable uniform pressure of
1,500 psf (rectangular distribution). To compute passive resistance for sustained lateral loads,
we recommend using an equivalent fluid weight (triangular distribution) of 250 pounds per cubic
foot (pcf). The upper foot of soil should be ignored unless confined by a slab or pavement.
Frictional resistance should be computed using a base friction coefficient of 0.30. The passive
pressure and frictional resistance values include a factor of safety of at least 1.5 and may be used
in combination without reduction.
Footing excavations should be free of standing water, debris, and disturbed materials prior to
placing concrete. If footings are excavated during the rainy season or below the groundwater
level they should incorporate a mud slab to protect the footing subgrade. This will involve over-
excavating the footing by about 2 to 3 inches and placing lean concrete or CLSM in the bottom
(following our engineer checking the subgrade). A mud slab will help protect the footing

18-1437 21 March 23, 2018
subgrade during placement of reinforcing steel. Water can then be pumped from the excavations
prior to placement of structural concrete, if present.
7.2.2 Mat Foundations
For structural design of mat foundations, we recommend using a coefficient of vertical subgrade
reaction of 20 pounds per cubic inch (pci). This value has been reduced to account for the size of
the mat/equivalent footings (therefore, this is not kv1 for 1-foot-square plate). Once the structural
engineer evaluates the initial distribution of bearing stress on the bottom of the mat, we can
review the distribution and revise the coefficients of subgrade reaction, if appropriate. We
recommend the mat be designed for allowable bearing pressures of 3,000 psf for dead-plus-live
loads and 4,000 psf for total loads (including seismic and wind loads); we anticipate the average
bearing pressure will be significantly lower.
Lateral forces can be resisted by friction along the base of the mat and passive pressure against
the sides of the mat foundation. To compute lateral resistance, we recommend using an
allowable uniform pressure of 1,500 psf (rectangular distribution) for transient loads. To
compute passive resistance for sustained lateral loads, we recommend using an equivalent fluid
weight (triangular distribution) of 250 pounds per cubic foot (pcf) and an allowable base friction
coefficient of 0.30 may be used, where the mat is in contact with soil. Where/if a vapor retarder
is placed beneath the mat, a base friction coefficient of 0.20 should be used. The passive
pressure and frictional resistance values include a factor of safety of at least 1.5 and may be used
in combination without reduction.
The subgrade should be free of standing water, debris, and disturbed materials and be approved
by the geotechnical engineer prior to placing a mud slab, vapor retarder, or reinforcing steel.
7.3 Floor Slabs
If the buildings are supported on footings, the floor/garage slabs may consist of conventional
slabs-on-grade. Where water vapor transmission through the floor slab is undesirable, we
recommend installing a capillary moisture break and a water vapor retarder beneath the slab-on-

18-1437 22 March 23, 2018
grade. A vapor retarder and capillary moisture break are often not required beneath parking
garage slabs because there is sufficient air circulation to allow evaporation of moisture that is
transmitted through the slab; however, we recommend the vapor retarder and capillary break be
installed below the slab-on-grade in utility rooms and any areas in or adjacent to the parking
garage that will be used for storage and/or will receive a floor covering or coating.
A capillary moisture break consists of at least four inches of clean, free-draining gravel or
crushed rock. The vapor retarder should meet the requirements for Class B vapor retarders stated
in ASTM E1745. The vapor retarder should be placed in accordance with the requirements of
ASTM E1643. These requirements include overlapping seams by six inches, taping seams, and
sealing penetrations in the vapor retarder. The particle size of the capillary break material should
meet the gradation requirements presented in Table 2.
TABLE 2
Gradation Requirements for Capillary Moisture Break
Sieve Size Percentage Passing Sieve
1 inch 90 – 100
3/4 inch 30 – 100
1/2 inch 5 – 25
3/8 inch 0 – 6
The concrete slabs should be properly cured. Concrete mixes with high water/cement (w/c)
ratios result in excess water in the concrete, which increases the cure time and results in
excessive vapor transmission through the slab. Therefore, concrete for the slabs should have a
low w/c ratio - less than 0.45. Water should not be added to the concrete mix in the field. If
necessary, workability should be increased by adding plasticizers. Before floor coverings are
placed on the mat or on slab-on-grade floors, the contractor should check that the concrete
surface and the moisture emission levels (if emission testing is required) meet the manufacturer’s
requirements.

18-1437 23 March 23, 2018
7.4 Permanent Below-Grade Walls
Permanent below-grade walls should be designed to resist static lateral earth pressures, lateral
pressures caused by earthquakes, and traffic loads (if vehicular traffic is expected within 10 feet
of the wall). We recommend the permanent below-grade walls be designed for the more critical
of the following criteria:
At-rest equivalent fluid weight of 63 pounds per cubic foot (pcf) plus a traffic increment
where the wall will be within 10 feet of adjacent streets, or
Active equivalent fluid weight of 42 pcf, plus a seismic increment of 22 pcf (triangular
distribution)
The recommended lateral earth pressures above are based on a level backfill condition with no
additional surcharge loads. Where the below-grade walls are subject to traffic loading within 10
feet of the wall, an additional uniform lateral pressure of 50 psf, applied to the upper 10 feet of
the wall, should be used.
The lateral earth pressures recommended are applicable to walls that are backdrained to prevent
the buildup of hydrostatic pressure. Although the basement walls will be well above the
groundwater level, water can accumulate behind the walls from other sources, such as rainfall,
irrigation, and broken water lines, etc. One acceptable method for backdraining the wall is to
place a prefabricated drainage panel (Miradrain 6000 or equivalent) against the shoring or the
back of the wall. The drainage panel should extend down to a four-inch-diameter perforated
PVC collector pipe at the base of the wall or just above the design groundwater level (whichever
is higher). The pipe should be surrounded on all sides by at least four inches of Caltrans Class 2
permeable material (see Caltrans 2015 Standard Specifications Section 68) or 3/4-inch drain rock
wrapped in filter fabric (Mirafi 140NC or equivalent). A proprietary, prefabricated collector
drain system, such as Tremdrain Total Drain or Hydroduct Coil (or equivalent), designed to work
in conjunction with the drainage panel may be used in lieu of the perforated pipe surrounded by
gravel described above. The pipe should be connected to a suitable discharge point; a sump and
pump system may be required to drain the collector pipes. We should check the manufacturer’s
specifications regarding the proposed prefabricated drainage panel material to verify it is
appropriate for its intended use. To protect against moisture migration into the below-grade

18-1437 24 March 23, 2018
parking level, we recommend that the below-grade walls be water-proofed and water stops be
installed at all construction joints.
As an alternative to installing a wall drainage system and sump, it may be more economical to
design the below-grade walls for saturated earth pressures and omit the drainage system. Using
this approach, we recommend the permanent below-grade walls be designed for the more critical
of the following criteria:
At-rest equivalent fluid weight of 94 pounds per cubic foot (pcf) plus a traffic increment
where the wall will be within 10 feet of adjacent streets, or
Active equivalent fluid weight of 83 pcf, plus a seismic increment of 11 pcf (triangular
distribution)
If backfill is required behind basement walls prior to pouring the podium slabs, the walls should
be temporarily braced and hand compaction equipment used in close proximity to the wall, to
prevent unacceptable surcharges and potential deformation of the walls.
7.5 Temporary Cut Slopes and Shoring
The safety of workers and equipment in or near the excavation is the responsibility of the
contractor. The selection, design, construction, and performance of the shoring system should be
the responsibility of the contractor. A structural engineer knowledgeable in this type of
construction should design the shoring. We should review the geotechnical aspects of the
proposed shoring system to ensure that it meets our recommendations. During construction, we
should observe the installation of the shoring system and check the condition of the soil
encountered during excavation.
We recommend that temporary cuts between 5 and 20 feet in height, that are not subjected to
surcharges and not close to neighboring buildings, should be inclined no steeper than 1:1
(horizontal:vertical), which corresponds to OSHA Type B soil. If the excavation is performed
during the rainy season, or a substantial amount of granular soil is encountered in the cut, the soil
should be downgraded to OSHA Type C soil, which requires a maximum inclination of 1.5:1
18-1437 25 March 23, 2018
(horizontal:vertical). Temporary shoring will be required where temporary slopes are not
possible because of space constraints.
As discussed in Section 6.2, we conclude soil nails or soldier pile-and-lagging with tiebacks are
likely the most suitable shoring systems for the proposed excavation, where/if the buildings
include two below-grade levels. A combination of slope cuts with cantilevered soldier pile-and
lagging shoring may also be viable, however the design earth pressures will depend on the
various cut configurations and retained heights being considered—we can provide specific
recommendations for these pressures once the proposed excavation and shoring scheme has been
established. Where/if the buildings include one below-grade level, cantilevered soldier pile-and-
lagging (without tiebacks) will likely be the most economical system. Geotechnical
recommendations for the design and construction of soil nails and soldier pile-and-lagging
shoring systems are presented in the following sections.
7.5.1 Soil Nail Walls
All or portions of the proposed excavation may be supported by a soil nail shoring system. Soil
nail walls should be designed to resist static lateral earth pressures, as well as traffic loads,
construction equipment loads, and foundation surcharge loads, where applicable. In general, we
recommend the walls be designed and constructed in accordance with the guidelines presented in
the Federal Highway Administration report on soil nail walls (FHWA, 2015)6. Several computer
programs, such as SNAIL (California Department of Transportation, 2014) and GoldNail
(Golder Associates, 1996), are available for designing a soil-nail wall. SNAIL uses a force
equilibrium method of analysis; the failure planes are assumed bi-linear if they pass through the
toe of the wall and tri-linear if they pass below the toe of the wall. GoldNail uses a slope-
stability model that satisfies overall limiting equilibrium of free bodies defined by circular slip
surfaces.
6 Federal Highway Administration (2003), Geotechnical Engineering Circular No. 7 – Soil Nail Walls,
March 2003 (FHWA Report No. FHWA0-IF-03-017)

18-1437 26 March 23, 2018
Soil-nail systems are typically installed under a design-build contract by specialty contractors;
therefore, we are not providing a specific design. However, we are providing estimated input
parameters for preliminary design. The actual soil nail capacities and lengths should be
determined by a design-build contractor with experience designing, building, and testing soil-nail
walls in similar soil conditions. We should review the geotechnical aspects of their design prior
to installation. For preliminary design, we recommend the input parameters presented in
Table 3.
TABLE 3
Recommended Input Parameters for Design of Soil-Nail Walls
Soil Type
Total
Density
(pcf)
Ultimate Bond Strength
(psf)
(Factor of Safety = 1.0)
Shear Strength
Parameters
c1 2
(psf) (deg)
Native Sandy Clays 125 800 400 20
Notes: 1 Cohesion intercept or undrained shear strength, without a factor of safety 2 Angle of internal friction, without a factor of safety
Where construction equipment will be working or driving behind the walls, the design should
include a surcharge pressure of 250 psf. The soil-nail wall should be designed with a minimum
factor of safety of 1.5 against slope stability failure for temporary walls and a factor of safety of
2.0 for permanent walls.
We should be allowed to review the design plans and design calculations prior to their issuance
for construction to check for conformance with our recommendations.
Soil Nail Installation
The drilling method and equipment should be determined by the contractor and modified, as
needed, based on the soil conditions encountered during excavation and drilling. If the drilling
methods and equipment deviate from those used during installation of the load-tested verification

18-1437 27 March 23, 2018
nails, additional verification tests may be required. The holes should be cleaned of loose soil
prior to placement of bars, centralizers, and grout. If caving soil is encountered, casing of the
holes may be required. We recommend all soil nails be grouted the same day they are drilled
and that grout be placed using the tremmie method from the bottom of the hole.
Maintaining a consistent grout mix is critical to achieving consistent nail performance and is the
responsibility of the contractor. Mud balance measurements of the specific gravity of the grout
mixture may be used in the field to provide immediate indications of the grout consistency
(water-cement ratio). We recommend a minimum specific gravity of 1.80 be used for grout
mixes containing cement and water. In our experience, grout mixes with specific gravities
significantly lower than 1.80 can result in inadequate soil nail bond strengths, longer required
cure times before proof testing, and increased load test failures.
Soil-Nail Testing
We recommend the soil-nails be load-tested prior to and during construction in accordance with
the guidelines presented in the Federal Highway Administration document (FHWA, 2015). Test
nails should be installed using the same equipment, method, and hole diameter as planned for the
production nails. Verification and proof tests should be performed. Verification tests are
performed prior to production nail installation to verify the pullout resistance (bond strength)
value used in design and resulting from the contractor’s chosen installation methods. Two
verification tests should be performed for each soil type assumed in design. Proof tests are
performed during construction to verify that the contractor’s procedure remains consistent and
that the nails are not installed in a soil type that was not adequately represented by the
verification stage testing. At least five percent of the production nails should be proof tested.
Verification tests should be performed on non-production, sacrificial nails to a test load
corresponding to the ultimate pullout resistance value used in the design. Test nails should have
at least three feet of unbonded length and 10 feet of bond length. The nail bar grade and size
should be designed such that the bar stress does not exceed 80 percent of its ultimate tensile
18-1437 28 March 23, 2018
strength for Grade 75 steel or 90 percent of the yield strength for Grade 60 steel during testing—
a larger bar may be required for verification test nails.
The verification and proof tests should be performed in accordance with FHWA guidelines
(FHWA, 2015), including the recommended load increments, maximum test load, and failure
criteria. In the verification and proof tests, the load is applied to the nails in four increments (one
complete load cycle). The maximum test load should be held for a minimum of 10 minutes; the
movements of the nails should be recorded at 0, 1, 2, 3, 4, 5, 6, and 10 minutes. If the difference
in movement between the 1- and 10-minute reading is less than 0.04 inch, the test is
discontinued. If the difference is greater than 0.04 inch, the holding period is extended to 60
minutes, and the movements should be recorded at 15, 20, 25, 30, 45, and 60 minutes.
We should evaluate the test results and determine whether the test nail performance is
acceptable. Generally, a test with a ten-minute hold is acceptable if the nail carries the maximum
test load with less than 0.04 inch movement between one and 10 minutes. A test with a 60-
minute hold is acceptable if the nail carries the maximum test load with less than 0.08 inch
movement between six and 60 minutes.
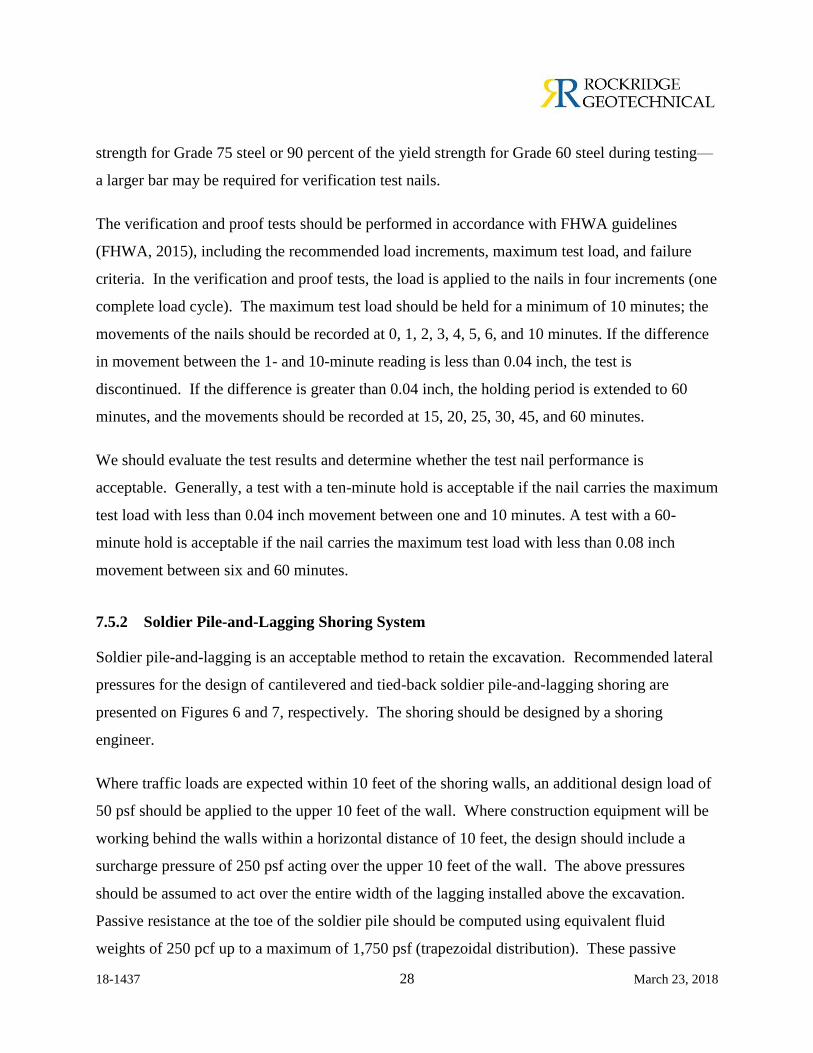
7.5.2 Soldier Pile-and-Lagging Shoring System
Soldier pile-and-lagging is an acceptable method to retain the excavation. Recommended lateral
pressures for the design of cantilevered and tied-back soldier pile-and-lagging shoring are
presented on Figures 6 and 7, respectively. The shoring should be designed by a shoring
engineer.
Where traffic loads are expected within 10 feet of the shoring walls, an additional design load of
50 psf should be applied to the upper 10 feet of the wall. Where construction equipment will be
working behind the walls within a horizontal distance of 10 feet, the design should include a
surcharge pressure of 250 psf acting over the upper 10 feet of the wall. The above pressures
should be assumed to act over the entire width of the lagging installed above the excavation.
Passive resistance at the toe of the soldier pile should be computed using equivalent fluid
weights of 250 pcf up to a maximum of 1,750 psf (trapezoidal distribution). These passive

18-1437 29 March 23, 2018
pressure values include a factor of safety of at least 1.5. The upper foot of soil should be ignored
when computing passive resistance. Passive pressure can be assumed to act over an area of three
soldier pile widths, or pile-to-pile spacing, whichever is less, assuming the toe of the soldier pile
is filled with concrete or lean concrete that is sufficiently strong to accommodate the
corresponding stresses.
Soldier piles should be placed in pre-drilled holes backfilled with concrete. Based on our
investigation, we expect that the soil to be retained by the shoring has sufficient cohesion to
stand vertically for four-foot cuts. If voids are created behind lagging boards due to localized
caving or overcutting, they should be filled with cement slurry or hand-packed soil prior to
proceeding with excavation.
The penetration of the soldier piles must be sufficient to ensure stability and resist the downward
loading of tiebacks. Vertical loads can be resisted by skin friction along the portion of the
soldier piles below the excavation. We recommend using an allowable skin friction value of
400 psf above a depth of 30 feet (from existing grades) and 1,500 psf below a depth of 30 feet to
compute the required soldier pile embedment. End bearing should be neglected.
Design criteria for tiebacks are also presented on Figure 7. As shown, tiebacks should derive
their load-bearing capacity from the soil behind an imaginary line sloping upward from a point
H/5 feet away from the bottom of the excavation at an angle of 60 degrees from horizontal,
where H is the wall height in feet. The minimum stressing lengths for strand and bar tendons
should be 15 and 10 feet, respectively. The minimum bond length for strand and bar tendons
should both be 15 feet.
Allowable capacities of the tiebacks will depend upon the drilling method, hole diameter, grout
consistency, grout pressure, and workmanship. The shoring contractor should use a smooth-
cased method (such as a Klemm rig) to install the tiebacks to prevent caving beneath adjacent
buildings and improvements. The bottom of excavation should not extend more than two feet
below a row of unsecured tiebacks. The shoring designer should be responsible for determining

18-1437 30 March 23, 2018
the actual length of tiebacks required to resist the design loads. The determination should be
based on the designer’s familiarity with the installation method to be used.
Tieback Testing
The computed bond length of tiebacks should be confirmed by a performance- and proof-testing
program under the observation of our field engineer. The first two production tiebacks and two
percent of the remaining tiebacks should be performance tested to 1.5 times the design load. The
remaining tiebacks should be confirmed by a proof-test to 1.25 times the design load. The
movement of each tieback should be monitored with a free-standing, tripod-mounted dial gauge
during performance and proof testing.
The performance test is used to verify the capacity and the load-deformation behavior of the
tiebacks. It is also used to separate and identify the causes of tieback movement, and to check
that the designed unbonded length has been established. In the performance test, the load is
applied to the tieback in several cycles of incremental loading and unloading. During the test,
the tieback load and movement are measured. The maximum test load should be held for a
minimum of 10 minutes, with readings taken at 0, 1, 2, 3, 6, and 10 minutes. If the difference
between the 1- and 10-minute reading is less than 0.04 inch during the loading, the test is
discontinued. If the difference is more than 0.04 inch, the holding period is extended by 50
minutes to 60 minutes, and the movements should be recorded at 15, 20, 25, 30, 45, and 60
minutes.
A proof test is a simple test used to measure the total movement of the tieback during one cycle
of incremental loading. The maximum test load should be held for a minimum of 10 minutes,
with readings taken at 0, 1, 2, 3, 6, and 10 minutes. If the difference between the 1- and 10-
minute reading is less than 0.04 inch, the test is discontinued. If the difference is more than 0.04
inch, the holding period is extended by 50 minutes to 60 minutes, and the movements should be
recorded at 15, 20, 25, 30, 45, and 60 minutes.
Rockridge Geotechnical and the shoring engineer should evaluate the tieback test results and
determine whether the tiebacks are acceptable. A performance- or proof-tested tieback with a

18-1437 31 March 23, 2018
10-minute hold is acceptable if the tieback carries the maximum test load with less than 0.04
inch movement between 1 and 10 minutes, and total movement at the maximum test load
exceeds 80 percent of the theoretical elastic elongation of the unbonded length. A performance-
or proof-tested tieback with a 60-minute hold is acceptable if the tieback carries the maximum
test load with less than 0.08 inch movement between 6 and 60 minutes, and total movement at
the maximum test load exceeds 80 percent of the theoretical elastic elongation of the unbonded
length. Tiebacks that failed to meet the10- or 60-minute hold criterion will be assigned a
reduced capacity. Tiebacks that do not exceed 80 percent of theoretical elastic elongation should
be replaced by the contractor at no additional cost to the owner.
7.5.3 Construction Monitoring
During excavation, the shoring system may deform laterally, which could cause the ground
surface adjacent to the shoring wall to settle. The magnitudes of shoring movements and the
resulting settlements are difficult to estimate because they depend on many factors, including the
method of installation and the contractor's skill in the shoring installation. Ground movements
due to a properly designed and constructed shoring system should be within ordinary accepted
limits of about one inch. A monitoring program should be established to evaluate the effects of
the construction on the adjacent properties.
The contractor should establish survey points on the shoring and on the ground surface at critical
locations behind the shoring prior to the start of excavation. These survey points should be used
to monitor the vertical and horizontal movements of the shoring and the ground behind the
shoring during construction.
7.6 Seismic Design
We understand the proposed building will be designed using the seismic provisions in the 2016
California Building Code (CBC). Using the USGS Seismic Design Maps website and a site
latitude of 37.2990º and longitude of -121.9303º, we conclude the following seismic design
parameters should be used:

18-1437 32 March 23, 2018
Site Class D
SS = 1.500 g, S1 = 0.600 g
SMS = 1.500 g, SM1 = 0.900 g
SDS = 1.000 g, SD1 = 0.600 g
Seismic Design Category D for Risk Categories I, II, and III.
8.0 GEOTECHNICAL SERVICES DURING CONSTRUCTION
Prior to construction, Rockridge Geotechnical, Inc. should review the project plans and
specifications to verify that they conform to the intent of our recommendations. During
construction, our field engineer should provide on-site observation and testing during site
preparation, placement and compaction of fill, installation of foundations, and shoring
installation. These observations will allow us to compare actual with anticipated soil conditions
and to verify that the contractor's work conforms to the geotechnical aspects of the plans and
specifications.
9.0 LIMITATIONS
This geotechnical study has been conducted in accordance with the standard of care commonly
used as state-of-practice in the profession. No other warranties are either expressed or implied.
The recommendations made in this report are based on the assumption that the subsurface
conditions do not deviate appreciably from those disclosed in the test borings and CPTs. If any
variations or undesirable conditions are encountered during construction, we should be notified
so that additional recommendations can be made. The foundation recommendations presented in
this report are developed exclusively for the proposed development described in this report and
are not valid for other locations and construction in the project vicinity.

18-1437 33 March 23, 2018
REFERENCES
2015 Caltrans Standard Specifications.
2016 California Building Code (CBC).
California Department of Transportation, Division of New Technology, Materials and Research,
Office of Geotechnical Engineering, (2014). SNAIL Program, A User Manual, updated
December 2014, available from
http://www.dot.ca.gov/hq/esc/geotech/software/geo_software.html.
Cao, T., Bryant, W. A., Rowshandel, B., Branum D. and Wills, C. J. (2003). “The Revised 2002
California Probabilistic Seismic Hazard Maps”
Federal Highway Administration (2015). Geotechnical Engineering Circular No. 7 – Soil Nail
Walls, February 2015 (FHWA Report No. FHWA0-IF-03-017)
Field, E.H., and 2014 Working Group on California Earthquake Probabilities, 2015, UCERF3: A
new earthquake forecast for California’s complex fault system: U.S. Geological Survey 2015-
3009, 6 p.
GeoTracker website, State of California Water Resources Control Board,
(http://geotracker.waterboards.ca.gov/), accessed February 10, 2018.
GeoLogismiki, (2016). CLiq, Version 2.1.
Golder Associates, (1996). GoldNail, A Stability Analysis Computer Program for Soil Nail Wall
Design, Reference Manual Version 3.11, October 1996.
Toppozada, T.R. and Borchardt G. (1998). “Re-evaluation of the 1936 “Hayward Fault” and the
1838 San Andreas Fault Earthquakes.” Bulletin of Seismological Society of America, 88(1),
140-159.
U.S. Geological Survey (USGS), (2008). The Uniform California Earthquake Rupture Forecast,
Version 2 (UCERF 2): prepared by the 2007 Working Group on California Earthquake
Probabilities, U.S. Geological Survey Open File Report 2007-1437.
U.S. Geological Survey, (2016). U.S. Seismic Design Maps, accessed March 1 2017
http://earthquake.usgs.gov/designmaps/us/application.php

FIGURES

Project No. FigureDate
ROCKRIDGEGEOTECHNICAL
SITE LOCATION MAP
1
0
Approximate scale
800 Feet
SITE
Base map: Google Map, 2017
18-143703/21/18
1410 SOUTH BASCOM AVENUESan Jose, California
South
Bascom
Avenue

0
Approximate scale
100 Feet
03/21/18 18-1437 2
San Jose, California
SITE PLAN
Date Project No. Figure
ROCKRIDGEGEOTECHNICAL
1410 SOUTH BASCOM AVENUE
Base map: Google Earth, 2017.
EXPLANATION
Approximate location of cone penetration test byRockridge Geotechnical Inc., January 25, 2018
Approximate location of boring by RockridgeGeotechnical Inc., January 23, 2018
Project limits
B-1
CPT-1
B-1
B-2
B-3
CPT-1
CPT-3
CPT-2
CPT-6
CPT-7
CPT-4
CPT-5
CPT-8
SO
UT
H B
AS
CO
M A
VE
NU
E
S
O
U
T
H
W
E
S
T
E
X
P
Y
V
T
A
P
L
A
T
F
O
R
M
&
T
R
A
C
K
S

Project No. FigureDate 3
REGIONAL GEOLOGIC MAP
Geologic contact: dashed where approximate and dottedwhere concealed, queried where uncertin
SITE
0 600 Feet
Approximate scale
ROCKRIDGEGEOTECHNICAL
EXPLANATION
Base map: Google Earth with U.S. Geological Survey (USGS), Santa Clara County, 2017.
af Artificial Fill
Qpa Alluvium (Pleistocene)
Qha Alluvium (Holocene)
QhaQha
QpaQpa
18-143702/07/18
1410 SOUTH BASCOM AVENUESan Jose, California

Project No. FigureDate
Base Map: U.S. Geological Survey (USGS), National Seismic Hazards Maps - Fault Sources, 2008.
10 Miles
Approximate scale
0 5
4ROCKRIDGEGEOTECHNICAL
REGIONAL FAULT MAP
SITE
EXPLANATION
Strike slip
Thrust (Reverse)
Normal
Point Reyes Fault
San A
ndreas Fault
San G
regorio
Fault
Monte Vista-Shannon Fault
Mount Diablo Thrust
Gre
enville F
ault
Gre
at V
alle
y 0
5
Calaveras Fault
Gre
en V
alle
yHayward-Rodgers Creek Fault
Hayward-Rodgers Creek Fault
18-143702/07/18
1410 SOUTH BASCOM AVENUESan Jose, California

Project No. FigureDate 5
EXPLANATION
SITE
SEISMIC HAZARDS ZONE MAP
Earthquake-Induced Landslides; Areas where previous occurence of
landslide movement, or local topographic, geological, geotechnical, and
subsurface water conditions indicate a potential for permanent ground
displacements.
Liquefaction; Areas where historic occurence of liquefaction,
or local topographic, geological, geotechnical, and subsurface
water conditions indicate a potential for permanent ground displacements.
Reference:
State of California "Seismic Hazard Zones"
San Jose West Quadrangle.
Released on February 7, 2002
0 4000 Feet
Approximate scale
2000
ROCKRIDGEGEOTECHNICAL 18-143702/09/18
1410 SOUTH BASCOM AVENUESan Jose, California
Ground surface
Bottom of excavation
10 feetH
Shoring
Pressure due tovehicle along street,
where applicable(heavy equipment
should comeno closer than
five feet to excavation)
D
1.2 DPASSIVE
PRESSUREACTIVE
PRESSURE
50 psf
C1,750 psf Point of Rotation
250 psf1 ft
42 psf1 ft
Not to scale
Notes:1. Simplified pressure diagram is presented above. The net passive pressure on the right side of the shoring below the point of rotation is replace by a concentrated force C.2. Passive pressures include a factor of safety of about 1.5.3. Passive pressures may be assumed to act over the pile spacing or three times the pile diameter, whichever is smaller (for piles with structural concrete).4. Surcharge pressure, due to construction equipment, if any, should be added to the above shoring pressure.5. Active pressure below the excavation should be assumed to act over one pile diameter.6. Calculated embedment depth, D, should be increased by at least 20 percent to obtain the design depth of penetration.7. The recommended pressures do not include surcharges from adjacent buildings. Where shoring system is adjacent to an at-grade building, at-rest lateral pressures should be used and surcharge pressure from footings should be added to the above shoring pressures.8. pcf denotes pounds per cubic foot; psf denotes pounds per square foot.
6Date Project No. Figure
LATERAL EARTH PRESSURES FORCANTILEVERED SOLDIER-PILE-
AND-LAGGING SHORING SYSTEM03/21/18
ROCKRIDGEGEOTECHNICAL 18-1437
San Jose, California1410 SOUTH BASCOM AVENUE

50 psf
10 feet
Pressure due to vehiclesurcharge along street,
where applicable(heavy equipment should
come no closer than 5 feetto the face of excavation)
Shoring
Bottom of excavation
H (feet)
Ground surface
H1
23 H1
Bond between anchor andsoil is considered effectiveonly to the right of dashed line
60°
Bottom ofexcavation
0.2 H
Stressing length(15 feet min for strands
10 feet min for bars)
Bond length(15-feet min)
Ground surface
H
0 1,250 psf
Approximate allowable skinfriction on pressure-grouted and
post-grouted tieback. Contractorto confirm based on soil
conditions encountered duringdrilling and construction means
and methods.
10 feet
Shoring
Tieback
.28 H psf
1,750 psfmaximum
250 psf1 ft
Notes:1. Passive pressures include a factor of safety of about 1.5.2. For soldier piles spaced at more than three times the soldier pile diameter, the passive pressure should be assumed to act over three diameters.3. Surcharge pressure due to construction equipment, if any, should be added to the above shoring pressure.
NOT TO SCALE
7Date Project No. Figure
ROCKRIDGEGEOTECHNICAL
DESIGN PARAMETERS FOR SOLDIER-PILE-
AND-LAGGING TEMPORARY SHORING SYSTEM
WITH ONE ROW OF TIEBACKS
03/21/18 18-1437
San Jose, California1410 SOUTH BASCOM AVENUE

APPENDIX A
Cone Penetration Test Results

A-1
CPT-1
Total depth: 44.46 ft, Date: 1/25/2018
Groundwater not encountered
Cone Operator: Middle Earth Geo Testing, Inc.
Project No. FigureDate
SBT legend1. Sensitive fine grained
2. Organic material
3. Clay to silty clay
4. Clayey silt to silty clay
5. Silty sand to sandy silt
6. Clean sand to silty sand
7. Gravely sand to sand
8. Very stiff sand to clayey sand
9. Very stiff fine grained
CONE PENETRATION TEST RESULTS
ROCKRIDGEGEOTECHNICAL 18-143702/07/18
1410 SOUTH BASCOM AVENUESan Jose, California
CPT-2
A-2
Total depth: 37.07 ft, Date: 1/25/2018
Groundwater not encountered
Cone Operator: Middle Earth Geo Testing, Inc.
Project No. FigureDate
SBT legend1. Sensitive fine grained
2. Organic material
3. Clay to silty clay
4. Clayey silt to silty clay
5. Silty sand to sandy silt
6. Clean sand to silty sand
7. Gravely sand to sand
8. Very stiff sand to clayey sand
9. Very stiff fine grained
CONE PENETRATION TEST RESULTS
ROCKRIDGEGEOTECHNICAL 18-143702/07/18
1410 SOUTH BASCOM AVENUESan Jose, California
CPT-3
A-3
Total depth: 40.85 ft, Date: 1/25/2018
Groundwater not encountered
Cone Operator: Middle Earth Geo Testing, Inc.
Project No. FigureDate
SBT legend1. Sensitive fine grained
2. Organic material
3. Clay to silty clay
4. Clayey silt to silty clay
5. Silty sand to sandy silt
6. Clean sand to silty sand
7. Gravely sand to sand
8. Very stiff sand to clayey sand
9. Very stiff fine grained
CONE PENETRATION TEST RESULTS
ROCKRIDGEGEOTECHNICAL 18-143702/07/18
1410 SOUTH BASCOM AVENUESan Jose, California
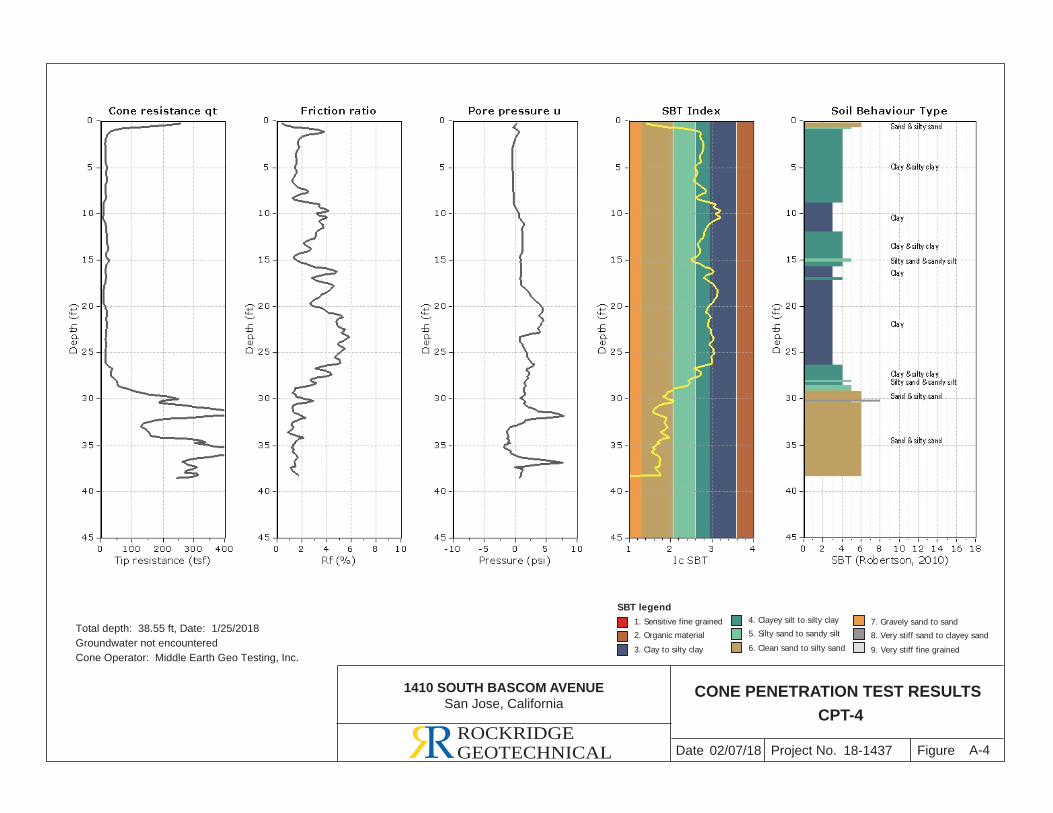
CPT-4
A-4
Total depth: 38.55 ft, Date: 1/25/2018
Groundwater not encountered
Cone Operator: Middle Earth Geo Testing, Inc.
Project No. FigureDate
SBT legend1. Sensitive fine grained
2. Organic material
3. Clay to silty clay
4. Clayey silt to silty clay
5. Silty sand to sandy silt
6. Clean sand to silty sand
7. Gravely sand to sand
8. Very stiff sand to clayey sand
9. Very stiff fine grained
CONE PENETRATION TEST RESULTS
ROCKRIDGEGEOTECHNICAL 18-143702/07/18
1410 SOUTH BASCOM AVENUESan Jose, California

CPT-5
A-5
Total depth: 35.60 ft, Date: 1/25/2018
Groundwater not encountered
Cone Operator: Middle Earth Geo Testing, Inc.
Project No. FigureDate
SBT legend1. Sensitive fine grained
2. Organic material
3. Clay to silty clay
4. Clayey silt to silty clay
5. Silty sand to sandy silt
6. Clean sand to silty sand
7. Gravely sand to sand
8. Very stiff sand to clayey sand
9. Very stiff fine grained
CONE PENETRATION TEST RESULTS
ROCKRIDGEGEOTECHNICAL 18-143702/07/18
1410 SOUTH BASCOM AVENUESan Jose, California

CPT-6
A-6
Total depth: 33.46 ft, Date: 1/25/2018
Groundwater not encountered
Cone Operator: Middle Earth Geo Testing, Inc.
Project No. FigureDate
SBT legend1. Sensitive fine grained
2. Organic material
3. Clay to silty clay
4. Clayey silt to silty clay
5. Silty sand to sandy silt
6. Clean sand to silty sand
7. Gravely sand to sand
8. Very stiff sand to clayey sand
9. Very stiff fine grained
CONE PENETRATION TEST RESULTS
ROCKRIDGEGEOTECHNICAL 18-143702/07/18
1410 SOUTH BASCOM AVENUESan Jose, California

CPT-7
A-7
Total depth: 42.16 ft, Date: 1/25/2018
Groundwater not encountered
Cone Operator: Middle Earth Geo Testing, Inc.
Project No. FigureDate
SBT legend1. Sensitive fine grained
2. Organic material
3. Clay to silty clay
4. Clayey silt to silty clay
5. Silty sand to sandy silt
6. Clean sand to silty sand
7. Gravely sand to sand
8. Very stiff sand to clayey sand
9. Very stiff fine grained
CONE PENETRATION TEST RESULTS
ROCKRIDGEGEOTECHNICAL 18-143702/07/18
1410 SOUTH BASCOM AVENUESan Jose, California

CPT-8
A-8
Total depth 29.36 ft, Date: 1/25/2018
Groundwater not encountered
Cone Operator: Middle Earth Geo Testing, Inc.
Total depth: 9.36 ft, Date: 1/25/2018
Groundwater not encountered
Cone Operator: Middle Earth Geo Testing, Inc.
Project No. FigureDate
SBT legend1. Sensitive fine grained
2. Organic material
3. Clay to silty clay
4. Clayey silt to silty clay
5. Silty sand to sandy silt
6. Clean sand to silty sand
7. Gravely sand to sand
8. Very stiff sand to clayey sand
9. Very stiff fine grained
CONE PENETRATION TEST RESULTS
ROCKRIDGEGEOTECHNICAL 18-143702/07/18
1410 SOUTH BASCOM AVENUESan Jose, California

APPENDIX B
Logs of Borings

86
107
99
14.1
14.2
22.0
61
BULK
S&H
S&H
S&H
S&H
S&H
S&H
S&H
CL
CL
CL
CL
GP-GM
6 inches of aggregate baseSANDY CLAY with GRAVEL (CL)brown, dry to moist
CLAY with SAND (CL)yellow-brown, stiff, dry to moist, fine-grained sand,with siltmedium stiffLL = 28, PI = 11; see Figure C-1
SANDY CLAY (CL)yellow-brown, soft to medium stiff, moist,fine-grained sand, with silt
medium stiff to stiffLL = 27, PI = 10; see Figure C-1
CLAY with SAND (CL)yellow-brown, medium stiff to stiff, moist,fine-grained sand, with silt
stiff, decrease in silt content, trace gravel
GRAVEL with SILT and SAND (GP-GM)
14
5
4
8
8
11
21
12128643
233
556
557
5610
9921
Sam
pler
Type
Sam
ple
Blo
ws/
6"
SP
TN
-Val
ue1
LITH
OLO
GY
DE
PTH
(feet
)
Dry
Den
sity
Lbs/
Cu
Ft
Type
of
Stre
ngth
Test
She
ar S
treng
thLb
s/S
q Ft
Fine
s%
Con
finin
gP
ress
ure
Lbs/
Sq
Ft
Nat
ural
Moi
stur
eC
onte
nt, %
See Site Plan, Figure 2
1/23/18
8" diameter hollow-stem auger
Hammer type: Downhole Wireline
Sprague & Henwood (S&H), Standard Penetration Test (SPT)
Date finished: 1/23/18
Hammer weight/drop: 140 lbs./30 inches
Sampler:
C. ProtoExploration GeoservicesMobile B56
Boring location:
Date started:
Drilling method:
Logged by:Drilled by:Rig:
1
2
3
4
5
6
7
8
9
10
11
12
13
14
15
16
17
18
19
20
21
22
23
24
25
26
27
28
29
30
MATERIAL DESCRIPTION
LABORATORY TEST DATA
SAMPLES
Figure:B-1a
PROJECT:
Project No.:18-1437
1410 SOUTH BASCOM AVENUESan Jose, California
PAGE 1 OF 2Log of Boring B-1
RO
CK
RID
GE
18-
1437
.GP
J T
R.G
DT
3/2
1/18

SPT
SPT
SPT
GP-GM
GRAVEL with SILT and SAND (GP-GM)(continued)yellow, medium dense, moist, fine to coarsesubrounded to subangular gravel, medium- tocoarse-grained sand
yellow-brown, very dense64
70
39
193221
203028
231814
Dry
Den
sity
Lbs/
Cu
Ft
Type
of
Stre
ngth
Test
She
ar S
treng
thLb
s/S
q Ft
Fine
s%
Con
finin
gP
ress
ure
Lbs/
Sq
Ft
Nat
ural
Moi
stur
eC
onte
nt, %
Sam
pler
Type
Sam
ple
Blo
ws/
6"
SP
TN
-Val
ue1
LITH
OLO
GY
DE
PTH
(feet
)
31
32
33
34
35
36
37
38
39
40
41
42
43
44
45
46
47
48
49
50
51
52
53
54
55
56
57
58
59
60
MATERIAL DESCRIPTION
LABORATORY TEST DATASAMPLES
Figure:B-1b
PROJECT:
Project No.:18-1437
1410 SOUTH BASCOM AVENUESan Jose, California
PAGE 2 OF 2Log of Boring B-1
RO
CK
RID
GE
18-
1437
.GP
J T
R.G
DT
3/2
1/18
Boring terminated at a depth of 44.5 feet below groundsurface.Boring backfilled with cement grout.Groundwater not encountered during drilling.
1 S&H and SPT blow counts for the last two increments wereconverted to SPT N-Values using factors of 0.7 and 1.2,respectively, to account for sampler type and hammerenergy. SPT sampler used without liners.

106
100
17.3
23.1
S&H
S&H
SPT
S&H
S&H
S&H
ST
SPT
SM
CL
CL
CL
GM
3 inches of asphalt concrete6 inches of aggregate baseSILTY SAND (SM)brown, very loose to loose, moist, fine-grainedsand
loose, trace clayCLAY with SAND (CL)brown, medium stiff to stiff, moist to wet,fine-grained sand, with silt
SANDY CLAY (CL)yellow-brown, stiff, moist, fine-grained sand, withsilt
CLAY with SAND (CL)yellow-brown, stiff, moist, fine-grained sand, withsilt
stiff to very stiff
SILTY GRAVEL with SAND (GM)yellow-brown, very dense, moist, fine to coarsesubrounded gravel
4
7
7
11
13
14
59
333355
224
478
4711
7911
160-200psi
162227
Sam
pler
Type
Sam
ple
Blo
ws/
6"
SP
TN
-Val
ue1
LITH
OLO
GY
DE
PTH
(feet
)
Dry
Den
sity
Lbs/
Cu
Ft
Type
of
Stre
ngth
Test
She
ar S
treng
thLb
s/S
q Ft
Fine
s%
Con
finin
gP
ress
ure
Lbs/
Sq
Ft
Nat
ural
Moi
stur
eC
onte
nt, %
See Site Plan, Figure 2
1/23/18
8" diameter hollow-stem auger
Hammer type: Downhole Wireline
Sprague & Henwood (S&H), Standard Penetration Test (SPT), Shelby Tube (ST)
Date finished: 1/23/18
Hammer weight/drop: 140 lbs./30 inches
Sampler:
C. ProtoExploration GeoservicesMobile B56
Boring location:
Date started:
Drilling method:
Logged by:Drilled by:Rig:
1
2
3
4
5
6
7
8
9
10
11
12
13
14
15
16
17
18
19
20
21
22
23
24
25
26
27
28
29
30
MATERIAL DESCRIPTION
LABORATORY TEST DATA
SAMPLES
Figure:B-2a
PROJECT:
Project No.:18-1437
1410 SOUTH BASCOM AVENUESan Jose, California
PAGE 1 OF 2Log of Boring B-2
RO
CK
RID
GE
18-
1437
.GP
J T
R.G
DT
3/2
1/18

SPT
S&H
SPT
GM
GP-GM
SILTY GRAVEL with SAND (GM) (continued)
dense, subrounded to subangular gravel
GRAVEL with SILT and SAND (GP-GM)yellow-brown, dense, moist, fine to coarsesubrounded to subangular gravel, medium- tocoarse-grained sand
very dense
46
46
77
181820
303530
182737
Dry
Den
sity
Lbs/
Cu
Ft
Type
of
Stre
ngth
Test
She
ar S
treng
thLb
s/S
q Ft
Fine
s%
Con
finin
gP
ress
ure
Lbs/
Sq
Ft
Nat
ural
Moi
stur
eC
onte
nt, %
Sam
pler
Type
Sam
ple
Blo
ws/
6"
SP
TN
-Val
ue1
LITH
OLO
GY
DE
PTH
(feet
)
31
32
33
34
35
36
37
38
39
40
41
42
43
44
45
46
47
48
49
50
51
52
53
54
55
56
57
58
59
60
MATERIAL DESCRIPTION
LABORATORY TEST DATASAMPLES
Figure:B-2b
PROJECT:
Project No.:18-1437
1410 SOUTH BASCOM AVENUESan Jose, California
PAGE 2 OF 2Log of Boring B-2
RO
CK
RID
GE
18-
1437
.GP
J T
R.G
DT
3/2
1/18
Boring terminated at a depth of 44.5 feet below groundsurface.Boring backfilled with cement grout.Groundwater not encountered during drilling.
1 S&H and SPT blow counts for the last two increments wereconverted to SPT N-Values using factors of 0.7 and 1.2,respectively, to account for sampler type and hammerenergy. SPT sampler used without liners.
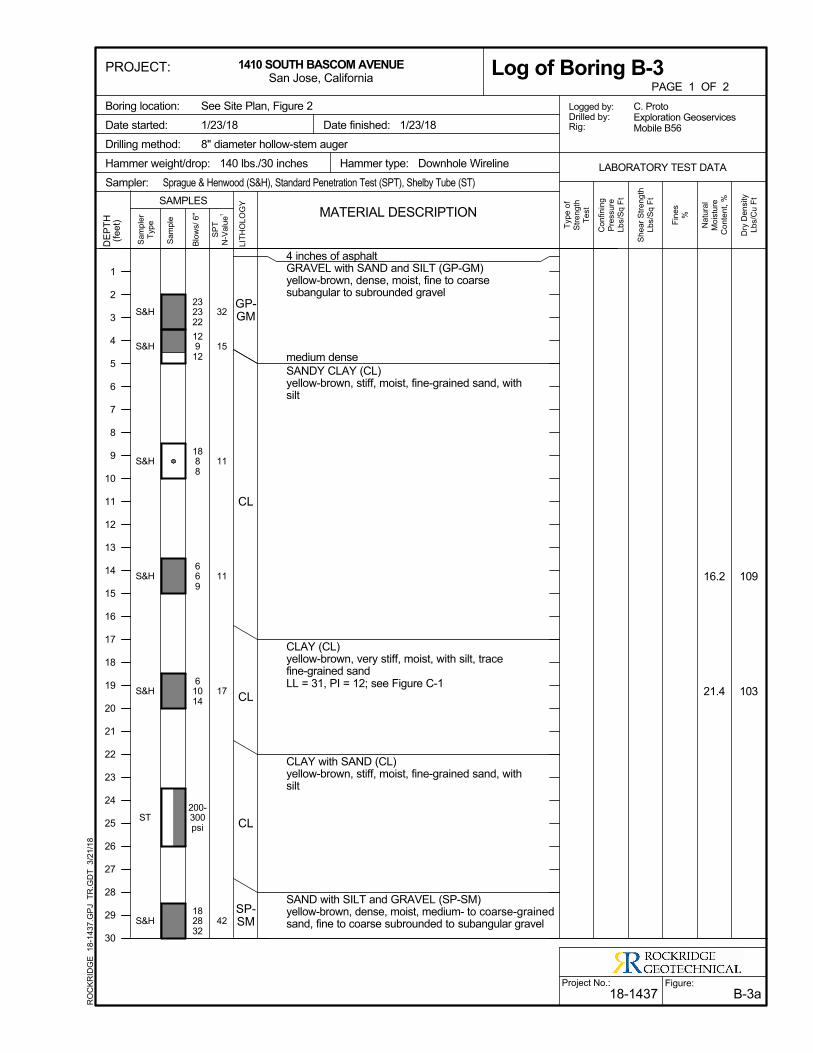
109
103
16.2
21.4
S&H
S&H
S&H
S&H
S&H
ST
S&H
GP-GM
CL
CL
CL
SP-SM
4 inches of asphaltGRAVEL with SAND and SILT (GP-GM)yellow-brown, dense, moist, fine to coarsesubangular to subrounded gravel
medium denseSANDY CLAY (CL)yellow-brown, stiff, moist, fine-grained sand, withsilt
CLAY (CL)yellow-brown, very stiff, moist, with silt, tracefine-grained sandLL = 31, PI = 12; see Figure C-1
CLAY with SAND (CL)yellow-brown, stiff, moist, fine-grained sand, withsilt
SAND with SILT and GRAVEL (SP-SM)yellow-brown, dense, moist, medium- to coarse-grainedsand, fine to coarse subrounded to subangular gravel
32
15
11
11
17
42
23232212912
1888
669
61014
200-300psi
182832
Sam
pler
Type
Sam
ple
Blo
ws/
6"
SP
TN
-Val
ue1
LITH
OLO
GY
DE
PTH
(feet
)
Dry
Den
sity
Lbs/
Cu
Ft
Type
of
Stre
ngth
Test
She
ar S
treng
thLb
s/S
q Ft
Fine
s%
Con
finin
gP
ress
ure
Lbs/
Sq
Ft
Nat
ural
Moi
stur
eC
onte
nt, %
See Site Plan, Figure 2
1/23/18
8" diameter hollow-stem auger
Hammer type: Downhole Wireline
Sprague & Henwood (S&H), Standard Penetration Test (SPT), Shelby Tube (ST)
Date finished: 1/23/18
Hammer weight/drop: 140 lbs./30 inches
Sampler:
C. ProtoExploration GeoservicesMobile B56
Boring location:
Date started:
Drilling method:
Logged by:Drilled by:Rig:
1
2
3
4
5
6
7
8
9
10
11
12
13
14
15
16
17
18
19
20
21
22
23
24
25
26
27
28
29
30
MATERIAL DESCRIPTION
LABORATORY TEST DATA
SAMPLES
Figure:B-3a
PROJECT:
Project No.:18-1437
1410 SOUTH BASCOM AVENUESan Jose, California
PAGE 1 OF 2Log of Boring B-3
RO
CK
RID
GE
18-
1437
.GP
J T
R.G
DT
3/2
1/18

SPT
SPT
SPT
SP-SM
GP
SP-SC
SAND with SILT and GRAVEL (SP-SM)(continued)
GRAVEL with SAND (GP)yellow-brown, very dense, moist, fine to coarsegravel
dry to moist
SAND with CLAY and GRAVEL (SP-SC)yellow-brown, dense, moist
67
67
44
182828
362630
301522
Dry
Den
sity
Lbs/
Cu
Ft
Type
of
Stre
ngth
Test
She
ar S
treng
thLb
s/S
q Ft
Fine
s%
Con
finin
gP
ress
ure
Lbs/
Sq
Ft
Nat
ural
Moi
stur
eC
onte
nt, %
Sam
pler
Type
Sam
ple
Blo
ws/
6"
SP
TN
-Val
ue1
LITH
OLO
GY
DE
PTH
(feet
)
31
32
33
34
35
36
37
38
39
40
41
42
43
44
45
46
47
48
49
50
51
52
53
54
55
56
57
58
59
60
MATERIAL DESCRIPTION
LABORATORY TEST DATASAMPLES
Figure:B-3b
PROJECT:
Project No.:18-1437
1410 SOUTH BASCOM AVENUESan Jose, California
PAGE 2 OF 2Log of Boring B-3
RO
CK
RID
GE
18-
1437
.GP
J T
R.G
DT
3/2
1/18
Boring terminated at a depth of 44.5 feet below groundsurface.Boring backfilled with cement grout.Groundwater not encountered during drilling.
1 S&H and SPT blow counts for the last two increments wereconverted to SPT N-Values using factors of 0.7 and 1.2,respectively, to account for sampler type and hammerenergy. SPT sampler used without liners.

CLASSIFICATION CHART
Major Divisions Symbols Typical Names
GW
GP
GM
GC
SW
SP
SM
SC
ML
CL
OL
MH
CH
OH
PTHighly Organic Soils
UNIFIED SOIL CLASSIFICATION SYSTEM
Well-graded gravels or gravel-sand mixtures, little or no fines
Poorly-graded gravels or gravel-sand mixtures, little or no fines
Silty gravels, gravel-sand-silt mixtures
Clayey gravels, gravel-sand-clay mixtures
Well-graded sands or gravelly sands, little or no fines
Poorly-graded sands or gravelly sands, little or no fines
Silty sands, sand-silt mixtures
Inorganic silts and clayey silts of low plasticity, sandy silts, gravelly silts
Inorganic clays of low to medium plasticity, gravelly clays, sandy clays, lean clays
Organic silts and organic silt-clays of low plasticity
Inorganic silts of high plasticity
Inorganic clays of high plasticity, fat clays
Organic silts and clays of high plasticity
Peat and other highly organic soils
Clayey sands, sand-clay mixtures
Range of Grain SizesGrain Size
in MillimetersU.S. Standard
Sieve SizeAbove 12"
12" to 3"
Classification
Boulders
Cobbles
Above 305
305 to 76.2
Silt and Clay Below No. 200 Below 0.075
GRAIN SIZE CHART
SAMPLER TYPE
Coa
rse-
Gra
ined
Soi
ls(m
ore
than h
alf o
f soil
> n
o. 200
sie
ve s
ize)
Fine
-Gra
ined
Soi
ls(m
ore
than h
alf o
f soil
< n
o. 200 s
ieve s
ize)
Gravels
(More than half of
coarse fraction >
no. 4 sieve size)
Sands
(More than half of
coarse fraction <
no. 4 sieve size)
Silts and Clays
LL = < 50
Silts and Clays
LL = > 50
Gravel
coarse
fine
3" to No. 4
3" to 3/4"
3/4" to No. 4
No. 4 to No. 200
No. 4 to No. 10
No. 10 to No. 40
No. 40 to No. 200
76.2 to 4.76
76.2 to 19.1
19.1 to 4.76
4.76 to 0.075
4.76 to 2.00
2.00 to 0.420
0.420 to 0.075
Sand
coarse
medium
fine
C Core barrel
CA California split-barrel sampler with 2.5-inch outside
diameter and a 1.93-inch inside diameter
D&M Dames & Moore piston sampler using 2.5-inch outside
diameter, thin-walled tube
O Osterberg piston sampler using 3.0-inch outside diameter,
thin-walled Shelby tube
PT Pitcher tube sampler using 3.0-inch outside diameter, thin-walled Shelby tube
S&H Sprague & Henwood split-barrel sampler with a 3.0-inch outside diameter and a 2.43-inch inside diameter
SPT Standard Penetration Test (SPT) split-barrel sampler with a 2.0-inch outside diameter and a 1.5-inch inside diameter
ST Shelby Tube (3.0-inch outside diameter, thin-walled tube) advanced with hydraulic pressure
SAMPLE DESIGNATIONS/SYMBOLS
Sample taken with Sprague & Henwood split-barrel sampler with a
3.0-inch outside diameter and a 2.43-inch inside diameter. Darkened
area indicates soil recovered
Classification sample taken with Standard Penetration Test sampler
Undisturbed sample taken with thin-walled tube
Disturbed sample
Sampling attempted with no recovery
Core sample
Analytical laboratory sample
Sample taken with Direct Push sampler
Sonic
Unstabilized groundwater level
Stabilized groundwater level
ROCKRIDGEGEOTECHNICAL Project No. Figure B-4Date 18-143702/07/18
1410 SOUTH BASCOM AVENUESan Jose, California

APPENDIX C
Laboratory Test Results

ML or OL
MH or OH
Symbol Source
Natural
M.C. (%)
Liquid
Limit (%)
CL - ML
0
10
20
30
40
50
60
70
0 10 20 30 40 50 60 70 80 90 100 110 120
LIQUID LIMIT (LL)
Description and Classification% Passing
#200 Sieve
Plasticity
Index (%)
PLASTICITY CHART
ROCKRIDGEGEOTECHNICAL Project No. FigureDate C-103/03/18 18-1437
1410 SOUTH BASCOM AVENUESan Jose, California
PLA
ST
ICIT
Y IN
DE
X (
PI)
Ref erence:
ASTM D2487-00
B-1 at 4.5 feet
B-1 at 14.5 feet
B-3 at 19.0 feet
CLAY with SAND (CL), yellow-brown
SANDY CLAY (CL), yellow-brown
CLAY (CL), yellow-brown
14.1
14.2
21.4
--
61
--
28
27
31
11
10
12

Project X REPORT S180215E
Corrosion Engineering Page 2 Corrosion Control – Soil, Water, Metallurgy Testing Lab
29970 Technology Dr, Suite 105F, Murrieta, CA 92563 Tel: 213-928-7213 Fax: 951-226-1720 www.projectxcorrosion.com
Soil Analysis Lab Results Client: Rockridge Geotechnical
Job Name: 1410 South Bascom Avenue Client Job Number: 18-1437
Project X Job Number: S180215E February 19, 2018
Method SM 4500-NO3-E
SM 4500-NH3-C
SM 4500-S2-D
ASTM G200
ASTM G51
Bore# / Description
Depth Nitrate Ammonia Sulfide Redox pH
(ft) (Ohm-cm) (Ohm-cm) (mg/kg) (wt%) (mg/kg) (wt%) (mg/kg) (mg/kg) (mg/kg) (mV)
B-1 #2 3.0 2,010 1,407 18 0.0018 12 0.0012 60 0.3 0.12 217 7.38
Resistivity As Rec'd | Minimum
ASTM D516
ASTM D512B
ChloridesSulfates
ASTM G187
Unk = Unknown NT = Not Tested mg/kg = milligrams per kilogram (parts per million) of dry soil weight Chemical Analysis performed on 1:3 Soil-To-Water extract
Please call if you have any questions.
Prepared by,
Ernesto Padilla, BSME Field Engineer
Respectfully Submitted,
Eddie Hernandez, M.Sc., P.E. Sr. Corrosion Consultant NACE Corrosion Technologist #16592 Professional Engineer California No. M37102 [email protected]

THIS PAGE INTENTIONALLY LEFT BLANK
South Bascom Gateway Station Initial Study/Mitigated Negative Declaration City of San José June 2019
D-2: Paleontological Records Search

THIS PAGE INTENTIONALLY LEFT BLANK
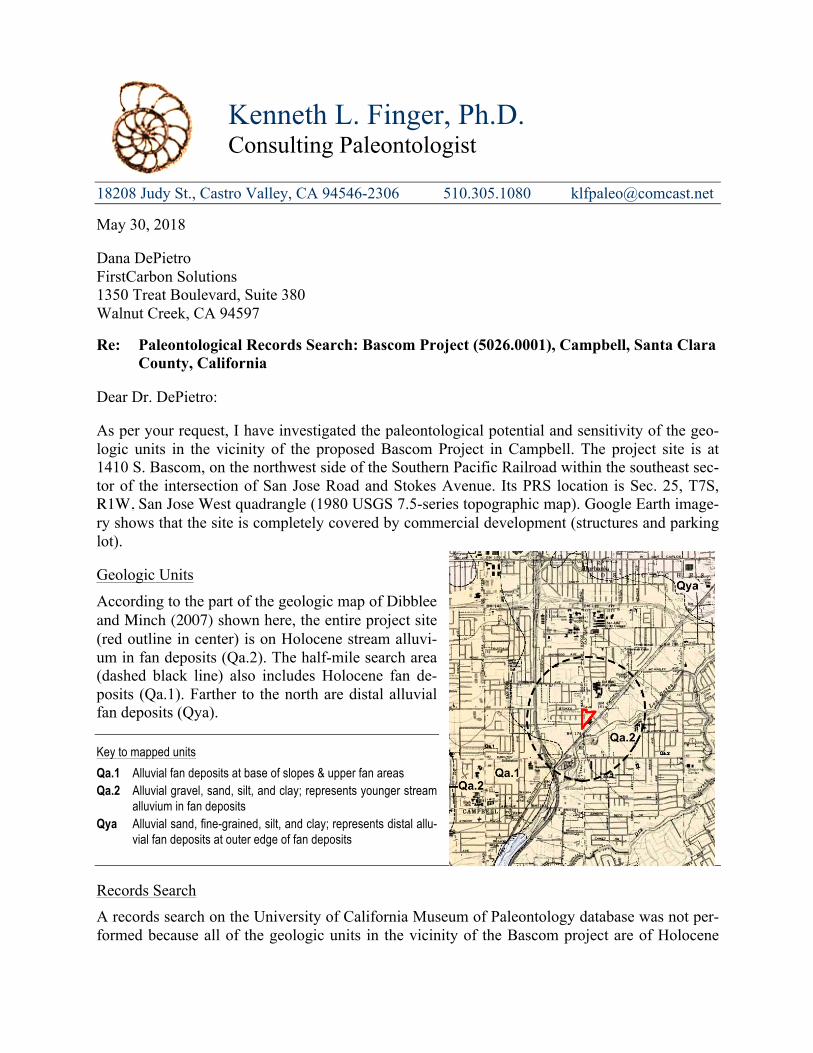
Kenneth L. Finger, Ph.D. Consulting Paleontologist
18208 Judy St., Castro Valley, CA 94546-2306 510.305.1080 [email protected]
May 30, 2018 Dana DePietro FirstCarbon Solutions 1350 Treat Boulevard, Suite 380 Walnut Creek, CA 94597 Re: Paleontological Records Search: Bascom Project (5026.0001), Campbell, Santa Clara
County, California Dear Dr. DePietro: As per your request, I have investigated the paleontological potential and sensitivity of the geo-logic units in the vicinity of the proposed Bascom Project in Campbell. The project site is at 1410 S. Bascom, on the northwest side of the Southern Pacific Railroad within the southeast sec-tor of the intersection of San Jose Road and Stokes Avenue. Its PRS location is Sec. 25, T7S, R1W, San Jose West quadrangle (1980 USGS 7.5-series topographic map). Google Earth image-ry shows that the site is completely covered by commercial development (structures and parking lot). Geologic Units
According to the part of the geologic map of Dibblee and Minch (2007) shown here, the entire project site (red outline in center) is on Holocene stream alluvi-um in fan deposits (Qa.2). The half-mile search area (dashed black line) also includes Holocene fan de-posits (Qa.1). Farther to the north are distal alluvial fan deposits (Qya).
Key to mapped units Qa.1 Alluvial fan deposits at base of slopes & upper fan areas Qa.2 Alluvial gravel, sand, silt, and clay; represents younger stream
alluvium in fan deposits Qya Alluvial sand, fine-grained, silt, and clay; represents distal allu-
vial fan deposits at outer edge of fan deposits
Records Search A records search on the University of California Museum of Paleontology database was not per-formed because all of the geologic units in the vicinity of the Bascom project are of Holocene

Paleontological Records Search: Bascom Project (5026.0001) K.L. Finger
2
age, which are too young to have any fossil potential. Older units are not in the vicinity and are likely to be too deeply buried at the site to be impacted by project-related earth-disturbing activi-ties. Remarks and Recommendations Because it is highly unlikely that potentially fossiliferous deposits will be encountered at the Bascom site, t here is no need for a pre-construction paleontological walkover survey or paleon-tological monitoring of project-related excavations. This report therefore satisfies CEQA guide-lines and concludes the paleontological mitigation for this project. Sincerely,
Reference Cited Dibblee, T.W., Jr., and Minch, J.A., 2007, Geologic map of the Cupertino and San Jose West
quadrangles, Santa Clara and Santa Cruz counties, California: Dibblee Geology Center Geo-logic Map #DF-351. Scale 1:24,000.
50260001 • 05/2018 | rec o rd_search.mxdRec o rd Search Map
Source: USGS San Jose West 7.5' Quadran gle / T 7S,R1W,sec 25
CIT Y OF SAN JOSÉ • 1410 S. BASCOM AVENUE PROJECTPHASE I CULT URAL RESOURCES ASSESSMENT
2,000 0 2,0001,000Feet
Project Area
Half-Mile Radius

THIS PAGE INTENTIONALLY LEFT BLANK