Appendix D: Aerobic and Anaerobic Leaching Tests · · 2017-08-29Appendix D: Aerobic and...
30
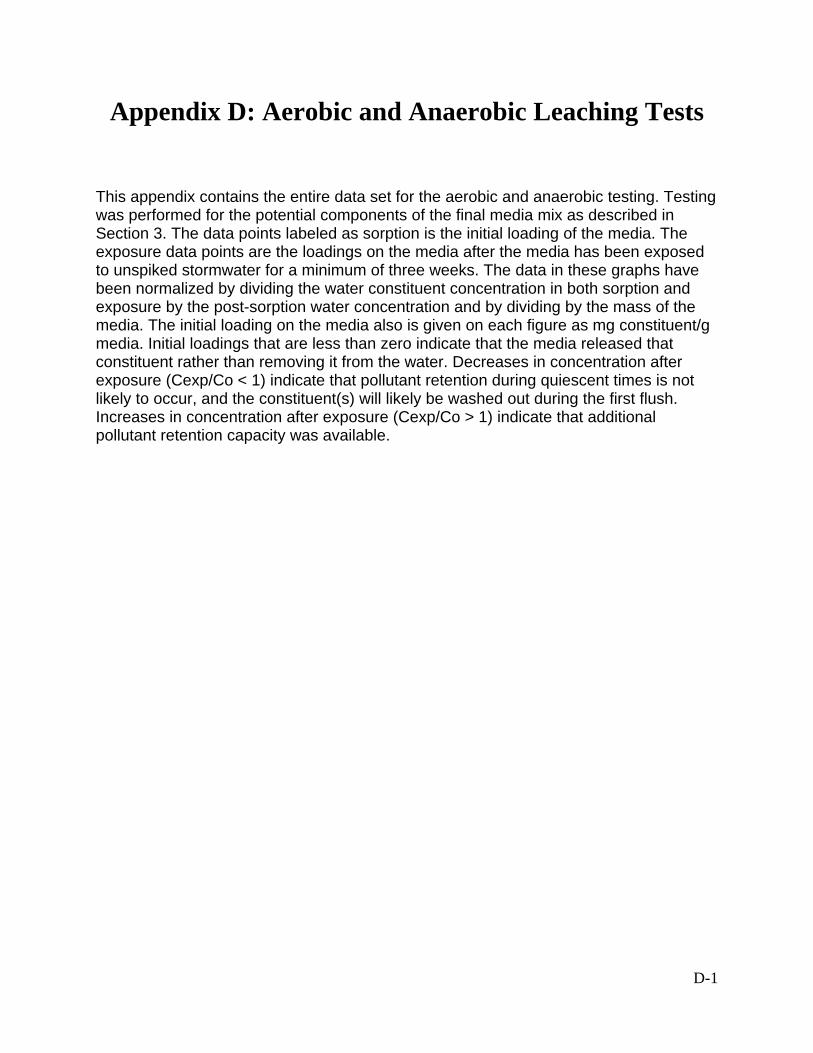
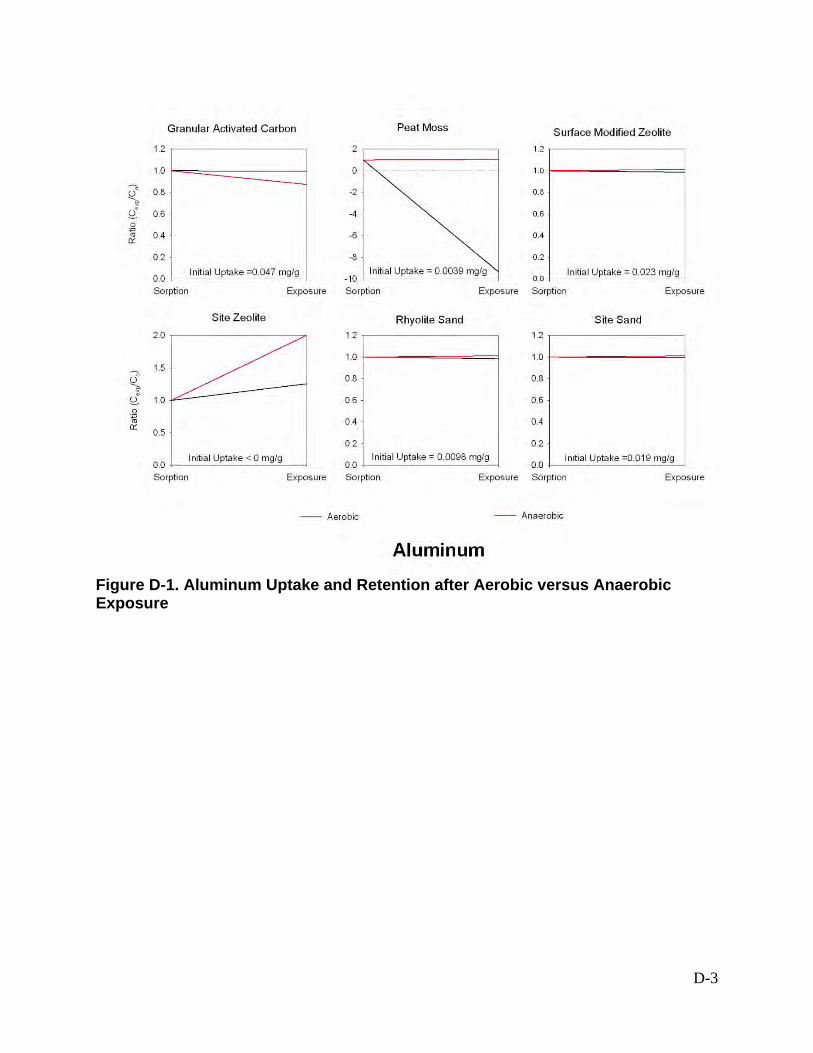
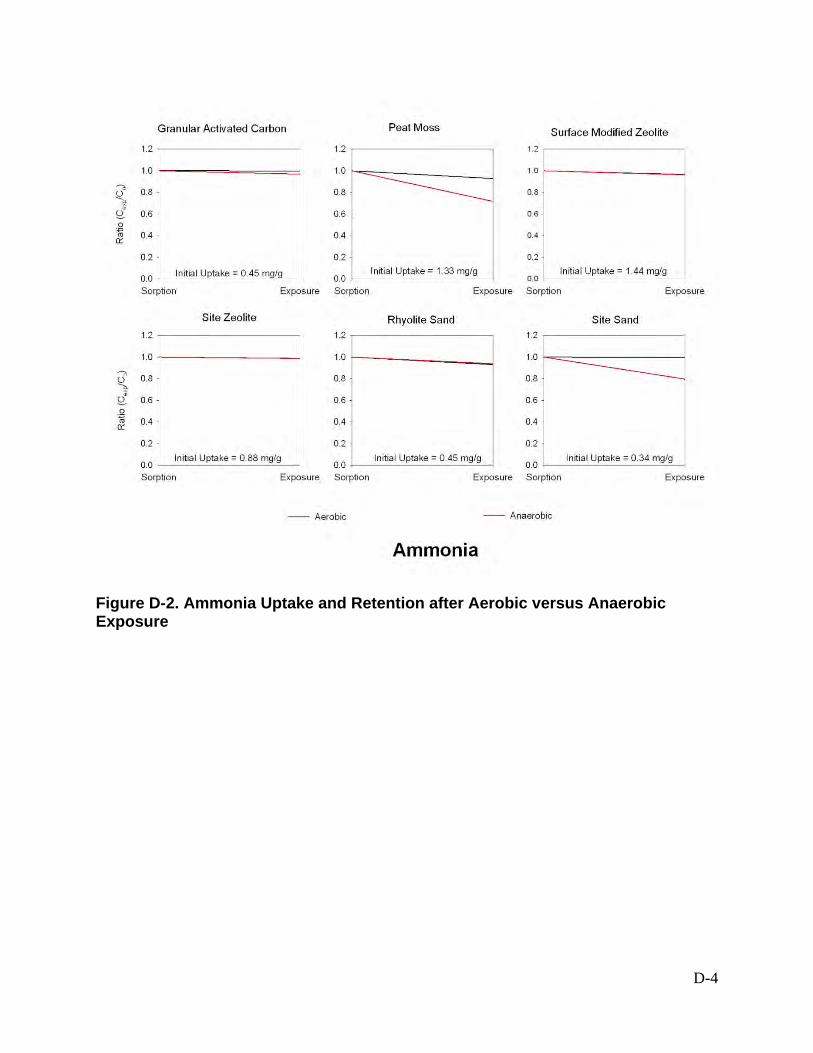
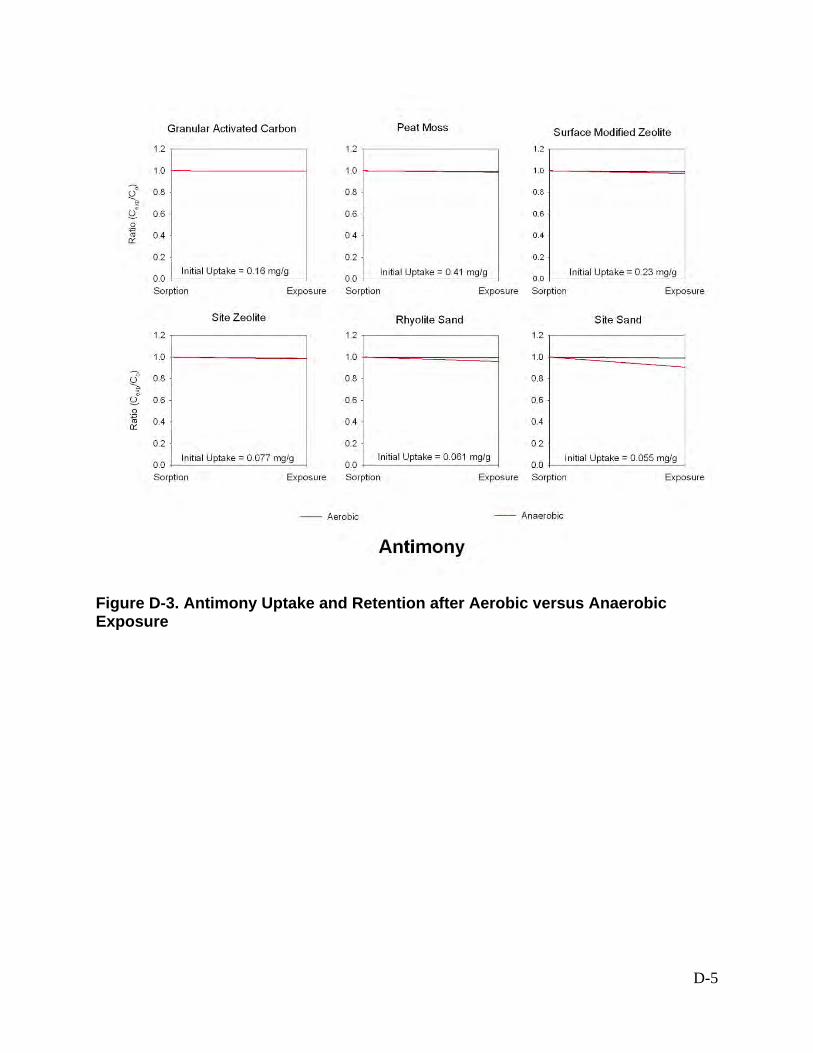
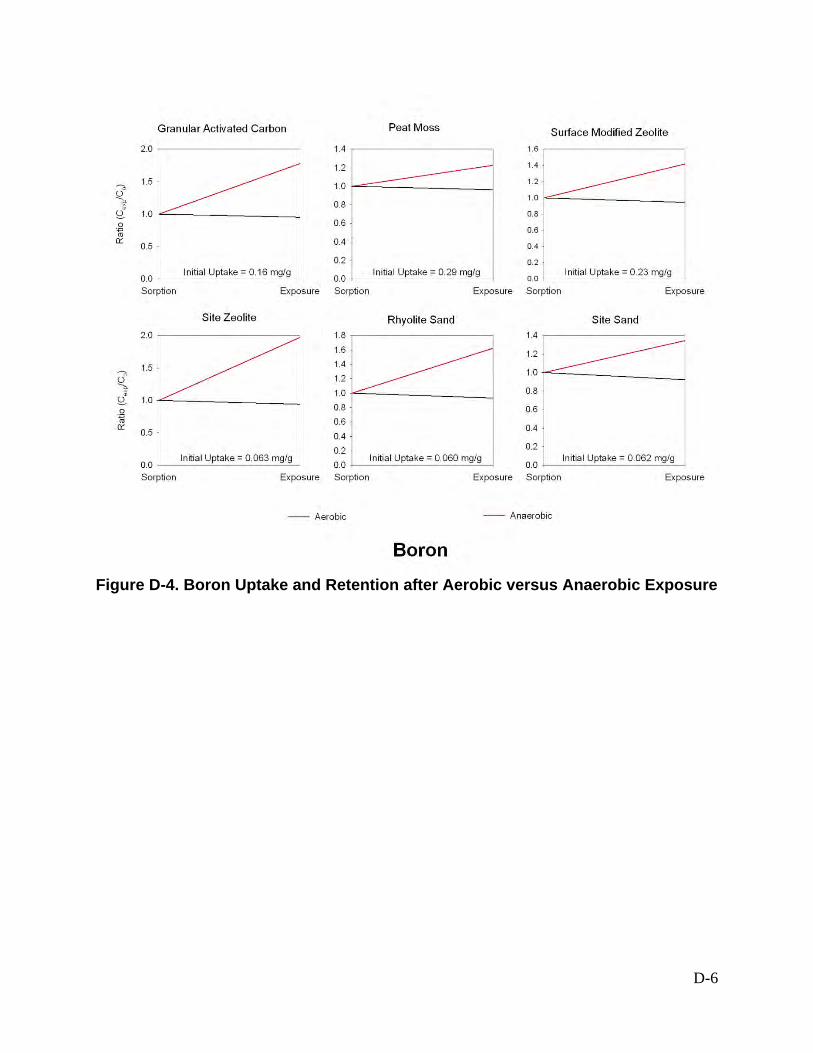
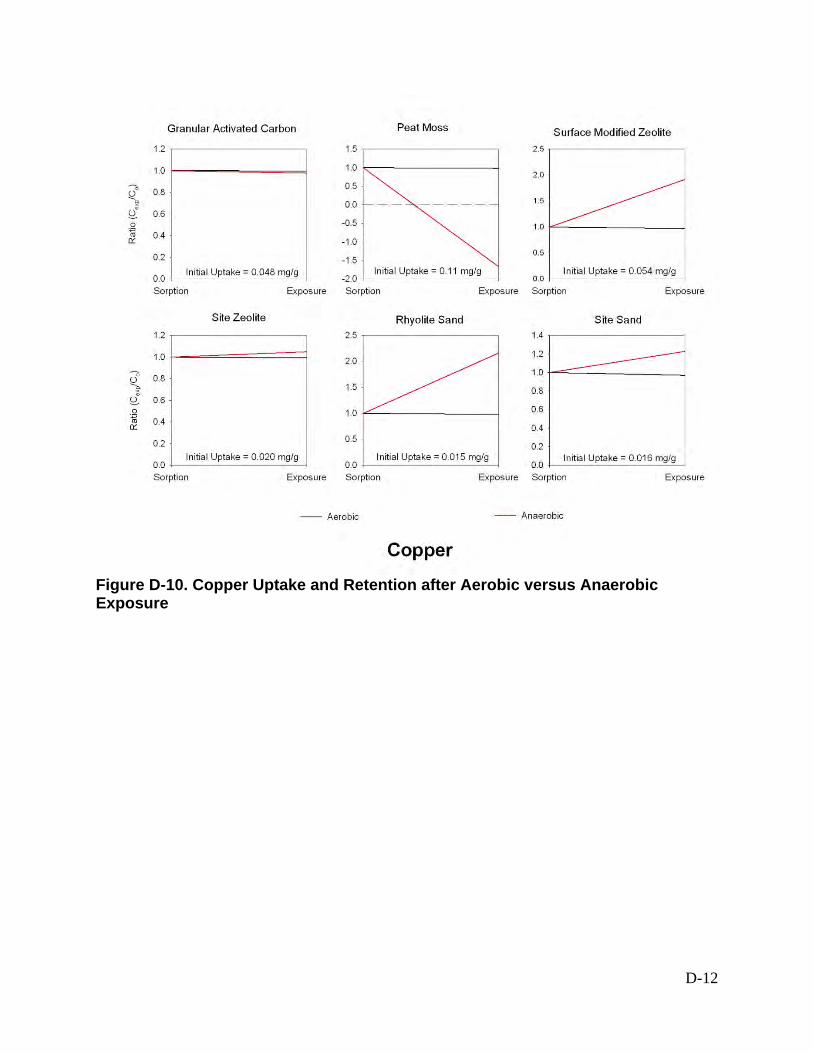
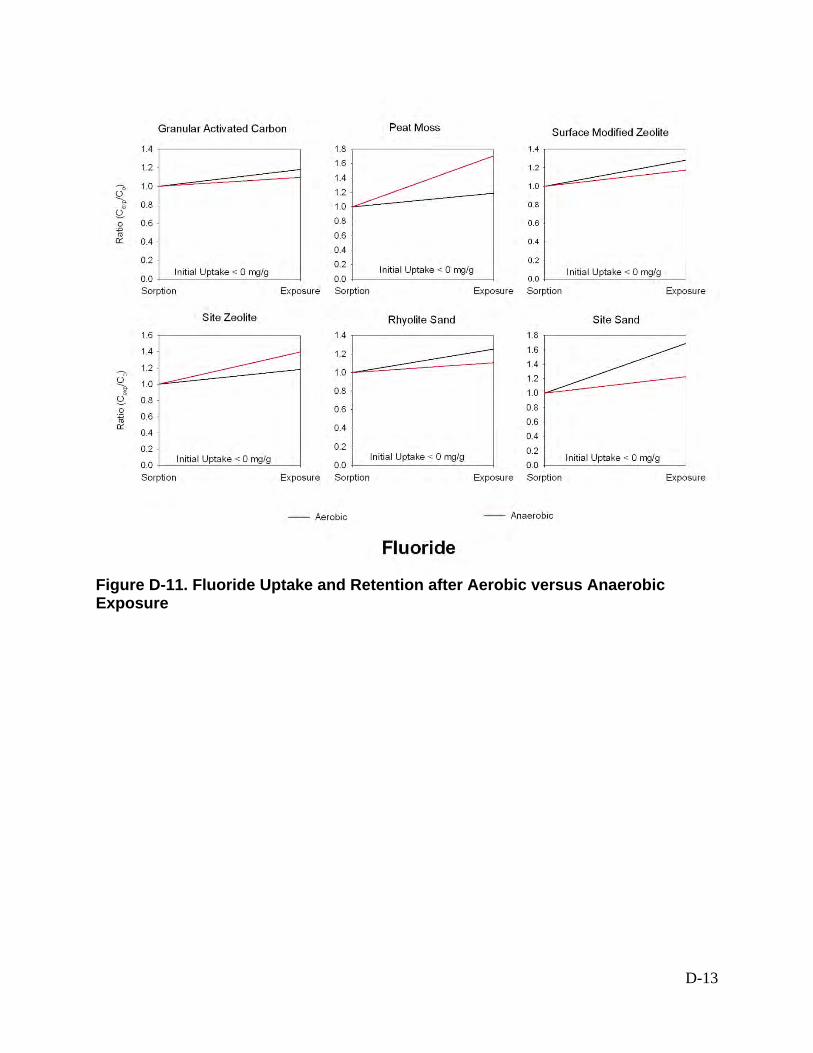
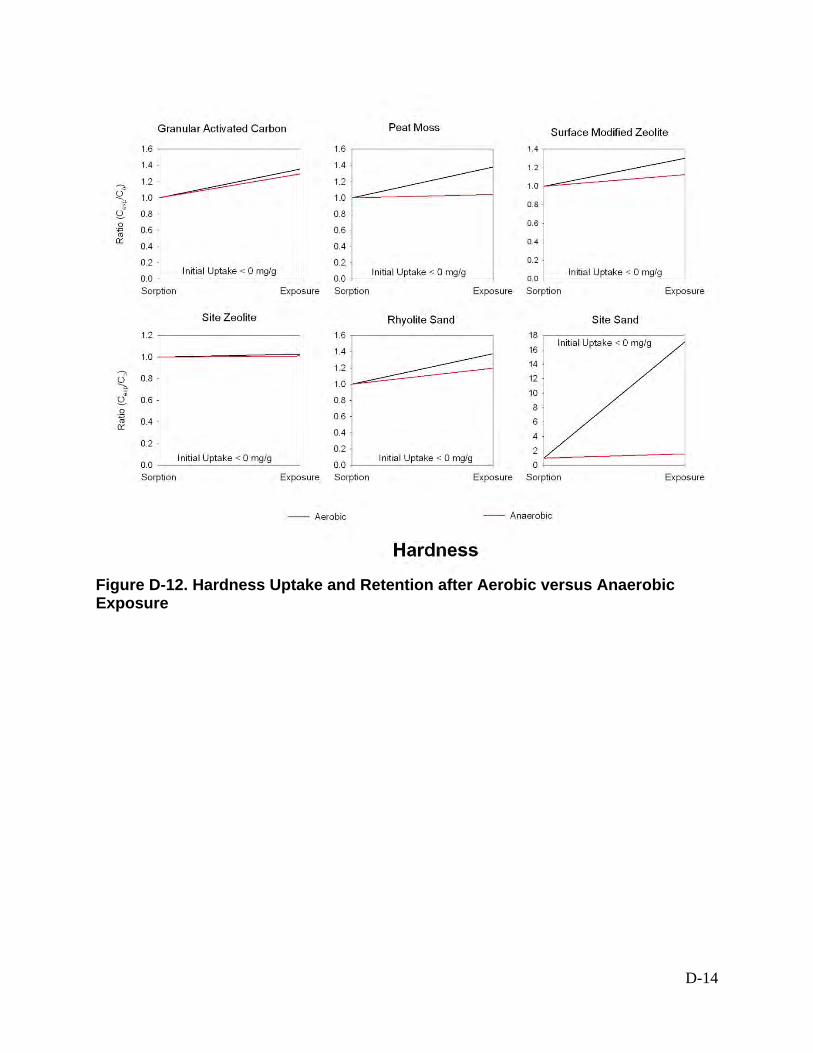
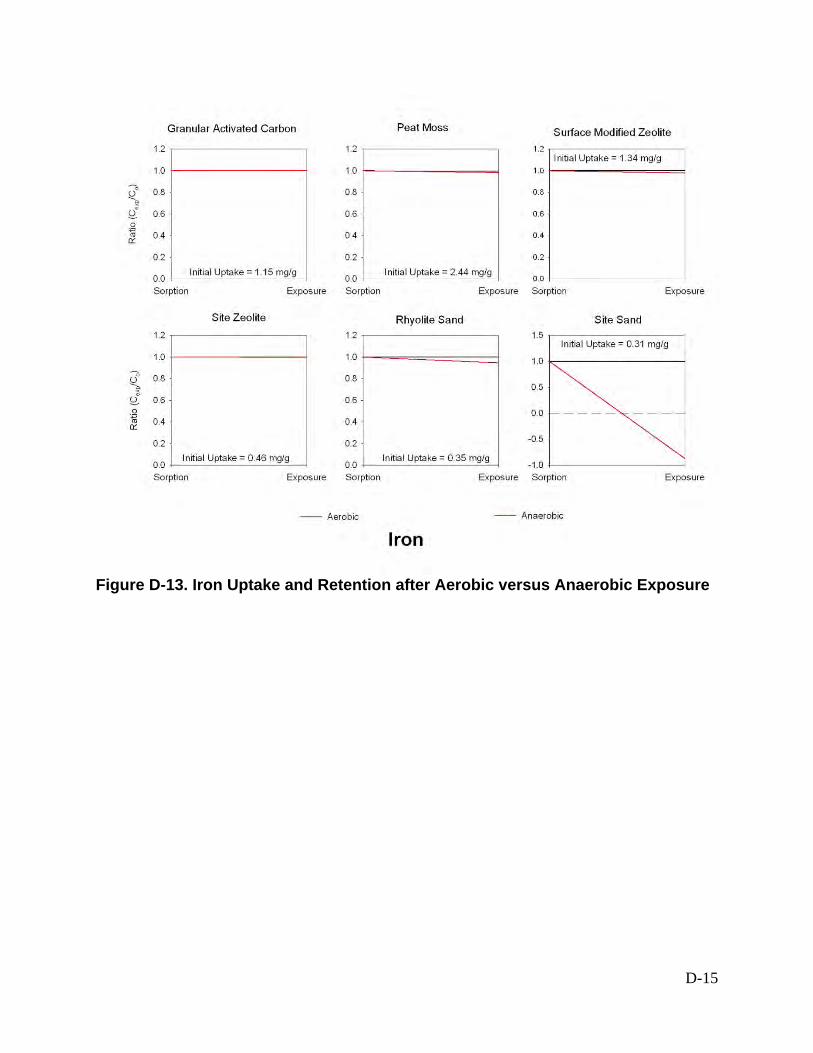
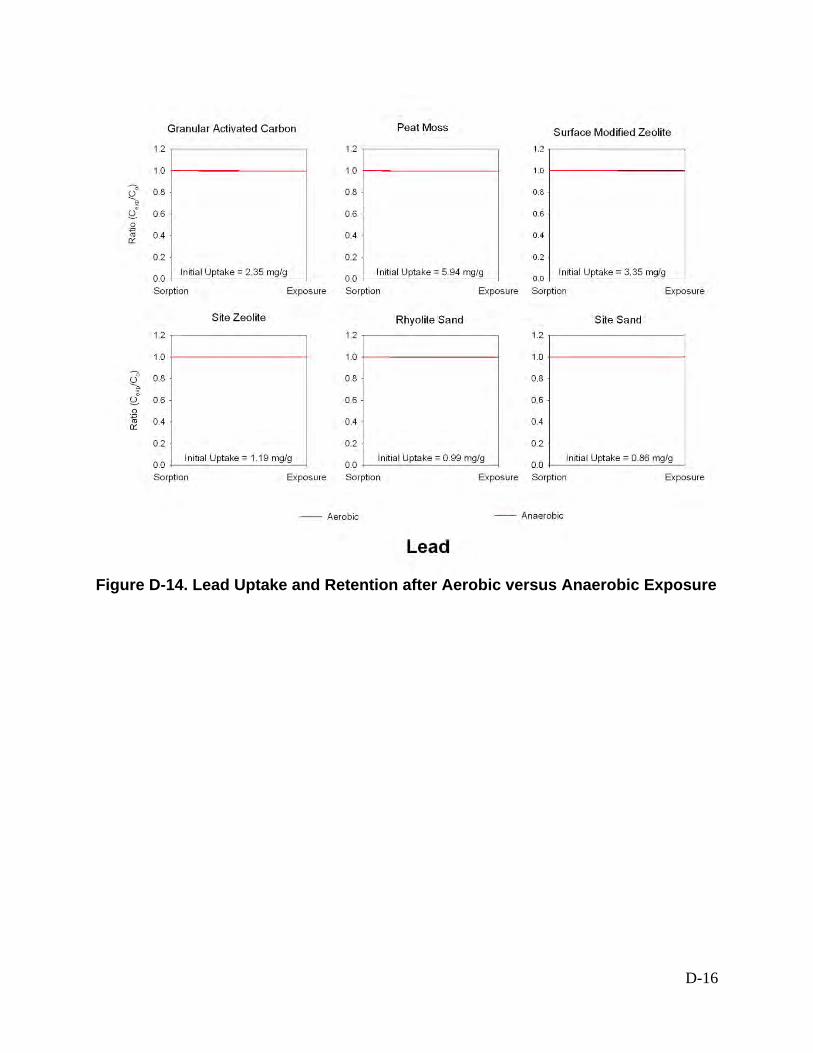
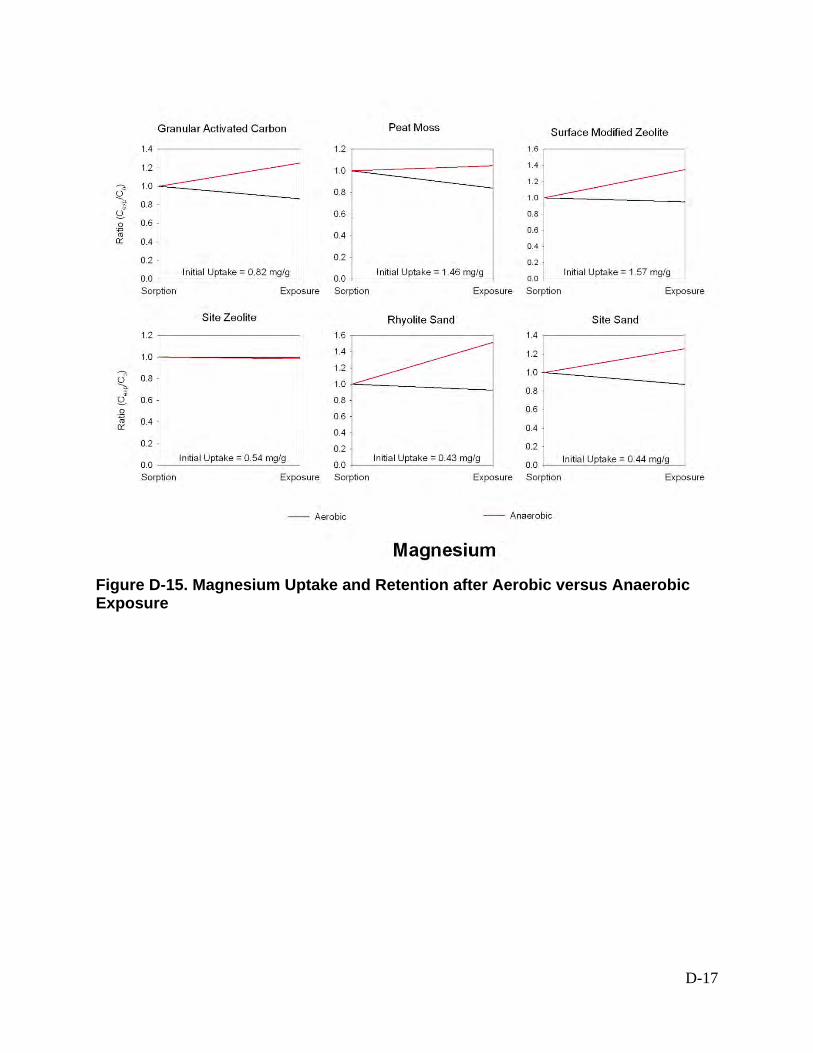
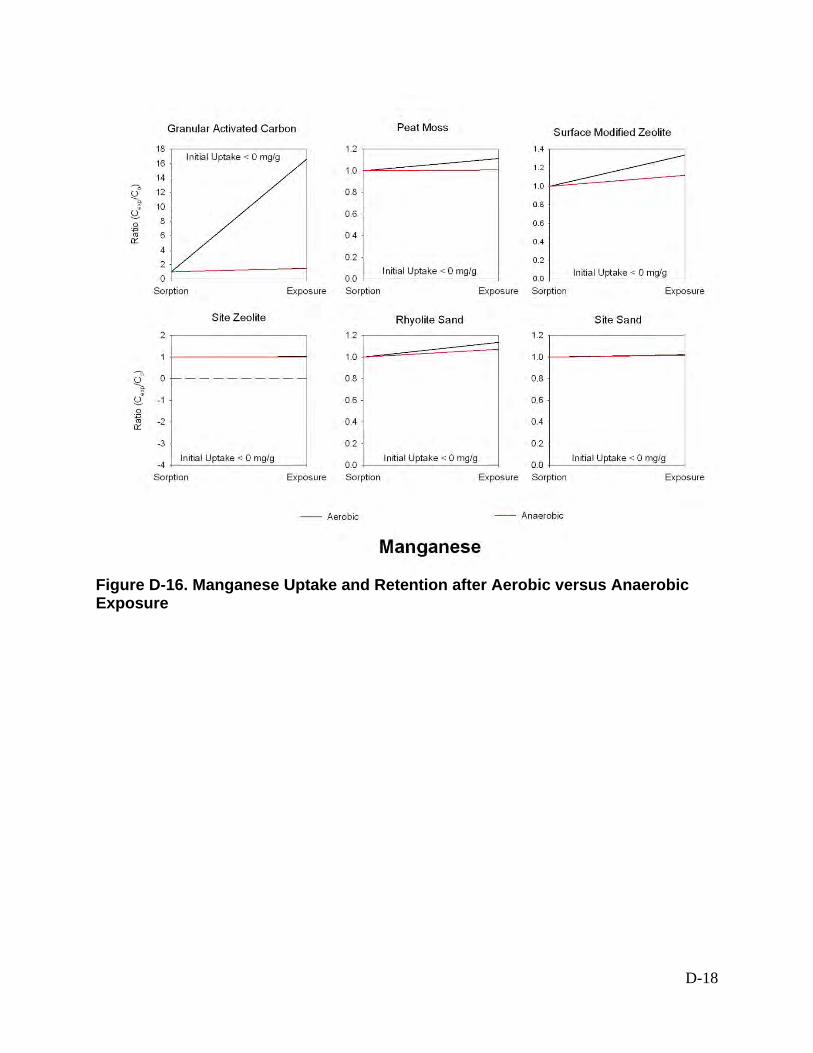
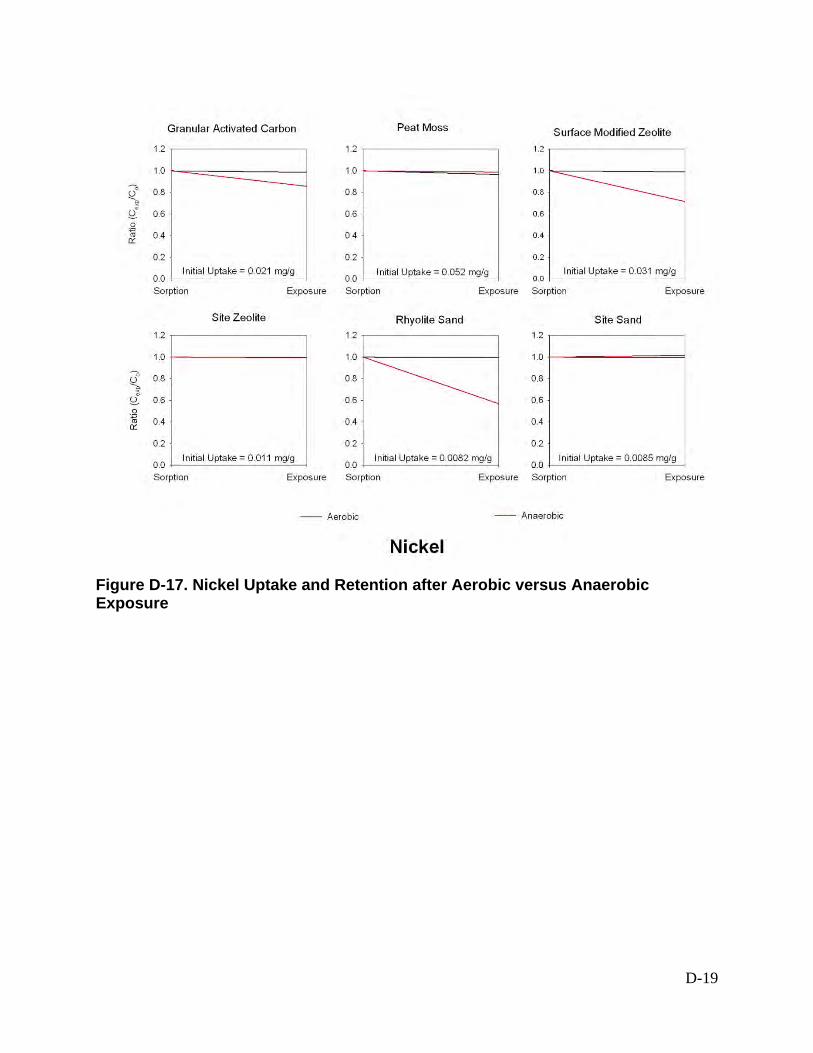
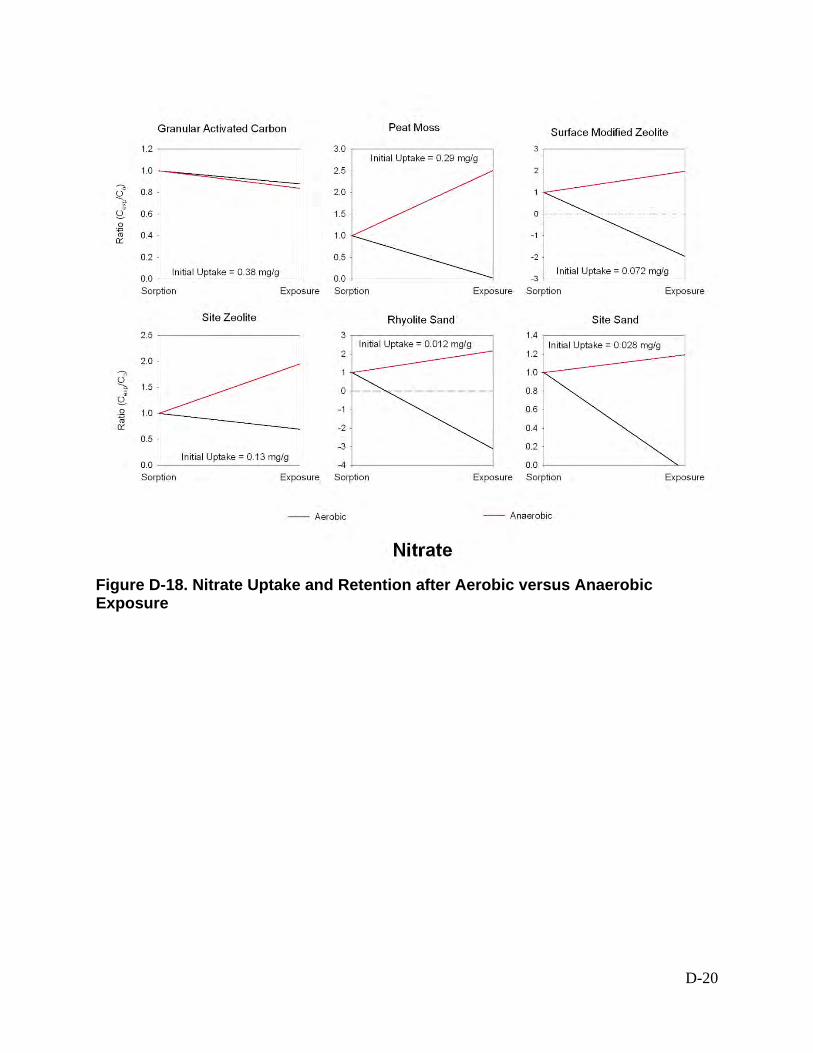
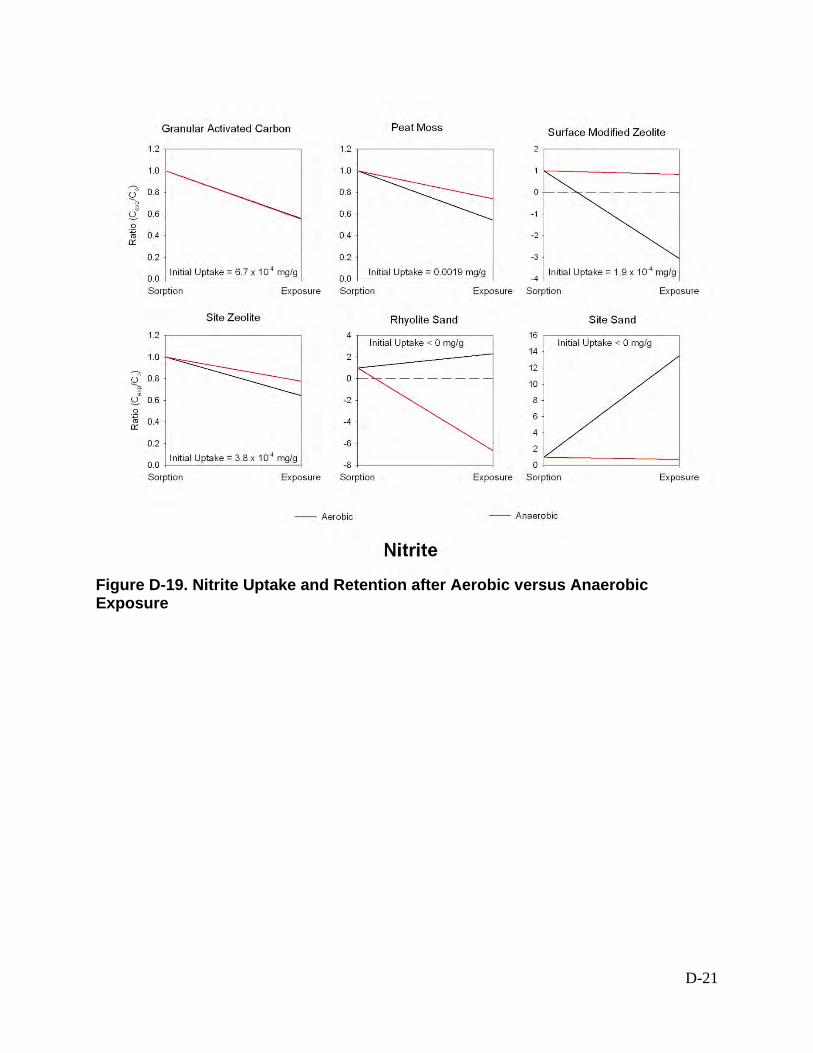
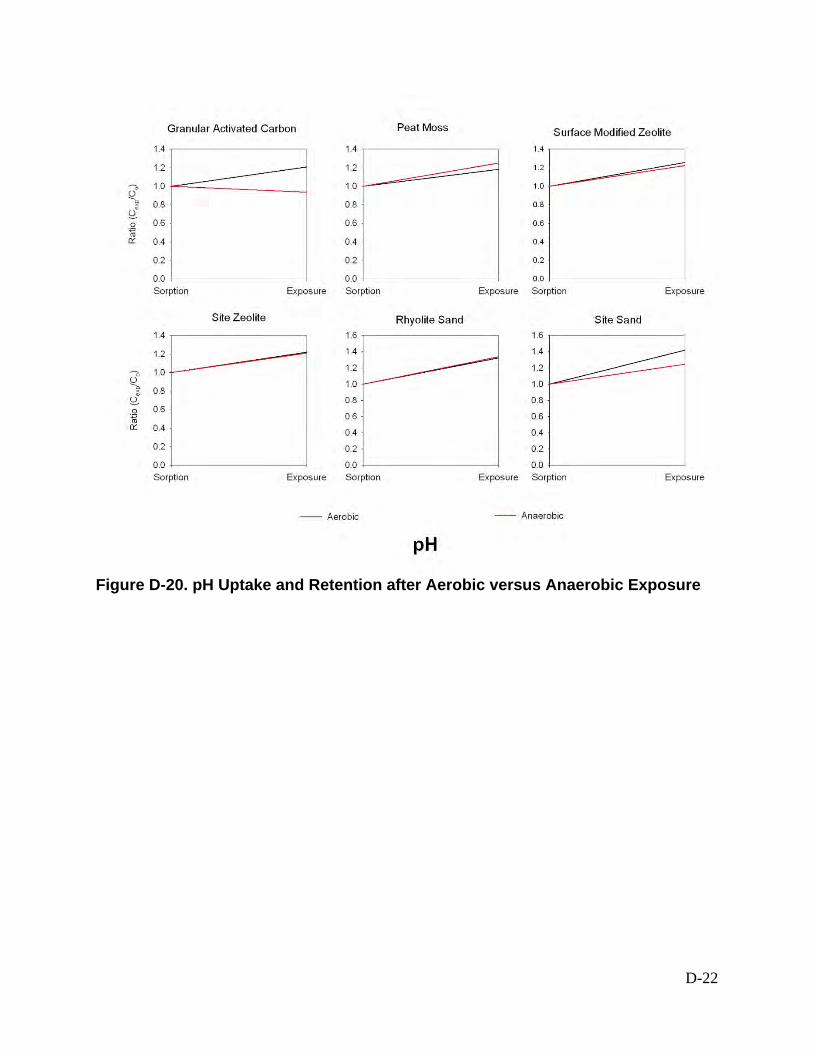
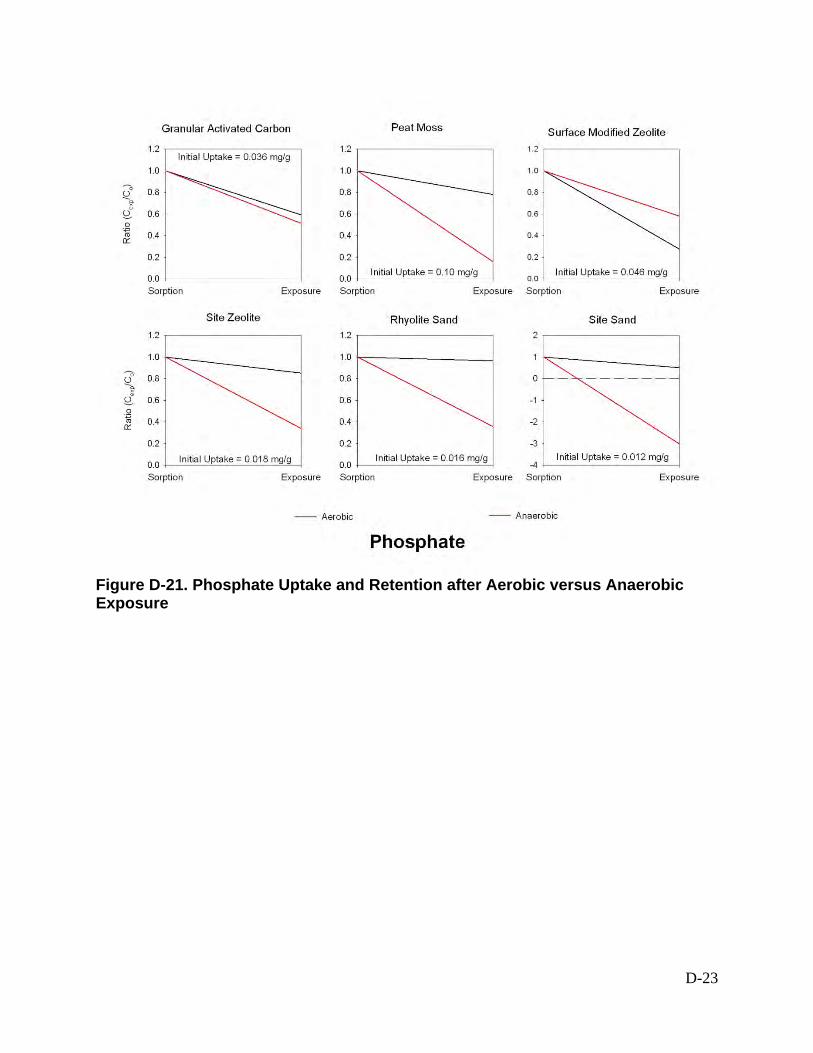
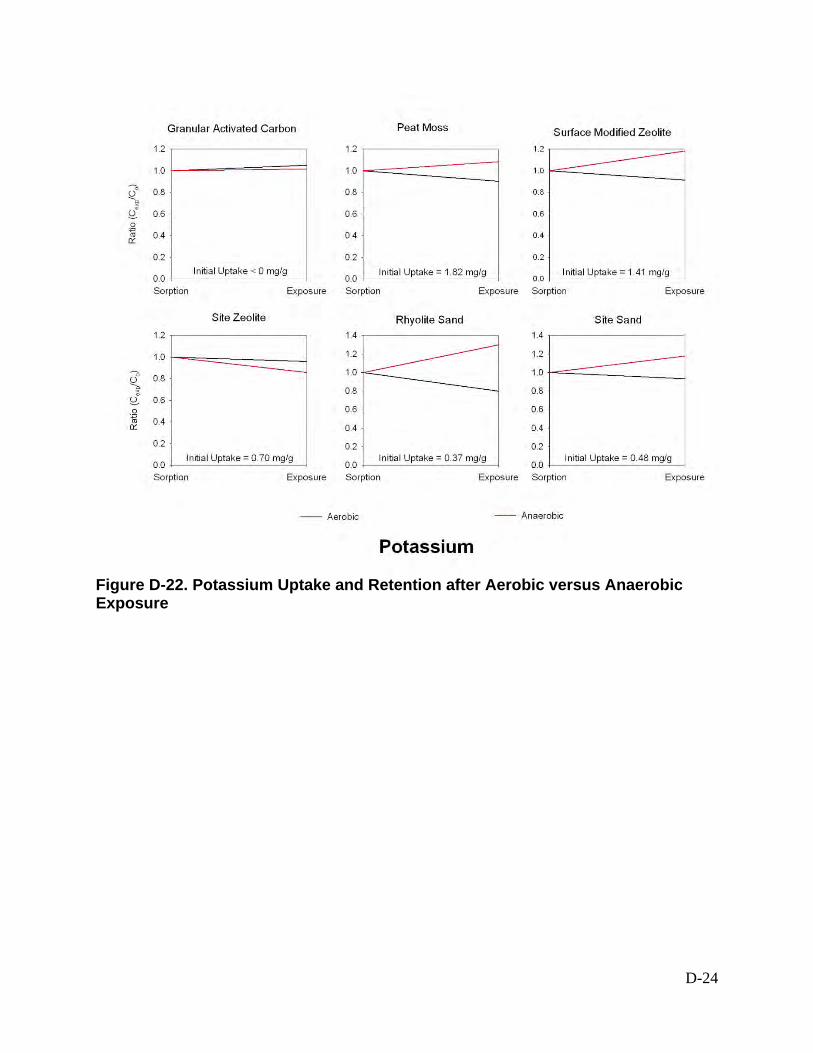
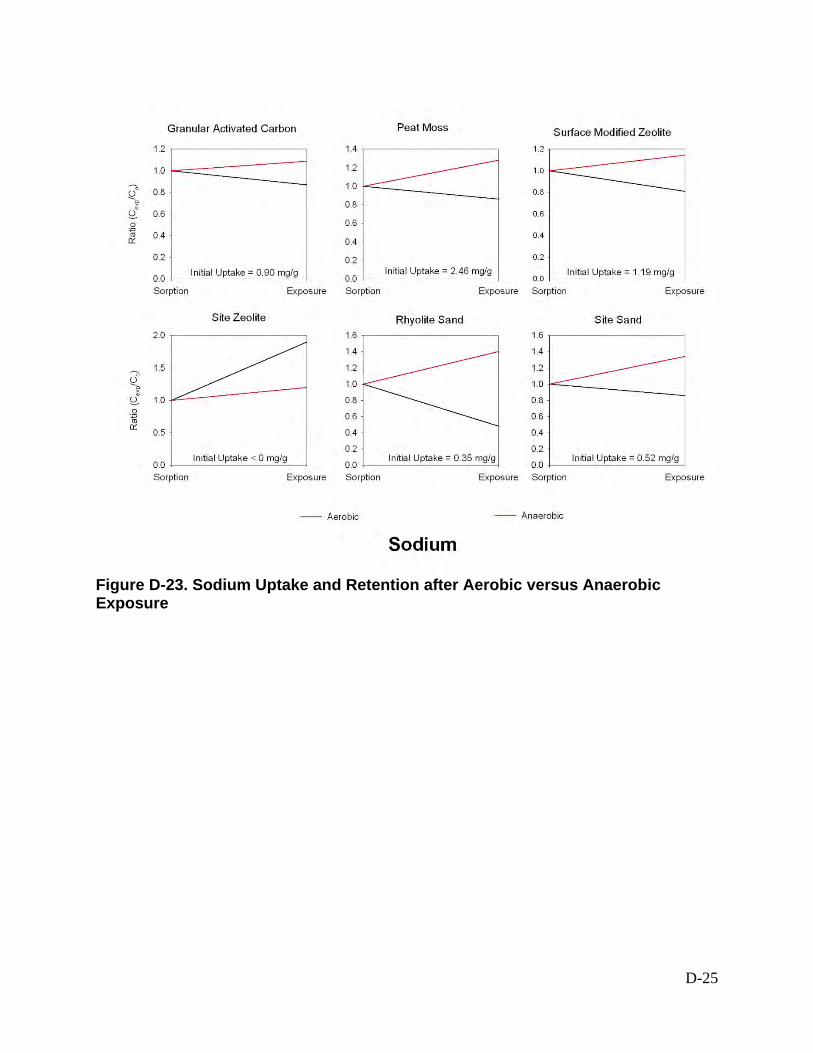
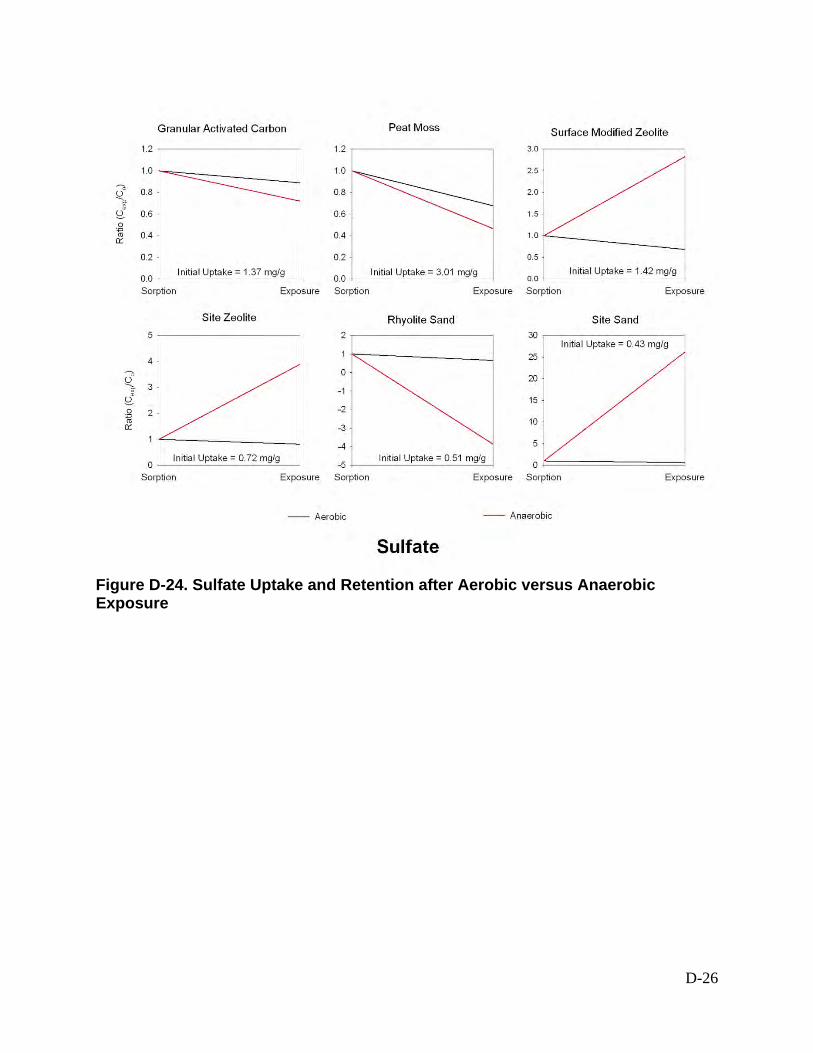
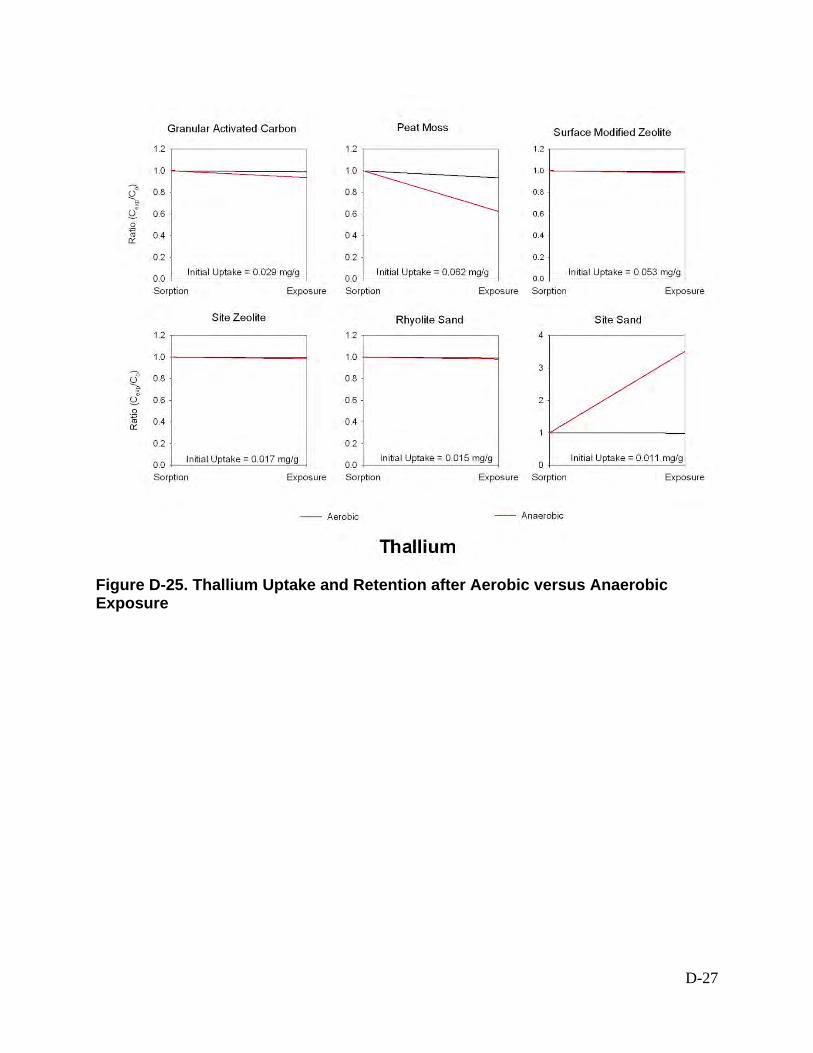
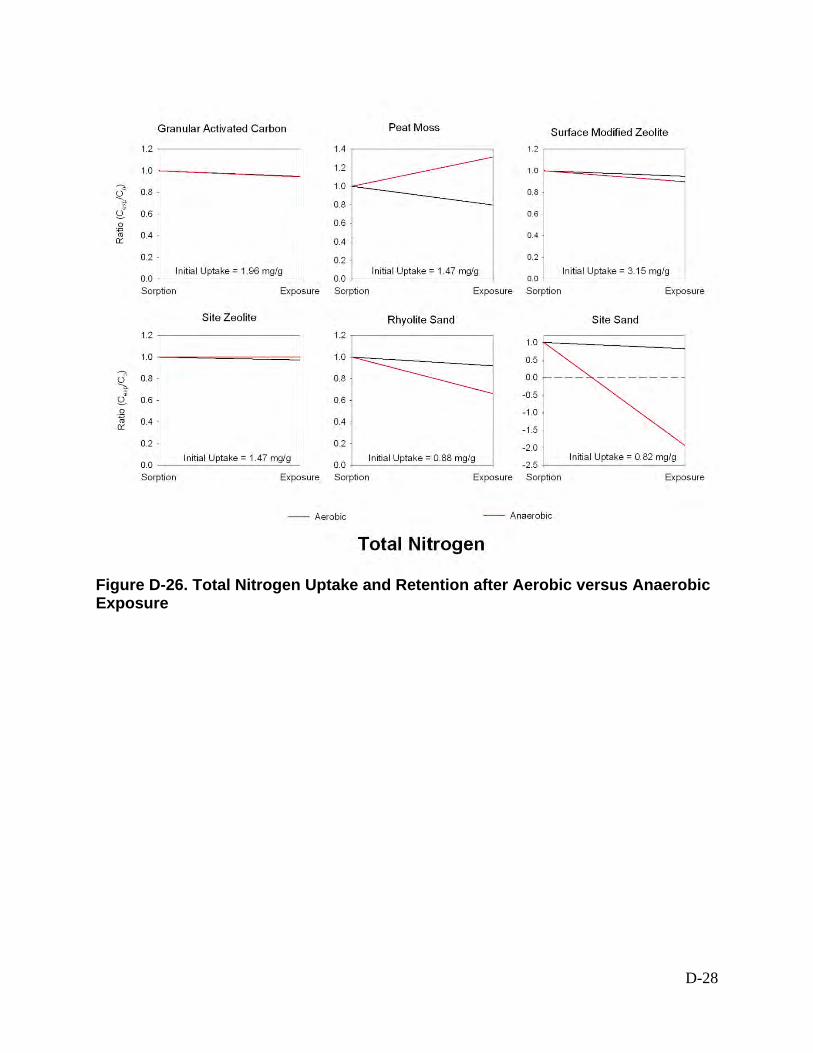
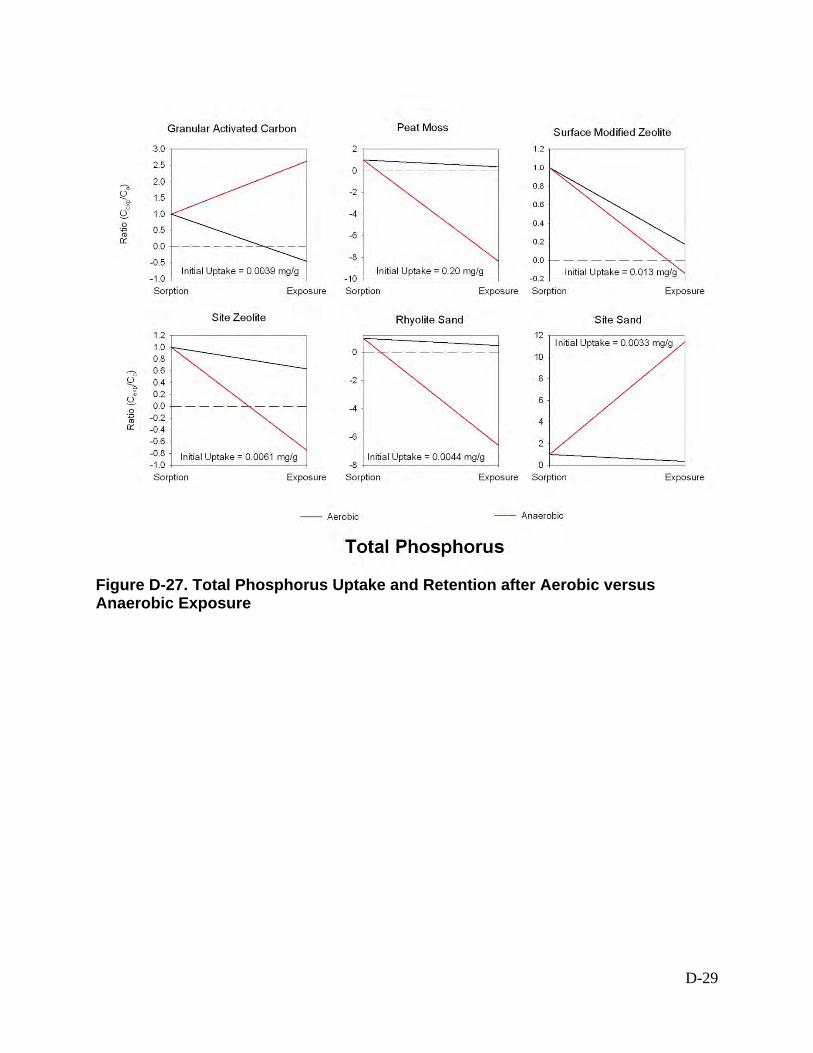
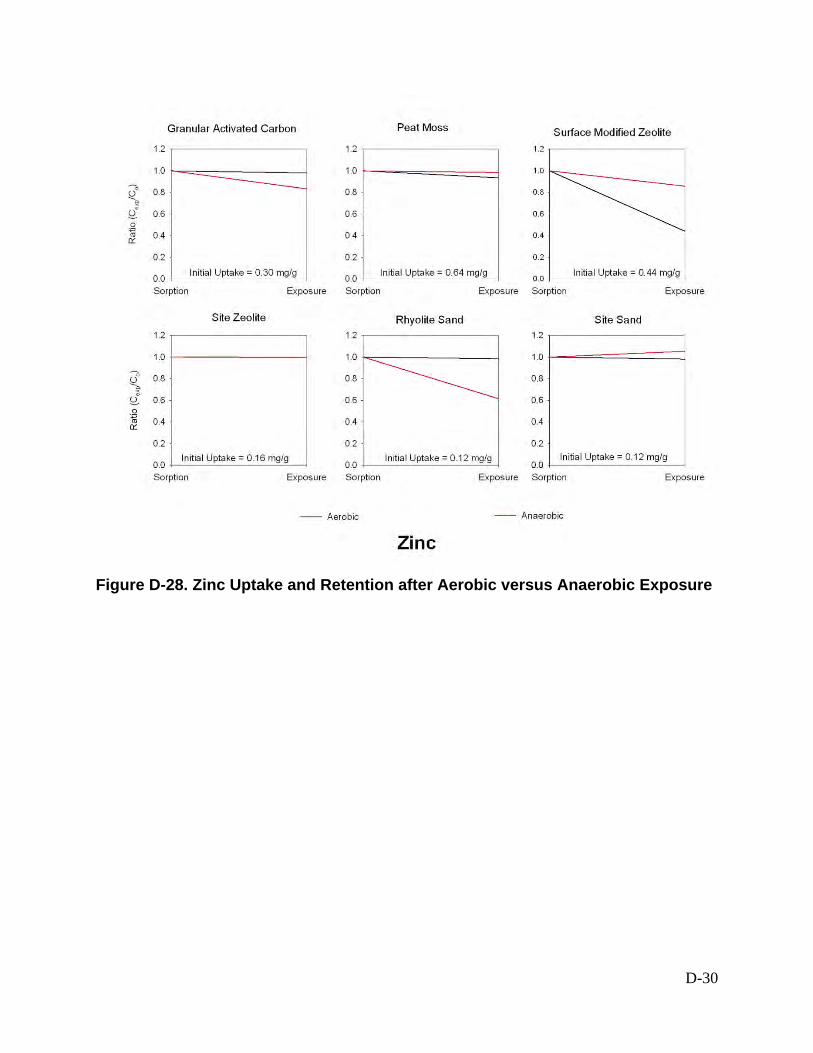
D-1 Appendix D: Aerobic and Anaerobic Leaching Tests This appendix contains the entire data set for the aerobic and anaerobic testing. Testing was performed for the potential components of the final media mix as described in Section 3. The data points labeled as sorption is the initial loading of the media. The exposure data points are the loadings on the media after the media has been exposed to unspiked stormwater for a minimum of three weeks. The data in these graphs have been normalized by dividing the water constituent concentration in both sorption and exposure by the post-sorption water concentration and by dividing by the mass of the media. The initial loading on the media also is given on each figure as mg constituent/g media. Initial loadings that are less than zero indicate that the media released that constituent rather than removing it from the water. Decreases in concentration after exposure (Cexp/Co < 1) indicate that pollutant retention during quiescent times is not likely to occur, and the constituent(s) will likely be washed out during the first flush. Increases in concentration after exposure (Cexp/Co > 1) indicate that additional pollutant retention capacity was available.
Transcript of Appendix D: Aerobic and Anaerobic Leaching Tests · · 2017-08-29Appendix D: Aerobic and...
D-1
Appendix D: Aerobic and Anaerobic Leaching Tests
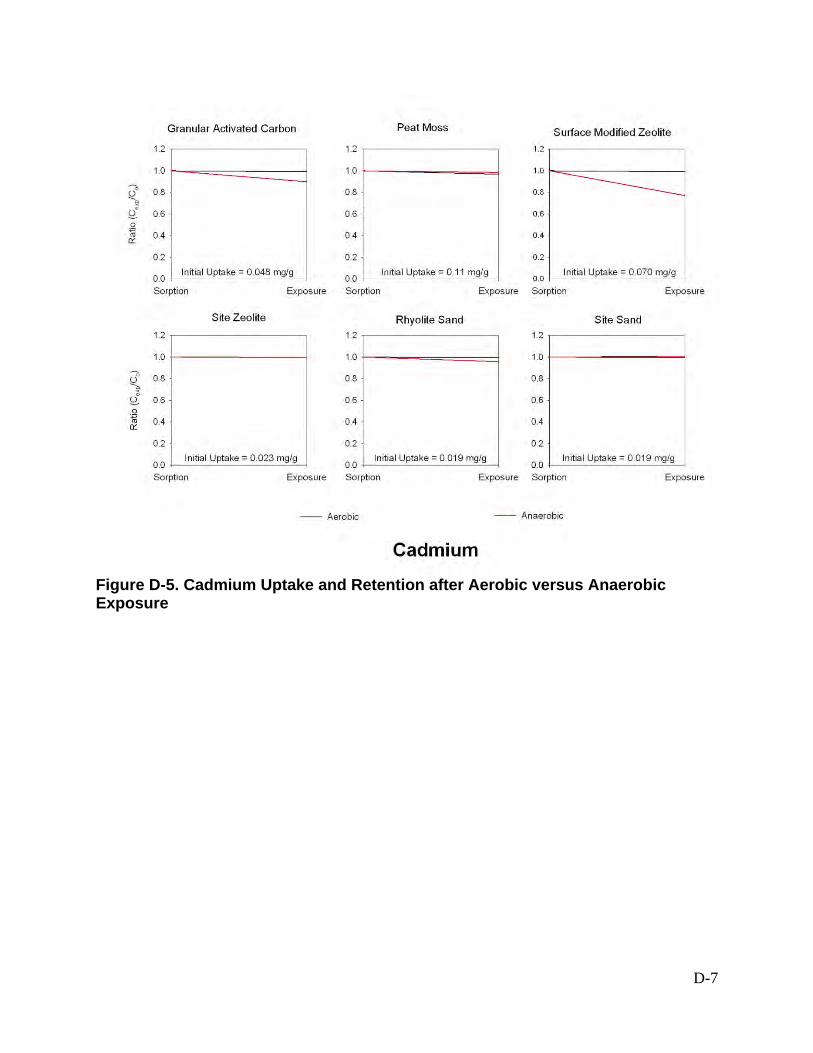
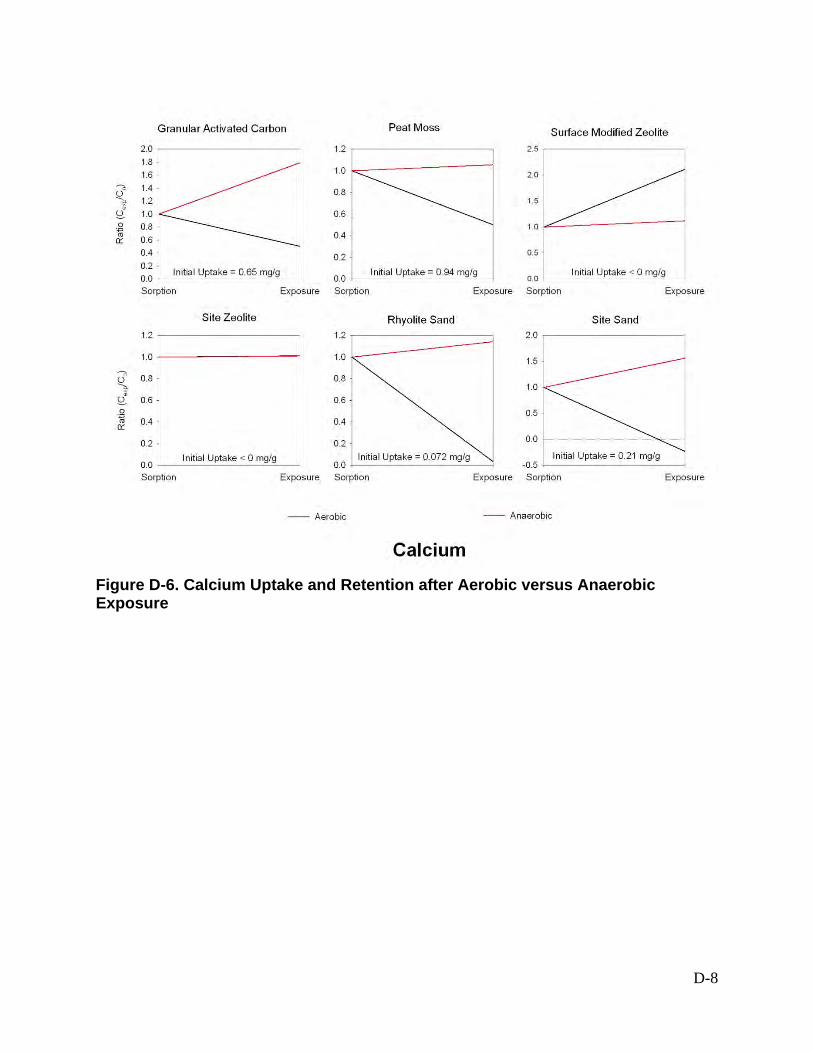
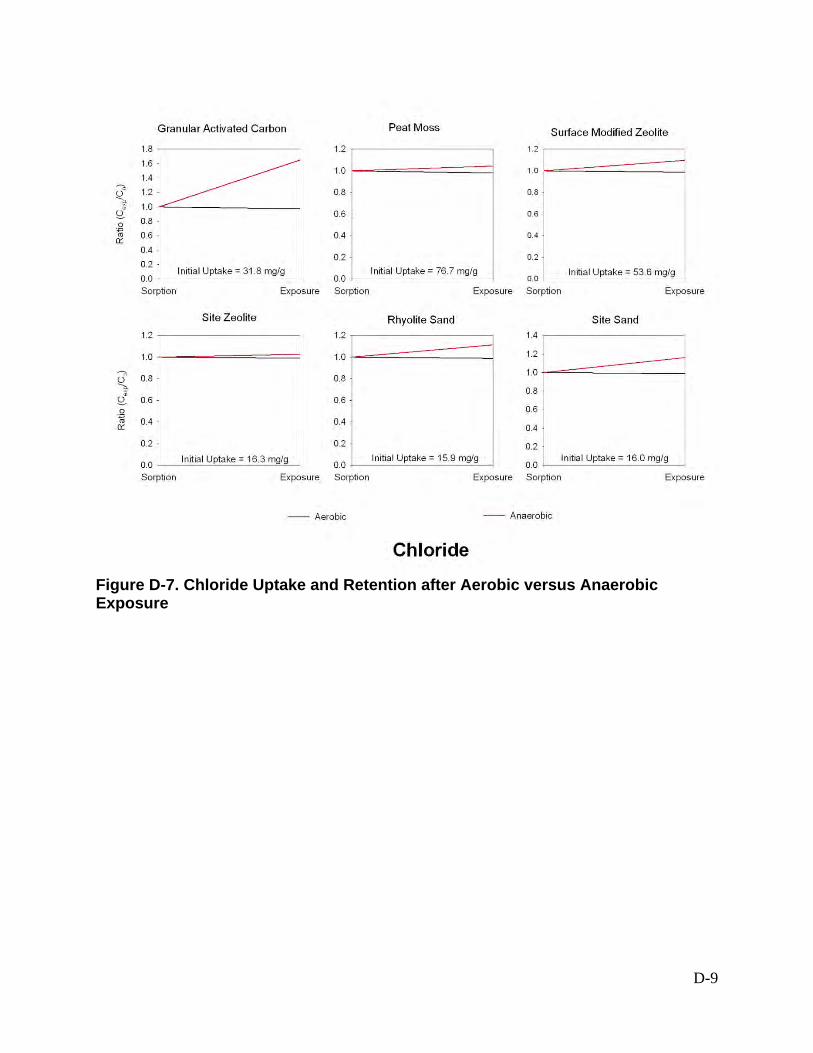
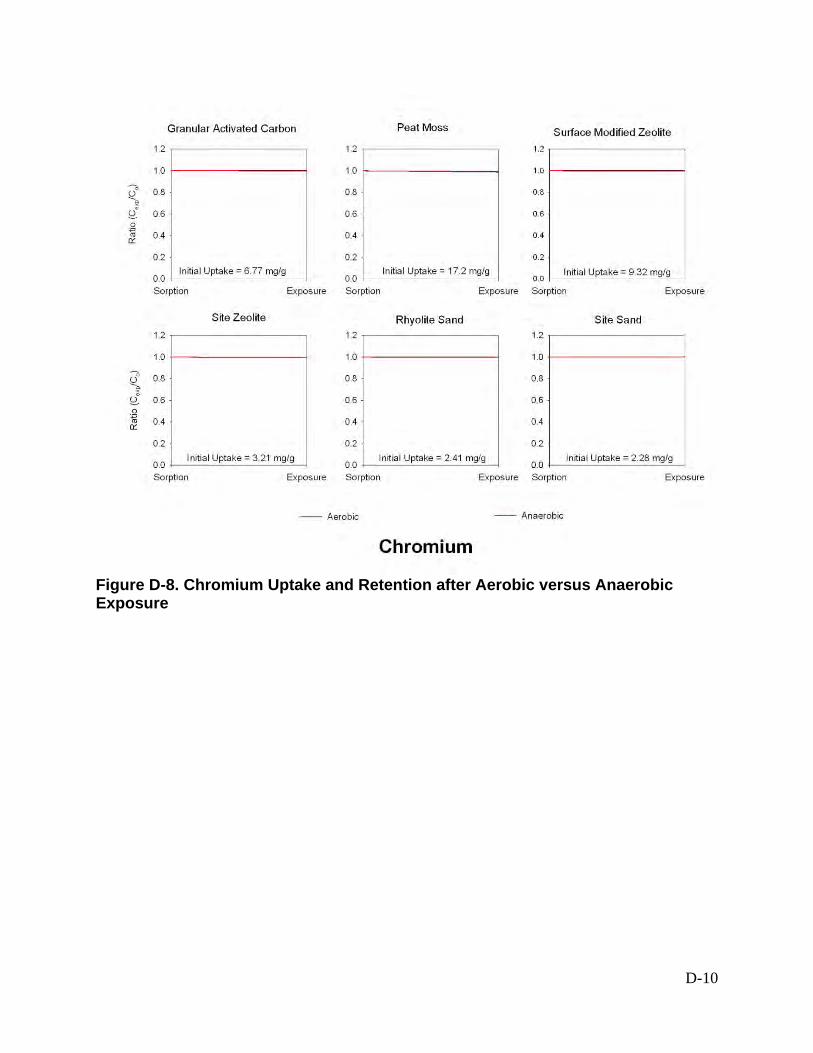
This appendix contains the entire data set for the aerobic and anaerobic testing. Testing was performed for the potential components of the final media mix as described in Section 3. The data points labeled as sorption is the initial loading of the media. The exposure data points are the loadings on the media after the media has been exposed to unspiked stormwater for a minimum of three weeks. The data in these graphs have been normalized by dividing the water constituent concentration in both sorption and exposure by the post-sorption water concentration and by dividing by the mass of the media. The initial loading on the media also is given on each figure as mg constituent/g media. Initial loadings that are less than zero indicate that the media released that constituent rather than removing it from the water. Decreases in concentration after exposure (Cexp/Co < 1) indicate that pollutant retention during quiescent times is not likely to occur, and the constituent(s) will likely be washed out during the first flush. Increases in concentration after exposure (Cexp/Co > 1) indicate that additional pollutant retention capacity was available.
D-2
List of Figures for Appendix D Figure D-1. Aluminum Uptake and Retention after Aerobic versus Anaerobic Exposure 3 Figure D-2. Ammonia Uptake and Retention after Aerobic versus Anaerobic Exposure . 4 Figure D-3. Antimony Uptake and Retention after Aerobic versus Anaerobic Exposure . 5 Figure D-4. Boron Uptake and Retention after Aerobic versus Anaerobic Exposure ....... 6 Figure D-5. Cadmium Uptake and Retention after Aerobic versus Anaerobic Exposure . 7 Figure D-6. Calcium Uptake and Retention after Aerobic versus Anaerobic Exposure ... 8 Figure D-7. Chloride Uptake and Retention after Aerobic versus Anaerobic Exposure ... 9 Figure D-8. Chromium Uptake and Retention after Aerobic versus Anaerobic Exposure....................................................................................................................................................... 10 Figure D-9. Chemical Oxygen Demand Uptake and Retention after Aerobic versus Anaerobic Exposure .................................................................................................................. 11 Figure D-10. Copper Uptake and Retention after Aerobic versus Anaerobic Exposure 12 Figure D-11. Fluoride Uptake and Retention after Aerobic versus Anaerobic Exposure 13 Figure D-12. Hardness Uptake and Retention after Aerobic versus Anaerobic Exposure....................................................................................................................................................... 14 Figure D-13. Iron Uptake and Retention after Aerobic versus Anaerobic Exposure ....... 15 Figure D-14. Lead Uptake and Retention after Aerobic versus Anaerobic Exposure ..... 16 Figure D-15. Magnesium Uptake and Retention after Aerobic versus Anaerobic Exposure ...................................................................................................................................... 17 Figure D-16. Manganese Uptake and Retention after Aerobic versus Anaerobic Exposure ...................................................................................................................................... 18 Figure D-17. Nickel Uptake and Retention after Aerobic versus Anaerobic Exposure ... 19 Figure D-18. Nitrate Uptake and Retention after Aerobic versus Anaerobic Exposure .. 20 Figure D-19. Nitrite Uptake and Retention after Aerobic versus Anaerobic Exposure ... 21 Figure D-20. pH Uptake and Retention after Aerobic versus Anaerobic Exposure ........ 22 Figure D-21. Phosphate Uptake and Retention after Aerobic versus Anaerobic Exposure ...................................................................................................................................... 23 Figure D-22. Potassium Uptake and Retention after Aerobic versus Anaerobic Exposure....................................................................................................................................................... 24 Figure D-23. Sodium Uptake and Retention after Aerobic versus Anaerobic Exposure 25 Figure D-24. Sulfate Uptake and Retention after Aerobic versus Anaerobic Exposure . 26 Figure D-25. Thallium Uptake and Retention after Aerobic versus Anaerobic Exposure....................................................................................................................................................... 27 Figure D-26. Total Nitrogen Uptake and Retention after Aerobic versus Anaerobic Exposure ...................................................................................................................................... 28 Figure D-27. Total Phosphorus Uptake and Retention after Aerobic versus Anaerobic Exposure ...................................................................................................................................... 29 Figure D-28. Zinc Uptake and Retention after Aerobic versus Anaerobic Exposure ...... 30
D-3
Figure D-1. Aluminum Uptake and Retention after Aerobic versus Anaerobic Exposure
D-4
Figure D-2. Ammonia Uptake and Retention after Aerobic versus Anaerobic Exposure
D-5
Figure D-3. Antimony Uptake and Retention after Aerobic versus Anaerobic Exposure
D-6
Figure D-4. Boron Uptake and Retention after Aerobic versus Anaerobic Exposure
D-7
Figure D-5. Cadmium Uptake and Retention after Aerobic versus Anaerobic Exposure
D-8
Figure D-6. Calcium Uptake and Retention after Aerobic versus Anaerobic Exposure
D-9
Figure D-7. Chloride Uptake and Retention after Aerobic versus Anaerobic Exposure
D-10
Figure D-8. Chromium Uptake and Retention after Aerobic versus Anaerobic Exposure

D-11
Figure D-9. Chemical Oxygen Demand Uptake and Retention after Aerobic versus Anaerobic Exposure
D-12
Figure D-10. Copper Uptake and Retention after Aerobic versus Anaerobic Exposure
D-13
Figure D-11. Fluoride Uptake and Retention after Aerobic versus Anaerobic Exposure
D-14
Figure D-12. Hardness Uptake and Retention after Aerobic versus Anaerobic Exposure
D-15
Figure D-13. Iron Uptake and Retention after Aerobic versus Anaerobic Exposure
D-16
Figure D-14. Lead Uptake and Retention after Aerobic versus Anaerobic Exposure
D-17
Figure D-15. Magnesium Uptake and Retention after Aerobic versus Anaerobic Exposure
D-18
Figure D-16. Manganese Uptake and Retention after Aerobic versus Anaerobic Exposure
D-19
Figure D-17. Nickel Uptake and Retention after Aerobic versus Anaerobic Exposure
D-20
Figure D-18. Nitrate Uptake and Retention after Aerobic versus Anaerobic Exposure
D-21
Figure D-19. Nitrite Uptake and Retention after Aerobic versus Anaerobic Exposure
D-22
Figure D-20. pH Uptake and Retention after Aerobic versus Anaerobic Exposure
D-23
Figure D-21. Phosphate Uptake and Retention after Aerobic versus Anaerobic Exposure
D-24
Figure D-22. Potassium Uptake and Retention after Aerobic versus Anaerobic Exposure
D-25
Figure D-23. Sodium Uptake and Retention after Aerobic versus Anaerobic Exposure
D-26
Figure D-24. Sulfate Uptake and Retention after Aerobic versus Anaerobic Exposure
D-27
Figure D-25. Thallium Uptake and Retention after Aerobic versus Anaerobic Exposure
D-28
Figure D-26. Total Nitrogen Uptake and Retention after Aerobic versus Anaerobic Exposure
D-29
Figure D-27. Total Phosphorus Uptake and Retention after Aerobic versus Anaerobic Exposure
D-30
Figure D-28. Zinc Uptake and Retention after Aerobic versus Anaerobic Exposure