Appendix B. Sample Problem - Sophia - Inria€¦ · Appendix B. Sample Problem B.1 Purpose The...
31
SysML Specification v1.0 Draft 171 Appendix B. Sample Problem B.1 Purpose The purpose of this appendix is to illustrate how SysML can support of the specification, analysis, and design of a system using some of the basic features of the language. B.2 Scope The scope of this example is to provide at least one diagram for each SysML diagram type. The intent is to select simplified fragments of the problem to illustrate how the diagrams can be applied, and also demonstrate some of the possible inter- relationships among the model elements in the different diagrams. The sample problem does not highlight all of the features of the language. The reader should refer to the individual chapters for more detailed features of the language. The diagrams selected for representing a particular aspect of the model, and the ordering of the diagrams are intended to be representative of applying a typical systems engineering process, but this will vary depending on the specific process and methodology that is used. B.3 Problem Summary The sample problem describes the use of SysML as it applies to the development of an automobile, in particular a Hybrid gas/ electric powered Sport Utility Vehicle (SUV). This problem is interesting in that it has inherently conflicting requirements, viz. desire for fuel efficiency, but also desire for large cargo carrying capacity and off-road capability. Technical accuracy and the feasibility of the actual solution proposed were not high priorities. This sample problem focuses on design decisions surrounding the power subsystem of the hybrid SUV; the requirements, performance analyses, structure, and behavior. This appendix is structured to show each diagram in the context of how it might be used on such a example problem. The first section shows SysML diagrams as they might be used to establish the system context; establishing system boundaries, and top level use cases. The next section is provided to show how SysML diagrams can be used to analyze top level system behavior, using sequence diagrams and state machine diagrams. The following section focuses on use of SysML diagrams for capturing and deriving requirements, using diagrams and tables. A section is provided to illustrate how SysML is used to depict system structure, including block hierarchy and part relationships. The relationship of various system parameters, performance constraints, analyses, and timing diagrams are illustrated in the next section. A section is then dedicated to illustrating definition and depiction of interfaces and flows in a structural context. The final section focuses on detailed behavior modeling, functional and flow allocation. B.4 Diagrams B.4.1 Package Overview (Structure of the Sample Model) B.4.1.1 Package Diagram - applying the SysML Profile As shown in Figure B-1,the HSUVModel is a package that represents the user model. The SysML Profile must be applied to this package in order to include stereotypes from the profile. The HSUVModel may also require model libraries, such as the SI Units Types model library. The model libraries must be imported into the user model as indicated.
Transcript of Appendix B. Sample Problem - Sophia - Inria€¦ · Appendix B. Sample Problem B.1 Purpose The...

SysML Specification v1.0 Draft 171
Appendix B. Sample Problem
B.1 PurposeThe purpose of this appendix is to illustrate how SysML can support of the specification, analysis, and design of a system using some of the basic features of the language.
B.2 ScopeThe scope of this example is to provide at least one diagram for each SysML diagram type. The intent is to select simplified fragments of the problem to illustrate how the diagrams can be applied, and also demonstrate some of the possible inter-relationships among the model elements in the different diagrams. The sample problem does not highlight all of the features of the language. The reader should refer to the individual chapters for more detailed features of the language. The diagrams selected for representing a particular aspect of the model, and the ordering of the diagrams are intended to be representative of applying a typical systems engineering process, but this will vary depending on the specific process and methodology that is used.
B.3 Problem SummaryThe sample problem describes the use of SysML as it applies to the development of an automobile, in particular a Hybrid gas/electric powered Sport Utility Vehicle (SUV). This problem is interesting in that it has inherently conflicting requirements, viz. desire for fuel efficiency, but also desire for large cargo carrying capacity and off-road capability. Technical accuracy and the feasibility of the actual solution proposed were not high priorities. This sample problem focuses on design decisions surrounding the power subsystem of the hybrid SUV; the requirements, performance analyses, structure, and behavior.
This appendix is structured to show each diagram in the context of how it might be used on such a example problem. The first section shows SysML diagrams as they might be used to establish the system context; establishing system boundaries, and top level use cases. The next section is provided to show how SysML diagrams can be used to analyze top level system behavior, using sequence diagrams and state machine diagrams. The following section focuses on use of SysML diagrams for capturing and deriving requirements, using diagrams and tables. A section is provided to illustrate how SysML is used to depict system structure, including block hierarchy and part relationships. The relationship of various system parameters, performance constraints, analyses, and timing diagrams are illustrated in the next section. A section is then dedicated to illustrating definition and depiction of interfaces and flows in a structural context. The final section focuses on detailed behavior modeling, functional and flow allocation.
B.4 Diagrams
B.4.1 Package Overview (Structure of the Sample Model)
B.4.1.1 Package Diagram - applying the SysML ProfileAs shown in Figure B-1,the HSUVModel is a package that represents the user model. The SysML Profile must be applied to this package in order to include stereotypes from the profile. The HSUVModel may also require model libraries, such as the SI Units Types model library. The model libraries must be imported into the user model as indicated.
Andre
Zone de texte
Note: moe = Measures Of Effectiveness

172 SysML Specification v1.0 Draft
Figure B-1. Establishing the User Model by Importing and Applying SysML Profile & Model Library. (Package Diagram)
Figure B-2 details the specification of units and valueTypes employed in this sample problem.
Figure B-2. Defining valueTypes and units to be Used in the Sample Problem.
B.4.1.2 Package Diagram - showing package structure of the modelThe package diagram Figure B-3 shows the structure of the model used to evaluate the sample problem. Model elements are contained in packages, and relationships between packages (or specific model elements) are shown on this diagram. The relationship between the views (OperationalView and PerformanceView) and the rest of the user model are explicitly expressed using the «access» relationship. Note that the «view» models contain no model elements of their own, and that changes to the model in other packages are automatically updated in the Operational and Performance Views.
pkg ModelingDomain [Establishing HSUV Model]
«modelLibrary»SI Definitions
«import»
«profile»SysML
HSUVModel
«apply»{strict}
«apply» {strict}
pkg ModelingDomain [Values and Units]
«modelLibrary»Automotive Value Types
Automotive Units
«modelLibrary»SI Definitions
«import»
«unit»{dimension=Power}
hp
«unit»{dimension=Temperature}
°F
«unit»{dimension=Acceleration}
g
«unit»{dimension=Mass}
lb
«unit»{dimension=Pressure}
psi
«unit»{dimension=Time}
sec
«unit»{dimension=Velocity}
mph
«unit»{dimension=Distance}
ft
«unit»{dimension=Volume}
ft^3
«valueType»unit = g
Accel
«valueType»unit = hp
Horsepwr
«valueType»Real
«valueType»unit = lb
Weight
«valueType»unit = mph
Vel
«valueType»unit = sec
Time
«valueType»unit = ft
Dist
«valueType»unit = psi
Press
«valueType»unit = °F
Temp
«valueType»unit = ft^3
Vol

SysML Specification v1.0 Draft 173
Figure B-3. Establishing Structure of the User Model using Packages and Views. (Package Diagram)
B.4.2 Setting the Context (Boundaries and Use Cases)
B.4.2.1 Internal Block Diagram - Setting Context The term “context diagram”, in Figure B-4, refers to a user defined usage of an internal block diagram, which depicts some of the top level entities in the overall enterprise and their relationships. The diagram usage enables the modeler or methodologist to specify a unique usage of a SysML diagram type using the extension mechanism described in the Diagram Appendix A. The entities are conceptual in nature during the initial phase of development, but will be refined as part of the development process. The «system» and «external» stereotypes are user defined, not specified in SysML, but help the modeler to identify the system of interest relative to its environment. Each model element depicted may include a graphical icon to help convey its intended meaning. The spatial relationship of the entities on the diagram sometimes conveys understanding as well, although this is not specifically captured in the semantics. Also, a background such as a map can be included to provide additional context. The associations among the classes may represent abstract conceptual relationships among the entities, which would be refined in subsequent diagrams. Note how the relationships in this diagram are also reflected in the Automotive Domain Model Block Definition Diagram, Figure B-15.
pkg HSUVModel
HSUVViews
HSUVRequirementsHSUVStructureHSUVBehavior
DeliverPowerBehavior
HSUVAnalysis
«view»Performance
View
«viewpoint»Performance
Viewpoint
«import»
«conform»
«block»Automotive
Domain
«view»OperationalView
«viewpoint»OperationalViewpoint
«conform»
«import»
«import»
HSUVUseCases
HSUVInterfaces«requirement»Performance
«import» AutomotiveValueTypes

174 SysML Specification v1.0 Draft
Figure B-4. Establishing the Context of the Hybrid SUV System using a User-Defined Context Diagram. (Internal Block Diagram) Completeness of Diagram Noted in Diagram Description.
B.4.2.2 Use Case Diagram - Top Level Use CasesThe use case diagram for “Drive Vehicle” in Figure B-5 depicts the drive vehicle usage of the vehicle system. The subject (HybridSUV) and the actors (Driver, Registered Owner, Maintainer, Insurance Company, DMV) interact to realize the use case.
«ContextDiagram»ibd [block] AutomotiveDomain
«external»drivingConditions:Environment
x1:
x4:
Maintainer:
x5:
«external»road:Road
«diagramDescription»version=”0.1"description=”Initial concept to identify top level domain entities"reference=”Ops Concept Description”completeness=”partial. Does not include gas pump and otherexternal interfaces.”
«external»object:ExternalObject
«system»HSUV:
HybridSUV
«external»weather:Weatherx2:
Driver:
Passenger:
1..*
1..*
«external»vehicleCargo:
Baggage
x3:

SysML Specification v1.0 Draft 175
Figure B-5. Establishing Top Level Use Cases for the Hybrid SUV. (Use Case Diagram)
B.4.2.3 Use Case Diagram - Operational Use CasesGoal-level Use Cases associated with “Operate the Vehicle” are depicted in the following diagram. These use cases help flesh out the specific kind of goals associated with driving and parking the vehicle. Maintenance, registration, and insurance of the vehicle would be covered under a separate set of goal-oriented use cases.
uc HSUVUseCases [TopLevelUseCases]
HybridSUV
Driver
Operate thevehicle
Maintain thevehicle
Maintainer
Insure thevehicle
Register thevehicle
InsuranceCompany
DepartmentOf MotorVehicles
RegisteredOwner

176 SysML Specification v1.0 Draft
Figure B-6. Establishing Operational Use Cases for “Drive the Vehicle”. (Use Case Diagram)
B.4.3 Elaborating Behavior (Sequence and State Machine Diagrams)
B.4.3.1 Sequence Diagram - Drive Black BoxFigure B-7 shows the interactions between driver and vehicle that are necessary for the “Drive the Vehicle” Use Case. This diagram represents the “DriveBlackBox” interaction, with is owned by the AutomotiveDomain block. “BlackBox” for the purpose of this example, refers to how the subject system (HybridSUV block) interacts only with outside elements, without revealing any interior detail.
The conditions for each alternative in the alt controlSpeed section are expressed in OCL, and relate to the states of the
uc HSUVUseCases [Operational Use Cases]
HybridSUV
Driver
AccelerateDrive the vehicle
Steer
Brake
«include»
«include»
«include»
Park «include»
«extend»
Start the vehicle

SysML Specification v1.0 Draft 177
HybridSUV block, as shown in Figure B-8..
Figure B-7. Elaborating Black Box Behavior for the “Drive the Vehicle” Use Case. (Sequence Diagram)
B.4.3.2 State Machine Diagram - HSUV Operational StatesFigure B-8 depicts the operational states of the HSUV block, via a State Machine named “HSUVOperationalStates”. Note that this state machine was developed in conjunction with the DriveBlackBox interaction in Figure B-7. Also note that this state machine refines the requirement “PowerSourceManagmeent”, which will be elaborated in the requirements section of this sample problem. This diagram expresses only the nominal states. Exception states, like “acceleratorFailure”, are not expressed on this diagram.

178 SysML Specification v1.0 Draft
Figure B-8. Finite State Machine Associated with “Drive the Vehicle”. (State Machine Diagram)
B.4.3.3 Sequence Diagram - Start Vehicle Black Box & White BoxThe Figure B-9 shows a “black box” interaction, but references “StartVehicleWhiteBox” (Figure B-10 below), which will decompose the lifelines within the context of the HybridSUV block.
stm HSUVOperationalStates
Operate
Idle
Accellerating/Cruising Braking
engageBrake
accelerate stopped
releaseBrake
shutOff
Off
start
keyOff
Refines«requirement»PowerSourceManagement
Nominalstates only

SysML Specification v1.0 Draft 179
Figure B-9. Black Box Interaction for “StartVehicle”, referencing White Box Interaction. (Sequence Diagram)
The lifelines on Figure B-10 (“whitebox” sequence diagram) need to come from the Power System decomposition. This now begins to consider parts contained in the HybridSUV block.
Figure B-10. White Box Interaction for “StartVehicle”. (Sequence Diagram)

180 SysML Specification v1.0 Draft
B.4.4 Establishing Requirements (Requirements Diagrams and Tables)
B.4.4.1 Requirement Diagram - HSUV Requirement HierarchyThe vehicle system specification contains many text based requirements. A few requirements are highlighted in Figure B-11 below, including the requirement for the vehicle to pass emissions standards, which is expanded for illustration purposes. The containment (cross hair) relationship, for purposes of this example, refers to the practice of decomposing a complex requirement into simpler, single requirements.
Figure B-11. Establishing HSUV Requirements Hierarchy (containment). (Requirements Diagram)
B.4.4.2 Requirement Diagram - Derived RequirementsFigure B-12 shows a set of requirements derived from the lowest tier requirements in the HSUV specification. Derived requirements, for the purpose of this example, express the concepts of requirements in the HSUVSpecification in a manner that specifically relates them to the HSUV system. Various other model elements may be necessary to help develop a derived requirement, and these model element may be related by a «refinedBy» relationship. Note how PowerSourceManagement is “RefinedBy” the HSUVOperationalStates model (Figure B-8). Note also that rationale can be attached to the «deriveReqt» relationship. In this case, rationale is provided by a referenced document “Hybrid Design Guidance”.
req [package] HSUVRequirements [HSUV Specification]
«requirement»Eco-Friendliness
«requirement»Performance
«requirement»Capacity«requirement»
Ergonomics
«requirement»Braking
«requirement»FuelEconomy
«requirement»OffRoadCapability
«requirement»Accelleration
Id = R1.2.1text = The vehicle shall meet Ultra-LowEmissions Vehicle standards.
«requirement»Emissions
«requirement»PassengerCapacity
«requirement»FuelCapacity
«requirement»CargoCapacity
HSUVSpecification
«requirement»Qualification
«requirement»SafetyTest

SysML Specification v1.0 Draft 181
Figure B-12. Establishing Derived Requirements and Rationale from Lowest Tier of Requirements Hierarchy. (Requirements Diagram)
B.4.4.3 Requirement Diagram - Acceleration Requirement RelationshipsFigure B-13 focuses on the Acceleration requirement, and relates it to other requirements and model elements. The “refineReqt” relation, introduced in Figure B-12, shows how the Acceleration requirement is refined by a similarly named use case. The Power requirement is satisfied by the PowerSubsystem, and a Max Acceleration test case verifies the Acceleration requirement.
req [package] HSUVRequirements [Requirement Derivation]
«requirement»Braking
«requirement»FuelEconomy
«requirement»RegenerativeBraking
«requirement»PowerSourceManagement
«requirement»Power
«deriveReqt»«deriveReqt»
«deriveReqt»
«deriveReqt»
«requirement»Accelleration
«requirement»CargoCapacity
«requirement»FuelCapacity
«requirement»OffRoadCapability
«requirement»Range
«deriveReqt» «deriveReqt»
«deriveReqt» «deriveReqt» «deriveReqt»
RefinedByHSUVStructure::HSUV.HSUVOperationalStates
«rationale»Power delivery must happen by coordinatedcontrol of gas and electric motors. See“Hybrid Design Guidance”
«problem»Power needed for acceleration, off-roadperformance & cargo capacity conflictswith fuel economy

182 SysML Specification v1.0 Draft
Figure B-13. Acceleration Requirement Relationships. (Requirements Diagram)
B.4.4.4 Table - Requirements TableFigure B-14 contains two diagrams that show requirement containment (decomposition), and requirements derivation in tabular form. This is a more compact representation than the requirements diagrams shown previously.
req [package] HSUVRequirements [Acceleration Requirement Refinement and Verification]
«requirement»Acceleration
HSUVUseCases::Accelerate
«block»PowerSubsystem
«refine»
«satisfy»
«requirement»Power
«deriveReqt»
«testCase»Max Acceleration
«verify»
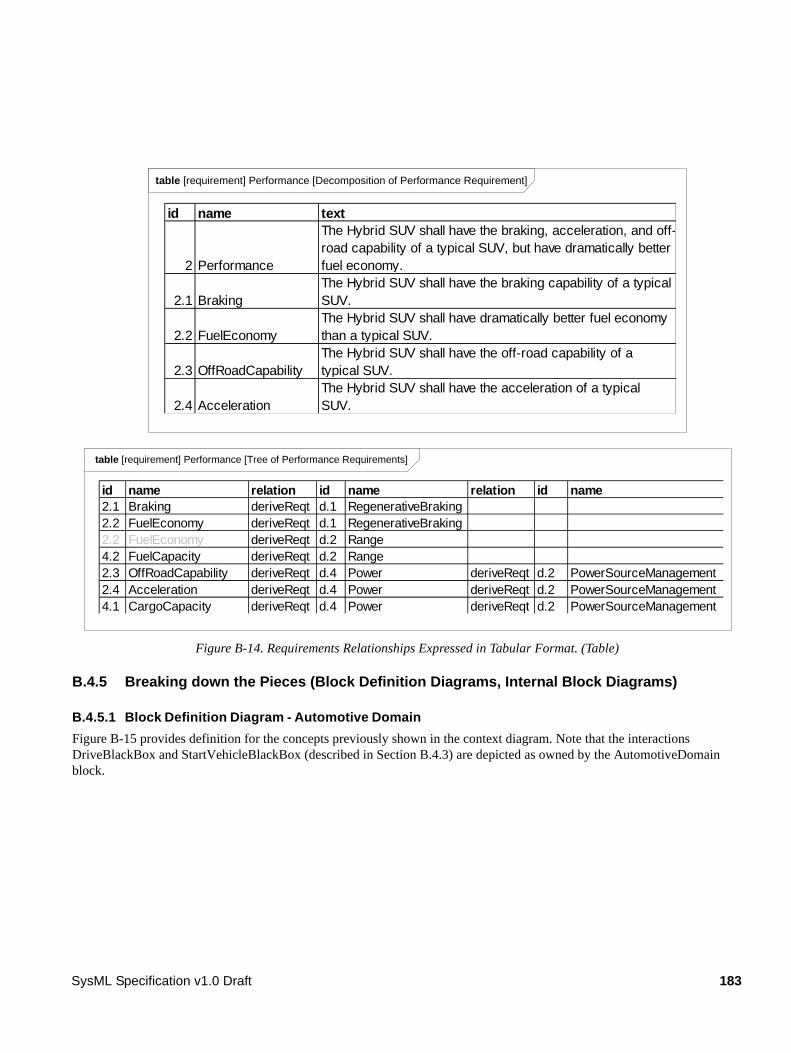
table [requirement] Performance [Decomposition of Performance Requirement]
id name text
2 Performance
The Hybrid SUV shall have the braking, acceleration, and off-road capability of a typical SUV, but have dramatically better fuel economy.
2.1 BrakingThe Hybrid SUV shall have the braking capability of a typical SUV.
2.2 FuelEconomyThe Hybrid SUV shall have dramatically better fuel economy than a typical SUV.
2.3 OffRoadCapabilityThe Hybrid SUV shall have the off-road capability of a typical SUV.
2.4 AccelerationThe Hybrid SUV shall have the acceleration of a typical SUV.
table [requirement] Performance [Tree of Performance Requirements]
id name relation id name relation id name2.1 Braking deriveReqt d.1 RegenerativeBraking2.2 FuelEconomy deriveReqt d.1 RegenerativeBraking2.2 FuelEconomy deriveReqt d.2 Range4.2 FuelCapacity deriveReqt d.2 Range2.3 OffRoadCapability deriveReqt d.4 Power deriveReqt d.2 PowerSourceManagement2.4 Acceleration deriveReqt d.4 Power deriveReqt d.2 PowerSourceManagement4.1 CargoCapacity deriveReqt d.4 Power deriveReqt d.2 PowerSourceManagement
SysML Specification v1.0 Draft 183
Figure B-14. Requirements Relationships Expressed in Tabular Format. (Table)
B.4.5 Breaking down the Pieces (Block Definition Diagrams, Internal Block Diagrams)
B.4.5.1 Block Definition Diagram - Automotive Domain Figure B-15 provides definition for the concepts previously shown in the context diagram. Note that the interactions DriveBlackBox and StartVehicleBlackBox (described in Section B.4.3) are depicted as owned by the AutomotiveDomain block.

184 SysML Specification v1.0 Draft
Figure B-15. Defining the Automotive Domain (compare with Figure B-4 ). (Block Definition Diagram)
B.4.5.2 Block Definition Diagram - Hybrid SUVFigure B-16 defines components of the HybridSUV block Note that the BrakePedal and WheelHubAssembly are used by, but not contained in, the PowerSubsystem block.
Figure B-16. Defining Structure of the Hybrid SUV System. (Block Definition Diagram)
bdd [package] HSUVStructure [Automotive Domain Breakdown]
interactionsDriveBlackBoxStartVehicleBlackBox
«domain»AutomotiveDomain
«system»HybridSUV
«external»Baggage
Driver Maintainer Passenger
«external»Environment
«external»Road
1..* road
drivingConditionsvehicleCargoHSUV
«external»Weather
«external»ExternalObject
1..* objectweather
bdd [block] AutomotiveDomain [HybridSUV Breakdown]
«system»HybridSUV
PowerSubsystem
p clibbk
BrakePedal
bkp
ChassisSubsytemBrakeSubsystem InteriorSubsystem LightingSubsystemBodySubsystem
WheelHubAssembly
42
«rationale»2 wheel drive is the only way to getacceptable fuel economy, even though itlimits off-road capability

SysML Specification v1.0 Draft 185
B.4.5.3 Internal Block Diagram - Hybrid SUVFigure B-17 shows how the top level model elements in the above diagram are connected together in the HybridSUV block.
Figure B-17. Internal Structure of Hybrid SUV. (Internal Block Diagram)
B.4.5.4 Block Definition Diagram - Power SubsystemFigure B-18 defines the next level of decomposition, namely the components of the PowerSubsystem block. Note how the of white diamond (composition) on FrontWheel and BrakePedal denotes the same “use-not-composition” kind of relationship previously shown in Figure B-16.
ibd [block] HybridSUV
p:PowerSubsystem
c:chassisSubsytem br:BrakeSubsystem
i: InteriorSubsystem
l:LightingSubsystem
b:BodySubsystem
c-bk:
b-c:
b-i:
i-l:b-l:
bk-l:
p-c:
p-bk:

186 SysML Specification v1.0 Draft
Figure B-18. Defining Structure of Power Subsystem (Block Definition Diagram)
B.4.5.5 Internal Block Diagram for the “Power Subsystem” Figure B-19 shows how the parts of the PowerSubsystem block, as defined in the diagram above, are used. It shows «connectors» between parts, «clientServerPorts», «flowPorts», «atomicFlowPorts», and «itemFlows». The dashed borders on FrontWheel and BrakePedal denote the “use-not-composition” relationship depicted elsewhere in Figure B-16 and Figure B-
bdd [block] HSUV [PowerSubsystem Breakdown]
PowerSubsystem
ElectricMotorGenerator
FrontWheel
accelerator FuelTankAssembly Differential
Transmission
InternalCombustionEngine
FuelInjector
lfw1
0..1
dif
trsm
emiceftacl
fi4
BatteryPack ElectricalPowerController
bp
PowerControlUnit
FuelPump
epcpcu
BrakePedal
0..1
bkp1
fp
WheelHubAssembly
rfw1
0..1

SysML Specification v1.0 Draft 187
18.
Figure B-19.
bdd [block] PowerSubsystem [ICE Interface Definitions]
getRPM():integergetTemperature():RealisKnockSensor():Boolean
«interface»I_ICEData
setThrottle(throttlePosition:Real):voidsetMixture(mixture:Real):void
«interface»I_ICECmds
Internal Structure of the Power Subsystem. (Internal Block Diagram)
Figure B-20. Interfaces Typing StandardPorts Internal to the Power Subsystem (Block Definition Diagram)
Figure B-20 provides definition of the interfaces applied to Standard Ports associated with connector c1 in Figure B-19.
ibd [block] PowerSubsystem [Alternative 1 - Combined Motor Generator]
emg:ElectricMotorGenerator
trsm:Transmission
ice:InternalCombustionEngine
acl:accelerator
ecu:PowerControlUnit
ft:FuelTankAssy
dif:Differential
rfw:ChassisSubsytem.FrontWheel
lfw:ChassisSubsytem.FrontWheel
Port:FuelTankFitting
Port:ICEFuelFitting
fuelDelivery
torqueOut:Torque
torquein:Torque
spline
fuelSupply:Fuel
epc:ElectricalPowerControllerbp:BatteryPack
bp-epc:
i1:ElectricCurrent
i2:ElectricCurrent
fp:FuelPump
fi:FuelInjector
4fdist:bkp:BrakeSubsystem
.BrakePedal
<>
<>
<><>
4
fuelReturn:Fuel
<>
<>
<>
<>
g1:Torque t2:T
orqu
e
t1:Torque
ice
ctrlI_ICECmds
I_ICECmds
ctrl
ctrl
I_ICEData I_ICEData
trsmepc
c3:
c2:
c1:
I_IEPCCmdI_IEPCData
I_IEPCDataI_EPCCmd
I_TRSMData
I_TRSMCmd
I_TRSMCmd
I_TRSMData
<><>
<>
rightHalfShaft
<><>
<>
leftHalfShaft
acl-e
cu:
bkp-
ecu:

188 SysML Specification v1.0 Draft
B.4.6 Defining Ports and Flows
B.4.6.1 Block Definition Diagram - ICE InterfaceFor purposes of example, the StandardPorts and related point-to-point connectors in Figure B-19 are being refined into a common bus architecture. For this example, FlowPorts have been used to model the bus architecture. Figure B-21 is and incomplete first step in the refinement of this bus architecture, as it begins to identify the flow specification for the InternalCombustionEngine, the Transmission, and the ElectricalPowerController..
Figure B-21. Initially Defining Flow Specifications for the CAN Bus. (Block Definition Diagram)
B.4.6.2 Internal Block Diagram - CANbusFigure B-22 continues the refinement of this Controller Area Network (CAN) bus architecture using FlowPorts. The explicit structural allocation between the original connectors of Figure B-19 and this new bus architecture is shown in Figure B-36.
Figure B-22. Consolidating Interfaces into the CAN Bus. (Internal Block Diagram)
bdd CAN Bus FlowSpecifications
«flowProperties»out engineData:ICEDatain mixture:Realin throttlePosition:Real
«flowSpecification»FS_ICE
«flowProperties»
«flowSpecification»FS_TRSM
«flowProperties»
«flowSpecification»FS_EPC
rpm:Integertemperature:RealknockSensor:Boolean
«signal»ICEData
To be specified - whatis being exchangedover the bus from\tothe transmission?
To be specified - what is beingexchanged over the bus from\tothe electronic power controller?
ibd [block] PowerSubsystem [CAN Bus description]
trsm:Transmission ice:InternalCombustionEngine
ecu:PowerControlUnit
epc:ElectricalPowerController
:CAN_Bus
fp:FS_EPC fp:FS_TRSM fp:FS_ICE
epc:IFS_EPC etrsm:IFS_TRSM ice:IFS_ICE
<> <> <>
<> <> <>

SysML Specification v1.0 Draft 189
B.4.6.3 Block Definition Diagram - Fuel Flow PropertiesThe FlowPorts on the FuelTankAssembly and InternalCombustionEngine (as shown on Figure B-19) are defined in Figure B-23 below.
Figure B-23. Elaborating Definition of Fuel Flow. (Block Definition Diagram)
B.4.6.4 Parametric Diagram - Fuel Flow Figure B-24 is a parametric diagram showing how fuel flowrate is related to FuelDemand and FuelPressure value properties.
Figure B-24. Defining Fuel Flow Constraints. (Parametric Diagram)
bdd [block] HSUV [PowerSubsystem Fuel Flow Definition]
temperature:Temppressure:Press
Fuel
«flowProperties» out fuelSupply:Fuel in fuelReturn:Fuel
«flowSpecification»FuelFlow
PowerSubsystem
«flowProperties» in fuelSupply:Fuel out fuelReturn:Fuel
FuelTankAssembly
«flowProperties» out fuelSupply:Fuel in fuelReturn:Fuel
InternalCombustionEngine
iceft
FuelTankFitting:FuelFlow
ICEFuelFitting:FuelFlow<>
<>
par [Block]PowerSubsystem
constraints{flowrate=press/(4*injectorDemand)}
fuelflow:FuelFlow
press:Real
injectorDemand:Real
ice.fr.fuel.FuelPressure::Real
ice.fi.FuelDemand:Real
flowrate:Real
ice.ft.FuelFlowRate:Real

190 SysML Specification v1.0 Draft
B.4.6.5 Internal Block Diagram - Fuel DistributionFigure B-25 shows how the connectors fuelDelivery and fdist on Figure B-19 have been expanded to include design detail. The fuelDelivery connector is actually two connectors, one carrying fuelSupply and the other carrying fuelReturn. The fdist connector inside the InternalCombustionEngine block has been expanded into the fuel regulator and fuel rail parts. These more detailed design elements are related to the original connectors using the allocation relationship.
Figure B-25. Detailed Internal Structure of Fuel Delivery Subsystem. (Internal Block Diagram)
ibd [block] PowerSubsystem [Fuel Distribution Detail]
ice:InternalCombustionEngine
ft:FuelTankAssy
fuelSupplyLine:
fuelSupply:Fuelfp:FuelPump
fi1:FuelInjector
4
fuelReturn:Fuel
fre:FuelRegulatorfra:FuelRail
p1:Fuel
p2:Fuel
fuelReturnLine:
fi2:FuelInjector
fi3:FuelInjector
fi4:FuelInjector
allocatedFrom«connector»fdist:
fuelFitting:Fuel
allocatedFrom«connector»fuelDelivery:
<>

SysML Specification v1.0 Draft 191
B.4.7 Analyze Performance (Constraint Diagrams, Timing Diagrams, Views)
B.4.7.1 Block Definition Diagram - Analysis ContextFigure B-26 defines the various model elements that will be used to conduct analysis in this example. It depicts each of the constraint blocks/equations that will be used for the analysis, and key relationships between them.
Figure B-26. Defining Analyses for Hybrid SUV Engineering Development. (Block Definition Diagram)
B.4.7.2 Package Diagram - Performance View DefinitionFigure B-27 shows the user-defined Performance Viewpoint, and the elements that populate the HSUV specific PerformanceView. The PerformanceView itself may contain of a number of diagrams depicting the elements it contains.
bdd [package] HSUVAnalysis [Analysis Context]
«constraint»RollingFriction
Equation
«constraint»AeroDragEquation
adrag
rdrag dyn
«constraint»StraightLine
VehicleDynamics
«testCase,Interaction»MaxAcceleration
1
0..1
ex
«requirement»Acceleration
«verify»
GlobalTimedelta-t0..1
1
t
0..1
1
UnitCostContext
«domain»HSUVStructure::
AutomotiveDomain
ad
0..1
1ad
0..1
1ad0..1
1
parametersV1:VolV2:VolV3:Vol
constraints{pcap = Sum(Vi)}
«constraint»CapacityEquation
EconomyContextCapacityContext
cap
«constraint»PayloadEquation
«constraint»TotalWeight
«constraint»FuelEfficency
Equation
pl
fe
w
«constraint»RegenBrake
EfficiencyEquation
rb

192 SysML Specification v1.0 Draft
Figure B-27. Establishing a Performance View of the User Model. (Package Diagram)
B.4.7.3 Parametric Diagram - Measures of EffectivenessMeasure of Effectiveness is a user defined stereotype. Figure B-28 shows how the overall cost effectiveness of the HSUV will be evaluated. It shows the particular measures of effectiveness for one particular alternative for the HSUV design, and can be reused to evaluate other alternatives.
pkg [package] HSUVViews [Performance View]
«view»{viewpoint=Performance Viewpoint}
PerformanceView
Driver
Drive Car «viewpoint»stakeholders="customer"concerns="Will the system performadequately?"purpose="Highlight the performance of thesystem."methods="show performance requirements,test cases, MOE, constraint models, etc.;includes functional viewpoint"languages="SysML"
Performance Viewpoint
«viewpoint»Functional Viewpoint
id = 2Text = The Hybrid SUVshall have the braking,acceleration, and off-roadcapability of a typical SUV,but have dramatically betterfuel economy.
<<requirement>>Performance
«moe»HSUValt1.CostEffectiveness
«moe»HSUValt1.Fuel
Economy
«moe»HSUValt1.Zero
60Time
«moe»HSUValt1.CargoCapacity
«moe»HSUValt1.Quar
terMileTime
«constraint»EconomyEquation
«constraint»UnitCostEquation
«constraint»CapacityEquation
«testCase»EPAFuel
EconomyTest
«conform»

SysML Specification v1.0 Draft 193
Figure B-28. Defining Measures of Effectiveness and Key Relationships. (Parametric Diagram)
B.4.7.4 Parametric Diagram - EconomySince overall fuel economy is a key requirement on the HSUV design, this example applies significant detail in assessing it. Figure B-29 shows the constraint blocks and properties necessary to evaluate fuel economy.
par [block] MeasuresOfEffectiveness [HSUV MOEs]
«objectiveFunction»:MyObjectiveFunction
{CE = Sum(Wi*Pi)}
«moe»HSUValt1.CostEffectiveness
«moe»HSUValt1.FuelEconomy
«moe»HSUValt1.Zero60Time
«moe»HSUValt1.CargoCapacity
«moe»HSUValt1.QuarterMileTime
«moe»HSUValt1.UnitCost
:EconomyEquationf:
:MaxAccelerationAnalysis
q:
z:
:CapacityEquationvc:
:UnitCostEquationuc:
p4:
p1:
p2:
p3:
p5:
CE:

194 SysML Specification v1.0 Draft
Figure B-29. Establishing Mathematical Relationships for Fuel Economy Calculations. (Parametric Diagram)
B.4.7.5 Parametric Diagram - DynamicsThe StraigntLineVehicleDynamics constraint block from Figure B-29 has been expanded in Figure B-30 below. ConstraintNotes are used, which identify each constraint using curly brackets {}. In addition, Rationale has been used to explain the meaning of each constraint maintained
par [block] EconomyContext
dyn:StraightLineVehicleDynamics
rdrag:RollingFrictionEquation
adrag:AeroDragEquation
w:TotalWeight
pl:PayloadEquation
cgoWt:psgrWt:
psgrWt:
volume:
volume:
vdw: fw:
ad.HSUV.PowerSubsystem.FuelTank.FuelWeight
Cd:
Cd:
tw:
tw:
tw:
Cf:
Cf:
fe:FuelEfficiencyEquationwhlpwr:
acc:acc:vel: mpg:
incline:
rb:RegenBrakeEfficiencyEquation
vel:
incline:
ebpwr:
ebpwr:
n_em:
acc:
n_ice:
n_eg:
ad.HSUV.PayloadCapacity
pcap:
cgoWt:
whlpwr:
ad.HSUV.VehicleDryWeight
ad.HSUV.PowerSybsystem.ElectricMotorGenerator.
GeneratorEfficiency
ad.HSUV.PowerSybsystem.ElectricMotorGenerator.
MotorEfficiency
ad.HSUV.PowerSybsystem.InternalCombustionEngine.
ICEEfficiency
ad.drivingConditions.road.incline
ad.HSUV.position
x:
ad.HSUV.mpg
dt:
delta-t

SysML Specification v1.0 Draft 195
.
Figure B-30. Straight Line Vehicle Dynamics Mathematical Model. (Parametric Diagram)
The constraints and parameters in Figure B-30 are detailed in Figure B-31 in Block Definition Diagram format.
par [constraintBlock] StraightLineVehicleDynamics
acc:AccellerationEquation
vel:VelocityEquation
pos:PostionEquation
pwr:PowerEquation
whlpwr: tw:Cd: Cf:
tp:
tp:
delta-t:
delta-t:
delta-t:
tw:
tw:
a:
a:
v:
v:
acc:
vel:
Cf:
Cd:
whlpwr:
v:
x:
incline:
i:
{v(n+1) = v(n) + a(g)*32*3600/5280*delta-t}
{x(n+1) = x(n) + v(mph)*5280/3600*delta-t}
{tp = whlpwr - (Cd*v) - (Cf*tw*v)}
«rationale»tp (hp) = wheel power - drag - friction
«rationale»v(n+1) (mph) = v(n) + delta-v = v(n) + a*delta-t
«rationale»x(n+1) (ft) = x(n) + delta-x = x(n) + v*delta-t
«rationale»a(g) = F/m = P*t/m
{a = (550/32)*tp(hp)*delta-t*tw}
x:
dt

196 SysML Specification v1.0 Draft
Figure B-31. Defining Straight-Line Vehicle Dynamics Mathematical Constraints. (Block Definition Diagram)
Note the use of valueTypes originally defined in Figure B-2.
B.4.7.6 (Non-Normative) Timing Diagram - 100hp AccelerationTiming diagrams, while included in UML 2.0, are not directly supported by SysML. For illustration purposes, however, the interaction shown in Figure B-32 was generated based on the constraints and parameters of the StraightLineVehicleDynamics constraintBlock, as described in the Figure B-30. It assumes a constant 100hp at the drive wheels, 4000lb gross vehicle weight, and constant values for Cd and Cf
bdd [package] HSUVAnalysis [Definition of Dynamics]
parameterswhlpowr:HorsepwrCd:RealCf:Realtw:Weighttp:Horsepwrv:Veli:Real
constraints{tp = whlpowr - (Cd*v) -(Cf*tw*v)}
«constraint»PowerEquation
parameterstw:Weightdelta-t:Timetp:Horsepwra:Accel
constraints{a = (550/32)*tp(hp)*dt*tw}
«constraint»AccelerationEquation
parametersdelta-t:Timev:Vela:Accel
constraints{v(n+1 = v(n)+a*32*3600/5280*dt}
«constraint»VelocityEquation
parametersdelta-t:Timev:Velx:Dist
constraints{x(n+1) = x(n)+v*5280/3600*dt}
«constraint»PositionEquation
parameterswhlpowr:HorsepwrCd:RealCf:Realtw:Weightacc:Accelvel:Velincline:Real
«constraint»StraightLine
VehicleDynamics
accvelpwr
pos

SysML Specification v1.0 Draft 197
Figure B-32. Results of Maximum Acceleration Analysis. (Timing Diagram)
B.4.8 Defining, Decomposing, and Allocating Activities
B.4.8.1 Activity Diagram - Acceleration (top level)Figure B-33 shows the top level behavior of an activity representing acceleration of the HSUV. It is the intent of the systems engineer in this example to allocate this behavior to parts of the PowerSubsystem. It is quickly found, however, that the behavior as depicted cannot be allocated, and must be further decomposed.
tim MaxAcceleration [100 Wheel Horsepower]
0
0.05
0.1
0.15
0.2
0.25
0.3
0.35
0.4
0.45
0.5
0 5 10 15 20
Time (sec)
Acc
elle
ratio
n (g
)
0
20
40
60
80
100
120
140
0 5 10 15 20
Time (sec)
Velo
city
(mph
)
0
200
400
600
800
1000
1200
1400
1600
1800
0 5 10 15 20
Time (sec)
Dis
tanc
e (f
t)Satisfies«requirement»Acceleration
«diagramDescription»version=”0.1"description=”Constant100 wheel horsepower,4000 lb vehicle weight,simple drag"reference=”Equations ofMotion”completeness=”assumesperfect tire traction”

198 SysML Specification v1.0 Draft
.
Figure B-33. Behavior Model for “Accelerate” Function. (Activity Diagram)
B.4.8.2 Block Definition Diagram - AccelerationFigure B-34 defines a decomposition of the activities and objectFlows from the activity diagram in Figure B-33.
Figure B-34. Decomposition of “Accelerate” Function. (Block Definition diagram)
B.4.8.3 Activity Diagram (EFFBD) - Acceleration (detail)Figure B-35 shows the ProvidePower activity, using the decomposed activities and objectFlows from Figure B-34 above. It also uses AllocateActivityPartitions and an allocation callout to explicitly allocate activities and an object flow to parts in the PowerSubsystem block.
Note that the incoming and outgoing object flows for the ProvidePower activity have been decomposed. This was done to
act Accelerate
PushAccelerator
MeasureVehicleConditions
ProvidePower
«continuous»accelPosition
«continuous»vehCond
Comment:Can't allocatethese activities toPwrSubSystem
«continuous»drivePower
transModeCmd
bdd [activity] Accelerate [Activity and Object Flow Breakdown]
«activity»MeasureVehicle
Conditions«activity»
ProvidePower
«activity»MeasureVehicle
Velocity
«activity»MeasureBattery
Condition«activity»
ProvideGasPower«activity»
ControlElectricPower
«activity»ProportionPower
«activity»ProvideElectric
Powermbatmvel
a4
a3a2
a1
drivePower
«block»Power
«block»GasPower
«block»ElecPower
gasDrivePower elecDrivePower

SysML Specification v1.0 Draft 199
distinguish the flow of electrically generated mechanical power and gas generated mechanical power, and to provide further insight into the specific vehicle conditions being monitored.
.
Figure B-35. Detailed Behavior Model for “Provide Power”. (Activity Diagram) Note hierarchical consistency with Figure B-33 .
B.4.8.4 Internal Block Diagram - Power Subsystem Behavioral and Flow AllocationFigure B-36 depicts a subset of the PowerSubsystem, specifically showing the allocation relationships generated in Figure B-35 above

200 SysML Specification v1.0 Draft
.
Figure B-36. Flow Allocation to Power Subsystem. (Internal Block Diagram)
B.4.8.5 Table - Acceleration AllocationFigure B-37 shows the same allocation relationships shown in Figure B-36 above, but in a more compact tabular representation
.
Figure B-37. Tabular Representation of Allocation from “Accelerate” Behavior Model to Power Subsystem. (Table)
ibd [block] PowerSubsystem [Power Functional Allocation]
allocatedFrom«activity»ConvertElectricToPower
emg:ElectricalMotorGenerator
trsm:Transmission
allocatedFrom«activity»ConvertGasToPower
ice:InternalCombustionEngine
allocatedFrom«activity»ProportionPowerLoad
ecu:PowerControlUnitepc:IFS_EPC
fp:FS_ICE
allocatedFrom«activity»ControlElectricPower
epc:ElectricalPowerController
i1:ElectricCurrent
i2:ElectricCurrent
fp:FS_EPC
fp:FS_TRSM
allocatedFrom«objectNode»driveCurrent
allocatedFrom«connector»c1:
«connector»c2: «connector»c3:
can:CAN_Bus
ice:IFS_ICE
etrsm:IFS_TRSM
<>
<>
<>
<>
<>
<>
<>
<>
«diagramDescription»version=”0.1"description=”allocation ofbehavior and connectors toelements of power subsystem"reference=”null”completeness=”partial. Powersubsystem elements that haveno allocation yet have beenelided”
Table [activity] ProvidePower [Allocation Tree for Provide Power Activities]
type name end relation end type nameactivity a1:ProportionPower from allocate to block PowerControlUnitactivity a2:ProvideGasPower from allocate to block InternalCombustionEngineactivity a3:ControlElectricPower from allocate to block ElectricalPowerControlleractivity a4:ProvideElectricPower from allocate to block ElectricalMotorGeneratorobjectNode driveCurrent from allocate to itemFlow i1:ElectricCurrent

SysML Specification v1.0 Draft 201
B.4.8.6 Internal Block Diagram: Property Specific Values - EPA Fuel Economy TestFigure B-38 shows a particular Hybrid SUV (VIN number) satisfying the EPA fuel economy test. Serial numbers of specific relevant parts are indicated.
Figure B-38. Special Case of Internal Block Diagram Showing Reference to Specific Properties (serial numbers)
ib d [b lo c k ] S U V _ E P A _ F u e l_ E c o n o m y _ T e s t [T e s t R e s u lts ]
v a lu e sV IN = G 1 2 3 4 5
T e s tV e h ic le 1 : [H y b r id S U V ]
v a lu e ss n : ID = p 6 7 8 9 0
p : [P o w e r S u b s y s te m ]
c -b k :
b -c :
b - i:
b k - l :
c -p : b k -p :
S a t is f ie s« re q u irm e n t» E m is s io n s
v a lu e ss n :ID = b k 4 5 6 7 8
b k : [B r a k e S u b s y s te m ]
v a lu e ss n : ID = c 3 4 5 6 7
c : [C h a s s is S u b s y s te m ]
v a lu e ss n : ID = lt5 6 7 8 9
l : [L ig h t in g S u b s y s te m ]
v a lu e ss n :ID = b 1 2 3 4 5
b : [B o d y S u b s y s te m ]
v a lu e ss n : ID = i2 3 4 5 6
i : [ In te r io r ]
« te s tC a s e »te s tR u n 0 6 0 4 0 1 :
E P A F u e lE c o n o m y T e s t
v a lu e ss n : ID = s n 9 0 1 2 3
e m : [E le c t r ic a lM o to r ] v a lu e ss n :ID = s n 8 9 0 1 2
t : [T r a n s m is s io n ]
v a lu e ss n : ID = e id 7 8 9 0 1
ic e : [ In te r n a lC o m b u s t io n E n g in e ]
e m - t : ic e - t :
V e r if ie s« re q u ire m e n t» E m is s io n s