Appendix B Evaluation of the Molecular Connectivity Index | US … · 2015-11-02 · 3 The 1P...
24
Transcript of Appendix B Evaluation of the Molecular Connectivity Index | US … · 2015-11-02 · 3 The 1P...


Appendix B
Evaluation of the Molecular Connectivity Index

[This page intentionally left blank.]

Alternate Approach for CharacterizingBiotransfer Factors
Final
April 30, 2003
Prepared for:
U.S. Environmental Protection AgencyOffice of Solid Waste
1200 Pennsylvania Avenue, NWWashington, DC 20460
Prepared by:
Research Triangle Institute3040 Cornwallis Road
P.O. Box 12194Research Triangle Park, NC 27709-2194
EPA Contract Number 68-W-98-085RTI Project Number 07780.003.024

[This page intentionally left blank.]

PROJECT SUMMARY
Under a previous work assignment with NCEA CTAC and OSW, RTI evaluated theTravis and Arms (1988) methodology used to predict biotransfer factors (BTF) of chemicals intobeef and milk. The methodology based on the relationship between log Kow and the chemicalconcentrations in beef tissue and milk. RTI investigated the basis for this relationship to evaluatethe level of uncertainty associated with BTFs predicted using the Travis and Arms (1988)methodology. Despite the fact that this methodology has been the standard in risk assessmentfor more than a decade, our findings suggested that the BTFs were associated with considerableuncertainty (Birak et al., 2002). For example, our results for some chemicals indicated that theBTFs could vary over several orders of magnitude.
Based on these findings, NCEA CTAC and OSW tasked RTI with investigatingalternative approaches to calculating BTFs. Specifically, we have been investigating the use ofmolecular connectivity indices (MCIs) as an alternative predictor of BTFs. Of particular interestwas the BTF methodology for beef and milk presented by Dowdy et al. (1996) and based onmethods originally developed by Meylan et al. (1992) to predict organic carbon partitioncoefficients (Koc). Meylan et al. (1992) developed an approach for estimating Koc using a two-step process in which (1) nonpolar chemicals were plotted against Koc to examine therelationship between parameters (in this case, linear), and (2) correction factors were applied forpolar chemicals based on the functional groups and deviations from their nonpolar regressionline. Dowdy et al. used the polar correction factors from Meylan et al. to develop polar-adjustedmolecular connectivity indices (1Ppc), and found a strong linear relationship between the BTFsand MCIs.
To investigate this relationship further, RTI plotted the molecular connectivity indices forchemicals against BTFs, first for chemicals without polar correction factors and then forchemicals with polar correction factors as determined by Meylan et al. and Dowdy et al. Contrary to what other authors have found between Koc and 1P, we found no relationshipbetween the BTFs and 1P for chemicals without polar correction factors. Using the methodpresented by Dowdy et al. to derive polar correction factors, we regressed the MCIs versus theBTFs and found that in this case a relationship does exist. Specifically, the R-square values formilk and beef are 0.55 and 0.54, respectively, as compared to the R-square values of 0.50 and0.46 based on log Kow.
In conclusion, we do not believe that the approach using molecular connectivity indicesresults in a substantial improvement in our ability to predict biotransfer factors. RTIrecommends further investigation of the biotransfer database to improve understanding of thesources of uncertainty that confound this relationship. In addition, recent advances in molecularmodeling have led to potentially hundreds of molecular descriptors that could be considered forpredictive ability in terms of BTFs. The finding that molecular topology combined with polaritycorrection factors correlate with BTFs suggests that other shape and polarity/electrostaticdescriptors should be examined. If appropriate, such factors could be applied without the use ofadditional correction factors. Examples are molecular electrostatic potential (MEP), dipolemoment, the various STERIMOL shape descriptors, and the electrotopological state descriptors.Other methods presented in the literature that could be further investigated includepharmacokinetic modeling and fugacity modeling.

[This page intentionally left blank.]
1
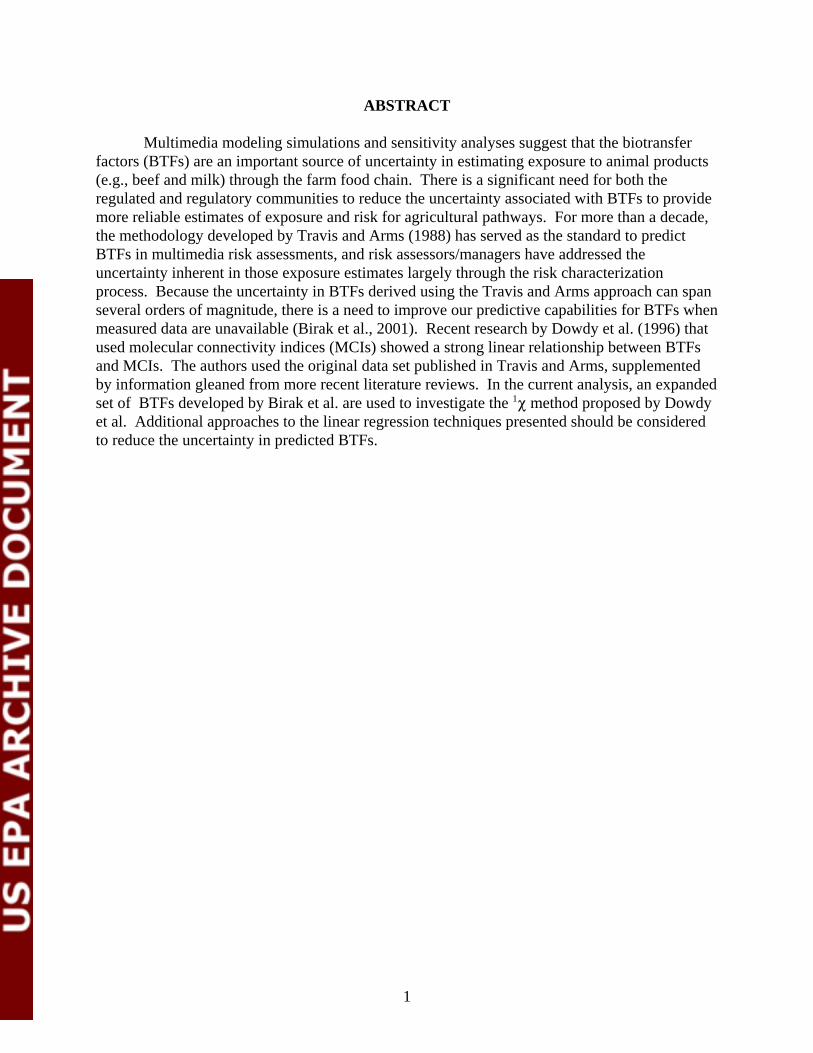
ABSTRACT
Multimedia modeling simulations and sensitivity analyses suggest that the biotransferfactors (BTFs) are an important source of uncertainty in estimating exposure to animal products(e.g., beef and milk) through the farm food chain. There is a significant need for both theregulated and regulatory communities to reduce the uncertainty associated with BTFs to providemore reliable estimates of exposure and risk for agricultural pathways. For more than a decade,the methodology developed by Travis and Arms (1988) has served as the standard to predictBTFs in multimedia risk assessments, and risk assessors/managers have addressed theuncertainty inherent in those exposure estimates largely through the risk characterizationprocess. Because the uncertainty in BTFs derived using the Travis and Arms approach can spanseveral orders of magnitude, there is a need to improve our predictive capabilities for BTFs whenmeasured data are unavailable (Birak et al., 2001). Recent research by Dowdy et al. (1996) thatused molecular connectivity indices (MCIs) showed a strong linear relationship between BTFsand MCIs. The authors used the original data set published in Travis and Arms, supplementedby information gleaned from more recent literature reviews. In the current analysis, an expandedset of BTFs developed by Birak et al. are used to investigate the 1P method proposed by Dowdyet al. Additional approaches to the linear regression techniques presented should be consideredto reduce the uncertainty in predicted BTFs.

2
INTRODUCTION
One of the most important exposure pathways for lipohilic compounds involves theingestion of agricultural products such as beef and milk (McLachlan, 1993; Travis and Hester,1991). The transfer of chemical contaminants from feed crops to beef tissue and milk is oftenrepresented by chemical-specific biotransfer factors (BTFs). Although chemical concentrationsin beef and milk can be measured, the collection and analysis of chemical samples in agriculturalproducts is often prohibitively expensive. Consequently, the BTFs are frequently derived usingthe approach developed by Travis and Arms (1988) based on the linear relationship between thelog of the octanol-water partition coefficient (log Kow) and the concentration in beef and milk. Unfortunately, recent research on the methods used to predict BTFs indicates that this parameteris associated with uncertainty spanning several orders of magnitude (Birak et al., 2001). Giventhe importance of this parameter in predicting the exposure to chemical contaminants in beef andmilk, it is clear that further research to improve the methods used to predict BTFs is warranted(Fries et al., 1999).
As suggested above, the approach most commonly used to predict the contaminantconcentrations in beef tissue and milk in an agricultural scenario involves the use of BTFs. TheBTF is the ratio of the concentration in either beef or milk to the chemical intake in mass ofchemical ingested by cattle per day (Equation 1).
BTFBeef or Milk Concentration mg kg
Chemical Intake mg d=
( / )( / ) Eq. 1
In 1988, Travis and Arms published a methodology to predict BTFs using a chemical’soctanol-water partition coefficient (Kow). Since publication, the regression equations developedby Travis and Arms have been widely used for predicting BTFs for beef and milk (U.S. EPA,1998; U.S. ACE, 1996). However, subsequent research has called into question the validity ofusing Kow to predict concentrations in beef and milk, particularly for chemicals with high log Kowchemicals (McLachlan, 1993; Thomas et al., 1998; Fries et al., 1999) and chemicals with largeuncertainty in Kow values (Mackay et al., 1992). Figure 1 demonstrates the significant variabilityin BTF data for similar Kow values.
Molecular topology and quantitative structure-activity relationship (QSAR) analyses usea chemical’s structure as the basis for estimating properties, making them particularly useful forpredictive modeling and risk assessments. Molecular connectivity employs a mathematicalapproach to characterize chemicals rather than using traditional physico-chemicalcharacterizations in QSAR (e.g., log Kow) (Randic, 2001). The normal path, first-ordermolecular connectivity index (1P) has been used to estimate chemical properties, such as soilsorption coefficients (Koc) and bioconcentration factors (BCFs) in fish (Meylan et al., 1992;Sabjlic, 1982). Dowdy et al. (1996) present an analysis that suggests that molecular connectivityindices may be an accurate predictor of beef and milk BTFs. In our analysis, we used theapproach described by Dowdy et al. to examine the applicability of their regression to a separateBTF data set (Birak et al., 2001) and to evaluate the potential of molecular connectivity indicesas an alternative approach for BTF estimation.
3
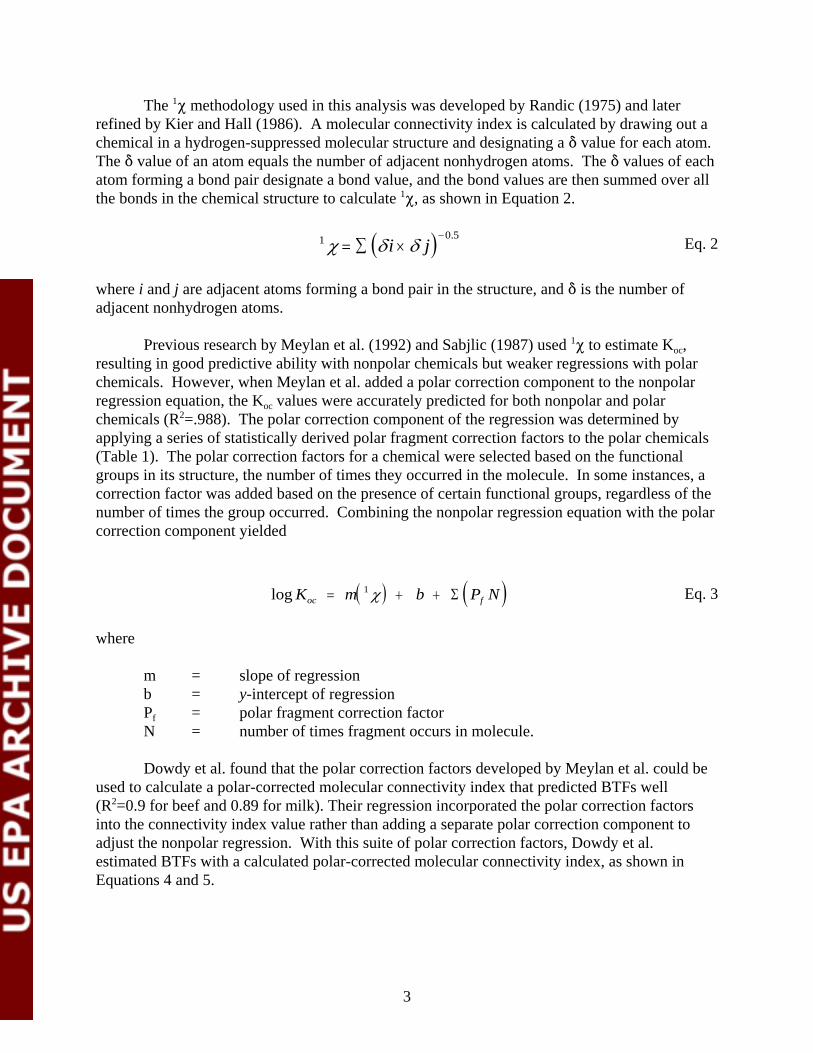
The 1P methodology used in this analysis was developed by Randic (1975) and laterrefined by Kier and Hall (1986). A molecular connectivity index is calculated by drawing out achemical in a hydrogen-suppressed molecular structure and designating a * value for each atom. The * value of an atom equals the number of adjacent nonhydrogen atoms. The * values of eachatom forming a bond pair designate a bond value, and the bond values are then summed over allthe bonds in the chemical structure to calculate 1P, as shown in Equation 2.
( )1 0 5χ δ δ= ∑ ×
−i j
. Eq. 2
where i and j are adjacent atoms forming a bond pair in the structure, and * is the number ofadjacent nonhydrogen atoms.
Previous research by Meylan et al. (1992) and Sabjlic (1987) used 1P to estimate Koc,resulting in good predictive ability with nonpolar chemicals but weaker regressions with polarchemicals. However, when Meylan et al. added a polar correction component to the nonpolarregression equation, the Koc values were accurately predicted for both nonpolar and polarchemicals (R2=.988). The polar correction component of the regression was determined byapplying a series of statistically derived polar fragment correction factors to the polar chemicals(Table 1). The polar correction factors for a chemical were selected based on the functionalgroups in its structure, the number of times they occurred in the molecule. In some instances, acorrection factor was added based on the presence of certain functional groups, regardless of thenumber of times the group occurred. Combining the nonpolar regression equation with the polarcorrection component yielded
( ) ( )log K m b P Noc f= + +1χ Σ Eq. 3
where
m = slope of regressionb = y-intercept of regressionPf = polar fragment correction factorN = number of times fragment occurs in molecule.
Dowdy et al. found that the polar correction factors developed by Meylan et al. could beused to calculate a polar-corrected molecular connectivity index that predicted BTFs well(R2=0.9 for beef and 0.89 for milk). Their regression incorporated the polar correction factorsinto the connectivity index value rather than adding a separate polar correction component toadjust the nonpolar regression. With this suite of polar correction factors, Dowdy et al.estimated BTFs with a calculated polar-corrected molecular connectivity index, as shown inEquations 4 and 5.

4
( )log BTF m bpc= +1χ Eq. 4
where
1Ppc = the polar corrected first-order molecular connectivity indexm = slope of regressionb = y-intercept of regression
and
( ) ( )1 1χ χpc fa P N= + ′′′ ∑ Eq. 5
where
1P = the normal path first-order molecule connectivity indexa“ = constant estimated in regressionE PfN = summation of polar correction factors multiplied by the number of times
they occur in the chemical
Dowdy et al. optimized this regression equation to maximize the correlation coefficientand minimize the standard error of the estimator, determining that the best value for both thebeef and milk regressions for a“ is 1.89.
METHODS
The biotransfer data set used in this analysis calculates beef and milk BTFs on a perchemical basis for 54 chemicals. The BTFs in our database were developed using referencescited by Travis and Arms (1988) in their development of the Kow-based regression and additionalreferences identified through a literature search. All papers, including those cited by Travis andArms, had to meet our data quality criteria, which are detailed in Birak et al. (2001). The LogKow data selection is also provided in Birak et al. (2001).
Normal path, first-order molecular connectivity indices and polar correction factors wereobtained using the Estimation Program Interface (EPI) SuiteTM. The EPI Suite is a Windows®-based suite of physical-chemical property and environmental fate estimation models developedby the EPA’s Office of Pollution Prevention Toxics and Syracuse Research Corporation (SRC). PCKOCWINTM is a component of the EPI Suite that estimates chemical soil adsorptioncoefficients (Koc) from 1P using the methodology developed by Meylan et al. (1992) andreferenced by Dowdy et al. (1996). The polar correction factors applied in this analysis areidentical to those cited in the Meylan et al. paper with one additional fragment documented inPCKOCWIN (Factor 29, Table 1) and one additional fragment derived by Dowdy et al.(Factor 28). Correction factors were applied to chemicals as recommended in PCKOCWIN witha few exceptions. In cases where a single ester was present in the chemical, the carbonyl(Factor 26) and aliphatic ether (Factor 19) polar correction factors were applied instead of the

5
ester correction factor (Factor 20). Also, where an aromatic organophosphorous fragment waspresent, the Dowdy-derived Factor 28 was used instead of PCKOCWIN’s Factor 16. Both ofthese exceptions were applied to be consistent with the discrepancies documented by Dowdyet al. in application of the polar correction factors. To predict the polar-corrected normal pathfirst-order molecular connectivity index (1Ppc), the equation developed by Dowdy et al. was used(Equation 5).
The molecular connectivity indices from PCKOCWIN were compared with 1P estimatesfrom two other software programs, TOPIX and Molecular Modeling Pro. Chemical structureswere also reviewed to identify discrepancies in the application of polar correction factorsbetween PCKOCWIN and Dowdy et al. A limited literature search was performed to verify thatthe molecular connectivity indices documented have not been updated since the Dowdy et al.(1996) paper.
The log Kow regressions shown here are also presented and discussed fully in Birak et al.(2001). For MCIs regressions were performed first using only the chemicals without polarcorrection factors versus the log BTFs for beef and milk separately. When a similar regressionwas performed with log Koc and 1P, a strong correlation was observed (Sabjlic, 1987). Separatebeef and milk log BTF regressions with the entire data set (i.e., including polar-corrected MCIs)were later performed, using our calculated polar-corrected molecular connectivity indices. TheR2 and F statistics were calculated using the software package Analyse-It.
RESULTS
Table 2 presents 1P used in this analysis, 1P reported in Dowdy et al., and BTF and logKow data for all chemicals that did not require polar correction factors. Table 3 presentsanalogous data for polar chemicals requiring correction factors. Also noted in Table 3 are thecalculated 1Ppc and polar correction factors applied in this analysis and the 1Ppc and factorsreported by Dowdy et al. (1996). The BTF and log Kow data in these tables were developed byBirak et al. (2001).
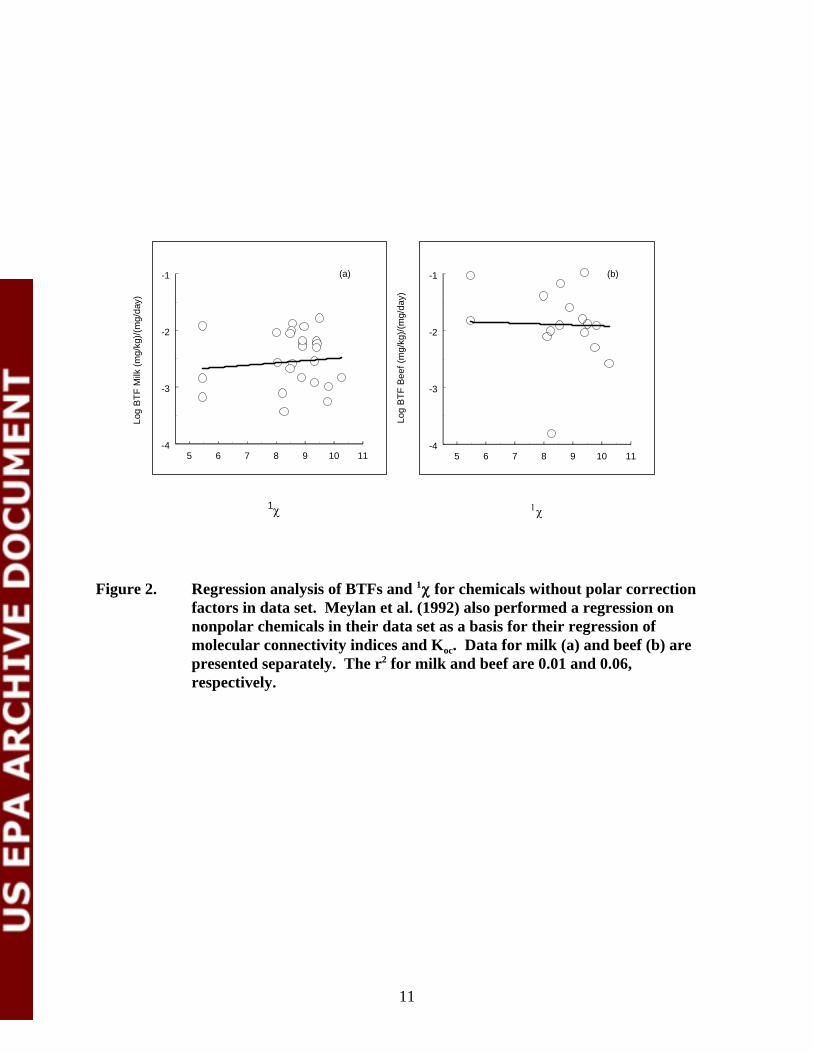
The results from the linear regression analysis on chemicals not needing correctionfactors and 1P are shown in Figure 2. In Figure 2a and 2b, log BTFs are plotted against 1P, asappropriate for milk and beef, respectively. The resulting regression equation for milk BTFs is
( )Log BTF milk = −0 0392 2 88571. .χ Eq. 6
where N=27, R2=0.01, and F=0.19.
The regression for beef BTF data is
( )Log BTF beef = − −01163 089721. .χ Eq. 7
where N=16, R2=0.06, and F=0.84.

6
Figure 3 shows plots of the entire BTF data set and molecular connectivity indicescalculated in this analysis (i.e., 1P and 1Ppc). Chemicals that required polar-correction are noteddifferently in the plots from those that did not. Plots of the milk and beef data yielded somewhatsimilar regressions (see Equations 8 and 9).
( )Log BTF milk pc= −0 3057 527041. .χ Eq. 8
where N=53, R2=0.55, and F=61.42.
( )Log BTF beef pc= −0 3683 529681. .χ Eq. 9
where N=33, R2=0.54, and F=35.74.
DISCUSSION
The 1P used in the analysis match those reported by Dowdy et al. for all chemicals alsoincluded in their analysis except toxaphene and arochlor 1254 (Table 2). Dowdy et al.specifically note that the structures they used for their analysis for these two chemicals werebased on the most predominant structure in the chemical mixture, but the specific structure usedwas not noted. For this analysis, the structures used by EPIWIN for these chemicals were alsoused here.
In many cases, the 1Ppc reported in Dowdy et al. (1996) do match values calculated in thisanalysis (Table 3). However, there are some notable exceptions. Specifically, the chemicalstructures for dieldrin, eldrin, and heptachlor epoxide all have an aliphatic ether group in a three-membered ring; an example is shown in Figure 4. These chemicals are assigned Factor 19(Table 1) in PCKOCWIN, but not in Dowdy et al., possibly because Dowdy did not considerethers in aliphatic rings for Factor 19. Flamprop-isopropyl and benzoylprop-ethyl both possess anitrogen attached to an aliphatic carbon in their structures (Figure 4). Dowdy et al. assigned nopolar correction factors for these functional groups, whereas PCKOCWIN assigned Factor 6 forboth chemicals. In another example, PCKOCWIN assigned Factors 1, 2, and 7 (aromatic amine,aromatic ether, and carbamate groups) to oxadiazon. Dowdy et al. selected to apply correctionfactors for the aromatic ether (Factor 2), aliphatic ether (Factor 19), and carbonyl groups(Factor 26) to this chemical. The carbamate factor (Factor 7) was not presented by Dowdy et al.(1996); it may have been purposely excluded from the analysis. Regardless, each of theseexamples demonstrate discrepancies in interpretation and application of the polar correctionfactors, illustrating the difficulty in applying the 1Ppc methods consistently for BTF estimation.
The regression analyses shown in Figures 2a and 2b did not reveal any correlationbetween 1P and BTFs. The analysis that Meylan et al. conducted was initially based on acorrelation between Koc and 1P. Thus, it was anticipated that this regression would also showpositive correlation between the 1P and BTFs. By including chemicals with 1Ppc in theregression, the regressions do improve and indicate a relationship between MCIs and BTFs, as

7
shown in Figures 3a and 3b, but this method does not appear to be a significant improvementover current methods (e.g., log Kow). Specifically the R-square values for milk and beef are 0.55and 0.54, respectively, compared with 0.50 and 0.46 based on log Kow.
Some modifications could be made to this method that would likely improve theR-square value for the regressions. If the chemicals with aliphatic esters in them were no longerassigned a polar correction factor, as was done in Dowdy these chemicals would have BTFscloser to the current regression line. However, it is notable that pentachlorophenol does notcurrently have a polar correction factor applied, although it does contain a polar functional group(-OH). If that group were considered, pentachlorophenol would actually deviate further from theregression line because BTFs for this chemical are already underpredicted based on the MCImethodology. Interestingly, both pentachlorophenol and hexaclorobenzene are currentlyunderpredicted by the current method and are aromatic ring structures that are highlychlorinated.
Theoretically, a correction factor for these chemicals could be derived that could eitherdecrease or increase the 1P value and provide a better fit to the regression line; however, this isnot recommended. Rather, this example further demonstrates the limitations of themethodology. Specifically, the methodology developed by Dowdy et al. for their regressionscould not be applied to an expanded data set of chemicals successfully. Creating additional rulesand correction factors is likely to increase potential for errors and different interpretations,limiting the potential for widespread use.
In conclusion, the BTFs predicted using MCIs do not appear to represent a significantimprovement over using Log Kow. Although the use of a computer program such as EPIWIN canreduce discrepancies in how 1P are calculated, the use of polar correction factors appears to besomewhat limited in applicability to groups of chemicals with similar structure and functionalmoieties. These limitations notwithstanding, the finding that molecular topology combined withpolarity correction factors correlate with BTFs suggests that other shape and polarity/electrostatic descriptors should be examined.
8
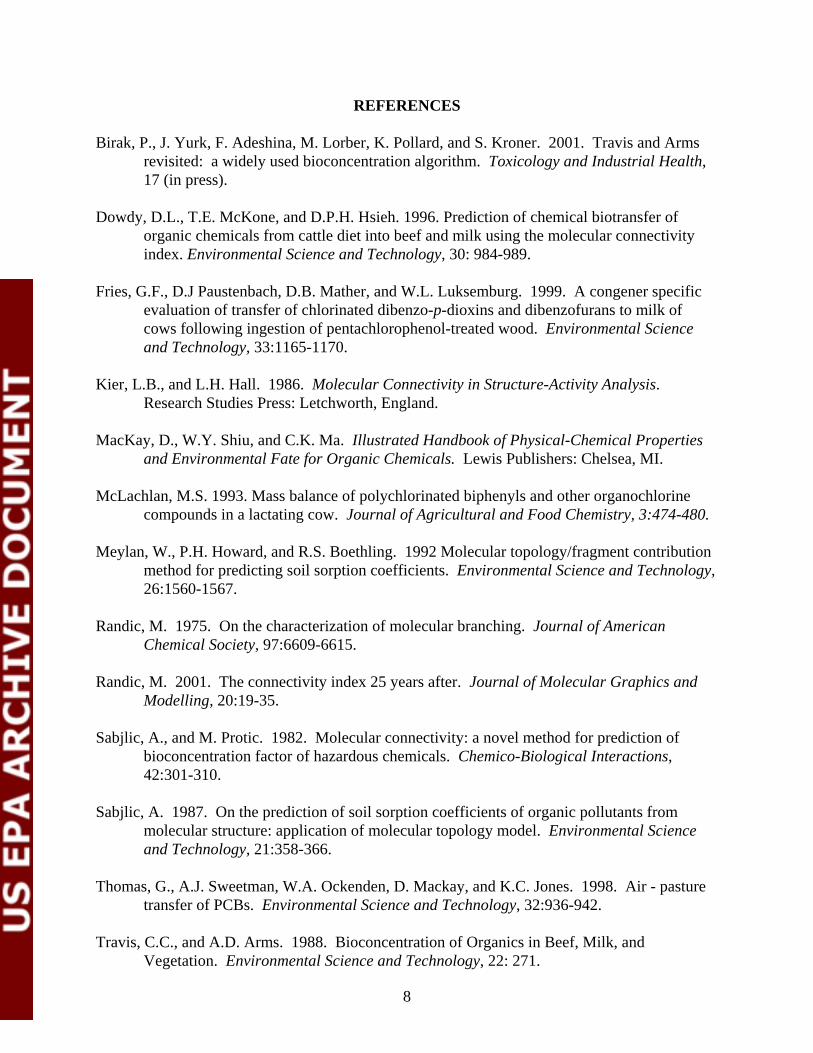
REFERENCES
Birak, P., J. Yurk, F. Adeshina, M. Lorber, K. Pollard, and S. Kroner. 2001. Travis and Armsrevisited: a widely used bioconcentration algorithm. Toxicology and Industrial Health,17 (in press).
Dowdy, D.L., T.E. McKone, and D.P.H. Hsieh. 1996. Prediction of chemical biotransfer oforganic chemicals from cattle diet into beef and milk using the molecular connectivityindex. Environmental Science and Technology, 30: 984-989.
Fries, G.F., D.J Paustenbach, D.B. Mather, and W.L. Luksemburg. 1999. A congener specificevaluation of transfer of chlorinated dibenzo-p-dioxins and dibenzofurans to milk ofcows following ingestion of pentachlorophenol-treated wood. Environmental Scienceand Technology, 33:1165-1170.
Kier, L.B., and L.H. Hall. 1986. Molecular Connectivity in Structure-Activity Analysis. Research Studies Press: Letchworth, England.
MacKay, D., W.Y. Shiu, and C.K. Ma. Illustrated Handbook of Physical-Chemical Propertiesand Environmental Fate for Organic Chemicals. Lewis Publishers: Chelsea, MI.
McLachlan, M.S. 1993. Mass balance of polychlorinated biphenyls and other organochlorinecompounds in a lactating cow. Journal of Agricultural and Food Chemistry, 3:474-480.
Meylan, W., P.H. Howard, and R.S. Boethling. 1992 Molecular topology/fragment contributionmethod for predicting soil sorption coefficients. Environmental Science and Technology,26:1560-1567.
Randic, M. 1975. On the characterization of molecular branching. Journal of AmericanChemical Society, 97:6609-6615.
Randic, M. 2001. The connectivity index 25 years after. Journal of Molecular Graphics andModelling, 20:19-35.
Sabjlic, A., and M. Protic. 1982. Molecular connectivity: a novel method for prediction ofbioconcentration factor of hazardous chemicals. Chemico-Biological Interactions,42:301-310.
Sabjlic, A. 1987. On the prediction of soil sorption coefficients of organic pollutants frommolecular structure: application of molecular topology model. Environmental Scienceand Technology, 21:358-366.
Thomas, G., A.J. Sweetman, W.A. Ockenden, D. Mackay, and K.C. Jones. 1998. Air - pasturetransfer of PCBs. Environmental Science and Technology, 32:936-942.
Travis, C.C., and A.D. Arms. 1988. Bioconcentration of Organics in Beef, Milk, andVegetation. Environmental Science and Technology, 22: 271.

9
Travis, C.C., and S.T. Hester. 1991. Global chemical pollution. Environmental ScienceTechnology, 25:814-819.
U.S. ACE (Army Corps of Engineers). 1996. Risk Assessment Handbook, Volume II:Environmental Evaluation. EM 200-1-4. June.
U.S. EPA (Environmental Protection Agency). 1998. Human Health Risk Assessment Protocolfor Hazardous Waste Combustion Facilities. EPA 530-D-98-001A. Solid Waste andEmergency Response. July.
U.S. EPA (Environmental Protection Agency). 2000. EPI Suite, PCKOCWIN. Softwaredownloaded from http://www.epa.gov/opptintr/exposure/docs/episuite.htm.

10
0 1 2 3 4 5 6 7 8 9
Log Kow
-7
-6
-5
-4
-3
-2
-1
0
Log
BTF
Milk
(mg/
kg)/(
mg/
day)
(a)
0 1 2 3 4 5 6 7 8 9-7
-6
-5
-4
-3
-2
-1
0
Log
BTF
Bee
f (m
g/kg
)/(m
g/da
y)
(b)
Log Kow
Figure 1. Regression analysis of BTFs and log Kow (Birak et al., 2002). Data for milk(a) and beef (b) are presented separately. Each point represents a mean BTFvalue per chemical. The error bars are the 95th percentile confidence intervalfrom the mean. The r2 for milk and beef are 0.50 and 0.46, respectively. Forthe milk regression, F = 44.28; for beef, F = 30.88.
11
5 6 7 8 9 10 11
1χ
-4
-3
-2
-1
Log
BTF
Beef
(mg/
kg)/(
mg/
day)
(b)
5 6 7 8 9 10 11
1χ
-4
-3
-2
-1
Log
BTF
Milk
(mg/
kg)/(
mg/
day)
(a)
Figure 2. Regression analysis of BTFs and 1P for chemicals without polar correctionfactors in data set. Meylan et al. (1992) also performed a regression onnonpolar chemicals in their data set as a basis for their regression ofmolecular connectivity indices and Koc. Data for milk (a) and beef (b) arepresented separately. The r2 for milk and beef are 0.01 and 0.06,respectively.

12
1 2 3 4 5 6 7 8 9 10 11
1χpc
-6
-5
-4
-3
-2
-1
Log
BTF
Bee
f (m
g/kg
)/(m
g/da
y)
(b)
1 2 3 4 5 6 7 8 9 10 11
1χpc
-6
-5
-4
-3
-2
-1
Log
BTF
Milk
(mg/
kg)/(
mg/
day)
(a)
Nonpolar chemicalsPolar chemicalsRegression
Figure 3. Regression analysis of BTFs and 1Ppc for all chemicals in data set. Thechemicals without correction factors () and chemicals with polar correctionfactors (>) are noted separately, but were both included in the linearregression. Data for milk (a) and beef (b) are presented separately. The r2
for milk and beef are 0.55 and 0.54, respectively.

13
Figure 4. Examples of chemicals assigned different chemical functional groups byPCKOCWIN and Dowdy et al. (1996).
O
N
CH 3
OO
H 3 C
Cl
Cl
Benzoylprop-ethyl
H3C
CH3
OCl
Cl
N
NO
O
CH 3
CH 3
H3C Oxadiazon
C l
C lC l
C H 2
OC l
C lC l
Dieldrin

14
Table 1. Polar Correction Factors
Fragment Value
1. Amine, aromatic (nonfused ring) -0.7770a
2. Ether, aromatic [-C-O-C-] -0.6431b
3. Nitro [-NO2] -0.6317
4. N-CO-C (acetamide-type) -0.8112
5. Urea [N-CO-N] -0.9222
6. Nitrogen to carbon, aliphatic [-N-C] -0.1242c
7. Carbamate [N-CO-O] or [N-CO-S] -1.0249
8. Triazine ring -0.7521
9. Nitrogen-to-cycloalkane, aliphatic -0.8220
10. Uracil [-N-CO-N-CO-C=C- ring] -1.8060
11. Organic acid [-CO-OH] -1.7512a
12. Ketone [-C-CO-C-] -1.2477
13. Aliphatic alcohol [-C-OH] -1.5193
14. Nitrile/cyanide [-C/N] -0.7223a
15. Thiocarbonyl [C=S] -1.1002
16. OrganoPhosphorus [P=S] -1.2634a,h
17. OrganoPhosphorus, aliphatic [P=O] -1.6980a,d
18. N-CO-O-phenyl carbamate -2.0022
19. Ether, aliphatic [-C-O-C-] -1.2643
20. Ester [-C-CO-O-C-] or [HCO-O-C] -1.3089g
21. Sulfone [-C-SO2-C-] -0.9945
22. Azo [-N=N-] -1.0277
23. N-CO-O-N carbamate -1.9200
24. Aromatic ring with 2 nitrogens -0.9650
25. OrganoPhosphorus, aromatic [P=O] -2.8781a
26. Miscellaneous carbonyl [C=O] group -1.2000e
27. Pyridine ring (NO other fragments) -1.7001f
28. OrganoPhosphorous, aromatic [P=2] -2.3300h
29. Miscellaneous [S=O] group -0.9000i
(continued)

15
Table 1. (continued)
a Counted only once per structure, regardless of number of occurrences.b Either one or both carbons aromatic; if both carbons aromatic, cannot be cyclic.c Any nitrogen attached to double bond is not counted; also carbonyl and
thiocarbonyl are not counted as carbons.d This is the only fragment counted, even if other fragments occur.e Not included in regression derivation; estimated from other carbonyl fragments.f A pyridine ring is counted only when no other fragments in this list are present.g If more than one ester was present, Fragment 20 was used. When a single ester
was present, the ester was treated as an ether and carbonyl group (Fragments 2, 19,26) to be consistent with Dowdy et al. (1996).
h Dowdy et al. estimated a separate polar correction factor for aromaticorganophosphorous groups (Fragment 28). The factor value is the averagedeviation of this set of compounds from the Dowdy et al.-derived curve.
i Polar correction factor used in PCKOCWIN but not presented in Dowdy et al.(1996) or Meylan et al. (1992).

16
Table 2. Chemicals with Unmodified Molecular Connectivity Indices (1P)
CAS Constituent LogKow1Pcalculated
1Preported*
Log Milk BTF Log Beef BTF
Average StDev Average StDev 50-29-3 DDT 6.5 8.9 8.9 -2.8 0.4 -1.6 0.5 57-74-9 chlordane 6.3 8.1 8.1 -4.2 0.6 -2.1 1.0 58-89-9 lindane 3.7 5.5 5.5 -2.8 0.4 -1.8 0.3 72-54-8 DDD 6.1 8.6 8.6 -2.6 0.0 72-55-9 DDE 6.8 8.6 8.6 -1.9 0.1 -1.2 0.1 87-86-5 pentachlorophenol 5.1 5.5 -3.2 118-74-1 hexachlorobenzene 5.9 5.5 -1.9 0.2 -1.0 0.1 309-00-2 aldrin 6.5 8.3 8.3 -3.4 -3.8 0.3 1746-01-6 TCDD, 2,3,7,8- 6.8 8.5 8.5 -2.0 0.1 -1.9 0.1 2385-85-5 mirex 6.9 9.5 9.5 -1.8 0.6 -1.9 3268-87-9 OCDD 8.2 10.3 -2.8 -2.6 8001-35-2 toxaphene 5.5 8.2 7.2 -3.1 0.2 -2.0 0.411097-69-1 aroclor 1254 6.3 8.0 8.4 -2.0 0.2 -1.4 0.219408-74-3 HxCDD, 1,2,3,7,8,9- 7.3 9.4 -2.2 -2.035822-46-9 HpCDD, 1,2,3,4,6,7,8- 8.0 9.8 -3.0 -1.939001-02-0 OCDF 8.8 9.8 -3.3 -2.339227-28-6 HxCDD, 1,2,3,4,7,8- 7.8 9.4 -2.240321-76-4 PeCDD, 1,2,3,7,8- 6.6 9.0 -1.951207-31-9 TCDF, 2,3,7,8- 6.1 8.1 -2.655673-89-7 HpCDF, 1,2,3,4,7,8,9- 8.0 9.3 -2.557117-31-4 PeCDF, 2,3,4,7,8- 6.5 8.5 -2.157117-41-6 PeCDF, 1,2,3,7,8- 6.8 8.5 -2.757117-44-9 HxCDF, 1,2,3,6,7,8- 7.0 8.9 -2.257653-85-7 HxCDD, 1,2,3,6,7,8- 7.3 9.4 -2.3 -1.060851-34-5 HxCDF, 2,3,4,6,7,8- 7.0 8.9 -2.367562-39-4 HpCDF, 1,2,3,4,6,7,8- 7.4 9.3 -2.9 -1.870648-26-9 HxCDF, 1,2,3,4,7,8- 7.0 8.9 -2.2
* 1P values reported by Dowdy et al. (1996).

17
Table 3. Chemicals That Used Polar Correction Factors
Log Milk BTF Log Beef BTF
CAS Constituent logKow1P 1Ppc
Polar CorrectionFactors (Pf) 1Ppc
aPolar Correction
Factors (Pf)a Average StDev Average StDev 55-38-9 fenthion 4.1 7.5 3.1 28 3.1 28 -4.4 0.1 56-38-2 parathion 3.8 8.5 2.9 3, 28 -3.9 0.0 60-57-1 dieldrin 5.4 8.8 6.4 19 8.8 -1.9 0.2 -1.3 0.6 72-20-8 endrin 5.1 8.8 6.4 19 8.7 -2.7 0.5 -2.1 0.5 72-43-5 methoxychlor 5.1 10.0 7.5 2 -4.7 0.3 -4.7 93-72-1 fenoprop (silvex) 3.8 6.9 2.4 2, 11 2.4 2, 11 -5.1 0.2 -4.8 0.5 93-76-5 2,4,5-T 3.3 6.5 2.0 2, 11 2 2, 11 -4.9 0.2 94-74-6 MCPA 3.3 6.1 1.6 2, 11 1.6 2, 11 -5.4 94-75-7 2,4-D 2.7 6.1 1.6 2, 11 1.6 2, 11 -5.4 -5.0 0.3 297-78-9 telodrin 4.5 8.1 5.7 19 -1.8 0.1 314-40-9 bromacil 2.1 6.5 2.6 6, 10 -3.8 0.02 1024-57-3 heptachlor epoxide 5.0 8.2 5.8 19 8.2 -2.3 0.7 -1.6 0.5 1918-00-9 dicamba 2.4 6.1 1.5 2, 11 1.6 2, 11 -4.7 -4.6 1918-02-1 picloram 1.4 5.9 1.2 1, 11 -4.3 0.2 2921-88-2 chlorpyrifos 5.3 8.4 4.0 28 4 27, 28 -4.719666-30-9 oxadiazon 4.8 10.1 5.5 1, 2, 7 4.2 2, 19, 26 -3.8 -4.120354-26-1 methazole 3.2 7.5 2.1 1, 5, 6, 7 -3.7 0.1 -4.422212-55-1 benzoylprop-ethyl 4.3 11.5 2.8 1, 6, 19, 26 3.1 1, 19, 26 -4.5 -4.423950-58-5 kerb 3.5 7.3 4.8 6, 26 4.8 6, 26 -4.935367-38-5 di-flubenzuron 3.9 10.0 4.5 1, 5, 26 -5.6 -4.8 0.751630-58-1 fenvalerate 4.4 14.5 7.2 2, 14, 19, 26 7.3 2, 14, 19, 26 -3.4 0.252315-07-8 cypermethrin 6.6 13.3 6.1 2, 19, 26 -3.6 0.1 -3.4 0.452645-53-1 permethrin 6.5 12.4 6.5 2, 19, 26 -3.70.452756-22-6 flamprop-isopropyl 4.2 11.8 3.2 1, 6, 19, 26 3.4 1, 19, 26 -4.2 -4.052918-63-5 deltamethrin 5.4 13.3 6.1 2, 19, 26 -4.3 0.3 -4.7 0.253780-34-0 mefluidide 2.0 8.9 4.2 1, 4, 29 -5.0 0.2 -5.055511-98-3 buthidazole 1.5 7.8 1.0b 1, 5, 6, 13, 24 -4.7 0.2 -5.5
a Data reported in Dowdy et al. (1996).b Overcorrection adjustment to lower limit 1Ppc.