Measuring Residual Stress and the Resulting Stress Intensity Factor ...
Appendix A. Stress Intensity Factors and Weight Functions for Test Specimens
For the detennination of fracture toughness various test specimens are used. For the calculation of K1c (Chap. 3) stress intensity factor solutions for these specimens are necessary. Also knowledge of weight functions is of interest, e.g. for the determination of R-curves (Chap. 4) from bridging stresses or, inversely, for the determination of bridging stresses from R-curves or from COD-measurements.
A.1 Rectangular Bar
(j
b) a)
F/2 F/2 x
w
w-- -~--s-~~·· --1
thickness B
(j
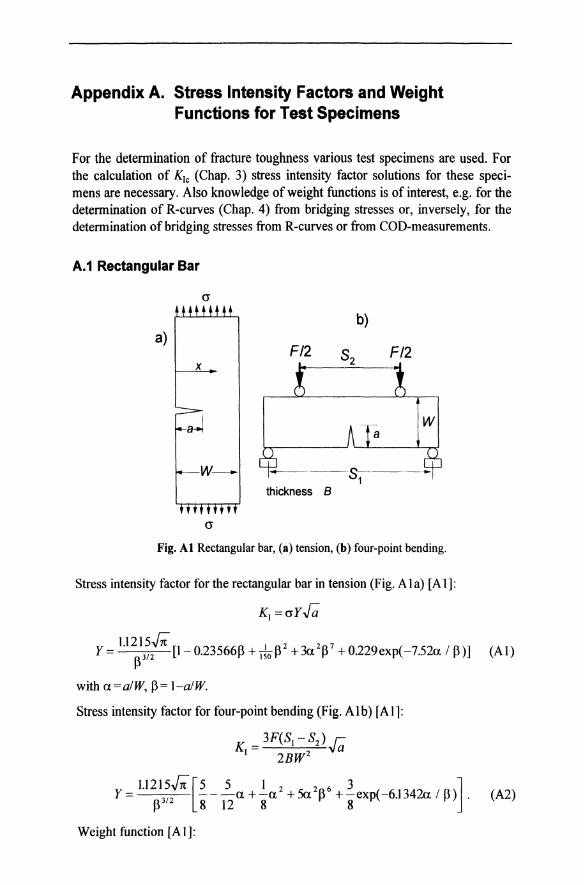
Fig. Al Rectangular bar, (a) tension, (b) four-point bending.
Stress intensity factor for the rectangular bar in tension (Fig. A I a) [A I ]:
K( =cryJ;;
1.1215~ ] 2 2 7 y= p312 [1-0.23566P+l5OP +3a P +0.22gexp(-7.52a/p)] (AI)
with a=a/W, p= I-a/W.
Stress intensity factor for four-point bending (Fig. Alb) rAil:
K = 3F(S] -S2) J;; ( 2BW2
1.12 I 5j; [5 5 1 2 2 6 3 ] y= ---a+-a +5a A +-exp(-6.l342a/ A ) . p312 8 12 8 p 8 p (A2)
Weight function [A I]:
280 Appendix A
h = /2_1 -[I + L ~J!a :/2 (1- P r+1], P = x / a (A3) V-;; ~ (v,Il)(1-a)
with the coefficients given in Table AI.
Table At Coefficients for the weight function for edge-cracked bars.
J.1=0 J.1=1 J.1=2 J.1=3 J.1=4
v=O 0.4980 2.4463 0.0700 1.3187 -3.067
v=1 0.5416 -5.0806 24.3447 -32.7208 18.1214
v=2 -0.19277 2.55863 -12.6415 19.7630 -10.986
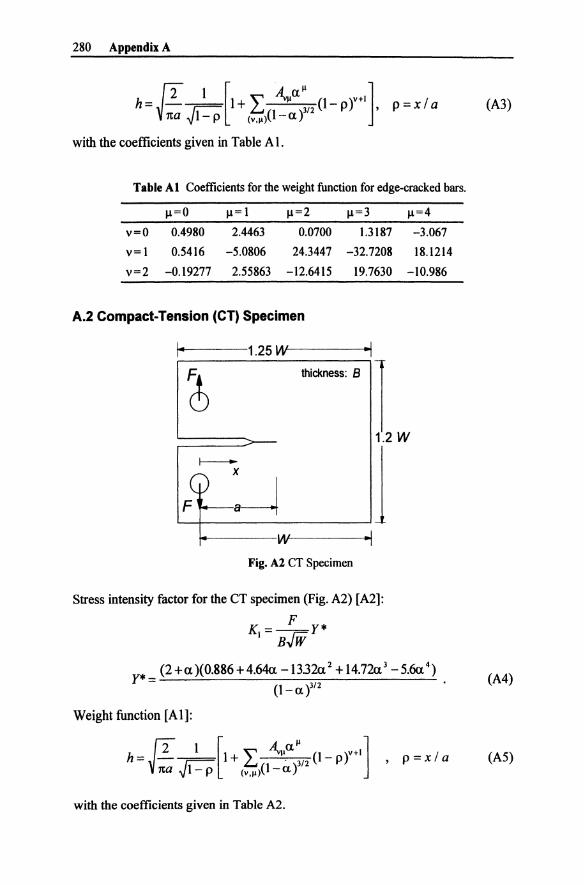
A.2 Compact-Tension (CT) Specimen
14-1 .. ---1.25 W'----..,·I
~ thickness: B I
1.2 W
1 f----
X
F~a~ W "I
Fig. A2 CT Specimen
Stress intensity factor for the CT specimen (Fig. A2) [A2]:
K _ F y* 1- BJW
y* = (2 +a )(0.886 + 4.64a -1332a 2 + 14.72a 3 - 5.00. 4) • (A4) (1-a y/2
Weight function [A 1 ]:
h = f2_1_[1 + L A,,1l.a : /2 (1- pr+l ] , p = x / a (A5) V-;; ~ (v,IlP -a)
with the coefficients given in Table A2.

Stress Intensity Factors and Weight Functions 281
Table A2 Coefficients for the weight function for CT-specimens.
1-1=0 1-1=1 1-1=2 1-1=3 1-1=4
v=O 2.673 -8.604 20.621 -14.635 0.477
v=1 -3.557 24.973 -53.398 50.707 -11.837
v=2 1.230 -8.411 16.957 -12.157 -0.940
v=3 -0.157 0.954 -1.284 -0.393 I.655
A.3 Round Compact Tension (RCT) Specimen
t-----w-----t
r---X
thickness B
Fig. A3 RCT specimen.
Stress intensity factor for the RCT specimen (Fig. A3) [A3]:
_ F * K\ - r;;; Y B"W
(2 + a. )(0.76 + 4.8a. -11.58a. 2 + 11.430. 3 - 4.080. 4) y* = (A6)
(l-a.i /2
with a. = aID.
Weight function [AI]:
h= fT_l_[l+ L A"l1a.:/2 (l-pr'] ,p=x/a (A7) V:;; ~ (V,ll)(l-a.)
with the coefficients given in Table A3.

282 Appendix A
Table A3 Coefficients for the weight function for RCT-specimens.
!l=0 !l=1 !l=2 !l=3 !l=4
v=O 2.826 -10.948 35.278 -41.438 15.191
v=1 -5.865 48.095 -143.79 196.01 92.79
v=2 0.8007 -3.839 6.684 -4.836 -0.7274
v=3 -0.2584 1.280 -5.248 11.435 -7.328
v=4 0.6856 -6.734 25.188 -40.14 22.047
A.4 Double-Cantilever-Beam Specimen (DCB)
The DeB specimen (Fig. A4) is one of the earliest fracture mechanics test specimens.
F ~
F .-
x a ~I
thickness
W
Fig. A4 Double-cantilever-beam specimen.
B
•
T 2H -1-
For H«(a, W) the stress intensity factor reads for plane stress (see (5.37»
for plane strain conditions
K=J12 Fa BH3/2~I_v2 '
and the weight function can be expressed as [A 1 ]
J%2[a-x ] ~ (Pi-x) h= - --+0.68 + exp - 12-- . H H 1t(a-x) H
(A8a)
(A8b)
(A9)
Stress Intensity Factors and Weight Functions 283
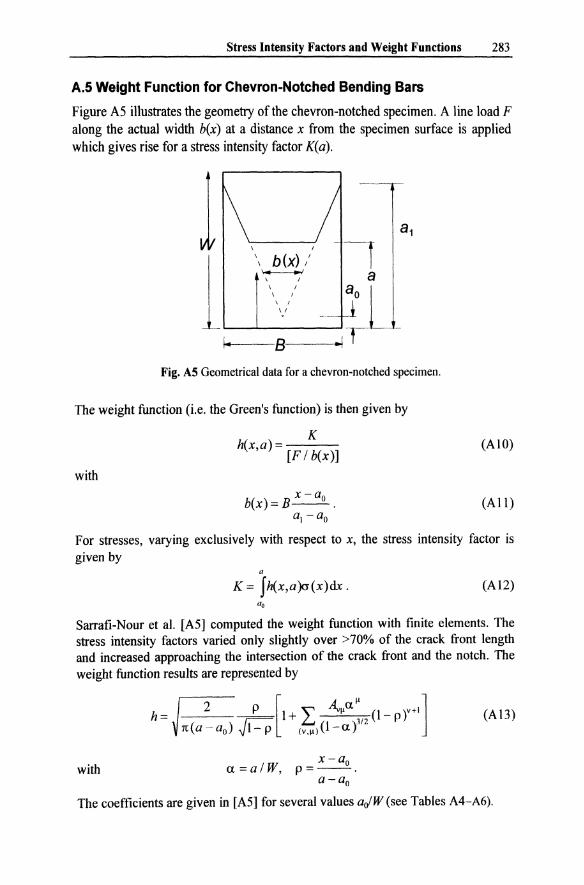
A.S Weight Function for Chevron-Notched Bending Bars
Figure AS illustrates the geometry of the chevron-notched specimen. A line load F along the actual width hex) at a distance x from the specimen surface is applied which gives rise for a stress intensity factor K(a).
1 8 1
--f
1 I
I b(x);' - 8 I /
\ /
~L I I
1/
I .. B ~
Fig. AS Geometrical data for a chevron-notched specimen.
The weight function (i.e. the Green's function) is then given by
K h(x,a) = [F I hex)] (AlO)
with
(All)
For stresses, varying exclusively with respect to x, the stress intensity factor is given by
a
K = fh(x,a)cr(x)dx. (AI2)
Sarrafi-Nour et al. [A5] computed the weight function with finite elements. The stress intensity factors varied only slightly over >70% of the crack front length and increased approaching the intersection of the crack front and the notch. The weight function results are represented by
(A 13)
with x-a
ex =aIW, P = __ 0.
a-ao
The coefficients are given in [A5] for several values aolW (see Tables A4-A6).

284 Appendix A
Table A4 Coefficients for aofW = 0.22.
11=0 11=1 11=2 11=3
v=O -2.0785 2.7446 7.8175 -7.6139
v=1 0.9784 4.9004 -17.9156 15.9411
v=2 -0.0054 -6.3133 16.1245 -11.1495
Table A5 Coefficients for aofW = 0.32.
11=0 11=1 11=2 11=3
v=O -3.5928 8.6026 -1.3268 -2.8235
v=1 7.5188 -25.8126 27.4251 -6.4034
v=2 -6.6844 24.6966 -29.8404 11.1440
Table A6 Coefficients for aofW = 0.42.
11=0 11=1 11=2 11=3
v=O -5.6694 12.3795 -2.9021 -3.2004
v=1 13.5020 -38.0586 30.7401 -3.8265
v=2 -11.3203 33.8084 -31.7464 8.5356
Specimens for Mixed-Mode Tests 285
A.6 Specimens for Mixed-Mode Tests
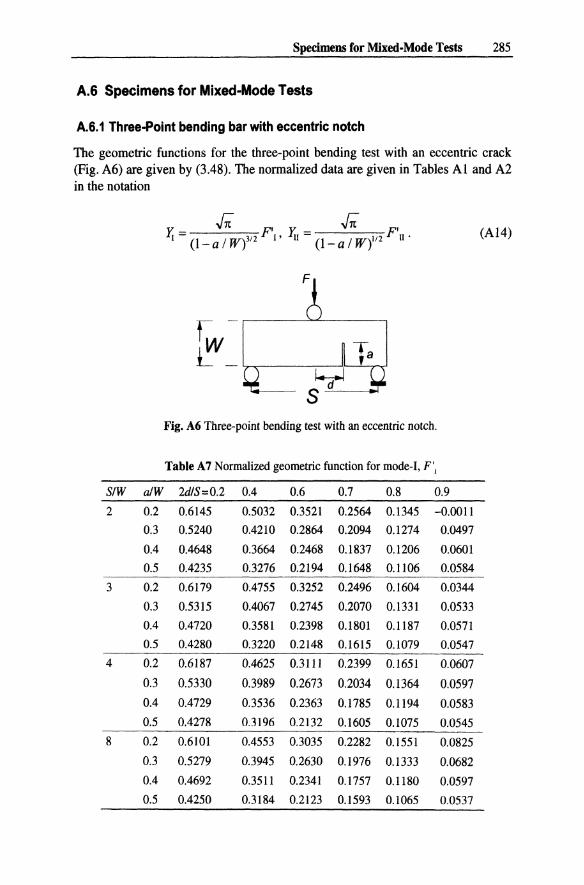
A.6.1 Three-Point bending bar with eccentric notch
The geometric functions for the three-point bending test with an eccentric crack (Fig. A6) are given by (3.48). The normalized data are given in Tables Al and A2 in the notation
S/W a/W
2 0.2
OJ
0.4
0.5
3 0.2
OJ
0.4
0.5
4 0.2
OJ
0.4
0.5
8 0.2
OJ
0.4
0.5
Y.= j; F' Y.= j; F' I (1- a / W)3/2 I' II (1- a / Wi'2 II .
[ -
f'V
Fig. A6 Three-point bending test with an eccentric notch.
Table A7 Normalized geometric function for mode-I, F']
2d/S=0.2 0.4 0.6 0.7 0.8 0.9
0.6145 0.5032 OJ521 0.2564 0.1345 -0.0011
0.5240 0.4210 0.2864 0.2094 0.1274 0.0497
0.4648 OJ664 0.2468 0.1837 0.1206 0.0601
0.4235 OJ276 0.2194 0.1648 0.1106 0.0584
0.6179 0.4755 OJ252 0.2496 0.1604 0.0344
0.5315 0.4067 0.2745 0.2070 0.1331 0.0533
0.4720 OJ581 0.2398 0.1801 0.1187 0.0571
0.4280 0.3220 0.2148 0.1615 0.1079 0.0547
0.6187 0.4625 OJ111 0.2399 0.1651 0.0607
0.5330 OJ989 0.2673 0.2034 0.l364 0.0597
0.4729 0.3536 0.2363 0.1785 0.1194 0.0583
0.4278 0.3196 0.2132 0.1605 0.1075 0.0545
0.6101 0.4553 OJ035 0.2282 0.1551 0.0825
0.5279 OJ945 0.2630 0.1976 0.1333 0.0682
0.4692 0.3511 0.2341 0.1757 0.1180 0.0597
0.4250 0.3184 0.2123 0.1593 0.1065 0.0537
(AI4)

286 Appendix A
Table AS Normalized geometric function for mode-II, F'n
S/W a/W 2d/S=0.2 0.4 0.6 0.7 0.8 0.9
2 0.2 0.0557 0.0868 0.1069 0.1359 0.2146 0.3893
0.3 0.0743 0.1167 0.1453 0.1750 0.2315 0.3093
0.4 0.0899 0.1378 0.1649 0.1858 0.2172 0.2522
0.5 0.1041 0.1513 0.1709 0.1825 0.1979 0.2116
3 0.2 0.0553 0.0696 0.0638 0.0649 0.0871 0.1912
OJ 0.0712 0.0895 0.0856 0.0895 0.1131 0.1779
0.4 0.0827 0.1018 0.0995 0.1036 0.1206 0.1550
0.5 0.0915 0.1081 0.1063 0.1091 0.1189 0.1358
4 0.2 0.0497 0.0543 0.0481 0.0454 0.0499 0.1049
OJ 0.0633 0.0693 0.0632 0.0616 0.0692 0.1131
0.4 0.0722 0.0781 0.0730 0.0723 0.0793 0.1062
0.5 0.0777 0.0820 0.0783 0.0779 0.0827 0.0971
8 0.2 0.0276 0.0258 0.0258 0.0253 0.0236 0.0249
0.3 0.0352 0.0333 0.0332 0.0328 0.0311 0.0345
0.4 0.0395 0.0378 0.0377 0.0373 0.0361 0.0396
0.5 0.0413 0.0400 0.0400 0.0397 0.0388 0.0413
Tables A7 and AS have to be interpolated with respect to S/W, d/(S/2), and
a/W. This can be done using cubic splines.
A.6.2 Asymmetric four-point bending bar
The geometric functions for the asymmetric bending test (Fig. A 7) are defmed by (3.49). Tables A9 and AlO give data for different a/W, d!W and LlW=5.
F
Tw I-----.-~----r' 1
I--___ F_ 2L ___ J Fig. A 7 Geometrical data for the asymmetrically loaded notched bending bar.

Specimens for Mixed-Mode Tests 287
Table A9 Geometric function FII for mode II, YII = £ Fn.
a/W d/W=0.25 0.300 0.375 0.500 0.625
0.1 0.3746 0.3428 0.3318 0.3450 0.3599
0.2 0.7881 0.7180 0.6719 0.6633 0.6741
0.3 1.0374 0.9933 0.9560 0.9399 0.9431
0.4 1.1858 1.1819 1.1753 1.1702 1.1695
0.5 1.3120 1.3380 1.3579 1.3661 1.3641
0.6 1.4674 1.5079 1.5387 1.5507 1.5472
0.7 1.6948 I. 7318 1.7553 1.7600 1.7547
0.8 2.0530 2.0687 2.073 2.0684 2.0635
0.9 2.7563 2.7545 2.7505 2.7467 2.7452
Table AIO Geometric function F\ for mode t, Y\ = £ F\.
a/W d/W=0.25 0.300 0.375 0.500 0.625
0.1 0.2615 0.3695 0.4241 0.3841 0.2918
0.2 -0.0038 0.1l29 0.2110 0.2448 0.2060
OJ -0.0307 0.0447 0.1184 0.1580 0.1410
0.4 0.0024 0.0483 0.0904 0.1098 0.0953
0.5 0.0407 0.0672 0.0842 0.0806 0.0627
0.6 0.0716 0.0808 0.0771 0.0566 0.0371
0.7 0.0855 0.0769 0.0581 0.0320 0.0164
0.8 0.0641 0.0460 0.0271 0.0106 0.0036
0.9 -0.0048 -0.0002 0.0077 0.0141 0.0138
A.S.3 The oblique crack
Stress intensity factor solutions for the oblique crack in four-point bending (Fig. AS) are compiled in [AI].
F/2 F/2
1----- S1 Fig. A8 4-point bending test with an oblique notch.
The geometric functions F\ and Fn, defmed by
K[ =cr~&, KII =crFlI& (AlS)

288 Appendix A
(cr = bending stress), are given in the following tables.
Table All Geometric function FI for the oblique notched bending bar.
p (0) a/W=O.1 0.2 0.3 0.4 0.5 0.6 0.7
0 1.049 1.058 1.126 1.26 1.495 1.915 2.71
15 0.980 1.02 1.058 1.185 1.365 1.698 2.30
22.5 0.935 0.96 0.985 1.090 1.26 1.53 2.04
30 0.874 0.883 0.91 0.985 1.12 1.32 1.74
45 0.690 0.69 0.695 0.710 0.794 0.89 1.09
60 0.450 0.45 0.451 0.467 0.510 0.56 0.64
90 0.0 0.0 0.0 0.0 0.0 0.0 0.0
Table A12 Geometric function Fll for the oblique notched bending bar.
p (0) a/W=O.l 0.2 0.3 0.4 0.5 0.6
0 0.0 0.0 0.0 0.0 0.0 0.0
22.5 0.23 0.216 0.215 0.220 0.235 0.265
30 0.286 0.278 0.274 0.275 0.286 0.302
45 0.344 0.329 0.316 0.316 0.326 0.349
60 0.306 0.304 0.302 0.306 0.313 0.321
90 0.0 0.0 0.0 0.0 0.0 0.0
A.6.4 Brazilian disk test
Geometric functions for the Brazilian disk test (see Fig. A9) were computed [A4] using the weight function procedure. The results are compiled in the following tables
F
F Fig. A9 Diametral compression test (thickness: B).

Specimens for Mixed-Mode Tests 289
Table A13 Geometric function Yn for the Brazilian disk tests (3.51).
aIR 0=0° 15° 30° 45° 60° 75° 90°
0 0.0 1.77 3.07 3.54 3.07 1.77 0.0
0.1 0.0 1.81 3.12 3.56 3.05 1.75 0.0
0.2 0.0 1.93 3.25 3.61 3.01 1.69 0.0
0.3 0.0 2.15 3.47 3.67 2.93 1.61 0.0
0.4 0.0 2.48 3.75 3.72 2.84 1.52 0.0
0.5 0.0 2.96 4.07 3.76 2.75 1.44 0.0
0.6 0.0 3.64 4.41 3.80 2.71 1.40 0.0
0.7 0.0 4.57 4.78 3.93 2.77 1.43 0.0
0.8 0.0 5.78 5.33 4.33 3.05 1.57 0.0
Table A14 Geometric function Y1 for the Brazilian disk tests (3.51).
aIR 19=0° 15° 30° 45° 60° 75° 90°
0 1.772 1.298 0.0 -1.772 -3.545 -4.842 -5.317
0.1 1.799 1.304 -0.036 -1.83 -3.60 -4.87 -5.33
0.2 1.879 1.319 -0.149 -2.02 -3.75 -4.94 -5.36
0.3 2.013 1.330 -0.36 -2.32 -3.98 -5.05 -5.42
0.4 2.200 1.314 -0.673 -2.71 -4.27 -5.21 -5.52
0.5 2.459 1.228 -1.126 -3.17 -4.60 -5.43 -5.69
0.6 2.797 0.996 -1.724 -3.69 -5.00 -5.76 -6.01
0.7 3.273 0.466 -2.448 -4.28 -5.51 -6.25 -6.49
0.8 3.98 -0.54 -3.27 -5.01 -6.26 -7.03 -7.29
References
Al Fett, T., Munz, D. (1997): Stress intensity factors and weight functions, Compu-tational Mechanics Publications, Southampton.
A2 Newman, I.C. (1974): Stress analysis of compact specimens including the effects of pin loading, ASTM STP 560,105-121.
A3 Newman, 1. C. (1981): Stress intensity factors and crack -opening displacements for round compact specimens, lnt. I. Fract. 17,567-578.
A4 Fett, T. (1998): Mode-II weight function for circular disks with internal radial crack and application to the Brazilian disk test, lnt. I. Fract. 89, L9-LJ3.
A5 Sarrafi-Nour, G.R., Fett, T., Coyle, T.W. (1997): A weight function for the crack surface tractions in chevron notched specimen, Engng. Fract. Mech. 59,439-445.

290 Appendix B
Appendix B. h-Parameters for Creep Crack Growth
The geometric functions g, and g2 occurring in (12.63) and (12.64) can be written in terms of the h-parameters h" h2
(w ) ( L )n+1 glb = -; -1 I; 0.728(W _ a)
I; L g2b = h; 0.728a
where the sUbscript b stands for bending. The geometrical quantities L, a and W can be seen from Fig. 12.30. The h-parameters of the EPRI-handbook [12.41] may be expressed by the approximations for the range 2::::; n::::; 7 [12.37]
h, ~a[126+ tt.A...(I-a)'n'''r
with a = a/Wand the coefficients AVIl for hi'
Table Bl Coefficients for hi
1l=1 2 3
v=1 4.4451 -4.552 0.1232
2 8.9083 -9.312 3.9838
3 -23.27 20.225 -3.790
4 13.543 -6.597 -1.333
Table B2 Coefficients for h3
1l=0 2
v=O 2.1204 -0.196 0.0153
-0.809 -0.287 -0.025
2 0.2307 0.711 0.0519
3 0.4596 -0.326 -0.046
h-Parameters for Creep Crack Growth 291
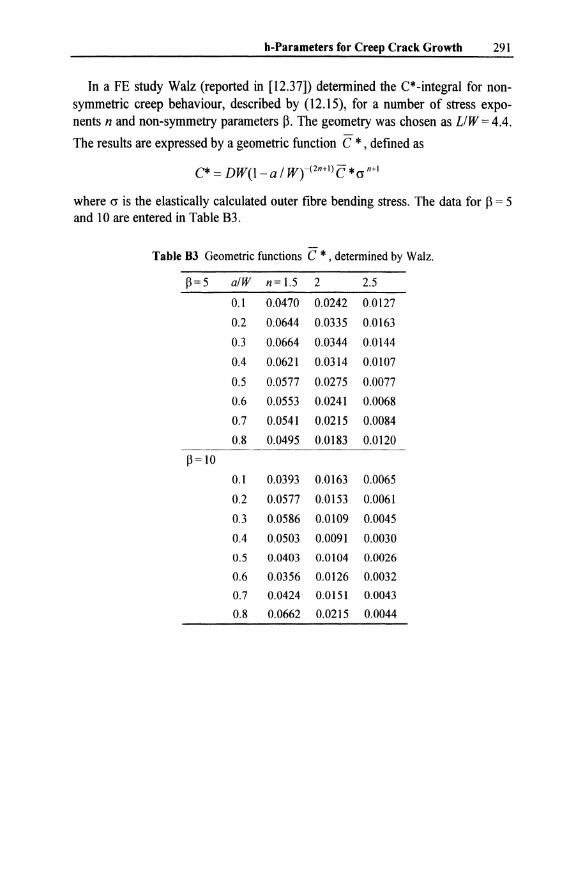
In a FE study Walz (reported in [12.37]) determined the C*-integral for nonsymmetric creep behaviour, described by (12.15), for a number of stress exponents n and non-symmetry parameters ~. The geometry was chosen as LIW = 4.4.
The results are expressed by a geometric function C * , defined as
C* = DW(l- a / Wr(2n+l) C * (J n+l
where cr is the elastically calculated outer fibre bending stress. The data for ~ = 5 and 10 are entered in Table B3.
Table 83 Geometric functions C * , determined by Walz.
poo5 alW noo 1.5 2 2.5
0.1 0.0470 0.0242 0.0127
0.2 0.0644 0.0335 0.0163
OJ 0.0664 0.0344 0.0144
0.4 0.0621 0.0314 0.0107
0.5 0.0577 0.0275 0.0077
0.6 0.0553 0.0241 0.0068
0.7 0.0541 0.0215 0.0084
0.8 0.0495 0.0183 0.0120
poo 10
0.1 0.0393 0.0163 0.0065
0.2 0.0577 0.0153 0.0061
OJ 0.0586 0.0109 0.0045
0.4 0.0503 0.0091 0.0030
0.5 0.0403 0.0104 0.0026
0.6 0.0356 0.0126 0.0032
0.7 0.0424 0.0151 0.0043
0.8 0.0662 0.0215 0.0044
1 Subject Index
Acoustic emission 270
AIN 4 Application 6 Density 15 Elastic constants 16 Electric conductivity 13 Specific heat 14 Strength 147 Thermal conductivity 12 Thermal expansion coefficient lO
AlP3 Application 5 Compressive strength 134 Crack growth rate 89,94 Crack size of Knoop cracks 33 Creep 243 Creep crack growth 260 Density 15 Elastic constants 16 Electric conductivity ] 3 Fatigue 120 Fracture toughness 38,47-49 Lifetime 90,91, 95 R-curve 39, 53-55 Multiaxiality 49, 198 Specific heat 14 Strength 147 Thermal expansion coefficient 10 Thermal conductivity 12 Thermal shock 212,220 Thermal shock parameters 219 v-K curve 94
Al2Ti05
Application 5 Density 15 Elastic constants 16
Electrical conductivity 13 Specific heat 14 Thermal conductivity 12 Thermal expansion coefficient lO Thermal shock parameters 219
Application 5-7 Andrade creep law 229,243 Asymmetric four-point bend test 41, 286
Ball-on-ring test 191 B4C
Application 7 Compressive strength 134 Density 15 Elastic constants 16 Electric conductivity 13 Specific heat 14 Thermal conductivity 12 Thermal expansion 10
BeO Density 15 Elastic constants 16 Electric conductivity 13 Specific heat 14 Thermal conductivity 12 Thermal expansion coefficient lO Thermal shock parameters 219
Bending moment 237 Bending strength 126 Bending test 126,236-246,273 Bernoulli hypothesis 237,239 Bias factor 144 Bimodal strength distribution 154 Biot number (modulus) 207,217,220 BN
Density 15

294 Subject Index
Elastic constants 16 Electric conductivity 13 Specific heat 14 Thermal conductivity 12 Thermal expansion coefficient 10
Brazilian disk test 43, 168, 193 Bridge method 27 Bridging effects 59 Bridging stresses 61,66-68
Chevron notch 28-31,283 C*-Integral 254-261 Circular crack 176 Circular ring test 130 Circumferential stress 195 Compliance 21,58 Compression creep 233 Compression test 132, 195 Compressive strength 132, 134 Conductivity
Electrical 13 Thermal 11
Construction guidelines 2 Contact loading 128,265-267 Coplanar energy release rate 45 Cordierite 11 Crack
Branching 63 Circular 176 Density 137,183,185 Edge 20 Growth rate 77
static 78, 82-99 cyclic 109-111,113-117
Growth resistance curve, see R-curve Initiation 38 Orientation 177 Profile 71 Resistance 23,24,53-71 Semi-elliptic 224 Size distribution 138, 185 Surface displacement 66-68 Surface interaction 61, 66-68 Through-the-thickness 22
Creep Asymmetry 246-249
Bending test 236 Creep compliance 257 Compression 233, 245 Creep crack growth 254-261 Creep fracture 250 Curve 228-230 Deformation 227 Hardening rules 234 Non-symmetry 246-249 Primary 228,229,245 Secondary 228,231,242 Stationary 242 Stress dependence 231 Temperature dependence 232 Tension 233, 245 Tertiary 228 Time dependence 229 Variable stresses 234 Zone 255
C-ring test 130 CT specimen (compact tension) 280 Cyclic fatigue 109-124 Cyclic loading 80-82
Crack growth rate 109-123 daldN-ilKI-curve 109-123 Influence of frequency 112, 119 Influence ofR-ratio 112,115-117
Cylindrical pore 171
Damage (creep-induced) 249 DCB specimen 85-87 Debye temperature 14 Defect models 171-180 Density 15 Diametral compression test 42 Diamond
Application 6 Density 15 Electric conductivity 13 Thermal conductivity 12 Thermal expansion coefficient 10
Distribution density 138, 160 Distribution function 159 Domain switching 272 Double Cantilever Beam (DCB) 85, 282

Double Torsion (DT) 83-85 Dynamic bending test 87-89
Eccentric loading 126, 133 Eccentric notch 41, 285 Effective surface 146 Effective volume 145 Elastic constants 16, 132 Electrical conductivity 13 Ellipsoidal pore 175 Empirical criterion 46 Energy release rate 21,53, 177, 181 Equibiaxial tension 197 Equivalent stress 178, 181
Failure criteria 167 Failure maps 251 Failure mechanism 249 Failure models 171 Failure probability 141-146, 184 Fatigue
Cyclic, see cyclic fatigue Static, see subcritical crack extension
Flaws 164 Flaw population 164 Fracture mechanics 19-49 Fracture toughness 20, 23, 25-40, 181,214 Friction 47,127,178,187,266
Geometric function 20, 25 Glass 48, 212 Glass ceramic
Application 7 Density 15 Elastic constants 16 Electric conductivity 13 Thennal conductivity 12 Thennal expansion coefficient 11
Glassy phase 121, 227, 234 Grain boundary 227 Grain boundary glassy phase 227 Graphite 197
Application 5 Density 15 Electric conductivity 13 Fracture toughness 49
Subject Index 295
Strength 197 Thennal conductivity 12 Thennal expansion coefficient 10
Grinding 268
Hardening rules 234-236 Strain-hardening 235 Time-hardening 234
Heat conductivity 208 Heat flux 207 Heat radiation 207 Heat transfer coefficient 208,217 Hertz contact 265 High-temperature failure 249-261 Hollow cylinders 133, 195 HPSiC 4,15 HPSN 15,96, 120, 135,222,230,232 HRR-stress field 254 Hydrostatic stress 168
Inclined crack 44 Inert strength 79 Indentation fracture (IF) 38 Indentation strength (IS) 38 Indentation stress 265 Indentation strain 265
Knoop-indentation crack 31-34,44 KIc 177,178 Kuc 177, 178 Kj-envelope 216
Laplacian operator 206 Lifetime 78, 148, 188,251 Lifetime prediction 94 Logarithmic creep 230 Logarithmic strain hypothesis 169
Magnesia 55 Martensitic transformation 63, 69 Maximum likelihood method 91, 143 Maximum nonnal stress criterion 45 Maximum principal stress 168 MgAIP4
Compressive strength 134 MgO
Application 6
Density 15
296 Subject Index
Elastic constants 16, 17 Electric conductivity 13 Fracture toughness 55 R-curve 55 Specific heat 14 Thermal conductivity 12 Thermal expansion coefficient 10 Thermal shock parameters 219
Microcrack zone 63 Minimum lifetime 161 Minimum strain energy density 46 Mixed-mode criteria 45-49 Mixed-mode loading 41,45, 197 Mixed-mode toughness 41-47 Mode-II fracture toughness 40 Modified principal stress hypothesis 169 Mohr's hypothesis 169,174,179,197 Monkman-Grant relation 251 MoSi2 4, 10-16 Mullite 4,11,13-15 Multiaxiality criteria
Global 167-171 Local 171-188
Multiaxiality diagram 168 Multiple crack growth 215 Multiple flaw population 152
Neutron diffractometry 249 Non-coplanar energy release rate 46 Non-symmetric creep 242,246-249 Norton creep law 231 Notch radius 26, 39
Oblique crack 40, 287 Overload 163 Oxidation 250 Oxide ceramics 3
Palmqvist cracks 36 Periodical loading 80 Phase transformation
Plasticity 269-271 R-Curve 69 Shielding 69 Time dependence 275 Zone 63,69,122
Physical properties 9-17 Piezoelectric ceramics 271 Plasticity 265-277 Poisson distribution 139, 184 Poisson's ratio 16 Polar axis 168 Polarization 271 Porcelain 111 Pores
Cylindric 171 Ellipsoidal 175 Spherical 173
Porosity Elastic properties 17 Thermal shock 212,218
Potential barriers 104 Primary creep 229,242 Principal stresses 167 Process zone 63 Proof test 159-164 PSZ 116,120
Quartz 10
RBSiC 4 RBSN 4,15 RCT specimen 71, 281 R-curve 23,96, 154
Calculation 66, 69 Effect on lifetimes 100 Effect on scatter 154-157 Effect on strength 64 Effect on thermal shock 216 Measurement 57
Residual stress 37, 248 Ring-on-ring test 168, 189 R-ratio 115 RSiC 4,15
Sauter-Kuhn hypothesis 169-171 Scatter
Crack size 137-141 Lifetime 148-151 Strength 137-148
Secondary creep 228,231,242 Shear-dilatant criterion 270 Shear insensitive criterion 188, 198

Shielding stress intensity factor 69, 122
Short bar 29,30 Short rod 29,30
SiC Application 5 Compressive strength 134, 135 Density 15 Elastic constants 16 Electric conductivity 13 Fracture toughness 53 Nomenclature 4 R-curve 53 Specific heat 14 Thermal conductivity 12 Thermal expansion coefficient 10 Thermal shock 212,219
Si02 241
Si)N4 Application 7 Compressive strength 134, 135 Crack size of Knoop cracks 33 Creep 230 Density 15 Dynamic bending test 88, 96 Elastic constants 16, 17 Electric conductivity 13 Fatigue 115-117,120 Fracture toughness 38, 48 High temperature fatigue 117, 121 Indentation cracks 33 Nomenclature 4 R-curve 53, 54 Specific heat 14 Thermal conductivity 12 Thermal expansion coefficient 10
SiSiC Creep 234 Density 15 Fracture toughness 38 Thermal shock parameters 219
Size effect 145 Strength 145-148 Lifetime 151 Thermal shock 219-222
Specific heat 14
Subject Index 297
Spherical pore 173, 174 Spinel 4 SSN 4, 15
Static loading 79 Statistical analysis 137-157,181-188 Strain energy density 46, 254 Strain hardening rule 235 Strength
Bending 126-129 Compression 132-135 R-curve 65 Scatter 137 Tension 125
Stress amplitude 109 Stress intensity factor 20, 53, 176, 213 Stress ratio 109 Stress redistribution in bending 245,
253 Stress singularity 132 Subcritical crack growth 77-106
High temperature failure 249-253 Proof test 161-163 Thermal fatigue 222
Surface energy 21, 56
Tangent condition 65 Temperature distribution 209 Tensile creep 228 Tensile strength 125 Tensile test 125 Tertiary creep 228 Thermal activation 104 Thermal conductivity 11, 206 Thermal expansion 204 Thermal expansion coefficient 9, 11 Thermal fatigue 222-225 Thermal shock 203-222
Critical temperature difference 211, 212,214 Experimental method 211 Fracture mechanics description 213 R,-parameters 217 Sensivity 211,217
Thermal strains 204 Thermal stresses 204,209,217 Th02

298 Subject Index
Compressive strength 134 Threshold value 77 TiB2 10-16
Compressive strength 134 TiC 10, 12, 13
Compressive strength 134 Time hardening rule 234 TiN 10-16
Compressive strength 134 Ti02 197 Torsion 168 Triaxial stress states 196, 198 Tubes 195
UOz Compressive strength 134
Vickers indentation 34-37 v-K-curve 77 von Mises criterion 167
WC 10-16 Compressive strength 134 Electrical conductivity 13 Thermal conductivity 12 Thermal expansion 10
Weibull Diagram 144
Distribution 114, 141, 159 Modulus 143 Parameters 91, 143, 185
Weight function 213,279-284 Work-of-fracture 56
Young's modulus 16
Zerodur 11 ZnSe 10-14 ZrBz 134 zr02
Application 5 Compressive strength 135 Density 15 Elastic constants 16 Electric conductivity 13 Fatigue 116, 120, 123 Fracture toughness 38, 48, 49 Nomenclature 4 R-curve 54,57,71 Specific heat 14 Thermal conductivity 12 Thermal expansion coefficient 10 Thermal shock 219,220

Springer Series in Materials Science
Editors: R. Hull· R. M. Osgood, Jr. . H. Sakaki . A. Zunger
Chemical Processing with Lasers* By D. Bauerle
2 Laser-Beam Interactions with Materials Physical Plinciples and Applications By M. von Allmen and A. Blatter 2nd Edition
3 Laser Processing of Thin Films and Microstructures Oxidation, Deposition and Etching of Insulators By. I. W. Boyd
4 Microclusters Editors: S. Sugano, Y. Nishina, and S. Ohnishi
S Graphite Fibers and Filaments By M. S. Dresselhaus, G. Dresselhaus, K. Sugihara, I. L. Spain, and H. A. Goldberg
6 Elemental and Molecular Clusters Editors: G. Benedek, T. P. Mallin, and G. Pacchioni
7 Molecular Beam Epitaxy Fundamentals and Current Status By M. A. Herman and H. Sitter 2nd Edition
8 Physical Chemistry of, in and on Silicon By G. F. Cerofolini and L. Meda
9 Tritium and Helium-3 in Metals By R. Lasser
10 Computer Simulation of Ion-Solid Interactions By W. Eckstein
II Mechanisms of High Temperature Superconductivity Editors: H. Kamimura and A. Oshiyama
12 Dislocation Dynamics and Plasticity By T. Suzuki, S. Takeuchi, and H. Yoshinaga
13 Semiconductor Silicon Materials Science and Technology Editors: G. Harbeke and M. J. Schulz
14 Graphite Intercalation Compounds I Structure and Dynamics Editors: H. Zabel and S. A. Solin
I S Crystal Chemistry of High-Tc Superconducting Copper Oxides By B. Raveau, C. Michel, M. Hervieu, and D. Groult
16 Hydrogen in Semiconductors By S. J. Pearton, M. Stavola, and J. W. Corbett
17 Ordering at Surfaces and Interfaces Editors: A. Yoshimori, T. Shinjo, and H. Watanabe
18 Graphite Intercalation Compounds II Editors: S. A. Solin and H. Zabel
19 Laser-Assisted Microtcchnology By S. M. Metev and V. P. Veiko 2nd Edition
20 Microcluster Physics By S. Sugano and H. Koizumi 2nd Edition
21 The Metal-Hydrogen System By Y. Fukai
22 Ion Implantation in Diamond, Graphite and Related Materials By M. S. Dresselhaus and R. Kalish
23 The Real Structure of High-Tc Superconductors Editor: V. Sh. Shekhtman
24 Metal Impurities in Silicon-Device Fabrication By K. Graff
2S Optical Properties of Metal Clusters By U. Kreibig and M. Vollmer
" The 2nd edition is available as a textbook with the title: Laser Processing and ChemisTry