APPENDIX A - Ski-Shore Stacking Construction Specifications: INTRODUCTION • The rock stacking...
45
APPENDIX A
-
Upload
trinhthien -
Category
Documents
-
view
221 -
download
0
Transcript of APPENDIX A - Ski-Shore Stacking Construction Specifications: INTRODUCTION • The rock stacking...

APPENDIX A


Rock Stacking Construction Specifications: INTRODUCTION
• The rock stacking guidelines provided include installation of the rock facing, geotextile fabric and backfill material.
• Design and construction information is based on laboratory information, site geometry and the engineering analysis performed as part of the scope of work for this project.
MATERIALS
• Retained soils are to consist of in-situ decomposed bedrock soils. • Drainage gravel and geotextile fabric shall consist of ¾ to 2-inch clean, poorly
graded gravel with less than 5% passing the No. 200 sieve wrapped in non-woven geotextile fabric.
• Geotextile fabric should consists of a 6-oz. non-woven material such as Propex 601 or equivalent.
• Rock Boulders to be used as facing should be durable angular particles with a minimum nominal diameter of 1.5-feet. Rock sizes should be in accordance with design drawings.
INSTALLATION
• Rocks should be stacked in general accordance with the Associated Rockery Contractors (ARC) Rockery Construction Guidelines (Plate A-6), summarized as follows:
o Rocks should be placed so that there are no continuous joint planes in
either the vertical or lateral direction. o Wherever possible, each rock should bear on at least two rocks below it. o The upper plane of each rock between courses (the top surface of rock),
should slope back towards the slope face and away from the face of the rock wall.
• Rock facing should be stacked at a maximum steepness of ½ horizontal to 1
vertical for all rock slopes greater than 6-feet in height. Rock faced slopes less than 6-feet may be stacked steeper upon approval from the Geotechnical Engineer and if ARC guidelines are followed.
• Bottom row of rocks should be buried (keyed in) a minimum depth of 1 foot for rockeries less than 10 feet tall. Rockeries exceeding 10 feet in height should be buried a minimum of 1.5 feet.
• Rock wall should be inspected at regular intervals by Geotechnical Engineer to accommodate final inspection and acceptance letter.
Plate
A-7

APPENDIX B

0 20 40 60 80 100 120 1400
20
40
60
80
01304-001 NorthStar Community Rockery No. 1 Static StabilityX:\OFFICE\PROJECTS\01304-~Z\001-NO~V\ENGINE~Q\GSTABLE\WALL1S.PL2 Run By: DWH 7/17/2009 10:41AM
11 2
3
3
1
1
2
2
2
2
bcd
efg
hi ja
# FSa 2.84b 3.01c 3.04d 3.04e 3.05f 3.09g 3.10h 3.11i 3.12j 3.12
SoilDesc.
NativeBedRockRockery
SoilTypeNo.123
TotalUnit Wt.
(pcf)130.0150.0150.0
SaturatedUnit Wt.
(pcf)0.0
150.0150.0
CohesionIntercept
(psf)450.0812.0Aniso
FrictionAngle(deg)17.048.0Aniso
Piez.Surface
No.000
GSTABL7 v.2 FSmin=2.84Safety Factors Are Calculated By The Modified Bishop Method

X:\OFFICE\PROJECTS\01304-~Z\001-NO~V\ENGINE~Q\GSTABLE\WALL1S.OUT Page 1
*** GSTABL7 *** ** GSTABL7 by Garry H. Gregory, P.E. ** ** Original Version 1.0, January 1996; Current Version 2.002, December 2001 ** (All Rights Reserved-Unauthorized Use Prohibited) ********************************************************************************* SLOPE STABILITY ANALYSIS SYSTEM Modified Bishop, Simplified Janbu, or GLE Method of Slices. (Includes Spencer & Morgenstern-Price Type Analysis) Including Pier/Pile, Reinforcement, Soil Nail, Tieback, Nonlinear Undrained Shear Strength, Curved Phi Envelope, Anisotropic Soil, Fiber-Reinforced Soil, Boundary Loads, Water Surfaces, Pseudo-Static Earthquake, and Applied Force Options. ********************************************************************************* Analysis Run Date: 7/17/2009 Time of Run: 10:41AM Run By: DWH Input Data Filename: X:WALL1S. Output Filename: X:WALL1S.OUT Unit System: English Plotted Output Filename: X:WALL1S.PLT PROBLEM DESCRIPTION: 01304-001 NorthStar Community Rockery No. 1 Static Stability BOUNDARY COORDINATES 7 Top Boundaries 11 Total Boundaries Boundary X-Left Y-Left X-Right Y-Right Soil Type No. (ft) (ft) (ft) (ft) Below Bnd 1 0.00 20.00 40.00 20.00 1 2 40.00 20.00 55.00 22.50 1 3 55.00 22.50 58.00 22.50 2 4 58.00 22.50 65.50 37.50 3 5 65.50 37.50 67.00 37.50 3 6 67.00 37.50 97.00 55.50 1 7 97.00 55.50 137.00 63.50 1 8 10.00 0.00 55.00 22.50 2 9 58.00 22.50 62.00 21.50 2 10 62.00 21.50 67.00 37.50 2 11 67.00 37.50 137.00 50.00 2 Default Y-Origin = 0.00(ft) ISOTROPIC SOIL PARAMETERS 3 Type(s) of Soil Soil Total Saturated Cohesion Friction Pore Pressure Piez. Type Unit Wt. Unit Wt. Intercept Angle Pressure Constant Surface No. (pcf) (pcf) (psf) (deg) Param. (psf) No. 1 130.0 0.0 450.0 17.0 0.00 0.0 0 2 150.0 150.0 812.0 48.0 0.00 0.0 0 3 150.0 150.0 0.0 45.0 0.00 0.0 0 ANISOTROPIC STRENGTH PARAMETERS 1 soil type(s) Soil Type 3 Is Anisotropic Number Of Direction Ranges Specified = 3 Direction Counterclockwise Cohesion Friction Range Direction Limit Intercept Angle No. (deg) (psf) (deg) 1 -10.0 4000.00 0.00 2 10.0 0.00 45.00 3 90.0 4000.00 0.00 ANISOTROPIC SOIL NOTES: (1) An input value of 0.01 for C and/or Phi will cause Aniso C and/or Phi to be ignored in that range. (2) An input value of 0.02 for Phi will set both Phi and C equal to zero, with no water weight in the tension crack. (3) An input value of 0.03 for Phi will set both Phi and C equal to zero, with water weight in the tension crack. A Critical Failure Surface Searching Method, Using A Random Technique For Generating Circular Surfaces, Has Been Specified. 450 Trial Surfaces Have Been Generated. 10 Surface(s) Initiate(s) From Each Of 45 Points Equally Spaced Along The Ground Surface Between X = 30.00(ft) and X = 62.00(ft)

X:\OFFICE\PROJECTS\01304-~Z\001-NO~V\ENGINE~Q\GSTABLE\WALL1S.OUT Page 2
Each Surface Terminates Between X = 93.00(ft) and X = 120.00(ft) Unless Further Limitations Were Imposed, The Minimum Elevation At Which A Surface Extends Is Y = 0.00(ft) 5.00(ft) Line Segments Define Each Trial Failure Surface. Following Are Displayed The Ten Most Critical Of The Trial Failure Surfaces Evaluated. They Are Ordered - Most Critical First. * * Safety Factors Are Calculated By The Modified Bishop Method * * Total Number of Trial Surfaces Evaluated = 450 Statistical Data On All Valid FS Values: FS Max = 5.307 FS Min = 2.842 FS Ave = 3.745 Standard Deviation = 0.429 Coefficient of Variation = 11.44 % Failure Surface Specified By 13 Coordinate Points Point X-Surf Y-Surf No. (ft) (ft) 1 58.36 23.23 2 63.30 24.00 3 68.15 25.25 4 72.85 26.95 5 77.37 29.08 6 81.67 31.64 7 85.70 34.60 8 89.43 37.92 9 92.83 41.59 10 95.87 45.56 11 98.52 49.80 12 100.75 54.28 13 101.57 56.41 Circle Center At X = 52.69 ; Y = 75.42 ; and Radius = 52.50 Factor of Safety *** 2.842 *** Individual data on the 17 slices Water Water Tie Tie Earthquake Force Force Force Force Force Surcharge Slice Width Weight Top Bot Norm Tan Hor Ver Load No. (ft) (lbs) (lbs) (lbs) (lbs) (lbs) (lbs) (lbs) (lbs) 1 4.4 2665.7 0.0 0.0 0. 0. 0.0 0.0 0.0 2 0.5 706.3 0.0 0.0 0. 0. 0.0 0.0 0.0 3 2.2 3629.9 0.0 0.0 0. 0. 0.0 0.0 0.0 4 1.5 2866.4 0.0 0.0 0. 0. 0.0 0.0 0.0 5 1.1 2186.2 0.0 0.0 0. 0. 0.0 0.0 0.0 6 4.7 9386.6 0.0 0.0 0. 0. 0.0 0.0 0.0 7 4.5 9421.8 0.0 0.0 0. 0. 0.0 0.0 0.0 8 4.3 8987.2 0.0 0.0 0. 0. 0.0 0.0 0.0 9 4.0 8140.1 0.0 0.0 0. 0. 0.0 0.0 0.0 10 3.7 6960.2 0.0 0.0 0. 0. 0.0 0.0 0.0 11 3.4 5545.6 0.0 0.0 0. 0. 0.0 0.0 0.0 12 0.5 685.6 0.0 0.0 0. 0. 0.0 0.0 0.0 13 2.6 3398.8 0.0 0.0 0. 0. 0.0 0.0 0.0 14 1.1 1276.7 0.0 0.0 0. 0. 0.0 0.0 0.0 15 1.5 1392.7 0.0 0.0 0. 0. 0.0 0.0 0.0 16 2.2 1155.7 0.0 0.0 0. 0. 0.0 0.0 0.0 17 0.8 105.3 0.0 0.0 0. 0. 0.0 0.0 0.0 Failure Surface Specified By 13 Coordinate Points Point X-Surf Y-Surf No. (ft) (ft) 1 59.82 26.14 2 64.76 26.92 3 69.62 28.07 4 74.38 29.60 5 79.01 31.49 6 83.48 33.73 7 87.77 36.31 8 91.84 39.21 9 95.68 42.41 10 99.26 45.90 11 102.56 49.66 12 105.56 53.66 13 108.15 57.73

X:\OFFICE\PROJECTS\01304-~Z\001-NO~V\ENGINE~Q\GSTABLE\WALL1S.OUT Page 3
Circle Center At X = 52.17 ; Y = 90.62 ; and Radius = 64.93 Factor of Safety *** 3.009 *** Failure Surface Specified By 15 Coordinate Points Point X-Surf Y-Surf No. (ft) (ft) 1 59.09 24.68 2 64.03 25.45 3 68.92 26.52 4 73.72 27.89 5 78.44 29.55 6 83.05 31.50 7 87.52 33.72 8 91.86 36.22 9 96.03 38.98 10 100.02 41.98 11 103.83 45.23 12 107.42 48.70 13 110.80 52.39 14 113.94 56.28 15 116.11 59.32 Circle Center At X = 49.02 ; Y = 105.57 ; and Radius = 81.52 Factor of Safety *** 3.037 *** Failure Surface Specified By 17 Coordinate Points Point X-Surf Y-Surf No. (ft) (ft) 1 48.18 21.36 2 53.18 21.57 3 58.15 22.10 4 63.08 22.95 5 67.94 24.11 6 72.72 25.57 7 77.40 27.35 8 81.95 29.42 9 86.36 31.77 10 90.61 34.41 11 94.68 37.31 12 98.55 40.47 13 102.22 43.87 14 105.66 47.50 15 108.86 51.34 16 111.81 55.38 17 114.06 58.91 Circle Center At X = 47.44 ; Y = 99.27 ; and Radius = 77.91 Factor of Safety *** 3.044 *** Failure Surface Specified By 13 Coordinate Points Point X-Surf Y-Surf No. (ft) (ft) 1 54.00 22.33 2 59.00 22.39 3 63.96 23.04 4 68.81 24.27 5 73.48 26.05 6 77.91 28.37 7 82.03 31.20 8 85.80 34.49 9 89.15 38.19 10 92.05 42.27 11 94.44 46.66 12 96.31 51.30 13 97.47 55.59 Circle Center At X = 55.99 ; Y = 64.81 ; and Radius = 42.52 Factor of Safety *** 3.048 *** Failure Surface Specified By 12 Coordinate Points Point X-Surf Y-Surf No. (ft) (ft) 1 59.82 26.14

X:\OFFICE\PROJECTS\01304-~Z\001-NO~V\ENGINE~Q\GSTABLE\WALL1S.OUT Page 4
2 64.77 26.86 3 69.60 28.13 4 74.26 29.95 5 78.68 32.28 6 82.81 35.10 7 86.59 38.37 8 89.98 42.05 9 92.93 46.09 10 95.40 50.43 11 97.37 55.03 12 97.54 55.61 Circle Center At X = 56.00 ; Y = 69.89 ; and Radius = 43.92 Factor of Safety *** 3.094 *** Failure Surface Specified By 16 Coordinate Points Point X-Surf Y-Surf No. (ft) (ft) 1 50.36 21.73 2 55.36 21.57 3 60.35 21.85 4 65.30 22.57 5 70.17 23.71 6 74.92 25.28 7 79.51 27.25 8 83.92 29.62 9 88.10 32.36 10 92.02 35.46 11 95.66 38.89 12 98.99 42.62 13 101.97 46.63 14 104.60 50.89 15 106.84 55.36 16 107.75 57.65 Circle Center At X = 54.69 ; Y = 78.62 ; and Radius = 57.06 Factor of Safety *** 3.103 *** Failure Surface Specified By 18 Coordinate Points Point X-Surf Y-Surf No. (ft) (ft) 1 47.46 21.24 2 52.45 21.47 3 57.42 21.99 4 62.36 22.78 5 67.24 23.85 6 72.06 25.20 7 76.79 26.81 8 81.43 28.69 9 85.95 30.82 10 90.34 33.21 11 94.59 35.84 12 98.69 38.71 13 102.62 41.80 14 106.36 45.12 15 109.92 48.63 16 113.27 52.34 17 116.40 56.24 18 119.03 59.91 Circle Center At X = 45.85 ; Y = 109.80 ; and Radius = 88.58 Factor of Safety *** 3.112 *** Failure Surface Specified By 18 Coordinate Points Point X-Surf Y-Surf No. (ft) (ft) 1 48.91 21.48 2 53.91 21.55 3 58.89 21.95 4 63.84 22.67 5 68.73 23.72 6 73.54 25.08 7 78.25 26.76

X:\OFFICE\PROJECTS\01304-~Z\001-NO~V\ENGINE~Q\GSTABLE\WALL1S.OUT Page 5
8 82.84 28.74 9 87.29 31.02 10 91.58 33.58 11 95.70 36.42 12 99.62 39.53 13 103.33 42.88 14 106.81 46.47 15 110.04 50.28 16 113.02 54.30 17 115.73 58.50 18 116.20 59.34 Circle Center At X = 50.38 ; Y = 97.61 ; and Radius = 76.14 Factor of Safety *** 3.118 *** Failure Surface Specified By 18 Coordinate Points Point X-Surf Y-Surf No. (ft) (ft) 1 51.09 21.85 2 56.09 22.06 3 61.06 22.58 4 65.99 23.40 5 70.86 24.53 6 75.65 25.96 7 80.35 27.68 8 84.93 29.69 9 89.38 31.97 10 93.67 34.53 11 97.81 37.34 12 101.76 40.41 13 105.51 43.71 14 109.05 47.24 15 112.37 50.98 16 115.45 54.92 17 118.28 59.04 18 118.78 59.86 Circle Center At X = 50.19 ; Y = 102.72 ; and Radius = 80.88 Factor of Safety *** 3.122 *** **** END OF GSTABL7 OUTPUT ****

0 20 40 60 80 100 120 1400
20
40
60
80
01304-001 NorthStar Community Rockery No. 1 Psuedo-Static StabilityX:\OFFICE\PROJECTS\01304-~Z\001-NO~V\ENGINE~Q\GSTABLE\WALL1PS.PLT Run By: DWH 7/17/2009 10:44AM
11 2
3
3
1
1
2
2
2
2
SoilDesc.
NativeBedRockRockery
SoilTypeNo.123
TotalUnit Wt.
(pcf)130.0150.0150.0
SaturatedUnit Wt.
(pcf)0.0
150.0150.0
CohesionIntercept
(psf)450.0812.0Aniso
FrictionAngle(deg)17.048.0Aniso
Piez.Surface
No.000
Load ValueHoriz Eqk 0.090 g<
GSTABL7 v.2 FSmin=2.45Factor Of Safety Is Calculated By The Modified Bishop Method

X:\OFFICE\PROJECTS\01304-~Z\001-NO~V\ENGINE~Q\GSTABLE\WALL1PS.OUT Page 1
*** GSTABL7 *** ** GSTABL7 by Garry H. Gregory, P.E. ** ** Original Version 1.0, January 1996; Current Version 2.002, December 2001 ** (All Rights Reserved-Unauthorized Use Prohibited) ********************************************************************************* SLOPE STABILITY ANALYSIS SYSTEM Modified Bishop, Simplified Janbu, or GLE Method of Slices. (Includes Spencer & Morgenstern-Price Type Analysis) Including Pier/Pile, Reinforcement, Soil Nail, Tieback, Nonlinear Undrained Shear Strength, Curved Phi Envelope, Anisotropic Soil, Fiber-Reinforced Soil, Boundary Loads, Water Surfaces, Pseudo-Static Earthquake, and Applied Force Options. ********************************************************************************* Analysis Run Date: 7/17/2009 Time of Run: 10:44AM Run By: DWH Input Data Filename: X:WALL1PS. Output Filename: X:WALL1PS.OUT Unit System: English Plotted Output Filename: X:WALL1PS.PLT PROBLEM DESCRIPTION: 01304-001 NorthStar Community Rockery No. 1 Psuedo-Static Stability BOUNDARY COORDINATES 7 Top Boundaries 11 Total Boundaries Boundary X-Left Y-Left X-Right Y-Right Soil Type No. (ft) (ft) (ft) (ft) Below Bnd 1 0.00 20.00 40.00 20.00 1 2 40.00 20.00 55.00 22.50 1 3 55.00 22.50 58.00 22.50 2 4 58.00 22.50 65.50 37.50 3 5 65.50 37.50 67.00 37.50 3 6 67.00 37.50 97.00 55.50 1 7 97.00 55.50 137.00 63.50 1 8 10.00 0.00 55.00 22.50 2 9 58.00 22.50 62.00 21.50 2 10 62.00 21.50 67.00 37.50 2 11 67.00 37.50 137.00 50.00 2 Default Y-Origin = 0.00(ft) ISOTROPIC SOIL PARAMETERS 3 Type(s) of Soil Soil Total Saturated Cohesion Friction Pore Pressure Piez. Type Unit Wt. Unit Wt. Intercept Angle Pressure Constant Surface No. (pcf) (pcf) (psf) (deg) Param. (psf) No. 1 130.0 0.0 450.0 17.0 0.00 0.0 0 2 150.0 150.0 812.0 48.0 0.00 0.0 0 3 150.0 150.0 0.0 45.0 0.00 0.0 0 ANISOTROPIC STRENGTH PARAMETERS 1 soil type(s) Soil Type 3 Is Anisotropic Number Of Direction Ranges Specified = 3 Direction Counterclockwise Cohesion Friction Range Direction Limit Intercept Angle No. (deg) (psf) (deg) 1 -10.0 4000.00 0.00 2 10.0 0.00 45.00 3 90.0 4000.00 0.00 ANISOTROPIC SOIL NOTES: (1) An input value of 0.01 for C and/or Phi will cause Aniso C and/or Phi to be ignored in that range. (2) An input value of 0.02 for Phi will set both Phi and C equal to zero, with no water weight in the tension crack. (3) An input value of 0.03 for Phi will set both Phi and C equal to zero, with water weight in the tension crack. A Horizontal Earthquake Loading Coefficient Of0.090 Has Been Assigned A Vertical Earthquake Loading Coefficient Of0.000 Has Been Assigned Cavitation Pressure = 0.0(psf) Trial Failure Surface Specified By 13 Coordinate Points

X:\OFFICE\PROJECTS\01304-~Z\001-NO~V\ENGINE~Q\GSTABLE\WALL1PS.OUT Page 2
Point X-Surf Y-Surf No. (ft) (ft) 1 58.36 23.22 2 63.30 24.00 3 68.15 25.25 4 72.85 26.95 5 77.37 29.08 6 81.67 31.64 7 85.70 34.60 8 89.43 37.92 9 92.83 41.59 10 95.87 45.56 11 98.52 49.80 12 100.75 54.28 13 101.57 56.41 Circle Center At X = 52.67 ; Y = 75.44; and Radius = 52.52 * * Factor Of Safety Is Calculated By The Modified Bishop Method * * Factor Of Safety For The Preceding Specified Surface = 2.452 ***Table 1 - Individual Data on the 17 Slices*** Water Water Tie Tie Earthquake Force Force Force Force Force Surcharge Slice Width Weight Top Bot Norm Tan Hor Ver Load No. (ft) (lbs) (lbs) (lbs) (lbs) (lbs) (lbs) (lbs) (lbs) 1 4.4 2667.8 0.0 0.0 0.0 0.0 240.1 0.0 0.0 2 0.5 703.7 0.0 0.0 0.0 0.0 63.3 0.0 0.0 3 2.2 3635.4 0.0 0.0 0.0 0.0 327.2 0.0 0.0 4 1.5 2866.4 0.0 0.0 0.0 0.0 258.0 0.0 0.0 5 1.2 2192.6 0.0 0.0 0.0 0.0 197.3 0.0 0.0 6 4.7 9378.9 0.0 0.0 0.0 0.0 844.1 0.0 0.0 7 4.5 9421.0 0.0 0.0 0.0 0.0 847.9 0.0 0.0 8 4.3 8996.8 0.0 0.0 0.0 0.0 809.7 0.0 0.0 9 4.0 8132.6 0.0 0.0 0.0 0.0 731.9 0.0 0.0 10 3.7 6950.9 0.0 0.0 0.0 0.0 625.6 0.0 0.0 11 3.4 5542.2 0.0 0.0 0.0 0.0 498.8 0.0 0.0 12 0.5 679.9 0.0 0.0 0.0 0.0 61.2 0.0 0.0 13 2.6 3406.9 0.0 0.0 0.0 0.0 306.6 0.0 0.0 14 1.1 1277.6 0.0 0.0 0.0 0.0 115.0 0.0 0.0 15 1.5 1396.6 0.0 0.0 0.0 0.0 125.7 0.0 0.0 16 2.2 1155.8 0.0 0.0 0.0 0.0 104.0 0.0 0.0 17 0.8 105.0 0.0 0.0 0.0 0.0 9.4 0.0 0.0 ***Table 2 - Base Stress Data on the 17 Slices*** Slice Alpha X-Coord. Base Available Mobilized No. (deg) Slice Cntr Leng. Shear Strength Shear Stress * (ft) (ft) (psf) (psf) 1 8.97 60.56 4.45 570.39 94.27 2 8.97 63.03 0.55 2094.49 204.64 3 14.45 64.40 2.27 2370.57 400.82 4 14.45 66.25 1.55 2627.64 463.97 5 14.45 67.57 1.19 2623.34 463.57 6 19.89 70.50 5.00 2602.02 638.93 7 25.23 75.11 5.00 2576.92 804.38 8 30.77 79.52 5.00 2469.82 920.33 9 36.30 83.68 5.00 2291.15 963.47 10 41.67 87.57 4.99 2053.80 926.14 11 47.19 91.13 5.00 1761.38 813.32 12 52.56 93.06 0.76 1534.04 712.46 13 52.56 94.58 4.24 734.66 639.05 14 57.99 96.43 2.13 663.35 509.69 15 57.99 97.76 2.87 609.37 414.11 16 63.54 99.63 5.00 486.60 207.43 17 68.98 101.16 2.29 369.33 44.32 Sum of the Resisting Forces (including Pier/Pile, Tieback, Reinforcing Soil Nail, and Applied Forces if applicable) = 95740.19 (lbs) Average Available Shear Strength (including Tieback, Pier/Pile, Reinforcing, Soil Nail, and Applied Forces if applicable) = 1670.97(psf) Sum of the Driving Forces = 39038.76 (lbs) Average Mobilized Shear Stress = 681.35(psf) Total length of the failure surface = 57.30(ft) CAUTION - Factor Of Safety Is Calculated By The Modified Bishop Method. This Method Is Valid Only If The Failure Surface

X:\OFFICE\PROJECTS\01304-~Z\001-NO~V\ENGINE~Q\GSTABLE\WALL1PS.OUT Page 3
Approximates A Circular Arc. **** END OF GSTABL7 OUTPUT ****

0 10 20 30 40 50 60 700
10
20
30
40
01304-001 NorthStar Community Rockery No. 3 - StaticX:\OFFICE\PROJECTS\01304-~Z\001-NO~V\ENGINE~Q\GSTABLE\ROCK3-S.PL2 Run By: DWH 7/17/2009 10:53AM
1
2
2
1
1
1
1
bcde
fg hija
# FSa 2.82b 2.82c 2.82d 2.83e 2.83f 2.84g 2.85h 2.85i 2.85j 2.86
SoilDesc.
NativeROCKERY
SoilTypeNo.12
TotalUnit Wt.
(pcf)130.0135.0
SaturatedUnit Wt.
(pcf)0.0
135.0
CohesionIntercept
(psf)450.0Aniso
FrictionAngle(deg)17.0Aniso
Piez.Surface
No.00
GSTABL7 v.2 FSmin=2.82Safety Factors Are Calculated By The Modified Bishop Method

X:\OFFICE\PROJECTS\01304-~Z\001-NO~V\ENGINE~Q\GSTABLE\ROCK3-S.OUT Page 1
*** GSTABL7 *** ** GSTABL7 by Garry H. Gregory, P.E. ** ** Original Version 1.0, January 1996; Current Version 2.002, December 2001 ** (All Rights Reserved-Unauthorized Use Prohibited) ********************************************************************************* SLOPE STABILITY ANALYSIS SYSTEM Modified Bishop, Simplified Janbu, or GLE Method of Slices. (Includes Spencer & Morgenstern-Price Type Analysis) Including Pier/Pile, Reinforcement, Soil Nail, Tieback, Nonlinear Undrained Shear Strength, Curved Phi Envelope, Anisotropic Soil, Fiber-Reinforced Soil, Boundary Loads, Water Surfaces, Pseudo-Static Earthquake, and Applied Force Options. ********************************************************************************* Analysis Run Date: 7/17/2009 Time of Run: 10:53AM Run By: DWH Input Data Filename: X:ROCK3-S. Output Filename: X:ROCK3-S.OUT Unit System: English Plotted Output Filename: X:ROCK3-S.PLT PROBLEM DESCRIPTION: 01304-001 NorthStar Community Rockery No. 3 - Static BOUNDARY COORDINATES 5 Top Boundaries 7 Total Boundaries Boundary X-Left Y-Left X-Right Y-Right Soil Type No. (ft) (ft) (ft) (ft) Below Bnd 1 0.00 20.00 20.00 20.00 1 2 20.00 20.00 23.00 26.50 2 3 23.00 26.50 24.50 26.50 2 4 24.50 26.50 48.00 34.00 1 5 48.00 34.00 68.00 36.00 1 6 20.00 20.00 23.00 19.00 1 7 23.00 19.00 24.50 26.50 1 Default Y-Origin = 0.00(ft) ISOTROPIC SOIL PARAMETERS 2 Type(s) of Soil Soil Total Saturated Cohesion Friction Pore Pressure Piez. Type Unit Wt. Unit Wt. Intercept Angle Pressure Constant Surface No. (pcf) (pcf) (psf) (deg) Param. (psf) No. 1 130.0 0.0 450.0 17.0 0.00 0.0 0 2 135.0 135.0 0.0 0.0 0.00 0.0 0 ANISOTROPIC STRENGTH PARAMETERS 1 soil type(s) Soil Type 2 Is Anisotropic Number Of Direction Ranges Specified = 3 Direction Counterclockwise Cohesion Friction Range Direction Limit Intercept Angle No. (deg) (psf) (deg) 1 -10.0 2000.00 0.00 2 10.0 0.00 45.00 3 90.0 2000.00 0.00 ANISOTROPIC SOIL NOTES: (1) An input value of 0.01 for C and/or Phi will cause Aniso C and/or Phi to be ignored in that range. (2) An input value of 0.02 for Phi will set both Phi and C equal to zero, with no water weight in the tension crack. (3) An input value of 0.03 for Phi will set both Phi and C equal to zero, with water weight in the tension crack. A Critical Failure Surface Searching Method, Using A Random Technique For Generating Circular Surfaces, Has Been Specified. 400 Trial Surfaces Have Been Generated. 20 Surface(s) Initiate(s) From Each Of 20 Points Equally Spaced Along The Ground Surface Between X = 0.00(ft) and X = 23.00(ft) Each Surface Terminates Between X = 30.00(ft) and X = 68.00(ft) Unless Further Limitations Were Imposed, The Minimum Elevation At Which A Surface Extends Is Y = 0.00(ft) 4.00(ft) Line Segments Define Each Trial Failure Surface.

X:\OFFICE\PROJECTS\01304-~Z\001-NO~V\ENGINE~Q\GSTABLE\ROCK3-S.OUT Page 2
Following Are Displayed The Ten Most Critical Of The Trial Failure Surfaces Evaluated. They Are Ordered - Most Critical First. * * Safety Factors Are Calculated By The Modified Bishop Method * * Total Number of Trial Surfaces Evaluated = 400 Statistical Data On All Valid FS Values: FS Max = 23.003 FS Min = 2.815 FS Ave = 3.899 Standard Deviation = 2.055 Coefficient of Variation = 52.70 % Failure Surface Specified By 15 Coordinate Points Point X-Surf Y-Surf No. (ft) (ft) 1 10.90 20.00 2 14.58 18.45 3 18.43 17.35 4 22.38 16.71 5 26.37 16.54 6 30.36 16.85 7 34.28 17.63 8 38.09 18.88 9 41.71 20.56 10 45.12 22.66 11 48.24 25.16 12 51.05 28.00 13 53.51 31.16 14 55.57 34.59 15 55.64 34.76 Circle Center At X = 25.76 ; Y = 50.16 ; and Radius = 33.63 Factor of Safety *** 2.815 *** Individual data on the 18 slices Water Water Tie Tie Earthquake Force Force Force Force Force Surcharge Slice Width Weight Top Bot Norm Tan Hor Ver Load No. (ft) (lbs) (lbs) (lbs) (lbs) (lbs) (lbs) (lbs) (lbs) 1 3.7 371.8 0.0 0.0 0. 0. 0.0 0.0 0.0 2 3.8 1051.2 0.0 0.0 0. 0. 0.0 0.0 0.0 3 1.6 568.9 0.0 0.0 0. 0. 0.0 0.0 0.0 4 2.4 1787.8 0.0 0.0 0. 0. 0.0 0.0 0.0 5 0.6 762.0 0.0 0.0 0. 0. 0.0 0.0 0.0 6 1.5 1948.9 0.0 0.0 0. 0. 0.0 0.0 0.0 7 1.9 2487.1 0.0 0.0 0. 0. 0.0 0.0 0.0 8 4.0 5721.9 0.0 0.0 0. 0. 0.0 0.0 0.0 9 3.9 5993.8 0.0 0.0 0. 0. 0.0 0.0 0.0 10 3.8 5918.7 0.0 0.0 0. 0. 0.0 0.0 0.0 11 3.6 5516.3 0.0 0.0 0. 0. 0.0 0.0 0.0 12 3.4 4831.5 0.0 0.0 0. 0. 0.0 0.0 0.0 13 2.9 3647.3 0.0 0.0 0. 0. 0.0 0.0 0.0 14 0.2 283.7 0.0 0.0 0. 0. 0.0 0.0 0.0 15 2.8 2770.9 0.0 0.0 0. 0. 0.0 0.0 0.0 16 2.5 1544.5 0.0 0.0 0. 0. 0.0 0.0 0.0 17 2.1 475.5 0.0 0.0 0. 0. 0.0 0.0 0.0 18 0.1 0.8 0.0 0.0 0. 0. 0.0 0.0 0.0 Failure Surface Specified By 14 Coordinate Points Point X-Surf Y-Surf No. (ft) (ft) 1 13.32 20.00 2 16.98 18.40 3 20.82 17.26 4 24.76 16.61 5 28.76 16.46 6 32.75 16.81 7 36.66 17.64 8 40.43 18.96 9 44.02 20.74 10 47.35 22.95 11 50.39 25.55 12 53.08 28.51 13 55.37 31.79 14 57.03 34.90 Circle Center At X = 27.99 ; Y = 48.52 ; and Radius = 32.08

X:\OFFICE\PROJECTS\01304-~Z\001-NO~V\ENGINE~Q\GSTABLE\ROCK3-S.OUT Page 3
Factor of Safety *** 2.821 *** Failure Surface Specified By 14 Coordinate Points Point X-Surf Y-Surf No. (ft) (ft) 1 13.32 20.00 2 17.07 18.62 3 20.97 17.72 4 24.95 17.33 5 28.95 17.43 6 32.90 18.04 7 36.75 19.15 8 40.42 20.72 9 43.87 22.75 10 47.03 25.20 11 49.87 28.02 12 52.32 31.18 13 54.36 34.63 14 54.36 34.64 Circle Center At X = 26.11 ; Y = 49.00 ; and Radius = 31.70 Factor of Safety *** 2.824 *** Failure Surface Specified By 15 Coordinate Points Point X-Surf Y-Surf No. (ft) (ft) 1 10.90 20.00 2 14.61 18.51 3 18.46 17.42 4 22.40 16.75 5 26.39 16.49 6 30.39 16.65 7 34.34 17.24 8 38.22 18.23 9 41.97 19.63 10 45.54 21.42 11 48.92 23.57 12 52.04 26.07 13 54.88 28.88 14 57.42 31.98 15 59.50 35.15 Circle Center At X = 26.84 ; Y = 54.41 ; and Radius = 37.92 Factor of Safety *** 2.827 *** Failure Surface Specified By 16 Coordinate Points Point X-Surf Y-Surf No. (ft) (ft) 1 7.26 20.00 2 10.64 17.86 3 14.27 16.16 4 18.08 14.95 5 22.01 14.22 6 26.00 14.01 7 29.99 14.30 8 33.91 15.10 9 37.70 16.40 10 41.29 18.16 11 44.62 20.37 12 47.65 22.98 13 50.32 25.96 14 52.59 29.26 15 54.42 32.81 16 55.11 34.71 Circle Center At X = 25.68 ; Y = 45.26 ; and Radius = 31.26 Factor of Safety *** 2.828 *** Failure Surface Specified By 16 Coordinate Points Point X-Surf Y-Surf No. (ft) (ft) 1 10.90 20.00 2 14.64 18.61

X:\OFFICE\PROJECTS\01304-~Z\001-NO~V\ENGINE~Q\GSTABLE\ROCK3-S.OUT Page 4
3 18.51 17.59 4 22.47 16.97 5 26.46 16.75 6 30.46 16.93 7 34.41 17.50 8 38.29 18.47 9 42.06 19.82 10 45.67 21.54 11 49.09 23.61 12 52.29 26.02 13 55.23 28.73 14 57.88 31.72 15 60.22 34.97 16 60.38 35.24 Circle Center At X = 26.69 ; Y = 56.69 ; and Radius = 39.94 Factor of Safety *** 2.843 *** Failure Surface Specified By 18 Coordinate Points Point X-Surf Y-Surf No. (ft) (ft) 1 3.63 20.00 2 7.00 17.84 3 10.58 16.06 4 14.34 14.68 5 18.22 13.72 6 22.18 13.18 7 26.18 13.08 8 30.17 13.41 9 34.09 14.17 10 37.91 15.36 11 41.58 16.96 12 45.05 18.94 13 48.29 21.29 14 51.25 23.98 15 53.90 26.98 16 56.21 30.24 17 58.16 33.74 18 58.72 35.07 Circle Center At X = 25.10 ; Y = 49.72 ; and Radius = 36.67 Factor of Safety *** 2.845 *** Failure Surface Specified By 19 Coordinate Points Point X-Surf Y-Surf No. (ft) (ft) 1 3.63 20.00 2 7.01 17.86 3 10.59 16.06 4 14.32 14.64 5 18.18 13.60 6 22.13 12.95 7 26.12 12.69 8 30.12 12.84 9 34.08 13.40 10 37.97 14.34 11 41.74 15.67 12 45.36 17.37 13 48.79 19.43 14 52.00 21.82 15 54.95 24.52 16 57.61 27.50 17 59.97 30.74 18 61.98 34.19 19 62.56 35.46 Circle Center At X = 26.63 ; Y = 52.51 ; and Radius = 39.82 Factor of Safety *** 2.848 *** Failure Surface Specified By 13 Coordinate Points Point X-Surf Y-Surf No. (ft) (ft) 1 15.74 20.00

X:\OFFICE\PROJECTS\01304-~Z\001-NO~V\ENGINE~Q\GSTABLE\ROCK3-S.OUT Page 5
2 19.60 18.97 3 23.56 18.40 4 27.56 18.30 5 31.54 18.67 6 35.46 19.51 7 39.24 20.80 8 42.85 22.52 9 46.23 24.66 10 49.34 27.18 11 52.13 30.05 12 54.56 33.22 13 55.47 34.75 Circle Center At X = 26.40 ; Y = 52.30 ; and Radius = 34.01 Factor of Safety *** 2.853 *** Failure Surface Specified By 18 Coordinate Points Point X-Surf Y-Surf No. (ft) (ft) 1 7.26 20.00 2 10.92 18.37 3 14.70 17.08 4 18.59 16.13 5 22.55 15.54 6 26.54 15.31 7 30.54 15.44 8 34.51 15.93 9 38.42 16.78 10 42.23 17.97 11 45.93 19.51 12 49.47 21.37 13 52.82 23.55 14 55.97 26.02 15 58.88 28.76 16 61.53 31.75 17 63.91 34.97 18 64.30 35.63 Circle Center At X = 27.09 ; Y = 59.52 ; and Radius = 44.22 Factor of Safety *** 2.856 *** **** END OF GSTABL7 OUTPUT ****

0 10 20 30 40 50 60 700
10
20
30
40
01304-001 NorthStar Community Rockery No. 3 - Pseudo-StaticX:\OFFICE\PROJECTS\01304-~Z\001-NO~V\ENGINE~Q\GSTABLE\ROCK3-PS.PLT Run By: DWH 7/17/2009 10:59AM
1
2
2
1
1
1
1
SoilDesc.
NativeROCKERY
SoilTypeNo.12
TotalUnit Wt.
(pcf)130.0135.0
SaturatedUnit Wt.
(pcf)0.0
135.0
CohesionIntercept
(psf)450.0Aniso
FrictionAngle(deg)17.0Aniso
Piez.Surface
No.00
Load ValueHoriz Eqk 0.090 g<
GSTABL7 v.2 FSmin=2.26Factor Of Safety Is Calculated By The Modified Bishop Method

X:\OFFICE\PROJECTS\01304-~Z\001-NO~V\ENGINE~Q\GSTABLE\ROCK3-PS.OUT Page 1
*** GSTABL7 *** ** GSTABL7 by Garry H. Gregory, P.E. ** ** Original Version 1.0, January 1996; Current Version 2.002, December 2001 ** (All Rights Reserved-Unauthorized Use Prohibited) ********************************************************************************* SLOPE STABILITY ANALYSIS SYSTEM Modified Bishop, Simplified Janbu, or GLE Method of Slices. (Includes Spencer & Morgenstern-Price Type Analysis) Including Pier/Pile, Reinforcement, Soil Nail, Tieback, Nonlinear Undrained Shear Strength, Curved Phi Envelope, Anisotropic Soil, Fiber-Reinforced Soil, Boundary Loads, Water Surfaces, Pseudo-Static Earthquake, and Applied Force Options. ********************************************************************************* Analysis Run Date: 7/17/2009 Time of Run: 10:59AM Run By: DWH Input Data Filename: X:ROCK3-PS. Output Filename: X:ROCK3-PS.OUT Unit System: English Plotted Output Filename: X:ROCK3-PS.PLT PROBLEM DESCRIPTION: 01304-001 NorthStar Community Rockery No. 3 - Pseudo-Static BOUNDARY COORDINATES 5 Top Boundaries 7 Total Boundaries Boundary X-Left Y-Left X-Right Y-Right Soil Type No. (ft) (ft) (ft) (ft) Below Bnd 1 0.00 20.00 20.00 20.00 1 2 20.00 20.00 23.00 26.50 2 3 23.00 26.50 24.50 26.50 2 4 24.50 26.50 48.00 34.00 1 5 48.00 34.00 68.00 36.00 1 6 20.00 20.00 23.00 19.00 1 7 23.00 19.00 24.50 26.50 1 Default Y-Origin = 0.00(ft) ISOTROPIC SOIL PARAMETERS 2 Type(s) of Soil Soil Total Saturated Cohesion Friction Pore Pressure Piez. Type Unit Wt. Unit Wt. Intercept Angle Pressure Constant Surface No. (pcf) (pcf) (psf) (deg) Param. (psf) No. 1 130.0 0.0 450.0 17.0 0.00 0.0 0 2 135.0 135.0 0.0 0.0 0.00 0.0 0 ANISOTROPIC STRENGTH PARAMETERS 1 soil type(s) Soil Type 2 Is Anisotropic Number Of Direction Ranges Specified = 3 Direction Counterclockwise Cohesion Friction Range Direction Limit Intercept Angle No. (deg) (psf) (deg) 1 -10.0 2000.00 0.00 2 10.0 0.00 45.00 3 90.0 2000.00 0.00 ANISOTROPIC SOIL NOTES: (1) An input value of 0.01 for C and/or Phi will cause Aniso C and/or Phi to be ignored in that range. (2) An input value of 0.02 for Phi will set both Phi and C equal to zero, with no water weight in the tension crack. (3) An input value of 0.03 for Phi will set both Phi and C equal to zero, with water weight in the tension crack. A Horizontal Earthquake Loading Coefficient Of0.090 Has Been Assigned A Vertical Earthquake Loading Coefficient Of0.000 Has Been Assigned Cavitation Pressure = 0.0(psf) Trial Failure Surface Specified By 15 Coordinate Points Point X-Surf Y-Surf No. (ft) (ft) 1 10.90 20.00 2 14.58 18.45 3 18.43 17.35

X:\OFFICE\PROJECTS\01304-~Z\001-NO~V\ENGINE~Q\GSTABLE\ROCK3-PS.OUT Page 2
4 22.38 16.71 5 26.37 16.54 6 30.36 16.85 7 34.28 17.63 8 38.09 18.88 9 41.71 20.56 10 45.12 22.66 11 48.24 25.16 12 51.05 28.00 13 53.51 31.16 14 55.57 34.59 15 55.64 34.76 Circle Center At X = 25.77 ; Y = 50.16; and Radius = 33.62 * * Factor Of Safety Is Calculated By The Modified Bishop Method * * Factor Of Safety For The Preceding Specified Surface = 2.261 ***Table 1 - Individual Data on the 18 Slices*** Water Water Tie Tie Earthquake Force Force Force Force Force Surcharge Slice Width Weight Top Bot Norm Tan Hor Ver Load No. (ft) (lbs) (lbs) (lbs) (lbs) (lbs) (lbs) (lbs) (lbs) 1 3.7 370.8 0.0 0.0 0.0 0.0 33.4 0.0 0.0 2 3.9 1051.1 0.0 0.0 0.0 0.0 94.6 0.0 0.0 3 1.6 566.8 0.0 0.0 0.0 0.0 51.0 0.0 0.0 4 2.4 1791.4 0.0 0.0 0.0 0.0 161.2 0.0 0.0 5 0.6 756.9 0.0 0.0 0.0 0.0 68.1 0.0 0.0 6 1.5 1948.6 0.0 0.0 0.0 0.0 175.4 0.0 0.0 7 1.9 2484.1 0.0 0.0 0.0 0.0 223.6 0.0 0.0 8 4.0 5725.7 0.0 0.0 0.0 0.0 515.3 0.0 0.0 9 3.9 5990.7 0.0 0.0 0.0 0.0 539.2 0.0 0.0 10 3.8 5930.8 0.0 0.0 0.0 0.0 533.8 0.0 0.0 11 3.6 5503.6 0.0 0.0 0.0 0.0 495.3 0.0 0.0 12 3.4 4843.8 0.0 0.0 0.0 0.0 435.9 0.0 0.0 13 2.9 3641.6 0.0 0.0 0.0 0.0 327.7 0.0 0.0 14 0.2 279.2 0.0 0.0 0.0 0.0 25.1 0.0 0.0 15 2.8 2770.6 0.0 0.0 0.0 0.0 249.4 0.0 0.0 16 2.5 1550.4 0.0 0.0 0.0 0.0 139.5 0.0 0.0 17 2.1 476.4 0.0 0.0 0.0 0.0 42.9 0.0 0.0 18 0.1 0.8 0.0 0.0 0.0 0.0 0.1 0.0 0.0 ***Table 2 - Base Stress Data on the 18 Slices*** Slice Alpha X-Coord. Base Available Mobilized No. (deg) Slice Cntr Leng. Shear Strength Shear Stress * (ft) (ft) (psf) (psf) 1 -22.84 12.74 3.99 509.85 -36.04 2 -15.95 16.51 4.00 554.91 -72.11 3 -9.20 19.22 1.59 572.93 -56.98 4 -9.20 21.19 2.41 695.36 -118.82 5 -2.44 22.69 0.62 827.98 -51.88 6 -2.44 23.75 1.50 852.07 -55.23 7 -2.44 25.43 1.87 861.10 -56.48 8 4.44 28.36 4.00 879.48 110.83 9 11.25 32.32 4.00 893.19 292.52 10 18.16 36.19 4.01 886.58 461.09 11 24.90 39.90 3.99 860.78 580.54 12 31.63 43.42 4.00 816.29 634.25 13 38.70 46.56 3.69 754.78 617.03 14 38.70 48.12 0.31 726.87 567.73 15 45.30 49.65 4.00 661.08 492.97 16 52.10 52.28 4.00 547.55 305.50 17 59.01 54.54 4.00 425.00 102.08 18 68.09 55.60 0.19 339.26 3.89 Sum of the Resisting Forces (including Pier/Pile, Tieback, Reinforcing Soil Nail, and Applied Forces if applicable) = 37204.71 (lbs) Average Available Shear Strength (including Tieback, Pier/Pile, Reinforcing, Soil Nail, and Applied Forces if applicable) = 712.96(psf) Sum of the Driving Forces = 16458.61 (lbs) Average Mobilized Shear Stress = 315.40(psf) Total length of the failure surface = 52.18(ft) CAUTION - Factor Of Safety Is Calculated By The Modified Bishop Method. This Method Is Valid Only If The Failure Surface Approximates A Circular Arc.

X:\OFFICE\PROJECTS\01304-~Z\001-NO~V\ENGINE~Q\GSTABLE\ROCK3-PS.OUT Page 3
**** END OF GSTABL7 OUTPUT ****
APPENDIX C

Project: Minimum Factors of Safety:Static Seismic Static Seismic
Location: Overturning: 2.0 1.5 5.29 1.99IGES, Inc. Project No: 01304-001 Sliding: 1.5 1.1 4.18 1.97
Engineer: DWH Bearing Capacity: 2.5 1.9 42.33 30.90Date: Internal Sliding: 1.5 1.1 3.87 1.82
Internal Overturning: 2.0 1.5 4.96 1.83
Rockery Section Description: 1 (Rock Cut)
1. Enter Geometric Parameters:Backslope (for flat backslope V=0): Toeslope (for flat toeslope V=0): Rockery Batter (for vertical stacking H = 0) :
30 H. : 18 V. 2 H. : 0 V. 1 H. : 2 V.β = 30.96 degrees βΤ = 0.00 degrees ψfront = -26.57 degrees
surcharge, qB = 0 psf surcharge, qT = 0 psf Number of Rocks (8 max): 7Appr. Rockery Length, L = 40 ft
2. Enter Soil, Foundation, Rock and Seismic Properties Will geotextile fabric be used along the back soil cut?Retained Soil Properties: Foundation Properties: Rock Properties:
γretainined = 150 pcf γfoundation = 125 pcf γRock Boulder = 150 pcfφretained = 48 degrees φfoundation = 40.0 degrees φBoulder Interface = 0.55 degreescretained = 812 psf cfoundation = 150 psf Rockery Embedment, D = 1.5 ftδretained = 32.00 degrees μfoundation = 0.6 Rock Stacking Red. Factor* = 0.7 *Height to Width Ratio
Ka = Kah = Depth to Groundwater, z = 100.0 ft
Seismic Properties: 10 % Exceedance Prob. kv = 0.000 g KAE =50 years Exposure Time 10 PE 50 PGA: 0.172 g kh = 0.086 g FAE = lb/ft
475 -yr Recurence Interval θ = 4.92 degrees ΔFAE = lb/ft
3. Enter Rock Diamters in Table Below 6. Calculate the Factor of Safety against Base Sliding (Min. FS = 1.5)Actual Back of Rock Batter, ψ: 16.4 degrees from vertical (CW) Resisting Force, Pres = lb/ft Pres-E = lb/ft-dyn
Driving Force, Pah1 = lb/ft Pah1-E = lb/ft-dyn4. Calculate Hinge Height FSsld = Pres/Pah1 = static seismic
Avg. rock diameter: 3.2 10.9 ft7. Calculate the Factor of Safety for Bearing Capacity (Min. FS = 2.5)
5. Calculate the Factor of Safety against Overturning (Min. FS = 2.0) Eccentricity, e = -0.357 ft OK eE = 0.89 ft OKWall Weight, W 1 = lb/ft Bearing Stress, σvb = psf σvb-E = psf-dyn
Acting At: x = 3.99 y = 6.81 Max. Allow., qULT = psf qULT-E = psf-dynResisting Moment, Mres = lb Mres-E = lb-dyn FSbearing = qULT/σvb = static seismic
Driving Moment, Mdrv = lb Mdrv-E = lb-dynFSovt = Mres/Mdrv = static seismic 8. Calculate the Factors of Safety for Internal Buldging (Min. FS = 1.5)
Values tabulated below. See sheet C-1 for equations
Approximate Maximum Exposed Rockery Height: 14.9 ft
(from top) Static Seismic Static Seismic Static Seismic Static Seismic Static Seismic Static Seismic(ft) (ft) (lb/ft) (lb/ft) (lb/ft) (lb/ft) (lb/ft) (lb/ft) (lb/ft) 1.5 Min. 1.13 Min. lb lb lb lb 2.0 Min. 1.5 Min.
1 6.0 16.4 9,810 2,439 916 1,467 3,192 6,132 6,279 7,994 22,395 42,301 44,4892 4.0 12.2 5,468 1,347 506 810 1,767 3,131 3,213 3.87 1.82 3,280 9,371 16,281 17,116 4.96 1.833 3.0 9.4 3,506 798 299 480 1,070 2,002 2,050 4.17 1.92 1,495 4,429 7,898 8,273 5.28 1.874 3.0 7.3 2,719 479 180 288 696 1,540 1,569 5.34 2.25 697 2,243 5,506 5,713 7.90 2.555 2.5 5.2 1,738 242 91 146 383 978 993 6.72 2.60 250 891 2,827 2,910 11.32 3.276 2.0 3.4 1,020 105 40 63 189 571 577 9.00 3.05 72 299 1,320 1,347 18.36 4.517 2.0 2.0 600 36 14 22 87 333 336 15.19 3.87 15 82 703 712 48.04 8.67
0.0 0 0 0 0 0 0 0 0 0 0 0
97,83130.90
Row, i
Min. Rock Dia.
C-1
7,993.7
H1,i ΔFAEiMdrv Mres
F.S. Internal Overturning
See Ext. OT
Accm. Weight
Rockery Analysis and Design
15-ft Section for Rockery No.
22,394.544,489.3
0.0730.076
Foundation Soil Type:
July 16, 2009
5.29
1.97
1.99
9,810
42,300.9
ft Hinge Ht., Hh =
3,166
FAEiPresiPahi
F.S. Internal Sliding
See Base Sliding
Interactive Rockery Minimum Rock Size Stability Calculations
NorthStar HOA
NorthStar Community, Park City, Utah
ActualAllowable
1,466.76,131.6
97,83142.33
4.18
0.122
3,192.5
2,311
6,279.4
2,438.6915.8
YESNO
SandSilt or ClayGravelBedrockStructural Fill
Copyright IGES, Inc. 2008

Project: Minimum Factors of Safety:Static Seismic Static Seismic
Location: Overturning: 2.0 1.5 5.56 1.80IGES, Inc. Project No: 01304-001 Sliding: 1.5 1.1 5.07 2.14
Engineer: DWH Bearing Capacity: 2.5 1.9 29.84 25.09Date: Internal Sliding: 1.5 1.1 5.36 2.15
Internal Overturning: 2.0 1.5 6.74 2.06
Rockery Section Description: 1 (Rock Cut)
1. Enter Geometric Parameters:Backslope (for flat backslope V=0): Toeslope (for flat toeslope V=0): Rockery Batter (for vertical stacking H = 0) :
30 H. : 18 V. 2 H. : 0 V. 1 H. : 2 V.β = 30.96 degrees βΤ = 0.00 degrees ψfront = -26.57 degrees
surcharge, qB = 0 psf surcharge, qT = 0 psf Number of Rocks (8 max): 6Appr. Rockery Length, L = 40 ft
2. Enter Soil, Foundation, Rock and Seismic Properties Will geotextile fabric be used along the back soil cut?Retained Soil Properties: Foundation Properties: Rock Properties:
γretainined = 150 pcf γfoundation = 125 pcf γRock Boulder = 150 pcfφretained = 48 degrees φfoundation = 40.0 degrees φBoulder Interface = 0.55 degreescretained = 812 psf cfoundation = 150 psf Rockery Embedment, D = 1.5 ftδretained = 32.00 degrees μfoundation = 0.6 Rock Stacking Red. Factor* = 0.7 *Height to Width Ratio
Ka = Kah = Depth to Groundwater, z = 100.0 ft
Seismic Properties: 10 % Exceedance Prob. kv = 0.000 g KAE =50 years Exposure Time 10 PE 50 PGA: 0.172 g kh = 0.086 g FAE = lb/ft
475 -yr Recurence Interval θ = 4.92 degrees ΔFAE = lb/ft
3. Enter Rock Diamters in Table Below 6. Calculate the Factor of Safety against Base Sliding (Min. FS = 1.5)Actual Back of Rock Batter, ψ: 20.5 degrees from vertical (CW) Resisting Force, Pres = lb/ft Pres-E = lb/ft-dyn
Driving Force, Pah1 = lb/ft Pah1-E = lb/ft-dyn4. Calculate Hinge Height FSsld = Pres/Pah1 = static seismic
Avg. rock diameter: 3.1 8.2 ft7. Calculate the Factor of Safety for Bearing Capacity (Min. FS = 2.5)
5. Calculate the Factor of Safety against Overturning (Min. FS = 2.0) Eccentricity, e = -0.435 ft OK eE = 0.65 ft OKWall Weight, W 1 = lb/ft Bearing Stress, σvb = psf σvb-E = psf-dyn
Acting At: x = 2.90 y = 6.02 Max. Allow., qULT = psf qULT-E = psf-dynResisting Moment, Mres = lb Mres-E = lb-dyn FSbearing = qULT/σvb = static seismic
Driving Moment, Mdrv = lb Mdrv-E = lb-dynFSovt = Mres/Mdrv = static seismic 8. Calculate the Factors of Safety for Internal Buldging (Min. FS = 1.5)
Values tabulated below. See sheet C-1 for equations
Approximate Maximum Exposed Rockery Height: 12.1 ft
(from top) Static Seismic Static Seismic Static Seismic Static Seismic Static Seismic Static Seismic(ft) (ft) (lb/ft) (lb/ft) (lb/ft) (lb/ft) (lb/ft) (lb/ft) (lb/ft) 1.5 Min. 1.13 Min. lb lb lb lb 2.0 Min. 1.5 Min.
1 4.0 13.6 6,098 1,286 532 739 1,785 3,748 3,812 3,337 10,737 18,550 19,2962 3.5 10.8 4,434 810 335 465 1,175 2,491 2,531 5.36 2.15 1,666 5,648 11,228 11,622 6.74 2.063 3.5 8.3 3,424 483 200 277 767 1,914 1,938 6.90 2.53 767 2,853 7,775 7,989 10.14 2.804 3.0 5.9 2,194 240 99 138 424 1,222 1,234 8.87 2.91 269 1,125 4,031 4,116 15.01 3.665 2.5 3.8 1,266 99 41 57 205 702 707 12.41 3.44 71 357 1,857 1,884 26.25 5.276 2.0 2.0 600 28 12 16 79 332 333 20.61 4.21 11 76 697 702 64.93 9.25
0.0 0 0 0 0 0 0 0 0 0 0 00.0 0 0 0 0 0 0 0 0 0 0 0
2,581
3,812.0
1,286.3532.4
738.83,748.5
77,02329.84
5.07
0.093
1,785.0
Interactive Rockery Minimum Rock Size Stability Calculations
NorthStar HOA
NorthStar Community, Park City, Utah
ActualAllowable
FAEiPresiPahi
F.S. Internal Sliding
See Base Sliding
July 16, 2009
5.56
2.14
1.80
6,098
18,549.5
ft Hinge Ht., Hh =
3,070
Rockery Analysis and Design
12-ft Section for Rockery No.
10,736.919,295.5
0.0540.055
Foundation Soil Type:
C-2
3,337.1
H1,i ΔFAEiMdrv Mres
F.S. Internal Overturning
See Ext. OT
Accm. Weight
77,02325.09
Row, i
Min. Rock Dia.
YESNO
SandSilt or ClayGravelBedrockStructural Fill
Copyright IGES, Inc. 2008

Project: Minimum Factors of Safety:Static Seismic Static Seismic
Location: Overturning: 2.0 1.5 5.70 1.84IGES, Inc. Project No: 01304-001 Sliding: 1.5 1.1 5.13 2.16
Engineer: DWH Bearing Capacity: 2.5 1.9 32.39 27.37Date: Internal Sliding: 1.5 1.1 5.29 2.14
Internal Overturning: 2.0 1.5 6.60 2.03
Rockery Section Description: 1 (Rock Cut)
1. Enter Geometric Parameters:Backslope (for flat backslope V=0): Toeslope (for flat toeslope V=0): Rockery Batter (for vertical stacking H = 0) :
30 H. : 18 V. 2 H. : 0 V. 1 H. : 2 V.β = 30.96 degrees βΤ = 0.00 degrees ψfront = -26.57 degrees
surcharge, qB = 0 psf surcharge, qT = 0 psf Number of Rocks (8 max): 6Appr. Rockery Length, L = 40 ft
2. Enter Soil, Foundation, Rock and Seismic Properties Will geotextile fabric be used along the back soil cut?Retained Soil Properties: Foundation Properties: Rock Properties:
γretainined = 150 pcf γfoundation = 125 pcf γRock Boulder = 150 pcfφretained = 48 degrees φfoundation = 40.0 degrees φBoulder Interface = 0.55 degreescretained = 812 psf cfoundation = 150 psf Rockery Embedment, D = 1.0 ftδretained = 32.00 degrees μfoundation = 0.6 Rock Stacking Red. Factor* = 0.7 *Height to Width Ratio
Ka = Kah = Depth to Groundwater, z = 100.0 ft
Seismic Properties: 10 % Exceedance Prob. kv = 0.000 g KAE =50 years Exposure Time 10 PE 50 PGA: 0.172 g kh = 0.086 g FAE = lb/ft
475 -yr Recurence Interval θ = 4.92 degrees ΔFAE = lb/ft
3. Enter Rock Diamters in Table Below 6. Calculate the Factor of Safety against Base Sliding (Min. FS = 1.5)Actual Back of Rock Batter, ψ: 20.3 degrees from vertical (CW) Resisting Force, Pres = lb/ft Pres-E = lb/ft-dyn
Driving Force, Pah1 = lb/ft Pah1-E = lb/ft-dyn4. Calculate Hinge Height FSsld = Pres/Pah1 = static seismic
Avg. rock diameter: 2.3 6.1 ft7. Calculate the Factor of Safety for Bearing Capacity (Min. FS = 2.5)
5. Calculate the Factor of Safety against Overturning (Min. FS = 2.0) Eccentricity, e = -0.315 ft OK eE = 0.47 ft OKWall Weight, W 1 = lb/ft Bearing Stress, σvb = psf σvb-E = psf-dyn
Acting At: x = 2.15 y = 4.40 Max. Allow., qULT = psf qULT-E = psf-dynResisting Moment, Mres = lb Mres-E = lb-dyn FSbearing = qULT/σvb = static seismic
Driving Moment, Mdrv = lb Mdrv-E = lb-dynFSovt = Mres/Mdrv = static seismic 8. Calculate the Factors of Safety for Internal Buldging (Min. FS = 1.5)
Values tabulated below. See sheet C-1 for equations
Approximate Maximum Exposed Rockery Height: 8.9 ft
(from top) Static Seismic Static Seismic Static Seismic Static Seismic Static Seismic Static Seismic(ft) (ft) (lb/ft) (lb/ft) (lb/ft) (lb/ft) (lb/ft) (lb/ft) (lb/ft) 1.5 Min. 1.13 Min. lb lb lb lb 2.0 Min. 1.5 Min.
1 3.0 9.9 3,341 695 286 400 968 2,054 2,089 1,321 4,252 7,534 7,8362 2.5 7.8 2,340 432 178 249 624 1,315 1,337 5.29 2.14 646 2,181 4,267 4,419 6.60 2.033 2.5 6.1 1,815 260 107 150 410 1,015 1,028 6.79 2.51 302 1,115 2,976 3,059 9.87 2.744 2.0 4.3 1,129 131 54 76 226 629 636 8.33 2.82 108 444 1,447 1,480 13.37 3.345 2.0 2.9 761 60 25 34 124 423 426 12.30 3.43 33 166 875 889 26.36 5.376 1.5 1.5 338 16 7 9 45 187 187 20.31 4.20 5 32 294 296 63.98 9.22
0.0 0 0 0 0 0 0 0 0 0 0 00.0 0 0 0 0 0 0 0 0 0 0 0
60,22127.37
Row, i
Min. Rock Dia.
C-3
1,321.4
H1,i ΔFAEiMdrv Mres
F.S. Internal Overturning
See Ext. OT
Accm. Weight
Rockery Analysis and Design
9-ft Section for Rockery No.
4,252.17,835.5
0.0540.056
Foundation Soil Type:
July 16, 2009
5.70
2.16
1.84
3,341
7,534.4
ft Hinge Ht., Hh =
2,200
FAEiPresiPahi
F.S. Internal Sliding
See Base Sliding
Interactive Rockery Minimum Rock Size Stability Calculations
NorthStar HOA
NorthStar Community, Park City, Utah
ActualAllowable
400.42,054.3
60,22132.39
5.13
0.095
968.3
1,859
2,089.0
695.3286.4
YESNO
SandSilt or ClayGravelBedrockStructural Fill
Copyright IGES, Inc. 2008

Project: Minimum Factors of Safety:Static Seismic Static Seismic
Location: Overturning: 2.0 1.5 8.10 2.65IGES, Inc. Project No: 01304-001 Sliding: 1.5 1.1 5.79 2.44
Engineer: DWH Bearing Capacity: 2.5 1.9 61.56 51.10Date: Internal Sliding: 1.5 1.1 6.80 2.60
Internal Overturning: 2.0 1.5 11.86 3.46
Rockery Section Description: 1 (Rock Cut)
1. Enter Geometric Parameters:Backslope (for flat backslope V=0): Toeslope (for flat toeslope V=0): Rockery Batter (for vertical stacking H = 0) :
30 H. : 18 V. 2 H. : 0 V. 1 H. : 2 V.β = 30.96 degrees βΤ = 0.00 degrees ψfront = -26.57 degrees
surcharge, qB = 0 psf surcharge, qT = 0 psf Number of Rocks (8 max): 4Appr. Rockery Length, L = 40 ft
2. Enter Soil, Foundation, Rock and Seismic Properties Will geotextile fabric be used along the back soil cut?Retained Soil Properties: Foundation Properties: Rock Properties:
γretainined = 150 pcf γfoundation = 125 pcf γRock Boulder = 150 pcfφretained = 48 degrees φfoundation = 40.0 degrees φBoulder Interface = 0.55 degreescretained = 812 psf cfoundation = 150 psf Rockery Embedment, D = 1.0 ftδretained = 32.00 degrees μfoundation = 0.6 Rock Stacking Red. Factor* = 0.7 *Height to Width Ratio
Ka = Kah = Depth to Groundwater, z = 100.0 ft
Seismic Properties: 10 % Exceedance Prob. kv = 0.000 g KAE =50 years Exposure Time 10 PE 50 PGA: 0.172 g kh = 0.086 g FAE = lb/ft
475 -yr Recurence Interval θ = 4.92 degrees ΔFAE = lb/ft
3. Enter Rock Diamters in Table Below 6. Calculate the Factor of Safety against Base Sliding (Min. FS = 1.5)Actual Back of Rock Batter, ψ: 16.8 degrees from vertical (CW) Resisting Force, Pres = lb/ft Pres-E = lb/ft-dyn
Driving Force, Pah1 = lb/ft Pah1-E = lb/ft-dyn4. Calculate Hinge Height do not use FSsld = Pres/Pah1 = static seismic
Avg. rock diameter: 2.3 7.4 ft7. Calculate the Factor of Safety for Bearing Capacity (Min. FS = 2.5)
5. Calculate the Factor of Safety against Overturning (Min. FS = 2.0) Eccentricity, e = -0.156 ft OK eE = 0.30 ft OKWall Weight, W 1 = lb/ft Bearing Stress, σvb = psf σvb-E = psf-dyn
Acting At: x = 1.84 y = 3.00 Max. Allow., qULT = psf qULT-E = psf-dynResisting Moment, Mres = lb Mres-E = lb-dyn FSbearing = qULT/σvb = static seismic
Driving Moment, Mdrv = lb Mdrv-E = lb-dynFSovt = Mres/Mdrv = static seismic 8. Calculate the Factors of Safety for Internal Buldging (Min. FS = 1.5)
Values tabulated below. See sheet C-1 for equations
Approximate Maximum Exposed Rockery Height: 5.8 ft
(from top) Static Seismic Static Seismic Static Seismic Static Seismic Static Seismic Static Seismic(ft) (ft) (lb/ft) (lb/ft) (lb/ft) (lb/ft) (lb/ft) (lb/ft) (lb/ft) 1.5 Min. 1.13 Min. lb lb lb lb 2.0 Min. 1.5 Min.
1 3.0 6.8 2,278 406 154 243 587 1,406 1,431 547 1,735 4,429 4,5992 2.5 4.7 1,395 192 73 115 306 784 796 6.80 2.60 179 631 2,121 2,185 11.86 3.463 2.0 2.9 761 75 28 45 138 425 430 9.48 3.12 43 181 887 905 20.44 4.994 1.5 1.5 338 20 8 12 48 187 189 15.61 3.90 6 34 296 300 49.35 8.72
0.0 0 0 0 0 0 0 0 0 0 0 00.0 0 0 0 0 0 0 0 0 0 0 00.0 0 0 0 0 0 0 0 0 0 0 00.0 0 0 0 0 0 0 0 0 0 0 0
1,025
1,430.6
405.6153.7
243.11,406.5
63,11261.56
5.79
0.119
587.4
Interactive Rockery Minimum Rock Size Stability Calculations
NorthStar HOA
NorthStar Community, Park City, Utah
ActualAllowable
FAEiPresiPahi
F.S. Internal Sliding
See Base Sliding
July 16, 2009
8.10
2.44
2.65
2,278
4,428.9
ft Hinge Ht., Hh =
1,235
Rockery Analysis and Design
6-ft Section for Rockery No.
1,735.54,599.0
0.0710.074
Foundation Soil Type:
C-4
547.0
H1,i ΔFAEiMdrv Mres
F.S. Internal Overturning
See Ext. OT
Accm. Weight
63,11251.10
Row, i
Min. Rock Dia.
YESNO
SandSilt or ClayGravelBedrockStructural Fill
Copyright IGES, Inc. 2008

Project: Minimum Factors of Safety:Static Seismic Static Seismic
Location: Overturning: 2.0 1.5 11.63 3.44IGES, Inc. Project No: 01304-001 Sliding: 1.5 1.1 7.27 2.81
Engineer: DWH Bearing Capacity: 2.5 1.9 82.22 73.76Date: Internal Sliding: 1.5 1.1 9.29 3.10
Internal Overturning: 2.0 1.5 20.03 4.96
Rockery Section Description: 1 (Rock Cut)
1. Enter Geometric Parameters:Backslope (for flat backslope V=0): Toeslope (for flat toeslope V=0): Rockery Batter (for vertical stacking H = 0) :
30 H. : 18 V. 2 H. : 0 V. 1 H. : 2 V.β = 30.96 degrees βΤ = 0.00 degrees ψfront = -26.57 degrees
surcharge, qB = 0 psf surcharge, qT = 0 psf Number of Rocks (8 max): 3Appr. Rockery Length, L = 40 ft
2. Enter Soil, Foundation, Rock and Seismic Properties Will geotextile fabric be used along the back soil cut?Retained Soil Properties: Foundation Properties: Rock Properties:
γretainined = 150 pcf γfoundation = 125 pcf γRock Boulder = 150 pcfφretained = 48 degrees φfoundation = 40.0 degrees φBoulder Interface = 0.55 degreescretained = 812 psf cfoundation = 150 psf Rockery Embedment, D = 1.0 ftδretained = 32.00 degrees μfoundation = 0.6 Rock Stacking Red. Factor* = 0.7 *Height to Width Ratio
Ka = Kah = Depth to Groundwater, z = 100.0 ft
Seismic Properties: 10 % Exceedance Prob. kv = 0.000 g KAE =50 years Exposure Time 10 PE 50 PGA: 0.172 g kh = 0.086 g FAE = lb/ft
475 -yr Recurence Interval θ = 4.92 degrees ΔFAE = lb/ft
3. Enter Rock Diamters in Table Below 6. Calculate the Factor of Safety against Base Sliding (Min. FS = 1.5)Actual Back of Rock Batter, ψ: 16.5 degrees from vertical (CW) Resisting Force, Pres = lb/ft Pres-E = lb/ft-dyn
Driving Force, Pah1 = lb/ft Pah1-E = lb/ft-dyn4. Calculate Hinge Height do not use FSsld = Pres/Pah1 = static seismic
Avg. rock diameter: 2.0 6.8 ft7. Calculate the Factor of Safety for Bearing Capacity (Min. FS = 2.5)
5. Calculate the Factor of Safety against Overturning (Min. FS = 2.0) Eccentricity, e = -0.111 ft OK eE = 0.18 ft OKWall Weight, W 1 = lb/ft Bearing Stress, σvb = psf σvb-E = psf-dyn
Acting At: x = 1.45 y = 2.13 Max. Allow., qULT = psf qULT-E = psf-dynResisting Moment, Mres = lb Mres-E = lb-dyn FSbearing = qULT/σvb = static seismic
Driving Moment, Mdrv = lb Mdrv-E = lb-dynFSovt = Mres/Mdrv = static seismic 8. Calculate the Factors of Safety for Internal Buldging (Min. FS = 1.5)
Values tabulated below. See sheet C-1 for equations
Approximate Maximum Exposed Rockery Height: 3.7 ft
(from top) Static Seismic Static Seismic Static Seismic Static Seismic Static Seismic Static Seismic(ft) (ft) (lb/ft) (lb/ft) (lb/ft) (lb/ft) (lb/ft) (lb/ft) (lb/ft) 1.5 Min. 1.13 Min. lb lb lb lb 2.0 Min. 1.5 Min.
1 2.5 4.7 1,395 196 74 118 309 857 868 183 637 2,125 2,1912 2.0 2.9 761 76 29 46 139 426 430 9.29 3.10 44 183 888 907 20.03 4.963 1.5 1.5 338 20 8 12 49 187 189 15.29 3.88 6 35 296 300 48.34 8.68
0.0 0 0 0 0 0 0 0 0 0 0 00.0 0 0 0 0 0 0 0 0 0 0 00.0 0 0 0 0 0 0 0 0 0 0 00.0 0 0 0 0 0 0 0 0 0 0 00.0 0 0 0 0 0 0 0 0 0 0 0
59,41073.76
Row, i
Min. Rock Dia.
C-5
182.7
H1,i ΔFAEiMdrv Mres
F.S. Internal Overturning
See Ext. OT
Accm. Weight
Rockery Analysis and Design
4-ft Section for Rockery No.
636.82,190.8
0.0730.075
Foundation Soil Type:
July 16, 2009
11.63
2.81
3.44
1,395
2,125.2
ft Hinge Ht., Hh =
805
FAEiPresiPahi
F.S. Internal Sliding
See Base Sliding
Interactive Rockery Minimum Rock Size Stability Calculations
NorthStar HOA
NorthStar Community, Park City, Utah
ActualAllowable
117.9856.6
59,41082.22
7.27
0.121
309.0
723
868.4
196.173.8
YESNO
SandSilt or ClayGravelBedrockStructural Fill
Copyright IGES, Inc. 2008

Project: Minimum Factors of Safety:Static Seismic Static Seismic
Location: Overturning: 2.0 1.5 6.07 2.85IGES, Inc. Project No: 01304-001 Sliding: 1.5 1.1 3.36 1.94
Engineer: DWH Bearing Capacity: 2.5 1.9 14.02 9.77Date: Internal Sliding: 1.5 1.1 4.23 2.13
Internal Overturning: 2.0 1.5 13.50 5.25
Rockery Section Description: 2 (Replaces Timber Wall along North Side of Lot 5)
1. Enter Geometric Parameters:Backslope (for flat backslope V=0): Toeslope (for flat toeslope V=0): Rockery Batter (for vertical stacking H = 0) :
3 H. : 1 V. 2 H. : 0 V. 1 H. : 2 V.β = 18.43 degrees βΤ = 0.00 degrees ψfront = -26.57 degrees
surcharge, qB = 0 psf surcharge, qT = 0 psf Number of Rocks (8 max): 2Appr. Rockery Length, L = 40 ft
2. Enter Soil, Foundation, Rock and Seismic Properties Will geotextile fabric be used along the back soil cut?Retained Soil Properties: Foundation Properties: Rock Properties:
γretainined = 125 pcf γfoundation = 125 pcf γRock Boulder = 150 pcfφretained = 29 degrees φfoundation = 17.0 degrees φBoulder Interface = 0.55 degreescretained = 0 psf cfoundation = 450 psf Rockery Embedment, D = 1.0 ftδretained = 19.33 degrees μfoundation = 0.7 Rock Stacking Red. Factor* = 0.7 *Height to Width Ratio
Ka = Kah = Depth to Groundwater, z = 100.0 ft
Seismic Properties: 10 % Exceedance Prob. kv = 0.000 g KAE =50 years Exposure Time 10 PE 50 PGA: 0.172 g kh = 0.086 g FAE = lb/ft
475 -yr Recurence Interval θ = 4.92 degrees ΔFAE = lb/ft
3. Enter Rock Diamters in Table Below 6. Calculate the Factor of Safety against Base Sliding (Min. FS = 1.5)Actual Back of Rock Batter, ψ: 10.0 degrees from vertical (CW) Resisting Force, Pres = lb/ft Pres-E = lb/ft-dyn
Driving Force, Pah1 = lb/ft Pah1-E = lb/ft-dyn4. Calculate Hinge Height do not use FSsld = Pres/Pah1 = static seismic
Avg. rock diameter: 2.0 11.3 ft7. Calculate the Factor of Safety for Bearing Capacity (Min. FS = 2.5)
5. Calculate the Factor of Safety against Overturning (Min. FS = 2.0) Eccentricity, e = 0.105 ft OK eE = 0.35 ft OKWall Weight, W 1 = lb/ft Bearing Stress, σvb = psf σvb-E = psf-dyn
Acting At: x = 1.32 y = 1.49 Max. Allow., qULT = psf qULT-E = psf-dynResisting Moment, Mres = lb Mres-E = lb-dyn FSbearing = qULT/σvb = static seismic
Driving Moment, Mdrv = lb Mdrv-E = lb-dynFSovt = Mres/Mdrv = static seismic 8. Calculate the Factors of Safety for Internal Buldging (Min. FS = 1.5)
Values tabulated below. See sheet C-1 for equations
Approximate Maximum Exposed Rockery Height: 2.3 ft
(from top) Static Seismic Static Seismic Static Seismic Static Seismic Static Seismic Static Seismic(ft) (ft) (lb/ft) (lb/ft) (lb/ft) (lb/ft) (lb/ft) (lb/ft) (lb/ft) 1.5 Min. 1.13 Min. lb lb lb lb 2.0 Min. 1.5 Min.
1 2.5 3.3 975 289 75 210 369 707 715 228 498 1,383 1,4182 1.5 1.5 338 62 16 45 90 190 191 4.23 2.13 22 58 303 307 13.50 5.25
0.0 0 0 0 0 0 0 0 0 0 0 00.0 0 0 0 0 0 0 0 0 0 0 00.0 0 0 0 0 0 0 0 0 0 0 00.0 0 0 0 0 0 0 0 0 0 0 00.0 0 0 0 0 0 0 0 0 0 0 00.0 0 0 0 0 0 0 0 0 0 0 0
506
715.2
288.775.5
210.4706.7
7,09214.02
3.36
0.437
368.8
Interactive Rockery Minimum Rock Size Stability Calculations
NorthStar HOA
NorthStar Community, Park City, Utah
ActualAllowable
FAEiPresiPahi
F.S. Internal Sliding
See Base Sliding
July 16, 2009
6.07
1.94
2.85
975
1,383.4
ft Hinge Ht., Hh =
726
Rockery Analysis and Design
2.5-ft Section for Rockery No.
498.11,418.1
0.3190.323
Foundation Soil Type:
C-6
228.0
H1,i ΔFAEiMdrv Mres
F.S. Internal Overturning
See Ext. OT
Accm. Weight
7,0929.77
Row, i
Min. Rock Dia.
YESNO
SandSilt or ClayGravelBedrockStructural Fill
Copyright IGES, Inc. 2008

Project: Minimum Factors of Safety:Static Seismic Static Seismic
Location: Overturning: 2.0 1.5 2.90 1.52IGES, Inc. Project No: 01304-001 Sliding: 1.5 1.1 2.12 1.34
Engineer: DWH Bearing Capacity: 2.5 1.9 5.22 5.73Date: Internal Sliding: 1.5 1.1 1.93 1.19
Internal Overturning: 2.0 1.5 3.40 1.71
Rockery Section Description: 3 (Replaces Timber Wall along Upper Portion of Road)
1. Enter Geometric Parameters:Backslope (for flat backslope V=0): Toeslope (for flat toeslope V=0): Rockery Batter (for vertical stacking H = 0) :
3 H. : 1 V. 10 H. : 0 V. 1 H. : 2 V.β = 18.43 degrees βΤ = 0.00 degrees ψfront = -26.57 degrees
surcharge, qB = 0 psf surcharge, qT = 0 psf Number of Rocks (8 max): 4Appr. Rockery Length, L = 40 ft
2. Enter Soil, Foundation, Rock and Seismic Properties Will geotextile fabric be used along the back soil cut?Retained Soil Properties: Foundation Properties: Rock Properties:
γretainined = 125 pcf γfoundation = 125 pcf γRock Boulder = 150 pcfφretained = 29 degrees φfoundation = 17.0 degrees φBoulder Interface = 0.55 degreescretained = 0 psf cfoundation = 450 psf Rockery Embedment, D = 1.0 ftδretained = 19.33 degrees μfoundation = 0.7 Rock Stacking Red. Factor* = 0.7 *Height to Width Ratio
Ka = Kah = Depth to Groundwater, z = 100.0 ft
Seismic Properties: 10 % Exceedance Prob. kv = 0.000 g KAE =50 years Exposure Time 10 PE 50 PGA: 0.172 g kh = 0.086 g FAE = lb/ft
475 -yr Recurence Interval θ = 4.92 degrees ΔFAE = lb/ft
3. Enter Rock Diamters in Table Below 6. Calculate the Factor of Safety against Base Sliding (Min. FS = 1.5)Actual Back of Rock Batter, ψ: 11.6 degrees from vertical (CW) Resisting Force, Pres = lb/ft Pres-E = lb/ft-dyn
Driving Force, Pah1 = lb/ft Pah1-E = lb/ft-dyn4. Calculate Hinge Height do not use FSsld = Pres/Pah1 = static seismic
Avg. rock diameter: 2.5 12.2 ft7. Calculate the Factor of Safety for Bearing Capacity (Min. FS = 2.5)
5. Calculate the Factor of Safety against Overturning (Min. FS = 2.0) Eccentricity, e = 0.443 ft OK eE = 0.37 ft* OKWall Weight, W 1 = lb/ft Bearing Stress, σvb = psf σvb-E = psf-dyn
Acting At: x = 2.28 y = 3.16 Max. Allow., qULT = psf qULT-E = psf-dynResisting Moment, Mres = lb Mres-E = lb-dyn FSbearing = qULT/σvb = static seismic
Driving Moment, Mdrv = lb Mdrv-E = lb-dyn *one-third increase applied
FSovt = Mres/Mdrv = static seismic 8. Calculate the Factors of Safety for Internal Buldging (Min. FS = 1.5)Values tabulated below. See sheet C-1 for equations
Approximate Maximum Exposed Rockery Height: 6.5 ft
(from top) Static Seismic Static Seismic Static Seismic Static Seismic Static Seismic Static Seismic(ft) (ft) (lb/ft) (lb/ft) (lb/ft) (lb/ft) (lb/ft) (lb/ft) (lb/ft) 1.5 Min. 1.13 Min. lb lb lb lb 2.0 Min. 1.5 Min.
1 4.0 7.5 3,073 1,462 389 1,064 1,713 2,252 2,289 2,641 5,200 7,649 7,9062 2.5 4.7 1,395 570 152 414 684 798 812 1.93 1.19 642 1,317 2,187 2,249 3.40 1.713 2.0 2.9 761 222 59 161 285 431 436 2.67 1.53 156 348 907 925 5.82 2.664 1.5 1.5 338 59 16 43 88 189 190 4.38 2.17 22 57 300 304 13.93 5.29
0.0 0 0 0 0 0 0 0 0 0 0 00.0 0 0 0 0 0 0 0 0 0 0 00.0 0 0 0 0 0 0 0 0 0 0 00.0 0 0 0 0 0 0 0 0 0 0 0
6,9945.73
Row, i
Min. Rock Dia.
C-7
2,641.2
H1,i ΔFAEiMdrv Mres
F.S. Internal Overturning
See Ext. OT
Accm. Weight
Rockery Analysis and Design
6.5-ft Section for Rockery No.
5,199.67,906.0
0.3070.309
Foundation Soil Type:
July 16, 2009
2.90
1.34
1.52
3,073
7,649.0
ft Hinge Ht., Hh =
1,220
FAEiPresiPahi
F.S. Internal Sliding
See Base Sliding
Interactive Rockery Minimum Rock Size Stability Calculations
NorthStar HOA
NorthStar Community, Park City, Utah
ActualAllowable
1,063.62,252.1
6,9945.22
2.12
0.422
1,713.3
1,339
2,288.7
1,462.3389.0
YESNO
SandSilt or ClayGravelBedrockStructural Fill
Copyright IGES, Inc. 2008

Project: Minimum Factors of Safety:Static Seismic Static Seismic
Location: Overturning: 2.0 1.5 3.33 1.56IGES, Inc. Project No: 01304-001 Sliding: 1.5 1.1 2.59 1.51
Engineer: DWH Bearing Capacity: 2.5 1.9 7.95 7.85Date: Internal Sliding: 1.5 1.1 3.12 1.66
Internal Overturning: 2.0 1.5 6.97 2.94
Rockery Section Description: 3 (Replaces Timber Wall along Upper Portion of Road)
1. Enter Geometric Parameters:Backslope (for flat backslope V=0): Toeslope (for flat toeslope V=0): Rockery Batter (for vertical stacking H = 0) :
3 H. : 1 V. 10 H. : 0 V. 1 H. : 2 V.β = 18.43 degrees βΤ = 0.00 degrees ψfront = -26.57 degrees
surcharge, qB = 0 psf surcharge, qT = 0 psf Number of Rocks (8 max): 3Appr. Rockery Length, L = 40 ft
2. Enter Soil, Foundation, Rock and Seismic Properties Will geotextile fabric be used along the back soil cut?Retained Soil Properties: Foundation Properties: Rock Properties:
γretainined = 125 pcf γfoundation = 125 pcf γRock Boulder = 150 pcfφretained = 29 degrees φfoundation = 17.0 degrees φBoulder Interface = 0.55 degreescretained = 0 psf cfoundation = 450 psf Rockery Embedment, D = 1.0 ftδretained = 19.33 degrees μfoundation = 0.7 Rock Stacking Red. Factor* = 0.7 *Height to Width Ratio
Ka = Kah = Depth to Groundwater, z = 100.0 ft
Seismic Properties: 10 % Exceedance Prob. kv = 0.000 g KAE =50 years Exposure Time 10 PE 50 PGA: 0.172 g kh = 0.086 g FAE = lb/ft
475 -yr Recurence Interval θ = 4.92 degrees ΔFAE = lb/ft
3. Enter Rock Diamters in Table Below 6. Calculate the Factor of Safety against Base Sliding (Min. FS = 1.5)Actual Back of Rock Batter, ψ: 17.4 degrees from vertical (CW) Resisting Force, Pres = lb/ft Pres-E = lb/ft-dyn
Driving Force, Pah1 = lb/ft Pah1-E = lb/ft-dyn4. Calculate Hinge Height do not use FSsld = Pres/Pah1 = static seismic
Avg. rock diameter: 2.2 6.9 ft7. Calculate the Factor of Safety for Bearing Capacity (Min. FS = 2.5)
5. Calculate the Factor of Safety against Overturning (Min. FS = 2.0) Eccentricity, e = 0.200 ft OK eE = 0.21 ft* OKWall Weight, W 1 = lb/ft Bearing Stress, σvb = psf σvb-E = psf-dyn
Acting At: x = 1.49 y = 2.29 Max. Allow., qULT = psf qULT-E = psf-dynResisting Moment, Mres = lb Mres-E = lb-dyn FSbearing = qULT/σvb = static seismic
Driving Moment, Mdrv = lb Mdrv-E = lb-dyn *one-third increase applied
FSovt = Mres/Mdrv = static seismic 8. Calculate the Factors of Safety for Internal Buldging (Min. FS = 1.5)Values tabulated below. See sheet C-1 for equations
Approximate Maximum Exposed Rockery Height: 4.0 ft
(from top) Static Seismic Static Seismic Static Seismic Static Seismic Static Seismic Static Seismic(ft) (ft) (lb/ft) (lb/ft) (lb/ft) (lb/ft) (lb/ft) (lb/ft) (lb/ft) 1.5 Min. 1.13 Min. lb lb lb lb 2.0 Min. 1.5 Min.
1 2.5 5.0 1,500 574 164 410 703 1,060 1,064 683 1,470 2,272 2,2912 2.5 3.3 975 243 69 173 326 539 541 3.12 1.66 188 447 1,307 1,314 6.97 2.943 1.5 1.5 338 52 15 37 81 186 187 5.05 2.31 18 53 293 294 15.89 5.49
0.0 0 0 0 0 0 0 0 0 0 0 00.0 0 0 0 0 0 0 0 0 0 0 00.0 0 0 0 0 0 0 0 0 0 0 00.0 0 0 0 0 0 0 0 0 0 0 00.0 0 0 0 0 0 0 0 0 0 0 0
897
1,063.5
574.0164.0
409.81,059.7
7,1347.95
2.59
0.367
702.7
Interactive Rockery Minimum Rock Size Stability Calculations
NorthStar HOA
NorthStar Community, Park City, Utah
ActualAllowable
FAEiPresiPahi
F.S. Internal Sliding
See Base Sliding
July 16, 2009
3.33
1.51
1.56
1,500
2,271.8
ft Hinge Ht., Hh =
909
Rockery Analysis and Design
4-ft Section for Rockery No.
1,470.32,290.8
0.2620.262
Foundation Soil Type:
C-8
683.0
H1,i ΔFAEiMdrv Mres
F.S. Internal Overturning
See Ext. OT
Accm. Weight
7,1347.85
Row, i
Min. Rock Dia.
YESNO
SandSilt or ClayGravelBedrockStructural Fill
Copyright IGES, Inc. 2008

APPENDIX D

Seismic Ground Motion Values: AASHTO 2003, ASCE 7, IBC 2006
Project:SS≤ 0.25 SS = 0.5 SS = 0.75 SS = 1.0 SS ≥ 1.25
IGES, Inc. Project No.: A 0.8 0.8 0.8 0.8 0.8Project Location: B 1.0 1.0 1.0 1.0 1.0
Date: C 1.2 1.2 1.1 1.0 1.0Engineer: D 1.6 1.4 1.2 1.1 1.0
E 2.5 1.7 1.2 0.9 0.9Site Coordinates: F
Latitude: 40.6475 degreesLongitude: -111.5027 degrees
Exceedance Probability: 10 %Exposure Time: 50 years S1 ≤ 0.1 S1 = 0.2 S1 = 0.3 S1 = 0.4 S1 ≥ 0.5
Ss = 0.359 A 0.8 0.8 0.8 0.8 0.8S1 = 0.125 B 1.0 1.0 1.0 1.0 1.0
C 1.7 1.6 1.5 1.4 1.3Site Soil Class: C (Very dense soil and soft rock) D 2.4 2.0 1.8 1.6 1.5
Fa = 1.199 E 3.5 3.2 2.8 2.4 2.4Fv = 1.675 F
Adjusted for Site Conditions: MCE PGA = 0.4 x SMS = 0.172 gSMS = Fa x SS = 0.430 g MCE T0 = 0.2 x (SM1/SMS) = 0.10 secsSM1 = Fv x S1 = 0.209 g MCE TS = (SM1/SMS) = 0.49 secs
MCE PGA < 0.29, No Deformation Analysis RequiredSite Period Based on IBC Soil Class C (Vs = 1200 ft/s):
Height of Soil Column, H: 9 ftSite Period, Ts: 0.030 secs (4 x H/Vs = 4 x 9/1200)
Site Response, Sa(Ts): 0.252 g Mod. Site Response, Sa(1.5xTs): 0.291 g
Response Time Step, ΔT = 0.1Period(sec)0.000.100.490.500.600.700.800.901.001.101.201.301.401.501.601.701.801.902.002.102.202.302.40
© Copyright IGES, Inc., 2009
( 0.4 x 0.430 ) =( 0.2 x [0.209/0.430] ) =
( 0.209/0.430 ) =
0.172
0.1310.1400.1500.161
0.105
Thursday, June 25, 2009
Rockery Analysis and Design
Site Class
From USGS 2002 Probabilistic Seismic Hazard Maps for 475-year Return Period
Table 1613.5.3(1) Mapped MCE Spectral Response Acceleration Parameter at Short Period, Fa
NorthStar Drive, Park City, Utah
NorthStar Expansion and Special Improvement
01304-001
D-1
DWH
See ASCE 7 Section 11.4.7
Site Class
See ASCE 7 Section 11.4.7
Table 1613.5.3(2) Mapped MCE Spectral Response Acceleration Parameter at 1 Second Period, Fv
( 1.199 x 0.359 ) =( 1.675 x 0.125 ) =
0.1100.116
0.262
0.1740.1900.2090.233
0.123
0.430
MCE Spectral Acceleration (g)
0.430
0.2990.3490.419
0.0870.0910.0950.100
MCE PGA Response Spectrum
0.0
0.1
0.1
0.2
0.2
0.3
0.3
0.4
0.4
0.5
0.5
0.0 0.5 1.0 1.5 2.0 2.5Period (secs)
Spec
tral A
ccel
erat
ion
(g)
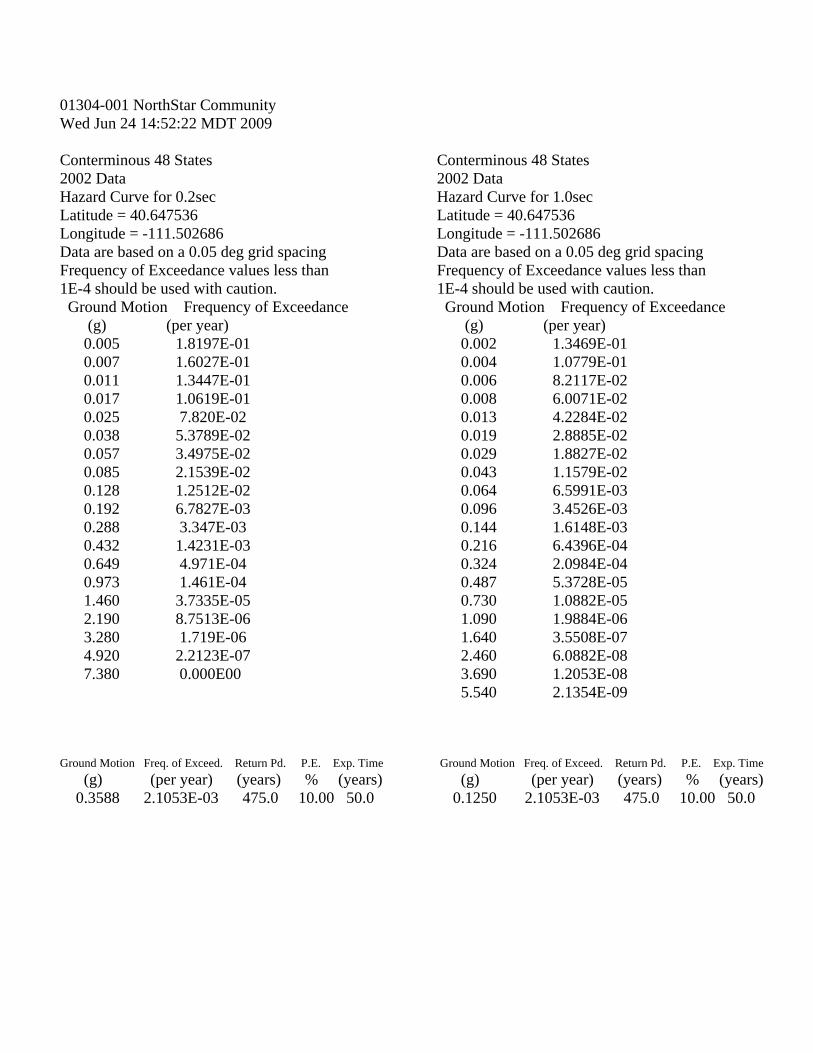
01304-001 NorthStar Community Wed Jun 24 14:52:22 MDT 2009 Conterminous 48 States 2002 Data Hazard Curve for 0.2sec Latitude = 40.647536 Longitude = -111.502686 Data are based on a 0.05 deg grid spacing Frequency of Exceedance values less than 1E-4 should be used with caution. Ground Motion Frequency of Exceedance (g) (per year) 0.005 1.8197E-01 0.007 1.6027E-01 0.011 1.3447E-01 0.017 1.0619E-01 0.025 7.820E-02 0.038 5.3789E-02 0.057 3.4975E-02 0.085 2.1539E-02 0.128 1.2512E-02 0.192 6.7827E-03 0.288 3.347E-03 0.432 1.4231E-03 0.649 4.971E-04 0.973 1.461E-04 1.460 3.7335E-05 2.190 8.7513E-06 3.280 1.719E-06 4.920 2.2123E-07 7.380 0.000E00 Ground Motion Freq. of Exceed. Return Pd. P.E. Exp. Time (g) (per year) (years) % (years) 0.3588 2.1053E-03 475.0 10.00 50.0
Conterminous 48 States 2002 Data Hazard Curve for 1.0sec Latitude = 40.647536 Longitude = -111.502686 Data are based on a 0.05 deg grid spacing Frequency of Exceedance values less than 1E-4 should be used with caution. Ground Motion Frequency of Exceedance (g) (per year) 0.002 1.3469E-01 0.004 1.0779E-01 0.006 8.2117E-02 0.008 6.0071E-02 0.013 4.2284E-02 0.019 2.8885E-02 0.029 1.8827E-02 0.043 1.1579E-02 0.064 6.5991E-03 0.096 3.4526E-03 0.144 1.6148E-03 0.216 6.4396E-04 0.324 2.0984E-04 0.487 5.3728E-05 0.730 1.0882E-05 1.090 1.9884E-06 1.640 3.5508E-07 2.460 6.0882E-08 3.690 1.2053E-08 5.540 2.1354E-09 Ground Motion Freq. of Exceed. Return Pd. P.E. Exp. Time (g) (per year) (years) % (years) 0.1250 2.1053E-03 475.0 10.00 50.0

Moisture Content and Unit Weight of Soil(In General Accordance with ASTM D2937 and D2216) © IGES 2006
Project:No:
Location:Date:
By:
Boring No.Sample Northstar
DepthSplit
Split sieveTotal sample (g)
Moist coarse fraction (g)Moist split fraction (g)Sample height, H (in)
Sample diameter, D (in)Wt. rings + wet soil (g)
Wt. rings/tare (g)Moist unit wt., γm (pcf)
Wet soil + tare (g)Dry soil + tare (g)
Tare (g)Moisture content (%)
Wet soil + tare (g) 164.48Dry soil + tare (g) 141.83
Tare (g) 37.66Moisture content (%) 21.7
21.7
Entered by:___________Reviewed:___________ Z:\PROJECTS\01304\001\[MDv2.xls]1
JDF
Northstar HOA Rockery01304-001Park City, UT6/30/2009
Dry Unit Wt., γd (pcf)
Sam
ple
Info
.
Moisture Content, w (%)
Moi
stur
e D
ata

Liquid Limit, Plastic Limit, and Plasticity Index of Soils(ASTM D4318) © IGES 2004
Project: Boring No.:No: Sample:
Location: Depth:Date: Description:
By:Preparation method:
Liquid limit test method:Plastic Limit
Determination No 1 2Wet Soil + Tare (g) 7.25 7.72Dry Soil + Tare (g) 6.54 6.93
Moisture Loss (g) 0.71 0.79Tare (g) 1.39 1.33
Dry Soil (g) 5.15 5.60Moisture Content, w (%) 13.79 14.11
Liquid LimitDetermination No 1 2 3
Number of Drops, N 35 27 20Wet Soil + Tare (g) 15.25 15.87 17.28Dry Soil + Tare (g) 11.44 11.85 12.75
Moisture Loss (g) 3.81 4.02 4.53Tare (g) 1.37 1.37 1.34
Dry Soil (g) 10.07 10.48 11.41Moisture Content, w (%) 37.84 38.36 39.70
One-Point LL (%) 39 39
Liquid Limit, LL (%)Plastic Limit, PL (%)
Plasticity Index, PI (%)
Entered by:___________Reviewed:___________ Z:\PROJECTS\01304\001\[ALv1.xls]1
Northstar Brown clay
JA
Northstar HOA Rockery01304-001Park City, UT7/2/2009
25
Air DryMultipoint
3914
Plasticity ChartA-Line
U-Line
ML
CL
CL-ML
MH
CH
0
10
20
30
40
50
60
0 10 20 30 40 50 60 70 80 90 100Liquid Limit (LL)
Plas
tic In
dex
(PI)
Flow Curve
LL = 39
37.5
38
38.5
39
39.5
40
10 100Number of drops, N
Moi
stur
e co
nten
t (%
)

Direct Shear Test for Soils Under Drained Conditions(ASTM D3080) © IGES 2006
Project: Boring No.:No: Sample:
Location: Depth:Date: Sample Description:
By: Sample type:Dry unit weight 115 pcf
Test type: at 21.7 (%) wHorizontal deformation (in.): 0.3 Compaction specifications: Provided by client
Shear rate (in./min): 0.0021
Normal stress (psf)Peak shear stress (psf)
Horizontal deformation at peak(in)Initial Final Initial Final Initial Final
Sample height (in) 1.0000 0.9978 1.0000 0.9914 1.0000 0.9841Sample diameter (in) 2.416 2.416 2.416 2.416 2.416 2.416
Wt. rings + wet soil (g) 205.22 206.56 203.90 203.65 207.76 206.88Wt. rings (g) 43.30 43.30 41.98 41.98 45.84 45.84
Wet soil + tare (g) 265.24 183.22 265.24 182.46 265.24 204.77Dry soil + tare (g) 243.47 153.75 243.47 154.40 243.47 177.29
Tare (g) 140.81 21.07 140.81 20.92 140.81 43.55Water content (%) 21.2 22.2 21.2 21.0 21.2 20.5
Dry unit weight (pcf) 111.0 111.3 111.0 112.0 111.0 112.8φ (deg) 17 Average of 3 samples Initial Finalc (psf) 450 Water content (%) 21.2 21.3
Dry unit weight (pcf) 111.0 112.0
Regression Total stress array Line fitR2 = 0.88 Table m b σn (psf) τf (psf)
Intercept (b) = 450.37 m 0.31 450.37 0.00 450.37Slope (m) = 0.31 se(n) 0.11 75.10 1100.00 795.18
φ (deg) = 17.40 R2 0.88 65.46c (psf) = 450.37 F 7.49 1.00
ss (reg) 32099.27 4284.73
Normal stress (psf) 200 500 1000Peak shear stress (psf) 480 660 744
Comments:
Entered by:___________Reviewed:___________ Z:\PROJECTS\01304\001\[DSv2.xls]1
0.125
Unable to obtain requested compaction specification. The requested compacion specification exceeded the available compactive effort in the laboratory.
7/2/2009JDF
Brown clay
0.060 0.065
Inundated
200744
Northstar
Sample 3
Laboratory compacted
Northstar HOA Rockery01304-001Park City, UT
Sample 2Sample 11000
480500660
0100200300400500600700800
0.00 0.05 0.10 0.15 0.20 0.25 0.30
Shea
r st
ress
(psf
)
0
200
400
600
800
1000
1200
0 200 400 600 800 1000 1200
Normal stress (psf)
Shea
r st
ress
(psf
)
Normal stress = 200 psfNormal stress = 500 psfNormal stress = 1000 psf
-0.0050.0000.0050.0100.0150.0200.0250.0300.0350.040
0.00 0.05 0.10 0.15 0.20 0.25 0.30Horizontal deflection (in)
Axi
al d
efle
ctio
n (in
)

1
2
3
4
5
6
0 1 2 3 4
She
ar s
tress
(ksf
)
Normal stress (ksf)
Analysis of Rock Strength using RocLab
Hoek-Brown Classificationintact uniaxial comp. strength (sigci) = 1500 ksfGSI = 20 mi = 13 Disturbance factor (D) = 0.7intact modulus (Ei) = 450000 ksfmodulus ratio (MR) = 300
Hoek-Brown Criterionmb = 0.160 s = 9.22e-6 a = 0.544
Mohr-Coulomb Fitcohesion = 0.812 ksf friction angle = 48.45 deg
Rock Mass Parameterstensile strength = -0.086 ksfuniaxial compressive strength = 2.743 ksfglobal strength = 60.686 ksfdeformation modulus = 11937.22 ksf