Signals and Systems With MATLAB Computing and Simulink Modeling - Steven T. Karris

Appendix A. RF Signals Simulink Models
RF Signals for Indoor GRFS Systems
RF Signals for Wireless Networks
Figure A.1 includes a description of a baseband model of an IEEE® 802.11a
physical layer WLAN [1]. The model supports all mandatory and optional data
rates: 6, 9, 12, 18, 24, 36, 48, and 54 Mb/s. The demo also illustrates adaptive
modulation and coding over a dispersive multipath fading channel, whereby the
simulation varies the data rate dynamically. Note that the model uses an artificially
high channel fading rate to make the data rate change more quickly and thus make
the visualization more animated and instructive [1].
The demonstration contains components that model the essential features of the
WLAN 802.11a standard. The top row of block contains the WLAN 802.11
transmitter components as illustrated in Fig. A.2; while the bottom row contains
the receiver components as depicted in Fig. A.2 [1]. Further details about this block
can be obtained in [1].
Figure A.4 illustrates Simulink simulation results of the Simulink Block diagram
of Fig. A.1. Starting from top to bottom and from left to right we have:
1. TX Data: the transmitter binary data stream.
2. Un-equalized signal: the I and Q of the unequalized received signal.
3. RX power spectrum (dB): the double sided RX power spectrum in (dB).
4. SNR (dB): the signal-to-noise ratio at the input of the receiver in (dB).
5. Equalized signal: equalized I and Q symbols. Current plot in Fig. A.4 shows 64
QAM modulation. (Other forms of modulation are BPSK, QPSK, 16 QAM, 64
QAM as shown in Fig. A.3).
6. Equalized power spectrum: equalized power spectrum after the equalization on
the receiver side.
7. Bit rate (Mb/s): variable bit rate of theWLAN. Current plot in Fig. A.4 shows bit
rates on 24, 36, 48 Mb/s.
I. Progri, Geolocation of RF Signals,DOI 10.1007/978-1-4419-7952-0, # Springer ScienceþBusiness Media, LLC 2011
301

Figure A.5 provides a description of the baseband Simulink block diagram of
IEEE® 802.11b WLAN Physical Layer.
Figure A.6 shows a description of the baseband Simulink block diagram of
IEEE® 802.11b WLAN Physical Layer Transmitter (Top) and Receiver (Bottom).
Figure A.7 presents a description of the baseband Simulink block diagram of
IEEE® 802.11b WLAN Physical Layer instrumentation (left) and instruments
Fig. A.1 A description of the Simulink block diagram of IEEE® 802.11a WLAN Physical Layer.
Reprinted with permission copyright # 2006–2009 The MathWorks, Inc. [1]
Fig. A.2 A description of the Simulink block diagram of IEEE® 802.11a WLAN Physical Layer
Transmitter and Receiver. Reprinted with permission copyright # 2006–2009 The MathWorks,
Inc. [1]
302 Appendix A. RF Signals Simulink Models

Fig. A.4 A description of Simulink simulation of the IEEE® 802.11a WLAN Physical Layer.
Reprinted with permission copyright # 2006–2009 The MathWorks, Inc. [1]
Fig. A.3 A description of the Simulink block diagram of IEEE® 802.11a WLAN Physical Layer
Receiver Demodulator showing BPSK, QPSK, 16-QAM, and 64-QAM demodulation. Reprinted
with permission copyright # 2006–2009 The MathWorks, Inc. [1]
RF Signals for Indoor GRFS Systems 303

(right). Figure A.8 offers a description of the baseband Simulink block diagram of
IEEE® 802.11b WLAN Physical Layer BER meters and Fig. A.9 summarizes a
description of Simulink simulation results of the baseband IEEE® 802.11b
Fig. A.5 A description of the baseband Simulink block diagram of IEEE® 802.11b WLAN
Physical Layer. Reprinted with permission copyright # 2006–2009 The MathWorks, Inc. [2]
Fig. A.6 A description of the baseband Simulink block diagram of IEEE® 802.11b WLAN
Physical Layer Transmitter (top) and Receiver (bottom). Reprinted with permission copyright
# 2006–2009 The MathWorks, Inc. [2]
304 Appendix A. RF Signals Simulink Models

WLAN Physical Layer. Other WLAN Simulink forms of the IEEE 802.11 are
very similar with 802.11a and 802.11b; therefore, we leave them as an exercise for
the reader.
Fig. A.7 A description of the baseband Simulink block diagram of IEEE® 802.11b WLAN
Physical Layer instrumentation (left) and instruments (right). Reprinted with permission copyright
# 2006–2009 The MathWorks, Inc. [2]
Fig. A.8 A description of the baseband Simulink block diagram of IEEE® 802.11b WLAN
Physical Layer BER meters. Reprinted with permission copyright# 2006–2009 The MathWorks,
Inc. [2]
RF Signals for Indoor GRFS Systems 305
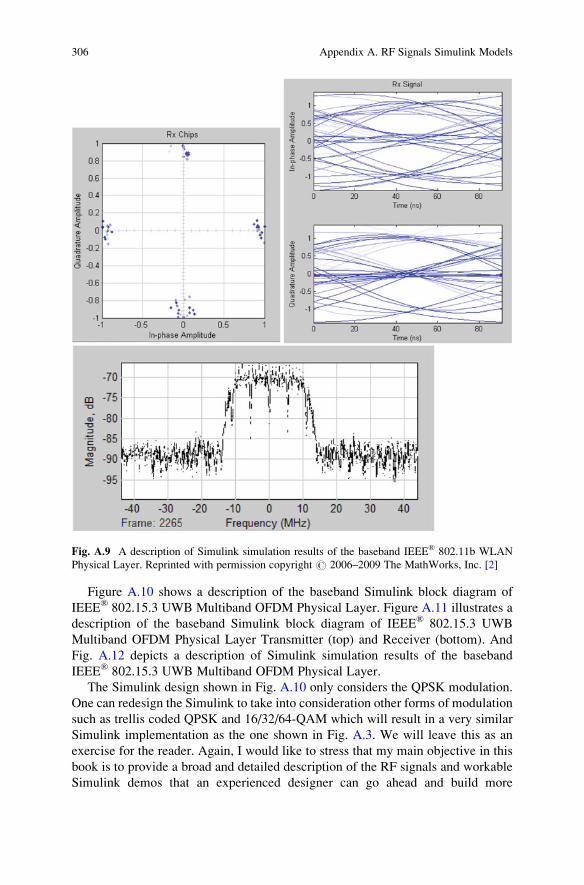
Figure A.10 shows a description of the baseband Simulink block diagram of
IEEE® 802.15.3 UWB Multiband OFDM Physical Layer. Figure A.11 illustrates a
description of the baseband Simulink block diagram of IEEE® 802.15.3 UWB
Multiband OFDM Physical Layer Transmitter (top) and Receiver (bottom). And
Fig. A.12 depicts a description of Simulink simulation results of the baseband
IEEE® 802.15.3 UWB Multiband OFDM Physical Layer.
The Simulink design shown in Fig. A.10 only considers the QPSK modulation.
One can redesign the Simulink to take into consideration other forms of modulation
such as trellis coded QPSK and 16/32/64-QAM which will result in a very similar
Simulink implementation as the one shown in Fig. A.3. We will leave this as an
exercise for the reader. Again, I would like to stress that my main objective in this
book is to provide a broad and detailed description of the RF signals and workable
Simulink demos that an experienced designer can go ahead and build more
Fig. A.9 A description of Simulink simulation results of the baseband IEEE® 802.11b WLAN
Physical Layer. Reprinted with permission copyright # 2006–2009 The MathWorks, Inc. [2]
306 Appendix A. RF Signals Simulink Models

Fig. A.10 A description of the baseband Simulink block diagram of IEEE® 802.15.3 UWB
Multiband OFDM Physical Layer. Reprinted with permission copyright# 2006–2009 The Math-
Works, Inc. [3]
Fig. A.11 A description of the baseband Simulink block diagram of IEEE® 802.15.3 UWB
Multiband OFDM Physical Layer Transmitter (top) and Receiver (bottom). Reprinted with
permission copyright # 2006–2009 The MathWorks, Inc. [3]
RF Signals for Indoor GRFS Systems 307

Fig. A.12 A description of Simulink simulation results of the baseband IEEE® 802.15.3 UWB
Multiband OFDM Physical Layer. Reprinted with permission copyright# 2006–2009 The Math-
Works, Inc. [3]
308 Appendix A. RF Signals Simulink Models

sophisticated and more realistic Simulink models and run more accurate simulation
results which are as close to the real life as possible.
RF Signals for Urban GRFS Systems
RF signals for urban GRFS systems include: (1) RF signals for mobile systems and
metropolitan area networks (MAN) in Sect. A.2.1.
RF Signals for Mobile Systems and Metropolitan Area Networks
Figure A.13 depicts a description of the baseband Simulink block diagram of
CDMA2000 Physical Layer. Figure A.14 shows a description of the baseband
Simulink block diagram of CDMA2000 Physical Layer Transmitter (first two top
plots) and Receiver (bottom two top plots). Figure A.15 illustrates a description of
the baseband Simulink simulation results block diagram of CDMA2000 Physical
Layer [4].
Figure A.16 indicates a description of the baseband Simulink block diagram of
IEEE 802.16-2004 OFDM Physical Layer Including Space–Time Block Coding.
Figure A.17 presents a description of the baseband Simulink block diagram of IEEE
802.16-2004 OFDM Physical Layer Including Space–Time Block Coding Trans-
mitter (top) and Receiver (bottom). And Fig. A.18 shows a description of the
Fig. A.13 A description of the baseband Simulink block diagram of CDMA2000 Physical Layer.
Reprinted with permission copyright # 2006–2009 The MathWorks, Inc. [4]
RF Signals for Urban GRFS Systems 309

baseband Simulink simulation results of IEEE 802.16-2004 OFDM Physical Layer
Including Space–Time Block Coding [5].
RF Signals for Satellite GRFS Systems
For the purpose of this book and for the purpose of this chapter, the satellite signals
of interests are those used as part of RF signals for Global Navigation Satellite
Systems (GNSS); (2) communications connectivity for voice, data, video, and
Fig. A.14 A description of the baseband Simulink block diagram of CDMA2000 Physical Layer
Transmitter (first two top plots) and Receiver (bottom two top plots). Reprinted with permission
copyright # 2006–2009 The MathWorks, Inc. [4]
310 Appendix A. RF Signals Simulink Models

picture as treated in Sect. A.3.1 and part of the RF signals for satellite television
technology (STT).
RF Signals for Satellite Television Technology
Figure A.19 depicts a description of a baseband Simulink block diagram of the RF
Satellite Link [6] which starts with: (1) a satellite downlink transmitter (see
Fig. A.20 (top)); (2) the downlink path (free space path loss) and Doppler and
Fig. A.15 A description of the baseband Simulink simulation results block diagram of
CDMA2000 Physical Layer. Reprinted with permission copyright# 2006–2009 The MathWorks,
Inc. [4]
RF Signals for Satellite GRFS Systems 311

Fig. A.16 A description of the baseband Simulink block diagram of IEEE 802.16-2004 OFDM
Physical Layer Including Space–Time Block Coding. Reprinted with permission copyright
# 2006–2009 The MathWorks, Inc. [5]
Fig. A.17 A description of the baseband Simulink block diagram of IEEE 802.16-2004 OFDM
Physical Layer Including Space–Time Block Coding Transmitter (top) and Receiver (bottom).Reprinted with permission copyright # 2006–2009 The MathWorks, Inc. [5]
312 Appendix A. RF Signals Simulink Models

phase error (phase and frequency offset); (3) Ground station downlink receiver (see
Fig. A.20 (bottom)). Figure A.20 shows a description of a baseband Simulink block
diagram of the RF satellite link transmitter (top) and receiver (bottom) [6]. As
shown in Fig. A.20 (top), the Satellite downlink transmitter block diagram contains
a random integer generator, a rectangular 16-QAM modulator, a square root raised
cosine filter, a high power amplifier, and Tx dish antenna. In Fig. A.20 (bottom),
the ground station downlink receiver shows the Rx dish antenna gain, the phase
noise, the I/Q imbalance, DC removal, magnitude AGC, Doppler and phase com-
pensation, raised cosine receive filter, and the rectangular 16-QAM. Figure A.21
presents simulation results of a baseband Simulink block diagram of the RF
Satellite Link [6]. The top plot shows the Tx and Rx spectrum in (dB) versus
the frequency (Hz). In the pass-band, (40 kHz double side band centered at the
0 Hz line) both the Tx and Rx spectrum overlap with each other; however, in the
stop-band, the Tx spectrum is below the Rx spectrum due to noise and other channel
impairments such as Doppler and Phase rotation, I/Q imbalance etc. in the Rx
signal. Next, we have the constellations before and after high power amplifier in
Fig. A.18 A description of the baseband Simulink simulation results of IEEE 802.16-2004
OFDM Physical Layer Including Space–Time Block Coding. Reprinted with permission copyright
# 2006–2009 The MathWorks, Inc. [5]
RF Signals for Satellite GRFS Systems 313

Fig. A.21 (plots 2 and 3 from the top). The last two plots of Fig. A.21 are the end-to-
end constellation scatter plot which clearly indicates that the 16-symbol-signals as
shown in Ref [6]. This concludes the example of a voice satellite radio RF link
Simulink demo and all the other Simulink demos in the book.
Fig. A.19 A description of a baseband Simulink block diagram of the RF Satellite Link.
Reprinted with permission copyright # 2006–2009 The MathWorks, Inc. [6]
Fig. A.20 A description of a baseband Simulink block diagram of the RF Satellite Link Trans-
mitter (top) and Receiver (bottom). Reprinted with permission copyright # 2006–2009 The
MathWorks, Inc. [6]
314 Appendix A. RF Signals Simulink Models

RF Signals for Satellite GRFS Systems 315

This concludes the Simulink demo case studies of this first edition because we
have provided enough case studies to illustrate some of the hottest signal designs in
the communications world. Other signal designs such as Satellite TV, Video
Broadcasting, GPS etc. can be illustrated in the same manner as these which we
might include them either in separate publications or in future editions of this book.
References
1. Demo of an end-to-end baseband model of the physical layer of a wireless local area network
(WLAN) according to the IEEE® 802.11a standard. The MathWorks, Inc., Copyright
2006–2009, MATLAB and Simulink 2009b.
Fig. A.21 A description of a baseband Simulink simulation results of IEEE 802.16-2004 OFDM
Physical Layer Including Space–Time Block Coding. Reprinted with permission copyright
# 2006–2009 The MathWorks, Inc. [6]
316 Appendix A. RF Signals Simulink Models

2. Demo of an end-to-end baseband model of the physical layer of a wireless local area network
(WLAN) according to the IEEE® 802.11b standard. The MathWorks, Inc., Copyright
2006–2009, MATLAB and Simulink 2009b.
3. Demo of an end-to-end baseband model of the physical layer of a Ultra Wide Band (UWB)
Multiband OFDM according to the IEEE® 802.15.3a standard The MathWorks, Inc., Copyright
2006–2009, MATLAB and Simulink 2009b.
4. Demo of an end-to-end baseband model of the physical layer of the CDMA2000 standard. The
MathWorks, Inc., Copyright 2006–2009, MATLAB and Simulink 2009b.
5. Demo of an end-to-end baseband model of the physical layer of the IEEE 802.16-2004 OFDM
including Space-Time Block Coding. The MathWorks, Inc., Copyright 2006–2009, MATLAB
and Simulink 2009b.
6. Demo of an end-to-end baseband model of the physical layer of the RF Satellite Link. The
MathWorks, Inc., Copyright 2006–2009, MATLAB and Simulink 2009b.
References 317