
Appendix A Construction Exhaust Calculations - … A...Page: 2 4/1012008 9:38:48 AM Construction...
26
Appendix A Construction Exhaust Calculations
Transcript of Appendix A Construction Exhaust Calculations - … A...Page: 2 4/1012008 9:38:48 AM Construction...

Appendix A
Construction Exhaust Calculations

Page: 1
411012008 9:39:24 AM
Urbernis 2007 Version 9.2.4
Combbed 'Annual Emissions Reports (TonsNear)
File Name: C:\Documents and Settings\klassenj\Desktop\Van Der Kooi Dairy (Site Grading).urb924
Project Name: Van Der Kooi Dairy
Project Location: Fresno County
On-Road Vehicle Emissions Based on: Version : Emfac2007 V2.3 Nov 1 2006 . . . . .
Off-Road Vehicle Emissions Based on: OFFROAD2007
Summary Report:
CONSTRUCTION EMISSION ESTIMATES
i?Lx NOx a S02 PMlO Dust PMIO Exhaust PMlo PM25 Dust PM2.5 E!!?LU a-2 .wlaEt
2005 TOTALS (tonslyear unm~t~gated) 0 06 0 43 0 2 1 0 0 0 35 48 0 02 35 50 7 41 0.02 7 43 32.57


Page: 1
4/1012008 9:38:48 AM
Urbemis 2007 Version 9.2.4
Combined Annual Emissions Reports (Tonsffear)
File Name: C:\Documents and Settings\klassenj\Desktop\Van Der Kooi Dairy (Site Grading).urb924
Project Name: Van Der Kooi Dairy
Project Location: ~ r e s n o County
On-Road Vehicle Emissions Based on: Version : Emfac2007 V2.3 Nov 1 2006
Off-Road Vehicle Emissions Based on: OFFROAD2007
Summary Report:
CONSTRUCTION EMISSION ESTIMATES
a !Kb - CO 502 PM10 Dust PM10 Exhaust
2005 TOTALS (tonslyear unm~t~gated) 0 13 1 1 6 0 7 1 0 00 35 48 0 05
PMIO PM2.5 Dust
35.53 7.41
mLL5 w Exhaust
0.05 7.45

Page: 2
4/1012008 9:38:48 AM
Construction Unmitigated Detail Report:
CONSTRUCTION EMISSION ESTIMATES Annual Tons Per Year, Unmitigated
Mass Grading 0110112005- 06130/2005
Mass Grading Dust
Mass Grading Off Road Diesel 0.1 3
Mass Grading On Road Diesel 0.00
Mass Grading Worker Trips 0.00
PMIO Dust PMIO Exhausl
35.48 0.05
35.48 0.05
35.48 0.00
0.00 0.05
Phase Assum~tions
Phase: Mass Grading 11112005 - 613012005 - Default Fine Site Grading Description
Total Acres Disturbed: 110 . .
Maximum Daily Acreage Disturbed: 27.5
Fugitive Dust Level of Detail: Default
20 Ibs per acre-day
On Road Truck Travel (VMT): 0
Off-Road Equipment:
1 Rubber Tired Dozers (357 hp) operating at a 0.59 load factor for 8 hours per day


m - .- (I)
a, C .- u - - 3
2 n u! 0 0 N . 0
2 u!
0 0
$! 7 . 7
0) .- u 2 (3 (0 In
2 . . a, In m L1 a
e 0 c CO L 0 + z .-. 0 2 u m - N
2 .-. m 0)
.- + 2 a, a - 0. LI m 7
Z e a, a
$ (I)
N

Page: 1
411012008 9:37:45 AM
Urbemis 2007 Version 9.2.4
Combined Annu'al Emissions Reports (TonsNear)
File Name: C:\Documents and Settings\klassenj\Desktop\Van Der Kooi Dairy (Site Grading).urb924
Project Name: Van Der Kooi Dairy
Project Location: Fresno County
On-Road Vehicle Emissions Based on: Version : Emfac2007 V2.3 Nov 1 2006
Off-Road Vehicle Emissions Based on: OFFROAD2007
S:u.min
CONSTRUCTION EMISSION ESTIMATES
ROG !!ox - CO - SO2 PMIO Dust PMIO Fxhaust PMIO PM2.5 Dust i3&,5 m.23 Lx2 Exhaust
2005 TOTALS (tonslyear unmit~gated) 0.08 0.58 0.28 0 00 35.48 0 03 35 51 7.41 0.03 7.44 43.51

Page: 2
Construction Unmitigated Detail Report:
CONSTRUCTION EMISSION ESTIMATES Annual Tons Per Year, Unmitigated
Mass Grading 0110112005- 06/30/2005
Mass Grading Dust
Mass Grading Off Road Diesel 0.07 0.58 0.26
Mass Grading On Road Diesel 0.00 0.00 0.00
Mass Grading Worker Trips 0.00 0.00 0.02
phase Assumat~ons
Phase: Mass Grading 11112005 - 613012005 - Default Flne Site Grading Description
Total Acres Disturbed: 110
Maximum Daily Acreage Disturbed: 27.5
Fugitive Dust Level of Detail: Default
20 Ibs per acre-day
On Road Truck Travel (VMT): 0
Off-Road Equipment:
1 Graders (174 hp) operating at a 0.61 load factor for 8 hours per day
S112 pMlO Dust PMIO Exhaust EM2.5 Dust .eMZki ix!2

Page: 1
411 012008 9:40:18 AM
Urbemis 2007 Version 9.2.4
Combined Annual Emissions Reports (TonsNear)
File Name: C:\Documents and Settings\klassenj\Desktop\Van Der Kooi Dairy (Site Grading).urb924
Project Name: Van Der Kooi Dairy
Project Location: Fresno County
On-Road Vehicle Emissions Based on: Version : Emfac2007 V2.3 Nov 1 2006
Off-Road Vehicle Emissions Based on: OFFROAD2007
CONSTRUCTION EMISSION ESTIMATES
KG N i b PMlO Dust PMlO Exhaust PM2.5 Dust f3u Ebdzi '222 Exhaus t .
2005 TOTALS (tonslyear unmitigated) 0.09 0.90 0.27 0.00 35.48 0.03 35.51 7.41 0.03 7.44 72.95

Page: 2
411 012008 9:40:18 AM
Construction Unm~l~gated Detail Report:
CONSTRUCTION EMISSION ESTIMATES Annual Tons Per Year, Unmitigated
Mass Grading 0110112005- 0613012005
Mass Grading Dust
Mass Grading Off Road Diesel 0.09 0.90 0.23
Mass Grading On Road Diesel 0.00 0.00 0.00
Mass Grading Worker Trips 0.00 0.00 0.05
Phase Assumotions
Phase: Mass Grading 11112005 - 613012005 - Default Fine Site Grading Description
Total Acres Disturbed: 11 0
Max~mum Daily Acreage Disturbed: 27.5
Fugitive Dust Level of Detail: Default
20 Ibs per acre-day
On Road Truck Travel (VMT): 0
Off-Road Equipment:
2 Water Trucks (1 89 hp) operating at a 0.5 load factor for 8 hours per day
PMIO Dust P M l O E W W PM2.5 Dust P ! U B k U LXz
0.00 35.48 0.03 35.51 7.41 0.03 7.44 72.95
0.00 35.48 . 0.03 35.51 7.41 0.03 7.44 72.95
0.00 35.48 0.00 35.48 7.41 0.00 7.41 0.00
0.00 0.00 0.03 ' 0.03 0.00 0.03 0.03 69.65

Appendix B
Operational Emissions Calculations

Green House Gas Emissions Calculations
' GHG Emission Factors were obtained from ARB'S document entitled "Draft Documentation of California's Greenhouse Gas Inventory" http:llwww.arb ca.govlcclcceilinventorylinventory.php
Since the existing lagoons at Charles Van Der Kooi Dairy are currently not subject to New Source Review requirements such as Best Available Control Technology, it is assumed that they are not being operated as proper treatment lagoons. Lagoons that are not properly designed or operated have the potential of emitting large amounts of VOC emissions but inhibit methane production. Therefore, the ARB methane Emission Factor of 377.2 Ibs-CH4Iyr will be reduced by 40% when calculating emissions from the existing (grandfathered) phase of the operation. For post-project calculations, it is assumed that all liquid manure is treated in a properly designed and properly operated treatment lagoon that maximizes Methane production while minimizing VOC production. Charles Van Der Kooi dairy has proposed to use phototrophic treatment lagoons. Due to lack of data specific to the efficacy of phototrophic treatment lagoons, it is assumed that these types of lagoons are similar to NRCS-designed anaerobic treatment lagoons in treatment efficiency.
*Dry Cow EF was assumed to be similar to milk cows.
**Calf EF was assumed to be similar to medium and small heifers.

Methane Emissions Calculations
Pre-Project Potential to Emit (PEA 1

Total Pre-Project Emissions =
Post-Proiect Potential to Emit (PE2)
.
'
. . . . . . . . . . ? . . . . . . . . . . . . ............. . . . . . . . . ,.:; >.:. . : . . . . . . . . . . . .
. . . . . . . . . . . . . . . ', ' :.::,;:':, :! ; : ~ : ~ ~ ~ ; ~ ~ ~ ~ ; ~ : ~ f ~ ~ ~ ; ~ ~ ~ ~ g ; ~ i . ~ ~ ~ ; ; ; ( ; ~ ~ $ ~ i ~ ~ p ~ ~ ; : ~ ' & ~ ~ g f l Q ; ~ i j ~ ~ , i ~ ~ ; ; ~ ~ ~ ~ ~ ~ ; ; ; $ ~ ~ ; ~ . ~ ; ~ ~ : ~ ~ ~ ~ & ; < ~ , ~ $ ~ ; $ : ' ~ j ~ ~ ~ ~ ~ > ; , ; , ~ $ ~ ~ $ ~ . . . . . . . . . . . . . . . . . . . . . . . . . . . . . . . . . : :..>.. ....., ... ......, ,L,;.. , .,,, ., ,.,.... ..: .... >. ,;.,,.,! . . . .? &,,,.-,.,, ... ...; ;,,,, .,~,yw 4s,+,%: , . , cX..,. ~:i-,-a~;I~,~,~.co.co,,.co~iii:.,~~~~;~~iiiZZ;,'i.'i.~ ,:,..; ~j.i;y>:.;::6:ii:i::yii:i.:<dj~:;::jii'dj$$$
Post-Project Emissions Prior to Mitigation
tons- CH4Iyr ' ' Type of Cow
Milking Cow # of Cows
1700 92.98 ' " 24.52 .
0.00 '0.00 0.00
0.00
'0.00 ; 11 7.50
g;:~~$;~~~~~.>~;;;:x~:*.fg;Fzx: :i.E..I F:r:~pf:sq~~1~~5~~:~~LI~~~iee
I'.'-'L".. ... *T .1 111.
~ ~ j ; g ; ~ ~ t ~ ~ ~ 8 ~ ; ; ~ ~ g :~~~~~?,~,~.?;~2~~,~:;~~;~~~w$%~!~
; ~ ~ g : : ~ : ~ ~ ~ ~ ~ ~ ; : & ~ ~ : ; g + z ~ ~ ~ ~ 1 ~ ~ ~ ~ 8 ' ~ ~ ~ ~ ~ ~ 2 2 2 ~ ~ 8 ~ r 2 ~ ~ ~ ~ ~ ~ ~ 2 $ ~ ~ -.
Man " re , bs-hd-yr) 3 77; 2
Dry COW
Heifer (1 5-24 mon) Heifer (7-14 mon) Heifer (4-6 mon)
Calf (under 3 mon) Feedlot CattleIBulls
Total
250
0 0 0
0
0 1950
; : : ; j~)) ; , .~~~~;$$$g$j~:: . ,~.y j i&'Z;.:;$x, ..;: ..,j::!.x:,.:; .r::y,..: :,;: *!,? 2-.:+: . . . . <.,-... .... : .,... :.. ... ,?.., ,>.'..;<.?,
~ ~ ~ i ~ , : g $ ~ , ~ ~ & # ~ & ~ ~ ~ y';; ;.9,;yy;:.r:.! :"..>:::% :::.$>.
;~;~$~~~~&~~::x.:~:;?~:+ \;o::. ~L:L2ectdk~:.va. ':$4>;J::,:. sx;<+$ ;;~y;~;~A~;;$~J~~~2;~$;~:& :<;2v . bv>c>..e. ;; ,,:'<<<5k$ ": ~ , ~ ~ ~ ~ ~ ~ ~ , ~ , ~ . ~ ,,,,x>
<"" -... ,:.%c.>hs*<m ~ : ~ ~ J ~ $ @ ~ ~ ~ ~ $ '" ",.."""?~^ ' '<" 1:;"'P". #pk %j;:+:fi:&g3+:;$$!@i:;iL ,; - ,.,.. .+... ... ., , . . , r s z s ~ X : ; ~ ; $
377.2
5.4 5.4
~;~~j><:::?.$c*~*;~$G~ P;-;::,Z~:;~~ 2$gs .....-... ....."..'""".-'E."%.k"
~ ~ ~ 3 ~ + p ~ ; 2 ~ ~ G g ~ ; :*, ;;{gc$&~;:$g~$
~ ; , : ; ~ ~ ~ + ~ ~ s c ~ ~ ~ ~ : ~ ; ~ .* ....& .+s5, :ix?'~'~,i2y
5,4 .
5.4 . .
6.2
~;2zfi~2,2,?~g#2~j;;7?~. ;,:: &::y:;tr~n ...... ., .. .,~ ,,,,< , , . ,,, ,.-;;;;:;;; ;;;:;;,;.y.;;;;;:,;y*;:#';;~\*";f::;,::; ;$><:<; :... .,<, > . ~ , ... ,,".2:;~,!~>A.:?;,2 ': 'x,. .*,>\,e,....v,: y.<<;
:<% ,:;,> ,>.;tx;A:3*,:<; :~ ..* .- ..:. .xzx>A.v.
..*,.+ , : , ; t~~~; jg ,qo~~j ,z ;$ :~~ A
y~ii'.;:JL;;~,~~:';,:oo?~i;~~~$,>;:Bi ;:: $c?,26zp riii$g7/02; ..:: ii~%z?&
I>:;?;>* .*..g$$v;$i-.aje;<<!.z ( n ; i $ j ; $ ~ ~ ~ $ $ ~ ~ ~ ~ ~ ; $
:;y:~i"b;<zki<~;z&~;;$>~s y,:;;%+:;2.y; >. . x>b<5xx @zx'<-d"~. ." . >>,% $y; ; :g ; <**, ,2.;-k> >V," x*q*%-m,..,..
g;i"i#g$g@g ' < ' : r , " ~ ~ ~ ~ I p p m ~ j ~ ~ ; ~ ~ 5 ~ 7 ~ ~ z g ~ ~ ~ A g i ~ ; g i
,' "."""+".'̂ **' ' .?.,.. ' % " * " " ..... ',"' ........... *:Q: - .....,.,.. * \ ;;;$;;i~j;g~g~yr~<t:<\;;;";;;;; ." ,"A, ,?,%< ,?<,;s....., : .-;, *% :,+;: .......... ........... . . .. . . . . . . .s..<... ....... .:,,,: . ..,......... . .::.:, :,." .....:...... .$ . . . . . . . .,,, <!,,,* , !..,:*x>!: ;,;,.; < ,,; ;,<$, . . . . . . . '..'. ..< ..'.'.. . . . . . . ... . . ..< .,.:., .). .,.. ,. .......-.. .i ....... .. :..:.,. .--: ...................I.1........ ........ . .. .,. . . . ,""",..",. .... .. ;.. - " : :$ : ....;. ,,.. ... > "A ~c ..... :,.,, - .. <: ,:,, " . , . .,.
>-,;,"1 :>$l' ,;$:̂;;&:1.,: . ::. ;, ,:+: ;:;::(ii; . ,;.. . .,.,,,.,,, . . . . . . . . . . .....;,.. ... .:. .... ...XVA> :." " .,".. '. ,w : <. ,,> .!:> e:
6 $ ~ . c ~ ~ @ g $ ~ q : : : : ; j :;+,
" .' , . *." ,K<'%' ..... :; !;;;:;<>$jz;j :..:,< y.... .<b2>F ?;>: SF..,. e .. . . . ,." ,... ?, ... y F ."* .v'?.$:a,;~: ;., . ,". ..... >.A<'.<x7s.x;
. ,,. !x';,;. t.2+*$; &% 7 . . - \..:", . ,.3 <..pg<.:<
~ ; ~ ~ ~ ~ i ~ ~ ~ ~ ~ ~ ; ; Q ~ ~ ~ ~ : . ~ ~ ; ~ ; : ; ~ ~ ~ ~ & ~ ~ ~ ~ , ~ & ~ ~ ~ ~ , j ~ ~ ; ~ ~ ~ ~ ~ ~ , ~ ~ ~ ~ ; ! ~ . ~ $ & ~ ~ : : ~ ~ ~ ~ ~ ; ~ ~ ~ . ; ~ ~ ~ , <>.. .vi.%.* ...,.>.*.%.‘., . $ . *
...... ..i..x... . .." '." . *., ...... .*.r :, yji::: ;:2P;. .
-e.>+.3.,%....,!E2yA <. , ,,..." .::; x- ,,$: .: .>; -;$! i.:21-:l;:;1:::..:)* .:. .,. ..,.:. '.,,,,....: .,,%<: ... ;9sc;<g ; : {> ,~c~2:~~ i~+ :":;i:,:;~$:~~:~<~
k:: ......*<-.....- .. ..... ...... :%::~;.;$;:.'~.'.$?!:;:;5>ri?:~?q!v;:+<;:~~* ;;;: ,xa;y,; :::,!<;$;~~;~~$;*>:;)>;:!, ......... ">,s. ..,, " w \ " ,.,,. . d y . 2
.......'. <. rl.Yr...,~"i~~3c;%.~!:~:i.~?~d~k .:".:::;i:>i:3~.ljib;il$1<11ii<?j7ii:i.:,
.. >,;; ..,,. :.,,:, ,- ..=.. %. :%: s,.," T..,- 2s..z.%e. . .,. .."::>.: ., "\'iiiiii=~rl_ir('riiA-'x*-':*' :-:: -::;:j;.;.,..r!:'::?";" '-~i%~:;:~~~
;*2>>,:.< "? >,t<7c; $.!;ig&?:$i$;z;; !$:$~<~:$2t,$;f$~~f,$$~;j;?~;~

. . . . ........................:...........:. :..:.:,:.::.::. .;, .: ... :., . ( .. ;. . . . . . . . .................. . . . . . . . . . . . . : , : . . . . . . . < . . . . . . . . . . . . . . . . . , :. :, ,., , ,. ':'p:E~M:$fi;~~Q,;Ejj ($~.~i~;):~;{;~gi'd$~g&;~;$ij_&f;~$$~$;j;g;$:;jj;;(~;~q$. jl:j;i&Agw3 . . . . . . :.:::.> ,,.,,,,.
,<*.;: F .>,*, ..i.<.r,,.&<<.y~:,:*, . . . . ...:.... : : .
Type of Cow Milking COW Dry Cow
Heifer (1 5-24 mon) Heifer (7-14 mon) Heifer (4-6mon)
Calf (under 3 mon)
CattleIBulls
tons- .CH4/yr 92.98
, . 24.52
0.00 0;OO 0.00
2 . : ..... .>,> >>,. & ..,,, .. ,wlI. .. ..+ -.-.." *.;,;$ "< .!.,:?; $ ;;w; $?,,,:
~5~~~,~ii~.Fi2wci~~y2~: :,;; ( ~ $ y ~ , . j ; . ~ ~ ~ $ . . . , .. ,..,. :r.;.t::,::.. ... ..-... '..."..' . ̂ * . % '* !::; s,f;,.:!.,;.:?.:v2+!::t8:.:>; a,:;i. ::.:.:*ii':?:r:--:c
. . , : : ........... .: ...... , ... .+A.. . . .w*L. , ., .",% .,.. ) ... :d:
\ :>,,".,~".:. *.-.. %," .., " .., <.. .?. .., ,.>. ""x: ........ . c..A",.. '."., .:
? . .,>:; ;.::,::<c::<.?::.<:<.: .,, . ,,,,. . . ......,... .. :.,*. . . ' " -, . '.. ....... $ :,. ........ ........... .:, . . . ;..,..rpA ............. . .......... . . . . ...... ; "r * _ .,, . ; &': ....,. . % . * ".".,,"....is x:,&.;;<.;?,:>; ::::\$$<;:~3::,$
,$:?,;$ $27:y, ;,;:5i<*.j;; ;:;<;.:,y ~,~,~:3~,~cs~z~;; i~E~ ; .<2..i," ..%""'*"".̂,'.-'
ic5~:Gk.:~:~8,~~~z:&~+~ IX~*~T~~.~FI:~I.~T~,:>::L,,
;jc;J{-&T+@pM@ . I::"y":;$s,‘","By#., ................. 2 ; G,!iU~ieq-q2gtsv5%a ~ : ; ~ ~ 7 , , 2 : ~ % : ~ ~ , ~ ~ i ~ ~ ~ .," ,*. ;--..lr .. ̂ ^ " .,.- 2 ww- ";.iiFii225iiii.i LF*, -..a:lilXp . $$$s%w"igg2i . $p .Riz ,;:$Fflg
. . 0.00 . . ,-I 17.50
..... ,.,,~i.*,~*a., ... ,,-.:.; ,Z : ,.-> V,>i*'.,., ". .* ".......A. ...a, ,.,A "?" .w ,.:?<:.!";z;~ ;;;2:.< :,,">-,.%"x .AwA: cc*F.x >%,."<
4~ij~j.~.T~:~i~~.2:2;~~;z;j5qj~~;;~:. ~;;:s;~g~$~?;3;~:~&:<+;yr;;;: .~:~:;.;-;;;::,.;*iit~~dbB~'.~;:i"~~%
,.. ... ."%s'. ,-.,... s A.L. <xx. c66x/x.,..,%.a . ~ ~ ~ i : : ~ . ; ~ ~ ~ ~ : ! ~ ~ . ~ ~ 2 ~ ~ ; . ~ ~ t ~ ~ . , ~ G ~ ~ x . e ~ ~ : ~ r::;;ii:;::+::;zl. r,>-:<:i::::;;r:::;sii :, $'"%:;,' ;14bR;&;e@A.;IIB*@;;$j ... ... es ,,,-. ,",*,.. ... a"..., b-
,& .7., <..*6 ..* . .%.8..<".%.v"v'7dx.. .w <'< ' ..c., .,-., .. . . . .... %. s.: ..... .. ,,., %.
ad,,,?, x.*,: A%ha*.v. ..Ar<<7.,"4.......".*.. ... . . . ' . '". '"' : ..; "". .'".:'X"""'"..i!! .> .... !:*?":;.<;>.<'s..<>;y*$*.yL'!.. ;;;+ ... -. ........... >x,., ,...,..+".<,Ax /.L, .,., .<.: '.'* .. ."i . . . '"">" '. ... .... ..... . . . . . . . . . . . . . . . . ,.,-..,,..,,.-rs:::S ... .. . . .. -.-".i.. % i . : r ^r&..:*x *;..>:- *-." C* "\..,'\; ..,. l\l.i...il.<ill ..<. ...,*.(: '"",..'.: ,\LII>II , :w;<J.L"*;":, .**?;:$y::e>L:.;;:.,:$g~>:$a~* !$+>:'. ,w: ,*,,::: ' 2 " s . m % 5 " ' . k v
;rapj:;;-;;jmtfj$jg~;;: ."** ">*,.@*( :<;. *zmr EEEEE b,l. ~2y?;2~:pFi;$;;.;;;~~~2~; ,LYI..:Y*~~s, Xbi . + L ~ I ( ~ ~ ~ P C M % X ? E ~ ~ E ~
f$~$~g#~$#jgggjy~ .. ' """." ;";*" *".$.' "y "" """""
, : .. .Ii'* * * -i*x 3 % hh. ':
,2~23*gc4g483:~32~~zA;7 :pgfa$ :bi$~z+8gt~~scg~$~ ,..
5 $ E < r ~ ~ ~ ~ # & ~ $ ? ~ # ~ j ~ ~ X . . ~ . < C " ~ *Y:-ii
; E 3 s ~ ~ F ~ ~ j $ p ~ k G ~ g k F ~ 7 - ~ ;:r-sfi:a&&p"*-' -@;I,>@@
Total
. . . . . . . . . . . . . . . . . . .:..:.:'... . . . . . : . . . . . . .
# of Cows 1700 250
0 0
' 0
o Feedlot
0 1950
.!: ....... .,.: .......... >.
Manure (, bs-hd-yr)
377 ,2 377,2
5.4 ' . 5.4
5.4
5.4
6.2 ,
................... * ....,........... ... ,:* .......,..a . . . . ,... ̂̂ ..,;̂ ....., ....- " ...... ,; ..,,<, . ,?,.,: ",r: 7!,>r: ;<.".,? - { ,,., ,: .,,?%, 2 ~ j ~ . ~ , x ~ , ~ ~ j , ~ j:cjfi:.: : ~ . ~ . . ~ : : ~ t ~ ~
2;; :;,;y&&; ,(@.(+(j:i&F;~ , ..; .......,.., ................. ,,, ,,. ,;- ,.,, - <,.. ....... Olc.. . ", *. *: Pi;; ,.. ,;i..:~97 . . . ...: : ,..: , .. ,,: .., :,,:;::?:,; .......
,< , , :. , ' , , ;,>:>. ; 5 ; , , . . , . . . . . . .! _ , , . ; , , . " , . . . . . . . . . . . . . . . . .l,, .- , . . . . . . . . . . . . . . ...... . ....;... ; . . . ,,, ......... , .. ';. ' , ..< ,... :. ... <. ,:,* . . . . . ';" .,:: . . . . . . . . . . , .,- " . . . . . . . . . . . A
,a'r ;,,, ,,,,, *.52 ... . :,', ,:-+: ..... .- ...s.. .".>.\.
.... : . ,r - b ~ ? : ... , . . . . . . . . . . . .: ., -. , ;... :: ;!bb;, ::, >$?,..$ ", 3
.A ;!,$$$,yy; :>L<?x>.. <y;i,<, .."> ,-+> ,.;,.*; ,,,;,: ......
,<:,. ::<;; cz,.>4: .u." .. ...r..,,-..; %',:,: . . '.""' ~F~~2;:..:i~,;G;~3~b/;~:~:c~;,~~,~~~~!i: :..: ... *nrrt.a~c P ,,,,,. s.;: .gk~.I. .+L:~ES
g$g~~p$~g?$~~~~~;~j;gj ...... ,i.$*;x '.. .'... ',. <'.;p.i; $ @ , .... " . ~ ~ s v G k r 7 c + i ~ + x a ..,en: tib ,*: ,,v,. ':;::I:: ~ ~ i 3 ~ ~ i ~ , ~ ~ ~ 2 ~ ~ ~ ~ ~ y ~ .,i.:.g, ; , : : : . . ; \,.:.
l,53jjr,32G~&5i-::m ....? a+. ,~-,.;, ,.r~":c ;, +;; . F63;Ry.~~@@~c<~~@& , , I . G t i . ~ = :
. .

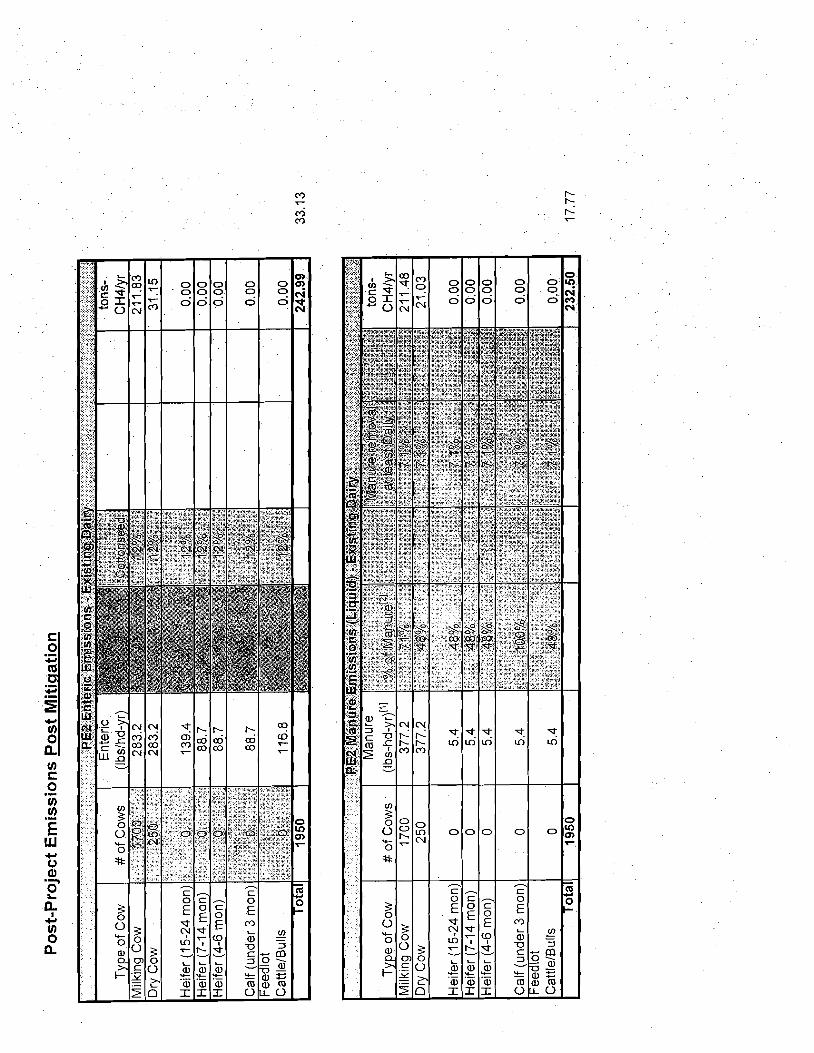

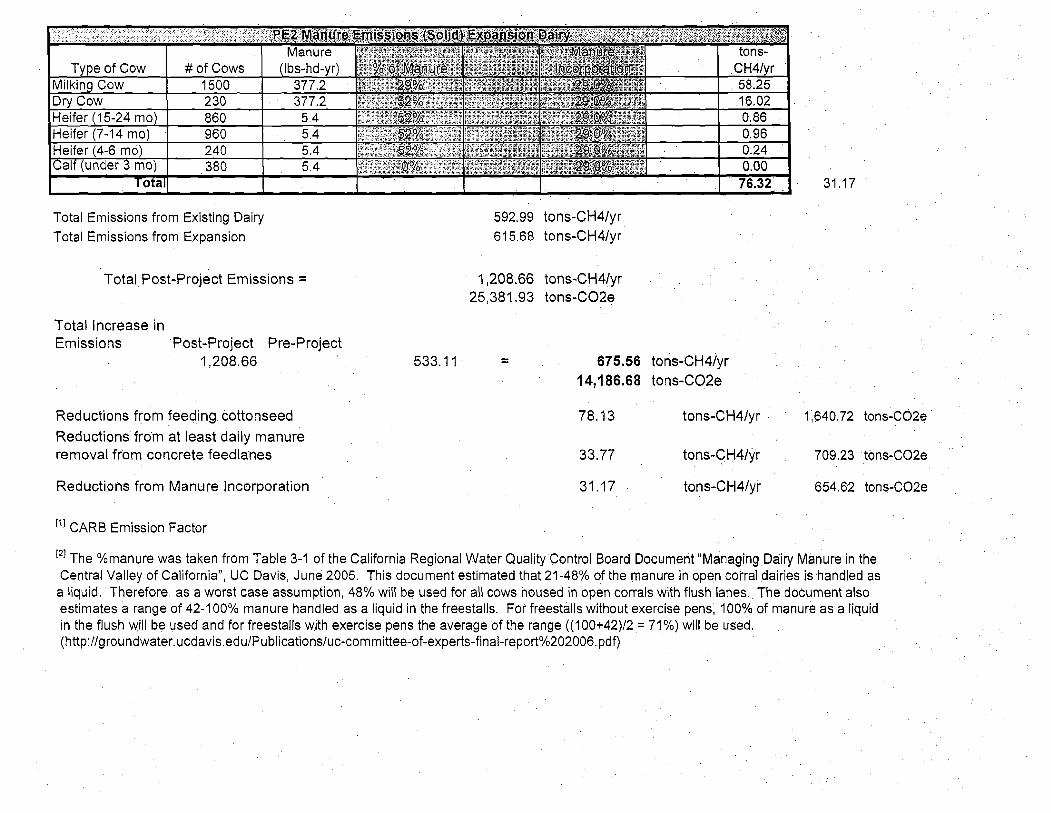
Total Emissions from Existing Dairy Total Emissions from Expansion
Total Post-Project Emissions = 1,208.66 tons-CH4Iyr 25,381.93 tons-C02e
Total Increase in Emissions Post-Project Pre-Project
1,208.66 533.1 1 - 675.56 tons-CH4Iyr - 14,186.68 tons-C02e
Reductions from feeding cottonseed
Reductions from at least daily manure removal from concrete feedlanes
Reductions from Manure Incorporation 31.17 tons-CH41yr 654.62 tons-C02e
['I CARB Emission Factor
The %manure was taken from Table 3-1 of the California Regional Water Quality Control Board Document "Managing Dairy Manure in the Central Valley of California", UC Davis, June 2005. This document estimated that 21-48% of the manure in open corral dairies is handled as
a liquid. Therefore, as a worst case assumption, 48% will be used for all cows housed in open corrals with flush lanes. The document also estimates a range of 42-1 00% manure handled as a liquid in the freestalls. For freestalls without exercise pens, 100% of manure as a liquid in the flush will be used and for freestalls with exercise pens the average of the range ((1Q0+42)/2 = 71 %) will be used. (http://groundwater.ucdavis.edu/Publications/uc-committee-of-experts-final-report0/0202006.pdf)

N20 Emissions Calculations
Pre-Proiect Potential to Emit.
Total Pre-Project Emission! - tons-N20lyr - tons-C02 Equivalent
PEI Emissions from Existing Dairy
Post-Proiect Potential to Emit (PE2)
Type of Cow Milking Cow Dry Cow if^^ 1 5-24 mo Heifer (7-1 4 m 0) Heifer 4-8 mo Calf (under 3 mo) Total
EF (Ibs-hd-yr) 0.534 0.534
3.2 3.2 3.2 3.2
# of Cows g?;:;2z;;~$;@si::; :;@%:; , . : . , , . , ,
..~x.,>. ,.>" .-,. ,*, ,e>"<c.< ..: -.-.. xz ,.,<
g ~ : i f ~ ~ : ~ i 2 B : ~ : : " ~ v c * i B g ~ : E I : . , . . 14
j:':-i.:$$%g@fi;:iai; , . ' .... :.&.,. .<.A4,..k* ., :.. .,.a,,%,
'**'*-"'%o; .> ..:. s: *..,I ' ,
; ~ ~ ~ ~ ~ ; ; $ ~ ~ , 9 ; , ~ ~ ; i & $ ~ ; *.. . , . y , . . , . , . $+T,".7+: .:-- , 'a'. ' ,. ' : >..<: ,., ..,. :, o ' ~ : ...... , v x , .,,. "@~+,??.::,w8,: ,v,. <:-; ,.:s>;:!::;.; ~ s < : ~ y ~ ~ : ~ ; : , , : : : : ; : , ... .<>; cly,:: RO:".+ ";;::'";'
..:YXv...<".~
~ , ~ ~ ; . : : : ; : ~ y + ; ~ ; !dTy;-.:,::;;;:;~?:
o
PE2 Emissions from Existing Dairy
tons-N201yr 0.0 0.0 : 0.0 0.0 0.0 0.0 0.00
Type of Cow Milking Cow Dry Cow Heifer (1 5-24 mo) Heifer (7-14 mo) Heifer (4-6 mo) Calf (under 3 mo)
Total
# of Cows 0 0 0 0 0 0 0
Enteric (Ibslhd- Y r)
0.534 0.534
3.2 3.2 3.2 3.2
tons- N20lyr
0.0 0.0 0.0 0.0 0.0 0.0
0.00
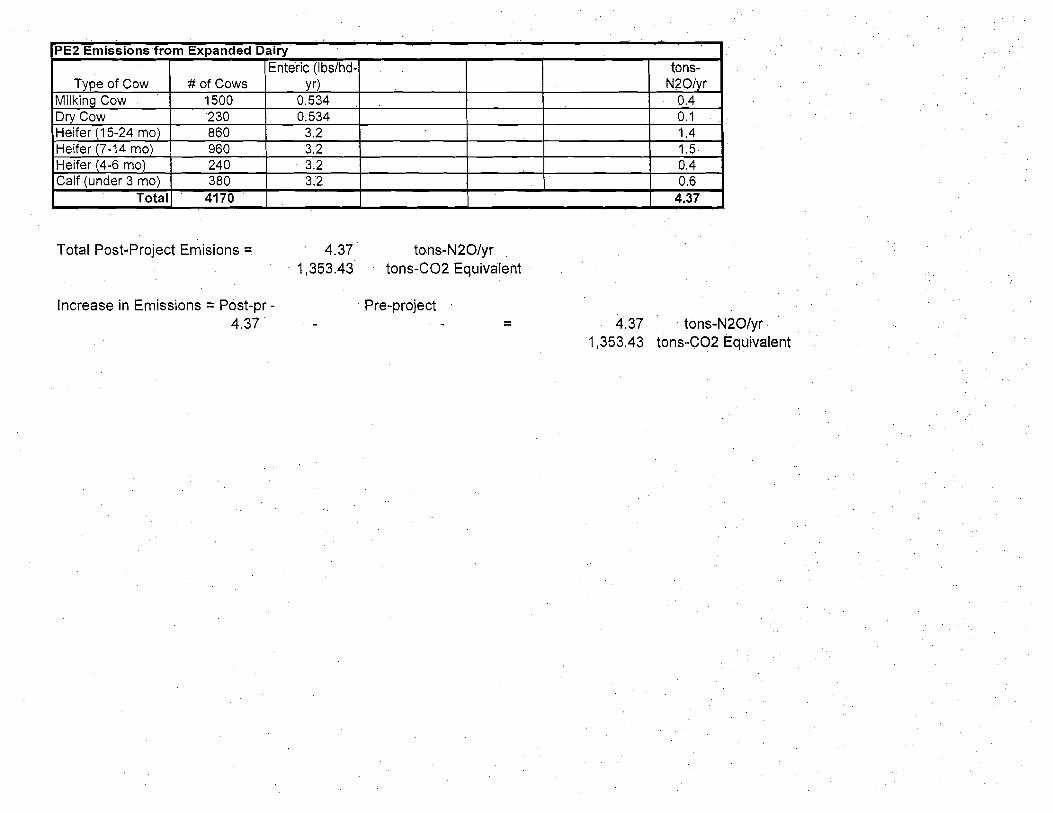
Total Post-Project Emisions =,
PE2 Emissions from Expanded Dairy
4.37 tons-N20/yr 1,353.43 tons-C02 Equivalent
Type of Cow Milking Cow Dry Cow Heifer (1 5-24 mo) Heifer (7-14 mo) Heifer (4-6 mo) Calf (under 3 mo)
Total
Increase in Emissions = Post-pr - 4.37 4.37 tons-N20/yr
1,353.43 tons-C02 Equivalent
# of Cows 1500 230 860 960 24 0 380
41 70
Enteric (I bslhd- Y r)
0.534 0.534
3.2 3.2 3.2 3.2
tons- N20lyr
0.4 0.1 1.4 1.5 0.4 0.6
4.37

Appendix C
Proposed Greenhouse Gas Threshold

Proposed Significance Threshold for Greenhouse Gases
Introduction: Federal and state laws reauire emission control measures in areas where air ~ollution exceeds ambient air standards. The San Joaquin Valley is one of these arkas. The S m Joaquin Valley Unified Air District (District) consists of the following eight counties: San Joaquin, Stanislaus, Merced, Madera, Fresno, Kings, Tulare, and the Valley portion of Kern. The District's primary focus is taking action to improve the health and quality of life of people living in the Valley, while striving to meet health based state and federal ambient air quality standards. This is achieved through adopting and implementing cost-effective air pollution control measures, providing meaningful incentives for reducing emissions, and by developing creative alternatives for achieving emissions reductions. The District's statutory authority and strategies focus on reducing Criteria Pollutants to meet federal and state standards, and regulating stationary source emissions. Recent concerns over global warming have created a greater interest in greenhouse gases (GHG) and their contribution to global climate change (GCC). However, at this time there are no generally accepted thresholds of significance for determining the impact of GHG emissions from an individual project on GCC. Thus, permitting agencies are in the position of developing policy and guidance to ascertain and mitigate to the extent feasible the effects of GHG, without the normal degree of accepted guidance and case law.
GHG Emissions and CEOA The California Environmental Quality Act (CEQA) requires that public agencies refrain from approving projects with significant adverse environmental impact if there are feasible alternatives or mitigation measures than can substantially reduce or avoid those impacts. With growing concerns about global impacts of GHG emissions, public agencies with California are looking for guidance on how to adequately address the potential climate change impacts in meeting their CEQA obligations. Regulation of GHG emissions from all sources is under the purview of Califomia Air Resources Board (CARB) and as such may be eventually regulated, no matter how small the source. However, a decision by CARB to regulate a class of sources does not necessarily mean that an individual source of emissions within that class would constitute a project with significant GHG impacts under CEQA.
Threshold Options: The Califomia Air Pollution Control Officers Association (CAPCOA) vrevared a white paper on GHG emissions, titled CEQA and Climatic change. ~ i t h i h the document, CAPCOA reviews GHG policy choices, analytical tools, and mitigation strategies. CAPCOA also discusses the following three options for assessing significance of GHG emissions: establish no significance threshold, establish a zero threshold, and establish a non-zero threshold. A lack of any applicable significance thresholds for GHGs is not an acceptable option. Project proponents are then left wondering whether their specific project will be considered significant when it arrives at an agency's office for review, and proponents and agencies will be subject to the vagaries and pressures of individual significance decisions with each permit application. A "zero" threshold would result in most, if not all, proposed projects to be considered "significant", thus triggering CEQA review of even the most mundane and limited of projects. For instance, adding a parking space to a parking lot of a retail sales establishment would encourage additional visits to the store, increasing C02 emissions for the area marginally. Subjecting this to CEQA as a significant adverse environmental

impact is patently wrong, has no environmental benefit, and certainly creates impediments to commerce that the authors of CEQA never envisioned. In fact, CEQA regulations contain a multitude of exemptions that reflect the authors' vision that minor projects should be treated as such, and not be subjected to the onerous and time consuming requirements of CEQA. On the other hand, there is an equal case to be made that CEQA's authors envisioned that projects with potentially significant environmental impact should be fully analyzed, and those significant affects should be mitigated to the extent feasible. Therefore, after considering the merits of each approach, the District concludes that establishing a non-zero threshold of significance for GHG emissions best serves the needs of the residents of the San Joaquin Valley air basin by providing project proponents, the public, and local agencies a useful tool to be used in efforts to evaluate and address potential environmental impacts associated with GHG emissions.
Im~lementing a GHG Non-zero Significance Threshold: Air Districts have the primary authority to regulate global warming pollutants from non- vehicular sources. Although California AB 32 gives wide responsibility to CARB to regulate GHG emissions from all sources, including non-vehicular sources, it does not preempt the air districts. Under state law, it is the purview of each lead agency to determine what, if any, significance thresholds will be established to guide its review of projects under CEQA. The state CEQA guidelines have left the decision of whether to establish thresholds, and if so, at what level, to individual lead agencies. Traditionally, the District has provided local lead agencies technical guidance for assessing a project's potential impact on air quality, including establishment of significance thresholds for criteria pollutants. By establishing a GHG significance level for its own use, the District is hopeful that other agencies will accede to its usefulness, and implement it uniformly throughout, at least, the San Joaquin Valley, thus providing uniform and consistent consideration of GHG significance.
Establishing a Non-zero GHG Significance Threshold: In CEQA and Climate Change, CAPCOA evaluates several conceptual approaches for developing GHG significance thresholds. The District, after dutiful consideration of the various conceptual approaches presented by CAPCOA, concludes that establishing GHG significance thresholds is fundamentally analogous to establishing significance thresholds for criteria pollutants. As noted by CAPCOA, most California air districts have developed CEQA significance thresholds for NOx and ROG emissions to try to reduce emissions of ozone precursors from proposed sources that are not subject to New Source Review (NSR) pre-construction air quality permitting. The historical management of ozone nonattainment issues is somewhat analogous to today's concerns with greenhouse gas emissions in that regional ozone concentrations are a cumulative air quality problem caused by relatively small amounts of NOx and ROG emissions from thousands of individual sources, few of which emit enough by themselves to cause elevated ozone concentrations. Those same conditions apply to global climate change where the environmental problem is caused by emissions from a countless number of individual sources, none of which is large enough by itself to cause the problem. As presented in CAPCOA's CEQA and Climate Change, the steps each agency would follow in developing their GHG emissions significance threshold based on the NOxROG analogy ("Regulated Emissions Inventory Capture" methodology) are as follows:
Define regional NOx/ROG CEQA thresholds Define the regional NOxROG emission inventory the agency is trying to regulate with its NOxROG thresholds Calculate the percentage of the total emissions inventory for NOx represented by the agency's CEQA significance thresholds. That value represents the "minimum
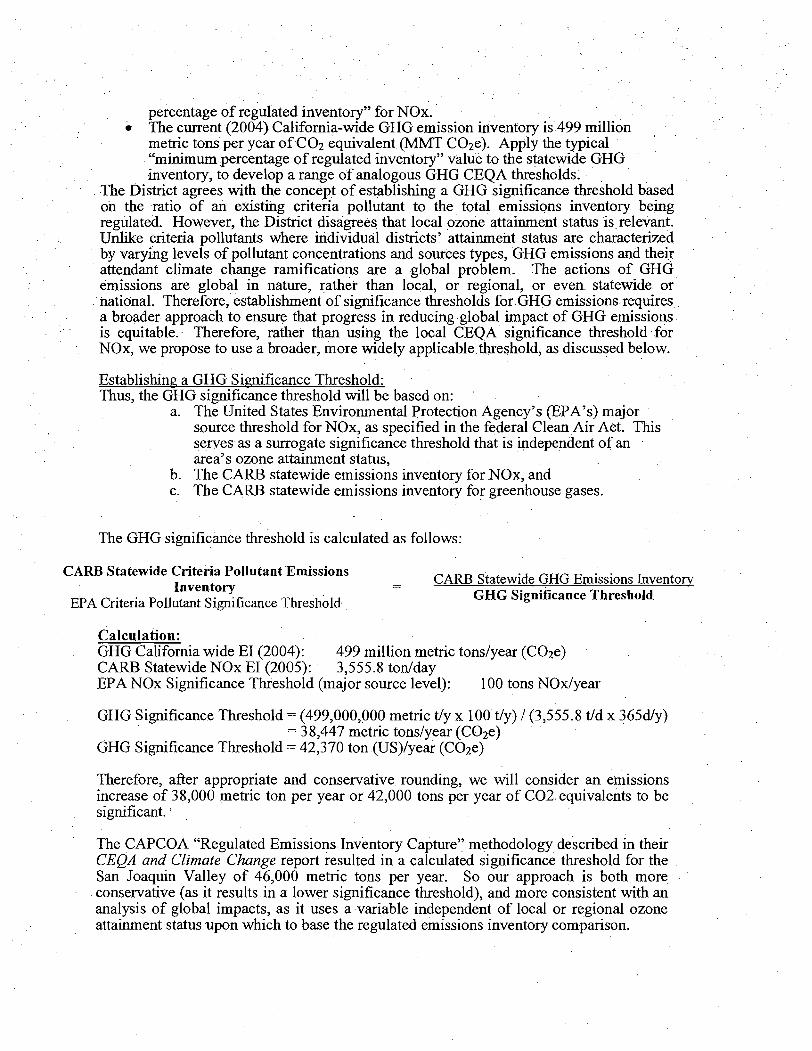
percentage of regulated inventory" for NOx. The current (2004) California-wide GHG emission inventory is 499 million metric tons per year of C02 equivalent (MMT C02e). Apply the typical "minimum percentage of regulated inventory" value to the statewide GHG inventory, to develop a range of analogous GHG CEQA thresholds.
The District agrees with the concept of establishing a GHG significance threshold based on the ratio of an existing criteria pollutant to the total emissions inventory being regulated. However, the District disagrees that local ozone attainment status is relevant. Unlike criteria pollutants where individual districts' attainment status are characterized by varying levels of pollutant concentrations and sources types, GHG emissions and their attendant climate change ramifications are a global problem. The actions of GHG emissions are global in nature, rather than local, or regional, or even statewide or national. Therefore, establishment of significance thresholds for GHG emissions requires a broader approach to ensure that progress in reducing global impact of GHG emissions is equitable. Therefore, rather than using the local CEQA significance threshold for NOx, we propose to use a broader, more widely applicable threshold, as discussed below.
Establishing a GHG Significance Threshold: Thus, the GHG significance threshold will be based on:
a. The United States Environmental Protection Agency's (EPA7s) major source threshold for NOx, as specified in the federal Clean Air Act. This serves as a surrogate significance threshold that is independent of an area's ozone attainment status,
b. The CARE3 statewide emissions inventory for NOx, and c. The CARE3 statewide emissions inventory for greenhouse gases.
The GHG significance threshold is calculated as follows:
CARB Statewide Criteria Pollutant Emissions Inventory - - CARB Statewide GHG Emissions Inventorv
EPA Criteria Pollutant Significance Threshold GHG Significance Threshold
Calculation: GHG California wide EI (2004): 499 million metric tonslvear (CO7e) , - /
CARE3 Statewide NOx E I (2005): 3,555.8 tonlday EPA NOx Significance Threshold (major source level): 100 tons Nodyear
GHG Significance Threshold = (499,000,000 metric t/y x 100 tly) /(3,555.8 t/d x 365dIy) = 3 8,447 metric tonslyear (C02e)
GHG Significance Threshold = 42,370 ton (US)/year (C02e)
Therefore, after appropriate and conservative rounding, we will consider an emissions increase of 38,000 metric ton per year or 42,000 tons per year of C02 equivalents to be significant.
The CAPCOA "Regulated Emissions Inventory Capture" methodology described in their CEQA and Climate Change report resulted in a calculated significance threshold for the San Joaquin Valley of 46,000 metric tons per year. So our approach is both more conservative (as it results in a lower significance threshold), and more consistent with an analysis of global impacts, as it uses a variable independent of local or regional ozone attainment status upon which to base the regulated emissions inventory comparison.


